hypertension prevalence estimates in england, 2017
TRANSCRIPT
Hypertension prevalence estimates in England, 2017 Estimated from the Health Survey for England

Hypertension prevalence estimates in England, 2017
1
About Public Health England
Public Health England exists to protect and improve the nation’s health and wellbeing
and reduce health inequalities. We do this through world-leading science, research,
knowledge and intelligence, advocacy, partnerships and the delivery of specialist public
health services. We are an executive agency of the Department of Health and Social
Care, and a distinct delivery organisation with operational autonomy. We provide
government, local government, the NHS, Parliament, industry and the public with
evidence-based professional, scientific and delivery expertise and support.
Public Health England
Wellington House
133-155 Waterloo Road
London SE1 8UG
Tel: 020 7654 8000
www.gov.uk/phe
Twitter: @PHE_uk
Facebook: www.facebook.com/PublicHealthEngland
Prepared by: Andrew Hughes
For queries and further information relating to this document, please contact:
© Crown copyright 2020
You may re-use this information (excluding logos) free of charge in any format or
medium, under the terms of the Open Government Licence v3.0. To view this
licence, visit OGL. Where we have identified any third party copyright information
you will need to obtain permission from the copyright holders concerned.
Published March 2020
PHE publications PHE supports the UN
gateway number: GW-1181 Sustainable Development Goals

Hypertension prevalence estimates in England, 2017
2
Contents
Main findings and background 3
Overview of hypertension prevalence 4
GP practice hypertension prevalence 5
CCG hypertension prevalence 6
Comparison against Quality and Outcomes Framework registers 8
Summary of method used 10

Hypertension prevalence estimates in England, 2017
3
Main findings and background
Main findings
It is estimated that 11.8 million adults aged 16 years or older in England had
hypertension in 2017. This is equal to approximately 26.2% of the adult population.
At CCG level, estimated hypertension prevalence ranges from 16% to 33.8%. At
GP practice level, hypertension ranges between 18.8% and 31%, excluding the
highest and lowest 10% of practices.
Estimated hypertension prevalence is highest in CCGs in the East and South East
of England, and is also high in the North of England, coastal areas, and in areas
with older populations.
Comparisons of the prevalence estimates and the 2016/17 Quality and Outcomes
Framework (QOF) suggest that approximately 68% of the estimated number of
people with hypertension are recorded on GP QOF hypertension registers.
Background
Hypertension is a major risk factor for heart disease, stroke, and kidney disease
and is a public health priority for the wider public health system. Hypertension is
mainly detected and managed in general practice. It generally has no symptoms,
but early diagnosis and effective management can prevent progression to
cardiovascular disease.
Hypertension prevalence estimates have been created for areas in England based
on Health Survey for England data from 2016 and 2017.
The definition of hypertension for these estimates is: “adults with self-reported drug
treatment for high blood pressure and adults with recorded high blood pressure
and no prescribed medication”. This is the same as the definition used by the Adult
Health report from the Health Survey for England, 2017: files.digital.nhs.uk
Estimates have been created for general practitioner (GP) practices, clinical
commissioning groups (CCGs) and local authorities in England. Results for GP
practices and CCGs are presented here.
Hypertension prevalence estimates in England, 2017
4
Overview of hypertension prevalence
High quality information on national levels of hypertension is collected via the
Health Survey for England, as adult participants’ blood pressure is measured in
their homes by a qualified nurse. The sample size of the survey is too small to
provide hypertension figures for local authorities and CCGs, but the national data
can be used to create synthetic estimates for these areas.
These prevalence estimates are synthetic, which means they are based not on real
measurements of blood pressure in local areas, but on the national risk of
hypertension in England applied to local areas. In some areas where local risk
factors are very different from the national profile, they may under or over-estimate
hypertension.
The England prevalence by age, sex and self-assessed health status was applied
to synthetic local area populations to estimate the overall crude prevalence in the
local areas. Hypertension prevalence increases with age and poor health. Areas
with an older age structure or those with a poorer self-assessed health status are
likely to have a higher prevalence of hypertension.
Full details of the method and data sources used can be found in the ‘Technical
document’ available from the ‘National Cardiovascular Intelligence Network’
(NCVIN). Please email [email protected]
All estimates are available to download at: www.gov.uk/guidance/cardiovascular-
disease-data-and-analysis-a-guide-for-health-professionals

Hypertension prevalence estimates in England, 2017
5
GP practice hypertension prevalence
The estimated prevalence of hypertension in GP practices ranges from 2.2% to
59.3%, though the practices with the extreme highest and lowest estimates often
have either very young or old patient groups. For example, the practice with 59.3%
hypertension serves care home residents in a CCG, so all its patients are at very
high risk of hypertension. When we remove the highest and lowest 10% of
practices, the range of hypertension is between 18.8% and 31% of patients. Figure
1 shows the range of estimated hypertension prevalence in the 7,384 practices
with list sizes of more than 750 patients.
Figure 1. Estimated hypertension prevalence by GP practice in England, 2017
Source: PHE analysis of data from the Health Survey for England, ONS 2011 Census, NHS Digital practice list sizes
Hypertension prevalence estimates in England, 2017
6
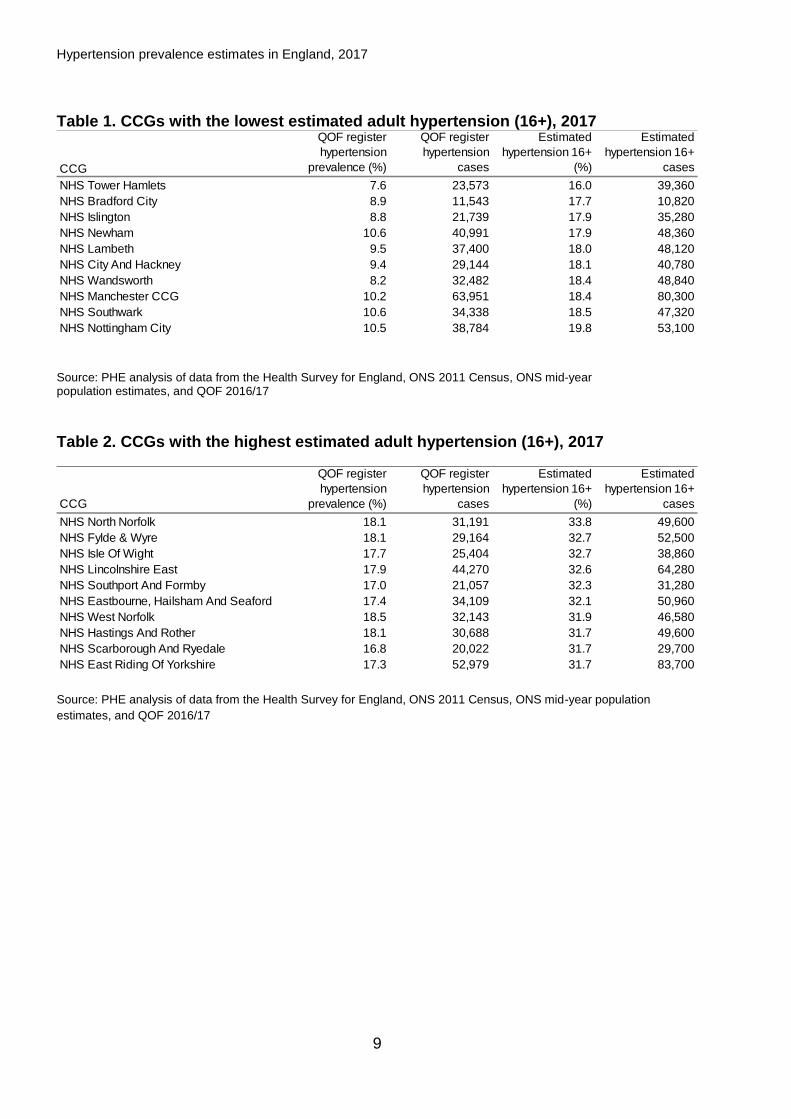
CCG hypertension prevalence
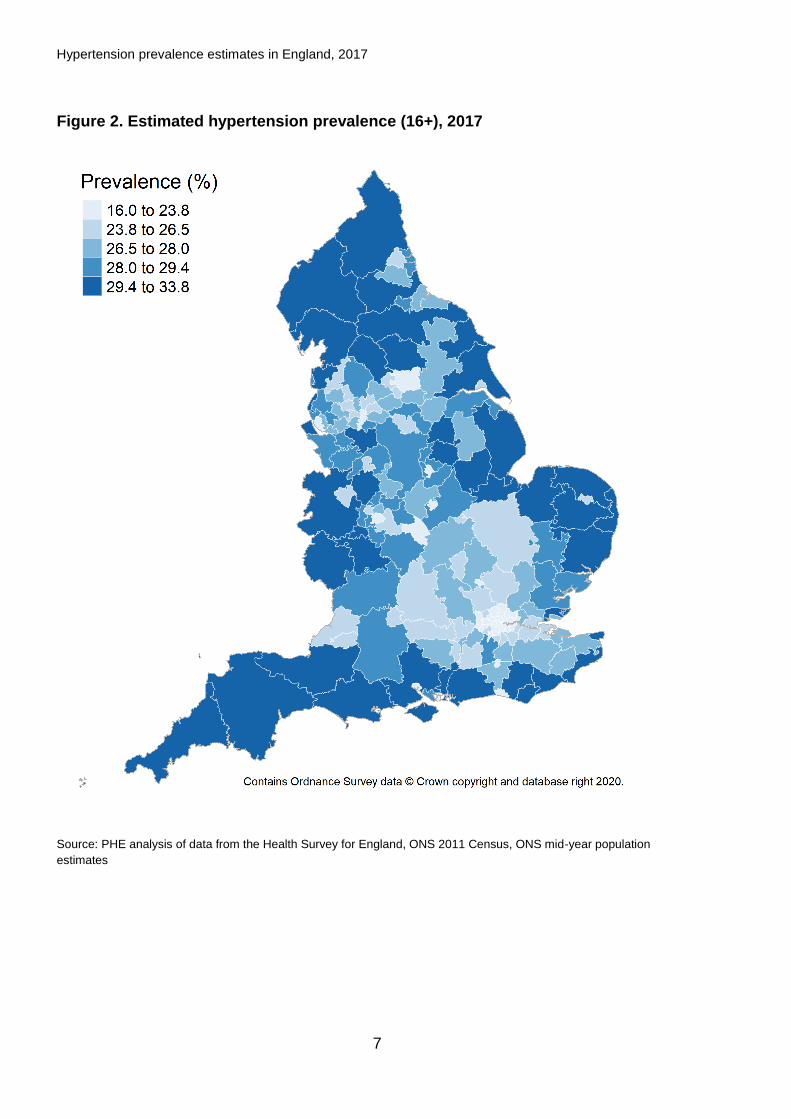
Hypertension prevalence ranges from 16% to 33.8% in the 191 CCGs in England.
CCGs with the lowest prevalence of hypertension were Tower Hamlets, Bradford
City and Islington (Table 1). CCGs with the highest estimated prevalence were
North Norfolk, Fylde & Wyre and Lincolnshire East in the East of England, and Isle
of Wight (Table 2) in the South East of England.
Figure 2 shows the range of hypertension prevalence in CCGs by grouping the
CCG values into 5 equal sized groups, or quintiles. The CCGs in the highest
quintiles are mainly situated in the north and along the southern and eastern
coastal regions, and lowest quintiles in London and central England.
Hypertension prevalence is driven largely by the age structure of the population
and hypertension is highest in the CCGs which have high proportions of elderly
people.
However, other factors such as general health status contribute towards higher
levels of hypertension in the population.
Hypertension prevalence estimates in England, 2017
7
Figure 2. Estimated hypertension prevalence (16+), 2017
Source: PHE analysis of data from the Health Survey for England, ONS 2011 Census, ONS mid-year population
estimates

Hypertension prevalence estimates in England, 2017
8
Comparison against Quality and
Outcomes Framework registers
The Quality and Outcomes Framework (QOF) is a voluntary annual reward and
incentive programme for all GP practices in England. It includes the collection of
certain disease and condition registers in patients, including hypertension. The
register is a measure of the prevalence of hypertension in patients that has been
recorded by the GP. Comparing the hypertension prevalence estimates and the
2016/17 QOF hypertension register provides an estimate of the number of people
with high blood pressure who are not recorded by their GP on a hypertension
register.
Making this comparison is difficult, however, for 2 reasons. Firstly, the hypertension
prevalence estimates only include adults aged 16 years and older, whilst the QOF
hypertension register includes adults and children. Secondly, the QOF shows
patients registered in practices within a CCG, whilst the hypertension prevalence
estimates are based on people living in a CCG area. In some cases, these 2
populations are very different, for example Bradford City CCG in Table 1 has a
much larger registered patient population than the estimated population resident in
the CCG area, so the number of cases from the 2 sources are not comparable.
The hypertension QOF register in England recorded just over 8 million (13.8%)
people with hypertension in the population in 2016/17. Comparisons of these new
prevalence estimates with the 2016/17 QOF hypertension register suggests that
only approximately 68% of the estimated number of people with hypertension are
recorded on GP QOF hypertension registers. This assumes that children aged 15
or less with hypertension are not included in either QOF registers or prevalence
estimates.
Hypertension prevalence estimates in England, 2017
9
Table 1. CCGs with the lowest estimated adult hypertension (16+), 2017
Source: PHE analysis of data from the Health Survey for England, ONS 2011 Census, ONS mid-year population estimates, and QOF 2016/17
Table 2. CCGs with the highest estimated adult hypertension (16+), 2017
Source: PHE analysis of data from the Health Survey for England, ONS 2011 Census, ONS mid-year population
estimates, and QOF 2016/17
CCG
QOF register
hypertension
prevalence (%)
QOF register
hypertension
cases
Estimated
hypertension 16+
(%)
Estimated
hypertension 16+
cases
NHS Tower Hamlets 7.6 23,573 16.0 39,360
NHS Bradford City 8.9 11,543 17.7 10,820
NHS Islington 8.8 21,739 17.9 35,280
NHS Newham 10.6 40,991 17.9 48,360
NHS Lambeth 9.5 37,400 18.0 48,120
NHS City And Hackney 9.4 29,144 18.1 40,780
NHS Wandsworth 8.2 32,482 18.4 48,840
NHS Manchester CCG 10.2 63,951 18.4 80,300
NHS Southwark 10.6 34,338 18.5 47,320
NHS Nottingham City 10.5 38,784 19.8 53,100
CCG
QOF register
hypertension
prevalence (%)
QOF register
hypertension
cases
Estimated
hypertension 16+
(%)
Estimated
hypertension 16+
cases
NHS North Norfolk 18.1 31,191 33.8 49,600
NHS Fylde & Wyre 18.1 29,164 32.7 52,500
NHS Isle Of Wight 17.7 25,404 32.7 38,860
NHS Lincolnshire East 17.9 44,270 32.6 64,280
NHS Southport And Formby 17.0 21,057 32.3 31,280
NHS Eastbourne, Hailsham And Seaford 17.4 34,109 32.1 50,960
NHS West Norfolk 18.5 32,143 31.9 46,580
NHS Hastings And Rother 18.1 30,688 31.7 49,600
NHS Scarborough And Ryedale 16.8 20,022 31.7 29,700
NHS East Riding Of Yorkshire 17.3 52,979 31.7 83,700
Hypertension prevalence estimates in England, 2017
10
Summary of method used
These hypertension prevalence estimates use the same definition provided by the
Adult Health report from the Health Survey for England (HSE), 20171. This is
defined as either adults with self-reported blood pressure drug treatment, or adults
with a recorded blood pressure higher than 140/90 mmHg and no prescribed blood
pressure medication. In the Health Survey for England these data are collected in a
nurse-led interview of adult survey respondents. This definition is not a clinical
diagnosis of hypertension as outlined by the NICE hypertension guideline2 and
implemented by general practice in England.
The estimates were constructed in 3 stages. The first stage was creating a
regression model, which quantified the statistical relationship between individual
level risk factor predictors and whether a person had hypertension, based on the
definition highlighted above. Data on the respondents who attended the nurse
interview in the Health Survey for England for 2016 and 2017 were used to create
the model. Age-group, sex and general health status of the survey respondents
were included as predictors. Ethnicity and deprivation were also tested as
predictors, but neither were strong enough to use in the final model.
The second stage was to create synthetic populations for GP practices, CCGs and
local authorities. These populations were broken down by the same group of
predictors that the model included, which were age, sex and general health status.
The sources used for these populations included practice list sizes from NHS
Digital, mid-year population estimates from the Office for National Statistics, and
2011 Census data on general health status.
The third stage was to take the final model outputs, referred to as odds-ratios, for
each age-group, sex and general health status predictor and apply these to the
synthetic populations to produce the final prevalence estimate percentages for
each area.
Uncertainty intervals around the final prevalence estimates were also created for
CCGs and local authorities. These intervals provide a range of prevalence for each
area in which there is a 95% chance of having a true prevalence between the
upper and lower interval.
1 Ng Fat, L. (2018). Health Survey for England 2017: Adult health. NHS Digital. Accessed 5 Feb 2020 here:
https://files.digital.nhs.uk/75/9C8B99/HSE17-Adult-health-rep-v2.pdf 2 National Institute for Health and Care Excellence. 2019. NICE guideline NG136: Hypertension in adults: diagnosis and
management. Accessed 5 Feb 2020 here: www.nice.org.uk/guidance/ng136

Hypertension prevalence estimates in England, 2017
11
These prevalence estimates are synthetic, which means they are not based on real
measurements of hypertension in local areas. They represent the risk profile for
hypertension in England applied to local populations. In some areas where those
risk factors are very different from the national profile they may under or over-
estimate hypertension.
Full details of the method and data sources used can be found in the ‘Technical
document’ available from the ‘National Cardiovascular Intelligence Network’
(NCVIN). Please email [email protected]