hydrology: current research
TRANSCRIPT
Assessment of Water Quality in Slum Area IbadanAdedayo Adeniran*
University of Ibdan, Ibadan, Oyo State, Nigeria*Corresponding author: Adedayo Adeniran, University of Ibdan, Ibdan, Oyo State, Nigeria, Tel: +2349082726058; E-mail: [email protected]
Received date: January 17, 2018; Accepted date: March 26, 2018; Published date: March 31, 2018
Copyright: © 2018 Adeniran A. This is an open-access article distributed under the terms of the Creative Commons Attribution License, which permits unrestricted use,distribution, and reproduction in any medium, provided the original author and source are credited.
Abstract
The quantity of water is as important as the quality, since these affect the quantity and the quality of availablewater, water quality is used to express the suitability of water and sustainable to various uses or processes. It isaffected by a wide range of natural and human influences, the most important of the natural influences ishydrological influence. The water qualities study was carried out in Ibadan using three landuse (urban, peri urbanand rural) in slum areas of Ibadan were evaluated for these physicochemical parameters: temperature, totaldissolved solid (TDS), pH, and dissolved oxygen (DO), from well, borehole, water from vendor or pipeborne, from 8localities and 3 LGA in Ibadan. The results showed variations in the water quality parameters the slum areas. WaterpH is lowest in Awotan and Apete of Ido LGA water source which makeup rural slums landuse. with water pH of 5.7well and 5.8 borehole which is acidic, there is highest value of conc of Lead in these areas of (0.259 mg/l) comparedto other landuse and locality, water is of best quality among water from vendors. Using the sig value of 0.05, that isno sig difference between the water quality in slum areas and WHO standards. Using Anova with physico-chemicalparameters of water temperature, pH, dissolved oxygen, total dissolved solids, conc of zinc, and iron also having nosignificant. But a significant spatial variation of water quality of Lead concentration with the sig value of 0.033 and Fvalue of 2.983. There is significant variation in different water source of water pH, total dissolved solid and dissolvedoxygen. a sig value of 0.028, 0.031, and 0.000 respectively.
Keywords: Water quality; WHO standards; Physico-chemicalparameters
Introduction
Background to the studySlums have been conceptualized as a group of buildings or an area
characterized by overcrowding, deterioration, insanitary conditions, orabsence of basic and essential facilities like potable water, drainagesystem, schools, health facilities, recreational grounds, post office,among others [1].
Slums generate spontaneously and are in some cases, a direct resultof the prevalence of poverty experienced by the inhabitants of cities.Slums, which are regarded as an element of urban decay, also resultfrom congestion in overcrowded cities where poor immigrants seek tosettle for just any available accommodation irrespective of quality.
In 2012, UN-Habitat stated that around 33% of the urbanpopulation in the developing world, or about 863 million people, livedin slums. The proportion of urban population living in slums washighest in Sub-Saharan Africa (61.7%), followed by South Asia (35%),Southeast Asia (31%), East Asia (28.2%), West Asia (24.6%), Oceania(24.1%), Latin America and the Caribbean (23.5%), and North Africa(13.3%).
Also, among individual countries, the proportion of urban residentsliving in slum areas in 2009 was highest in the Central AfricanRepublic (95.9%). Between 1990 and 2010 the percentage of peopleliving in slums dropped, even as the total urban population increased.The world's largest slum city is found in the Neza-ChalcoIxtapalucaarea, located in the State of Mexico.
The United Nation (2002) has estimated that a third of world’surban population today does not have access to adequate housing, andlack access to safe water and sanitation. These people live inovercrowded and serviced slums, often situated on marginal anddangerous land. In Lagos State, 42 of such slum areas were identified ina research carried out by the University of Lagos Consult in 1997 asthey put the figure at over 100 in 2006. Almost 70 percent of the slumsin Nigerian cities were found within a radius of 1 km from the citycentre of South West of Nigeria (with Lagos and Ibadan in particular)[2,3]. The Chairman of Ibadan South East Local Government statedthat about 60 percent of his local government area is a slum covering abig part of the southern inner city [4].
The situation is being exacerbated by two factors, almost completelack of planning or preparation for urban growth and management inmost parts of the world, and a rapid increase in both inequality andpoverty, which is compounded by policies intended to improve growth,but which have mostly not done so because they have tried to fight thekey urbanization dynamics rather than working with it. The areas arealso loaded with scarcity of electricity and water, deterioration ofhousing conditions as well as overcrowding [4].
Urban slum is of global concern according to the UN-Habitat(2001), 31.6% of the world's urban population lived in slums as farback as 2001. It is worse in developing regions, where 43% of the urbanpopulation, compared to 6% of the urban population in developedregions lived in slum. It was projected in 2001 that in the next 30 years,the number of slum dwellers worldwide will increase to 2 billion if nofirm or concrete action is taken to arrest the situation (UN-Habitat,2001). This has informed the inclusion of “Cities without Slums” target,also known as Target 11, in the Millennium Declaration adopted byMember States of the United Nations in September 2000.
Hydr
olog
y: Current Research
ISSN: 2157-7587Hydrology: Current Research
Adeniran, Hydrol Current Res 2018, 9:1DOI: 10.4172/2157-7587.1000296
Research Article Open Access
Hydrol Current Res, an open access journalISSN: 2157-7587
Volume 9 • Issue 1 • 1000296
Water is the most abundant substance found on the surface of theearth, covering roughly three quarters of the earth’s surface and it playsa very vital role in existence as well as maintenance of life of organisms,Water in its pure state is acclaimed key to health and the generalcontention is that water is more basic than all other essential things tolife [5].
Groundwater can be defined as water that occurs below the surfaceof the Earth, occupying some or all the voids and spaces in soils or anygeologic strata. It can also be called subsurface water to distinguish itfrom surface water which is found in large water bodies like theoceans, seas or lakes, or water which flows overland in streams andrivers [6].
In 2015 the World Health Organization (WHO) estimates that still2.5 billion people more than one third of the global population livewithout basic sanitation facilities, while 750 million people still lacksaccess to safe and clean drinking water. Due to poor water quality,there is lack of proper sanitation which contributes approximately700,000 child deaths every year due to diarrhoea. Chronic diarrhoeacan have a negative effect on child development both physical andcognitive.
There is standard that guard the quality of water and sanitation inan area. The most common standards used to assess water qualityrelate to health of ecosystems, safety of human contact, and drinkingwater, which is made by Environmental lawyers and policymakers.According to United States Environmental Protection Agency [7]primary standards regulate substances that potentially affect humanhealth; secondary standards prescribe aesthetic qualities affect taste,odour, or appearance (ibid).
Statement of problemRapid progress in industrialization and urbanization has resulted in
creation of more slums, with dilapidated facilities, which is prevalent inthe developing and urban area without exclusion to water facilities. Theprovision of sanitary tools and infrastructures are overwhelminglydeficient as most residents of Ibadan do not have access to a hygienictoilet. Also slum houses in the urban blighted zones lack toiletprovisions and structures, resulting in indiscriminate littering ofstreams with human faecal materials and other wastes [8].
The faecal wastes and other solid wastes are discharged to theenvironment without adequate treatment, while liquid wastes fromsewage is being released into rivers and ponds untreated. Therefore,the quality of water affected has significant impact on the spread ofinfectious disease and quality of life. This can therefore be accessedusing the biological water parameters in bacterial analysis. Thecontaminants will be identified to quantify the sanitation of the slumarea. Most slum areas are noted for lack of reliable sanitation services,supply of clean water, reliable electricity, law enforcement and otherbasic services. The major features of slum are known with poorhousing and planning systems, which can be seen in the water qualityand sanitary facility [9].
Aim and objectivesThe aim of the study is to assess water quality of slum areas in
Ibadan.
The objectives of the study are to;
1. Determine the physico-chemical properties of water fromdifferent sources within the study area.
2. Assess the level of concentration of heavy metals in the waterfrom different sources within the study area.
3. Compare the quality of water over space within the study area.4. Compare the quality of water from different water sources within
the study area.
Research hypothesisThe following research hypotheses will be tested
There is no significant variation in the quality of water in differentsource within the study areas.
There is no significant spatial variation in water quality within thestudy area.
There is no significant difference between the water quality in thisregion and WHO standards.
Justification of studyWater is an invaluable resource to man, essential for sustenance of
life. It is a basic human need to have good water quality. Traditionallyhydrology has been interested purely in the amount of water in an area:water quantity, however, an important challenge to hydrology is theavailability of water for human consumption, and domestic uses.Therefore, the research study of water quality of slum areas in Ibadan isimportant as the availability of water in slum areas of Ibadan.
Significance of studyMuch work has been done on housing, hygiene and water quantity
in slum area of Ibadan, with a little focus on water quality of theseareas. It is of importance to the health of the people as some of theheavy metals are toxic and injurious to human health. The significanceof the research is to institutions for better government policies and theresidents cannot be underrated (consisting human consumption anddomestic use). The study will benefit the county government andimprove its rating among the residents since water service provisionand supply is one of their functions.
Study areaThe study area is in Ibadan metropolis which comprises of five local
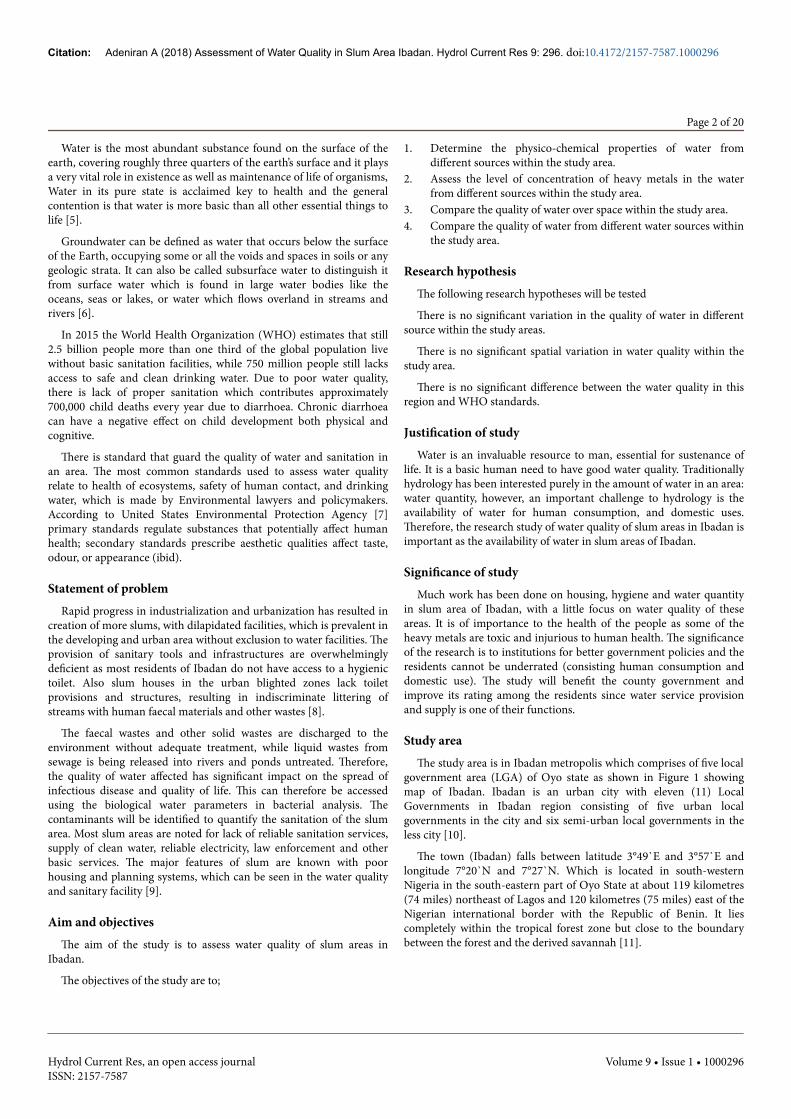
government area (LGA) of Oyo state as shown in Figure 1 showingmap of Ibadan. Ibadan is an urban city with eleven (11) LocalGovernments in Ibadan region consisting of five urban localgovernments in the city and six semi-urban local governments in theless city [10].
The town (Ibadan) falls between latitude 3°49`E and 3°57`E andlongitude 7°20`N and 7°27`N. Which is located in south-westernNigeria in the south-eastern part of Oyo State at about 119 kilometres(74 miles) northeast of Lagos and 120 kilometres (75 miles) east of theNigerian international border with the Republic of Benin. It liescompletely within the tropical forest zone but close to the boundarybetween the forest and the derived savannah [11].
Citation: Adeniran A (2018) Assessment of Water Quality in Slum Area Ibadan. Hydrol Current Res 9: 296. doi:10.4172/2157-7587.1000296
Page 2 of 20
Hydrol Current Res, an open access journalISSN: 2157-7587
Volume 9 • Issue 1 • 1000296
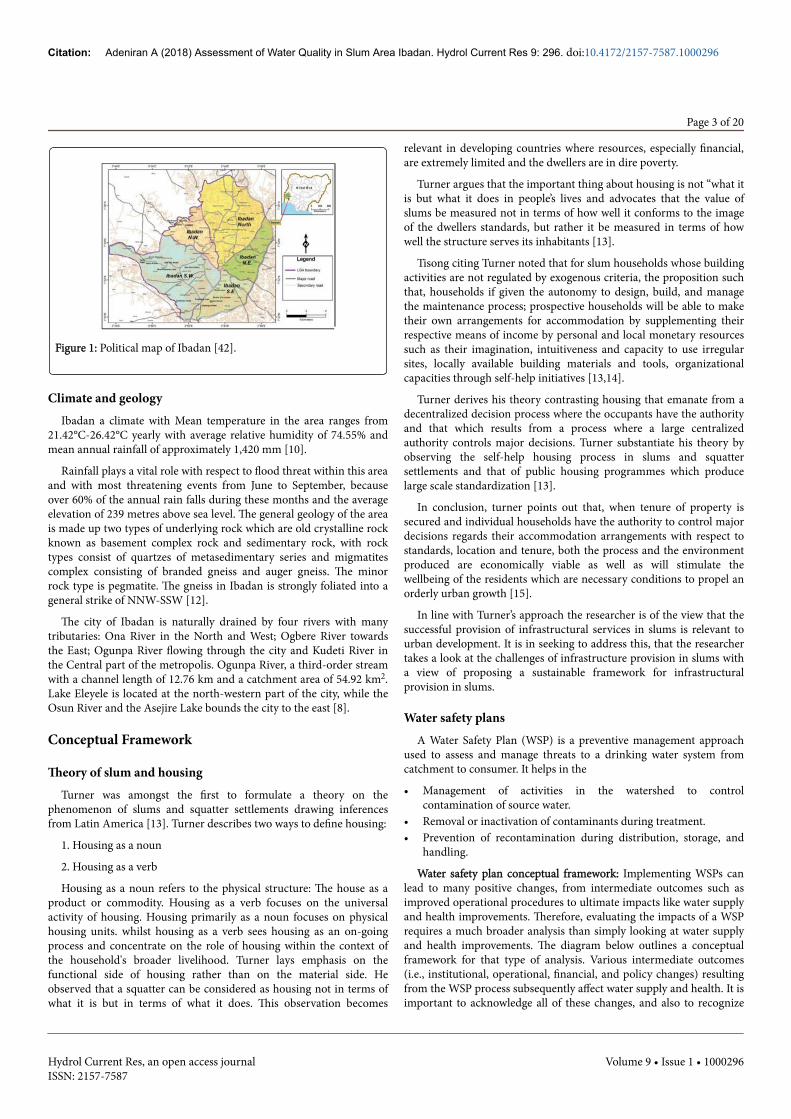
Figure 1: Political map of Ibadan [42].
Climate and geologyIbadan a climate with Mean temperature in the area ranges from
21.42°C-26.42°C yearly with average relative humidity of 74.55% andmean annual rainfall of approximately 1,420 mm [10].
Rainfall plays a vital role with respect to flood threat within this areaand with most threatening events from June to September, becauseover 60% of the annual rain falls during these months and the averageelevation of 239 metres above sea level. The general geology of the areais made up two types of underlying rock which are old crystalline rockknown as basement complex rock and sedimentary rock, with rocktypes consist of quartzes of metasedimentary series and migmatitescomplex consisting of branded gneiss and auger gneiss. The minorrock type is pegmatite. The gneiss in Ibadan is strongly foliated into ageneral strike of NNW-SSW [12].
The city of Ibadan is naturally drained by four rivers with manytributaries: Ona River in the North and West; Ogbere River towardsthe East; Ogunpa River flowing through the city and Kudeti River inthe Central part of the metropolis. Ogunpa River, a third-order streamwith a channel length of 12.76 km and a catchment area of 54.92 km2.Lake Eleyele is located at the north-western part of the city, while theOsun River and the Asejire Lake bounds the city to the east [8].
Conceptual Framework
Theory of slum and housingTurner was amongst the first to formulate a theory on the
phenomenon of slums and squatter settlements drawing inferencesfrom Latin America [13]. Turner describes two ways to define housing:
1. Housing as a noun
2. Housing as a verb
Housing as a noun refers to the physical structure: The house as aproduct or commodity. Housing as a verb focuses on the universalactivity of housing. Housing primarily as a noun focuses on physicalhousing units. whilst housing as a verb sees housing as an on-goingprocess and concentrate on the role of housing within the context ofthe household's broader livelihood. Turner lays emphasis on thefunctional side of housing rather than on the material side. Heobserved that a squatter can be considered as housing not in terms ofwhat it is but in terms of what it does. This observation becomes
relevant in developing countries where resources, especially financial,are extremely limited and the dwellers are in dire poverty.
Turner argues that the important thing about housing is not “what itis but what it does in people’s lives and advocates that the value ofslums be measured not in terms of how well it conforms to the imageof the dwellers standards, but rather it be measured in terms of howwell the structure serves its inhabitants [13].
Tisong citing Turner noted that for slum households whose buildingactivities are not regulated by exogenous criteria, the proposition suchthat, households if given the autonomy to design, build, and managethe maintenance process; prospective households will be able to maketheir own arrangements for accommodation by supplementing theirrespective means of income by personal and local monetary resourcessuch as their imagination, intuitiveness and capacity to use irregularsites, locally available building materials and tools, organizationalcapacities through self-help initiatives [13,14].
Turner derives his theory contrasting housing that emanate from adecentralized decision process where the occupants have the authorityand that which results from a process where a large centralizedauthority controls major decisions. Turner substantiate his theory byobserving the self-help housing process in slums and squattersettlements and that of public housing programmes which producelarge scale standardization [13].
In conclusion, turner points out that, when tenure of property issecured and individual households have the authority to control majordecisions regards their accommodation arrangements with respect tostandards, location and tenure, both the process and the environmentproduced are economically viable as well as will stimulate thewellbeing of the residents which are necessary conditions to propel anorderly urban growth [15].
In line with Turner’s approach the researcher is of the view that thesuccessful provision of infrastructural services in slums is relevant tourban development. It is in seeking to address this, that the researchertakes a look at the challenges of infrastructure provision in slums witha view of proposing a sustainable framework for infrastructuralprovision in slums.
Water safety plansA Water Safety Plan (WSP) is a preventive management approach
used to assess and manage threats to a drinking water system fromcatchment to consumer. It helps in the
• Management of activities in the watershed to controlcontamination of source water.
• Removal or inactivation of contaminants during treatment.• Prevention of recontamination during distribution, storage, and
handling.
Water safety plan conceptual framework: Implementing WSPs canlead to many positive changes, from intermediate outcomes such asimproved operational procedures to ultimate impacts like water supplyand health improvements. Therefore, evaluating the impacts of a WSPrequires a much broader analysis than simply looking at water supplyand health improvements. The diagram below outlines a conceptualframework for that type of analysis. Various intermediate outcomes(i.e., institutional, operational, financial, and policy changes) resultingfrom the WSP process subsequently affect water supply and health. It isimportant to acknowledge all of these changes, and also to recognize
Citation: Adeniran A (2018) Assessment of Water Quality in Slum Area Ibadan. Hydrol Current Res 9: 296. doi:10.4172/2157-7587.1000296
Page 3 of 20
Hydrol Current Res, an open access journalISSN: 2157-7587
Volume 9 • Issue 1 • 1000296
that they will not all occur immediately or simultaneously. Simplyfocusing on water quality and health improvements in the context of aWSP will overlook these important intermediate outcomes (discussed
on reverse) that can provide a better picture of the significance andsuccess of the WSP (Figure 2).
Figure 2: Water Safety Conceptual framework. Source: Centers for Disease Control and Prevention.
Literature ReviewExplanations of slums: Slum is a British slang word from the East
End of London meaning “room”, which evolved to “back slum” around1,845 meaning ‘back alley, ghetto, street of poor people’ [16]. Slumswere common in the United States and Europe before the early 20thcentury. London's East End is generally considered the locale where theterm originated in the 19th century, where massive and rapidurbanisation of the dockside and industrial areas of led to intensiveovercrowding in a warren of post-medieval streets cape. By the 1920s ithad become a common slang expression in England, meaning eithervarious taverns and eating houses, "loose talk" or gypsy language, or aroom with "low going-ons". Slum began to be used to describe badhousing soon after and was used as alternative expression for rookeries[17].
A slum is a squalid and overcrowded urban street or districtinhabited by very poor people. They are home to the poorest of urbanpopulations in Africa. The houses inhabited by slum dwellers aremostly decrepit, overcrowded, in neighbourhoods that are prone to
flooding and beset with poor sanitation and shortage of potable water[18]. It can also be defined as a contiguous settlement where theinhabitants are characterized as having inadequate housing and basicservices; and is often not recognized and addressed by the publicauthorities as an integral or equal part of the city” [19].
Major characteristics of slum are:
• Informal settlement;• Location and growth;• Substandard housing, overcrowding (high density) and squalor;• Inadequate or no infrastructure; and• Predominant in heavily populated urban areas [20].
Slum types in Nigeria: According to Agbola, two types of slum existin Nigerian cities [21]: they are
1. Traditional slums; which arises in towns from the decay ofexisting structures and
Citation: Adeniran A (2018) Assessment of Water Quality in Slum Area Ibadan. Hydrol Current Res 9: 296. doi:10.4172/2157-7587.1000296
Page 4 of 20
Hydrol Current Res, an open access journalISSN: 2157-7587
Volume 9 • Issue 1 • 1000296
2. Spontaneous slums; which are created by squatters on illegallyacquired lands [21].
If this pattern represents the majority of the slums in Ibadan, it isnecessary to reconsider the use of such terms as “traditional” and“spontaneous”, and to show that some slums can appear outside theinner city on legal land. In a study on urban decay in forty (40)Nigerian cities, Abumere [2] concluded in his study that the citiesclosely identified the phenomenon of overcrowding are large cities(Lagos, Kano, Ibadan, Benin, Onitsha), and they are generally ancient(all except Onitsha).
Moreover, most of these cities are closely associated withovercrowded and dirty/degraded environments (Lagos, Ibadan, andOnitsha). So, urban decay connected with overcrowding is almostentirely a big town problem in Nigeria and concerns, first of all, citieslike Lagos, Kano, Ibadan and Onitsha. In 1985, about 68.2 per cent ofthe slums in Nigerian cities were found within a radius of 1 km fromthe city center [2]. If there are no resources for urban renewal, the citycenter, which is the oldest by definition, turns into a slum in time.
However, slums on the city outskirts can also be found, normally inthe largest Nigerian cities [2]. In the large and fairly large cities, such asEnugu, Kano, Ibadan, Lagos, a considerable proportion of slums occurat the city outskirts, more than five (5) km from the center. The mainreason is that accommodation in many of the cities has been priced,beyond what most citizens can afford. Many low-income workers,therefore, live in low-cost shanties or slums at the city outskirts. 15years later, the situation has not improved in Ibadan. General povertyhas spread out in all Nigerian cities and the Ibadan governments havenot really addressed the issue of slums in their city.
Categories of slum in Ibadan: There are two categories of slum inIbadan according to their age and size.
And can be classified into three according to age;
1. The oldest and largest slum is the core area of the city, whichcovers the entire precolonial town. A large part of the ancientwalled city can be seen as a slum, even if the inhabitants do notagree that they live in a slum for historical reasons.
2. Another category is a few small-scale slums on land occupiedillegally by squatters and can be found at the margins of theplanned city.
3. The third one is the numerous slums which is generally occupiedby tenants on legal lands and are found at the outskirts of the cityalong major roads or close to local labour markets.
The size, history, socio-economic and cultural features of slums inIbadan differ from one to another, and can be further explained:
The inner-city area is the oldest, has the lowest quality residence andthe highest population density in the city. In the 19th century, largecompounds for extended families and warrior lineages constituted thispart of the city. With the development of the town, the core area“growth by fission”, compounds were broken up into a number ofseparate housing units [22].
Mabogunje further stated that in the 1960s, one of the majorproblems of Ibadan was the pre-European foundation “because of itsalmost unbelievable density of buildings, their spectaculardeterioration, and virtual absence of adequate sanitation [22]. Thedifferences in their wealth, education, acquired skills, social customs,and attitudes emphasize the social distance between the two sections ofthe city” i.e., the core area and the new colonial town [22].
According to the same author, half of the city constituted by thiscore area was occupied by “slum dwellings characterized by noidentifiable sanitation facilities, housing in mud, physical deteriorationand the highest population density area of the town” [22]. Thisstatement is still valid today. In 1985, 70 per cent of the derelict houseswere found in the inner city, i.e., at less than two km from the centre[2]. Since then no renewal scheme has been implemented in the corearea except in one specific ward.
Yemetu in 1995 stated that inner city today has the followingcharacteristics: it is the highest density area of the city because it has ahigh percentage of the population by household. It has a very highpercentage of land devoted to residential land use, as high as 90percent in a ward called Elekuro.
The second category of slums is the squatter settlements found atthe margins of the planned town. The planned city has witnessed thedecay of some parts of its area in the past twenty years and thedevelopment of a few slums at its margins. Apart from the Europeanreservations, the colonial town was built for the accommodation ofimmigrants. Layouts were designed, and roads were constructed [4].
The newer eastern and western suburbs represent the low andmedium quality residential districts set up in the first half of the 20thcentury. Some of the wards which had been established at thebeginning of the 20th century have now declined. Mokola, for instance,was renewed in 1995 (Word Bank Project). This is also the case ofSabo, the first Hausa ward created in 1911 by the Colonial Authority tosettle the Hausa trader community at the margins of the inner city[23].
The development of makeshift structures in Sabo since the 1980scorresponds to the general increase of poverty in the country and thewillingness of the Sabo Sarkin Hausa (head of the Hausa community inSabo) to welcome poor Hausa people to the area in an interview withEl Hadj Bature, Representative of Sarkin Hausawa, Sabo [5]. However,despite this decay, the ward cannot be considered today to be a slumbecause it hosts rich Hausa traders who are integrated within the city.Moreover, because most of these traders in Sabo are the owners of theirhouses they have interest in maintaining them. This is in contrast tothe Hausa residents at the outskirts of the city who have difficult accessto land ownership (ibid).
The development of unplanned urbanization along the major roadsof the city from the 1970s to the 1990s has finally given birth to notableslums in the north, the east and the south of the city. Thirty (30)percent of the derelict houses in Ibadan are found in the outskirts ofthe city at more than five km from the centre [2].
Most of them have been developed because a new labour marketgave opportunities for employment which is particular to the case ofAgbowo that is close to the University and inhabited by students andjunior staff of the university. It is also the case of Ojoo, which is amixed Hausa-Yoruba settlement founded in the mid-1970s around themain transit market on the Lagos-Kano Road. And it is the case of Sasathat is very close to the International Institute of Tropical Agriculture(IITA); another Hausa-Yoruba settlement [4].
This list of peripheral slums cannot be considered as exhaustive andsome slums probably exist in other parts of the city. The peripheralslums can be described as follows:
Population densities in the outskirts tend to be lower than in theinner city, but there is unfortunately no data available.
Citation: Adeniran A (2018) Assessment of Water Quality in Slum Area Ibadan. Hydrol Current Res 9: 296. doi:10.4172/2157-7587.1000296
Page 5 of 20
Hydrol Current Res, an open access journalISSN: 2157-7587
Volume 9 • Issue 1 • 1000296
Densities in peripheral slums depend on their capacity to attractresidents.
Agbowo, for instance, became extremely populous because of thedevelopment of a rental housing market for thousands of students andjunior staff who cannot find accommodation on campus. There is anaverage of 3.16 students per room in Agbowo, and around 40 percentof students occupy rooms which house between four and eightstudents [24].
Water qualityWater quality refers to the chemical, physical, biological, and
radiological characteristics of water [25]. It is a measure of thecondition of water relative to the requirements of one or more bioticspecies and or to any human need or purpose [26]. It is mostfrequently used by reference to a set of standards against whichcompliance can be assessed. It is at the national level that critical issuesand needs must be analyzed and addressed from policy and legislationdownwards [27].
A major problem in the core area is not just availability but thequality of available ground water. Even houses which have the facilities(pipes and taps) cannot get water more than once in month. The OyoState Water Corporation (OSWC) is still the only public agencyresponsible for the supply and distribution of piped water in Ibadan.This agency has been criticized several times for its technical andmanagerial deficiencies In, 1999, only 28 percent of Ibadan inhabitantsused the water facilities provided by the OSWC in an interview withTunde Agbola, Director of Centre for Urban and Regional Planning,Ibadan [4].
This situation seems to be worse in slum areas than in other areas.For instance, in three other wards of Ibadan, “only” 50 percent of theget water supplies from alternative sources of water [28]. Thesealternative sources apart from rainfall are contaminated due to lack ofsanitary facilities. Water is the strategic resource of the 21st century(Ibid). The management of water resources and supply is essential tothe development and growth of cities.
Water related diseases continue to be one of the major healthproblems globally due to consumption of contaminated water. Thehigh prevalence of diarrhoea among children and infants can be tracedto the consumption of unsafe water. The most dangerous form of waterpollution occurs when faecal contaminant like Escherichia coli entersthe water supply. Also, the sanitation which include faecal-oral routesof transmission, in which pathogens are shed in human or animalfaces. Contaminants put into water supply which may perpetuate manydiseases examples of such pathogen are Salmonella spp, Shigella spp,Vibrio cholerael, Escherichia coli according to United StatesEnvironmental Protection Agency [29].
Sustainable resource use and the provision of quality services to agrowing urban population underpins the success of future cities,enables them to act as poles of economic growth, and is at the core ofsocial and economic development in an urbanizing world (Ibid). Overthe last decade, privatization to a greater degree has been seen as oneof the primary ways to in fuse capital in to the urban water sector andto overcome some of the inefficiencies of municipal management. Ithas been urged upon developing countries by international lendingagencies as an essential component of water sector reform [30].
The parameters for water quality are determined by the intendeduse. Work in the area of water quality tends to be focused on water thatis treated for human consumption, industrial use, or in theenvironment. As observed by Faniran [31], large quantities ofpollutants have continuously been introduced into ecosystems as aconsequence of urbanization and industrial processes. Heavy Metalsare persistent pollutants that can be biomagnified in the food chains,becoming increasingly dangerous to human beings and wildlife.Therefore, assessing the concentrations of pollutants in differentcomponents of the ecosystem has become an important task inpreventing risk to natural life and public health. Heavy metals enterinto the environment mainly via three routes namely: (i) deposition ofatmospheric particulate, (ii) disposal of metal enriched sewage sludgesand sewage effluents and (iii) by-products from metal mining process.Water is one of the repositories for anthropogenic wastes [9] Sewagesludge (the product of sedimentation at a sewage treatment works) isfrequently heavy metal-rich, derived from industry discharging wasteinto the sewerage system. When untreated sewage is discharged intogroundwater heavy metals can be found in the sediments. Where thereis a combined sewage and storm-water drainage system for an urbanarea, untreated sewage can be discharged during a storm event whenthe sewage treatment works cannot cope with the extra storm water[32].
The environmental impact of metals and the pollution level in thesediments can be determined with the help of two parameters; theenrichment ratio (ER) and geoaccumulation index (Igeo). Theenrichment factor (EF), due to its universal formula, is a relativelysimple and easy tool for assessing the enrichment degree andcomparing the contamination of different environmental media [33].The ER is a normalisation method proposed by Simex and Helz toassess the concentration of the metals. It normalises metalconcentration as a ratio to another constituent of the sediments. Rubioet al. stated that there is no consensus about the most appropriatesediment constituent to be used for normalisation. Among those usedhave been Al, Fe, total organic carbon, and grain size. The constituentchosen for this purpose should also be associated with finer particles(related to grain size) and its concentration should not beanthropogenically altered (ibid).
Geoaccumulation index (Igeo) was originally stated by Muller inorder to determine and define metal contamination in sediments bycomparing current concentrations with preindustrial levels, Igeo iscalculated as follows:
Igeo=log2 [Cn/1.5Bn]
Where Cn is the measured concentration in the sediment for themetal n, Bn is the background value for the metal n, and the factor 1.5is used because of possible variations of the background data due tolithological variations and natural fluctuation. The quantity Igeo iscalculated using the global average shale data from Turekian et al. [34].
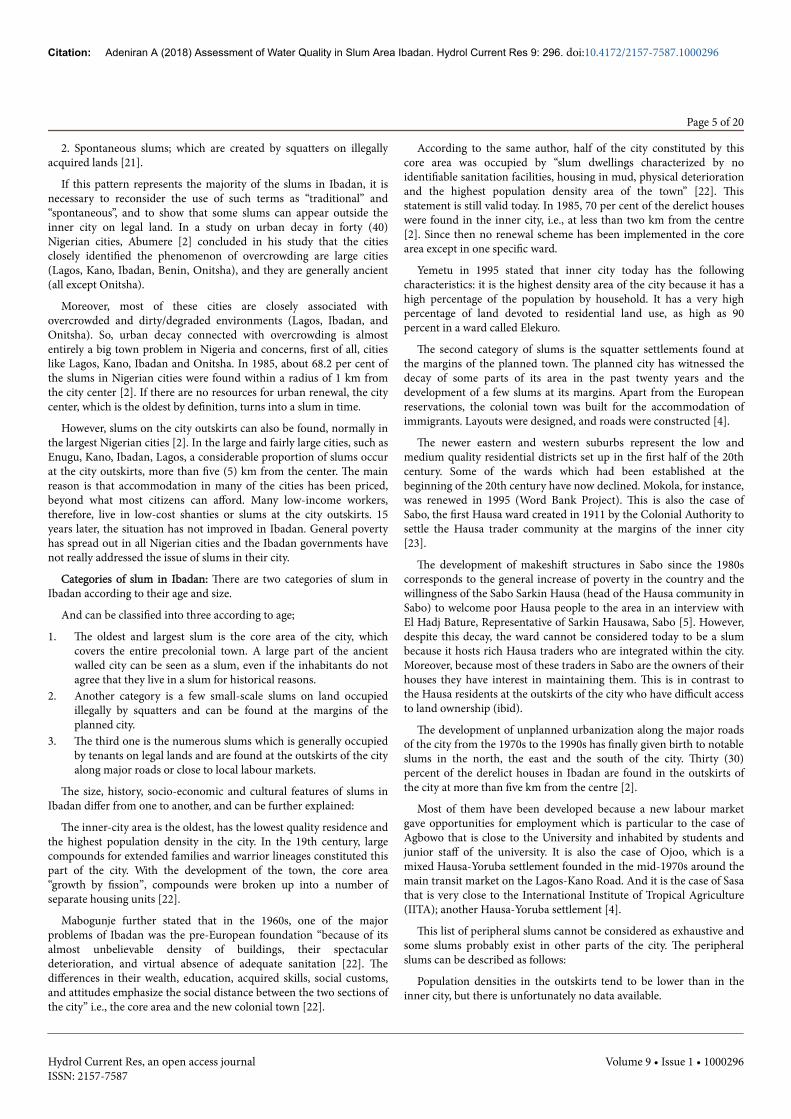
Geo-accumulation index is used in assessing the rate ofcontamination. The index has six classes (Table 1).
Citation: Adeniran A (2018) Assessment of Water Quality in Slum Area Ibadan. Hydrol Current Res 9: 296. doi:10.4172/2157-7587.1000296
Page 6 of 20
Hydrol Current Res, an open access journalISSN: 2157-7587
Volume 9 • Issue 1 • 1000296
Class Value Classification
0 <0 Uncontaminated
1 0-1 Uncontaminated to moderately contaminated
2 1-2 Moderately contaminated
3 2-3 Moderately to strongly comtaminated
4 3-4 Strongly contaminated
5 4-5 Strongly to extremely strongly contaminated
6 >5 Extremely strongly contaminated
Table 1: Geoaccumulation Index [34].
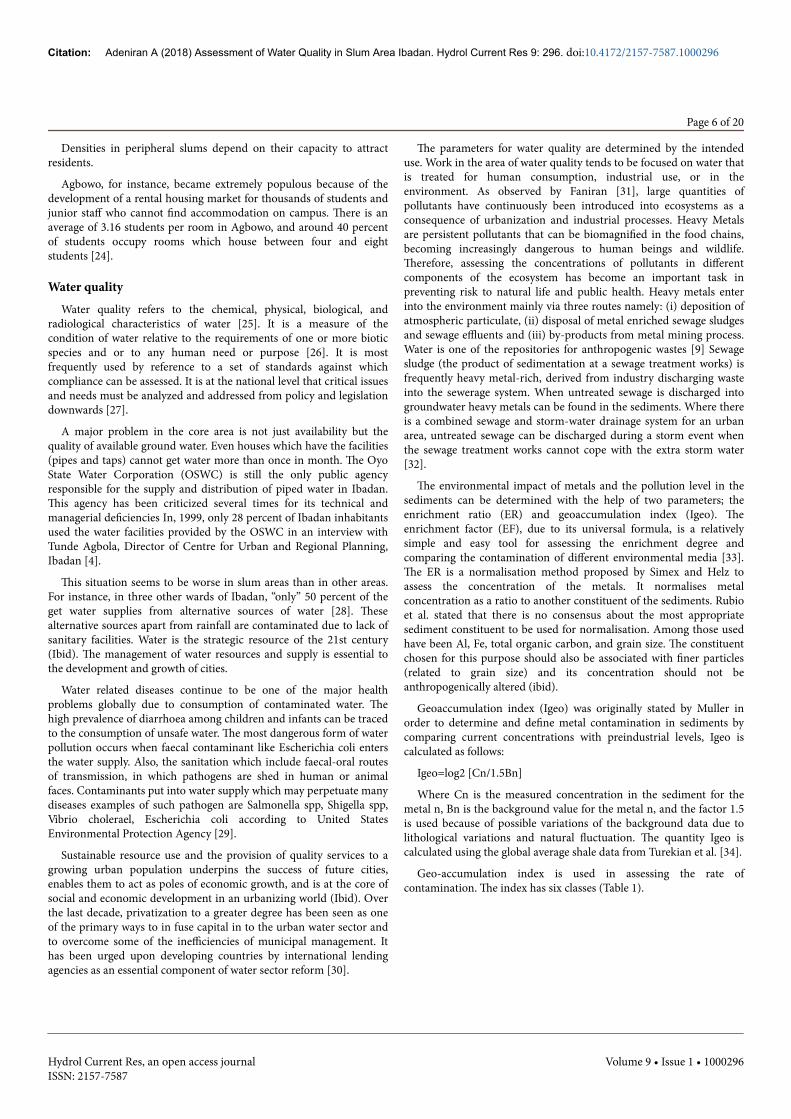
Water quality standards: The incidents of water borne disease andepidemics nationwide arising from drinking water of doubtful qualityhave become of great concern. The primary purpose of the guidelinefor drinking water quality is the protection of public health. Asdescribed by Horsefall and Spiff, water quality standard is a measure,principle or rule established by authority set to protect the waterresource for uses such as drinking water supply, recreational uses andaesthetics, agriculture (irrigation and livestock watering), protection ofaquatic life and industrial water supplies. In order to maintain waterquality, guidelines for drinking water was set up by the World HealthOrganization. A guideline value represents the level (a concentrationor number) of a constituent that ensures aesthetically pleasing waterand does not result in any significant risk to the health of the consumer(Table 2).
The World Health Organization, Guideline for Drinking-waterQuality (GDWQ) include the following recommended limits onnaturally occurring constituents that may have direct adverse healthimpact [35].
Metals Highest Desirable Maximum Permissible
Arsenic mg/l 0.01 0.01
Chromium mg/l 0.05 0.05
Iron mg/l 0.3 3
Lead mg/l 0.03 1.5
Manganese mg/l 0.4 0.4
Mercury mg/l 0.001 0.001
Nickel mg/l 0.01 0.03
Zinc mg/l 1 3
Table 2: WHO standards for Heavy metals in a potable water [35].
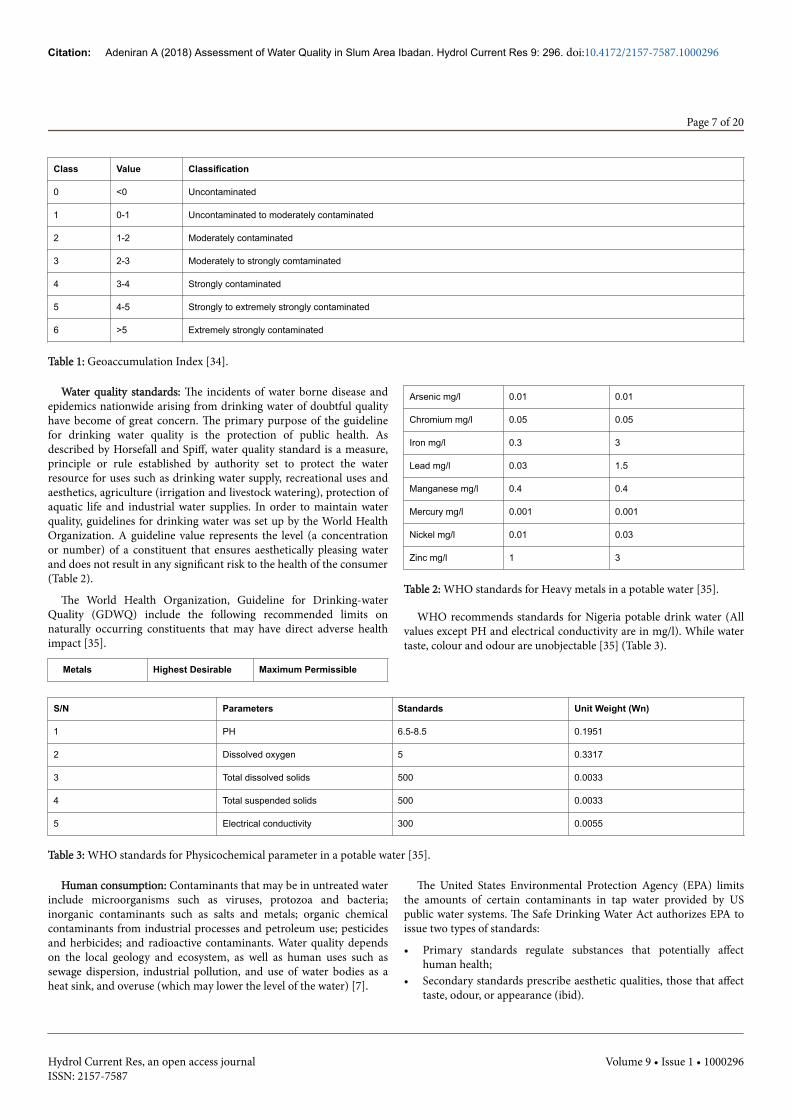
WHO recommends standards for Nigeria potable drink water (Allvalues except PH and electrical conductivity are in mg/l). While watertaste, colour and odour are unobjectable [35] (Table 3).
S/N Parameters Standards Unit Weight (Wn)
1 PH 6.5-8.5 0.1951
2 Dissolved oxygen 5 0.3317
3 Total dissolved solids 500 0.0033
4 Total suspended solids 500 0.0033
5 Electrical conductivity 300 0.0055
Table 3: WHO standards for Physicochemical parameter in a potable water [35].
Human consumption: Contaminants that may be in untreated waterinclude microorganisms such as viruses, protozoa and bacteria;inorganic contaminants such as salts and metals; organic chemicalcontaminants from industrial processes and petroleum use; pesticidesand herbicides; and radioactive contaminants. Water quality dependson the local geology and ecosystem, as well as human uses such assewage dispersion, industrial pollution, and use of water bodies as aheat sink, and overuse (which may lower the level of the water) [7].
The United States Environmental Protection Agency (EPA) limitsthe amounts of certain contaminants in tap water provided by USpublic water systems. The Safe Drinking Water Act authorizes EPA toissue two types of standards:
• Primary standards regulate substances that potentially affecthuman health;
• Secondary standards prescribe aesthetic qualities, those that affecttaste, odour, or appearance (ibid).
Citation: Adeniran A (2018) Assessment of Water Quality in Slum Area Ibadan. Hydrol Current Res 9: 296. doi:10.4172/2157-7587.1000296
Page 7 of 20
Hydrol Current Res, an open access journalISSN: 2157-7587
Volume 9 • Issue 1 • 1000296

Domestic use: Dissolved minerals may affect suitability of water fora range of domestic purposes. The most familiar of these is probablythe presence of ions of calcium (Ca2+) and magnesium (Mg2+) whichinterfere with the cleaning action of soap and can form hard sulfateand soft carbonate deposit in water heaters or boilers. Hard water maybe softened to remove these ions. The softening process oftensubstitutes sodium cautions.
Hard water may be preferable to soft water for human consumption,since health problems have been associated with excess sodium andwith calcium and magnesium deficiencies. Softening decreasesnutrition and may increase cleaning effectiveness [36]. Variousindustries' wastes and effluents can also pollute the water quality inreceiving bodies of water [37].
Environmental water quality: Environmental water quality orambient water quality, it relates to water bodies such as lakes, rivers,and oceans. Water quality standards for surface waters varysignificantly due to different environmental conditions, ecosystems,and intended human uses. This also relate to the sanitation of theenvironment. Sanitation which is the means of promoting hygienethrough the prevention of human contact with hazards of wastesespecially faeces, by proper treatment and disposal of the waste, oftenmixed into waste-water [38].
These hazards may be physical, microbiological, biological orchemical agents of disease. Wastes that can cause health problemsinclude human and animal excreta, solid wastes, domestic waste-water(sewage or grey water) [38] which is common in Slum areas. WhileWater Supply and Sanitation Collaborative Council defines sanitationas the collection, transport, treatment and disposal or reuse of humanexcreta, domestic waste water and solid waste, and associated hygienepromotion [39]. Large input of organic load and nutrients from rawmaterial sewage to a weak hydrodynamic environment poses seriousenvironmental and health and problem from deterioration of waterquality [40].
Toxic substances and high populations of certain microorganismscan present a health hazard on drinking purposes and other uses suchas irrigation, swimming, fishing, rafting, boating, and industrial uses.These conditions may also affect wild life, which use the water fordrinking or as habitat. Modern water quality laws generally specifyprotection of fisheries and recreational use and require, as a minimumretention of current quality standards.
The challenge related to the management of water supply,distribution and quality exists partly due to extensive industrialization,increased population density and a high rate of urbanization [41]. It isestimated that 88 per cent of diarrhea disease is caused by unsafe watersupply, and inadequate sanitation and hygiene. Trachoma, one of theworld’s leading cause of preventable blindness, results from poorhygiene and sanitation. Other preventable diseases like typhoid,dysentery, hepatitis, polio and cholera have proliferated in Africabecause of a lack of access to clean water as well as a poorunderstanding of proper hygiene [39]. Critical to life in all its diversity,water is the life blood of society and a foundation of civilization [12].
Legal and institutional framework: Nigeria being a Federal republicis made up of thirty-six states, have Water Boards or Corporations i.e.,public utilities managing their public water supply schemes; with theirefforts being supplemented in many cases Local Governmentssupplying water to small villages in their areas of jurisdiction.
They are saddled with the responsibility of providing water supplyto their various state citizens by the 1999 constitution. Even at thestates level, water laws exhibit similar characteristics as those at theFederal level. The State Water Agencies (SWA’s) have unclear andconflicting roles i.e., they are both suppliers and regulators (theycombine policy making, service delivery and regulatory functions). Aspresently enacted, state water laws fail to recognize the need forstakeholder participation in policy, planning and managementdecision.
Following the enactment of the Water Act 101 of 1993, and thepreparation of the National Water Resources Master Plan (NWRMP)of 1995, the Water Resources Management Reform Programme(WRMRP) commenced in 1997. This programme carried out a watersector review with respect to the legal and regulatory framework;institutional framework and participatory approach; information andwater resources database; water resources economics andsustainability; water resources infrastructure; assets management andinternational waters. The three levels of institutional arrangement thatexist in Nigeria are; the Federal, and Local, share responsibility forwater resources management. This has led to fragmentation,duplication and lack of inter-sectoral coordination with each segmentpursuing its independent water agenda. The institutional arrangementsin Nigeria’s water resources are as follows (Figure 3).
Citation: Adeniran A (2018) Assessment of Water Quality in Slum Area Ibadan. Hydrol Current Res 9: 296. doi:10.4172/2157-7587.1000296
Page 8 of 20
Hydrol Current Res, an open access journalISSN: 2157-7587
Volume 9 • Issue 1 • 1000296
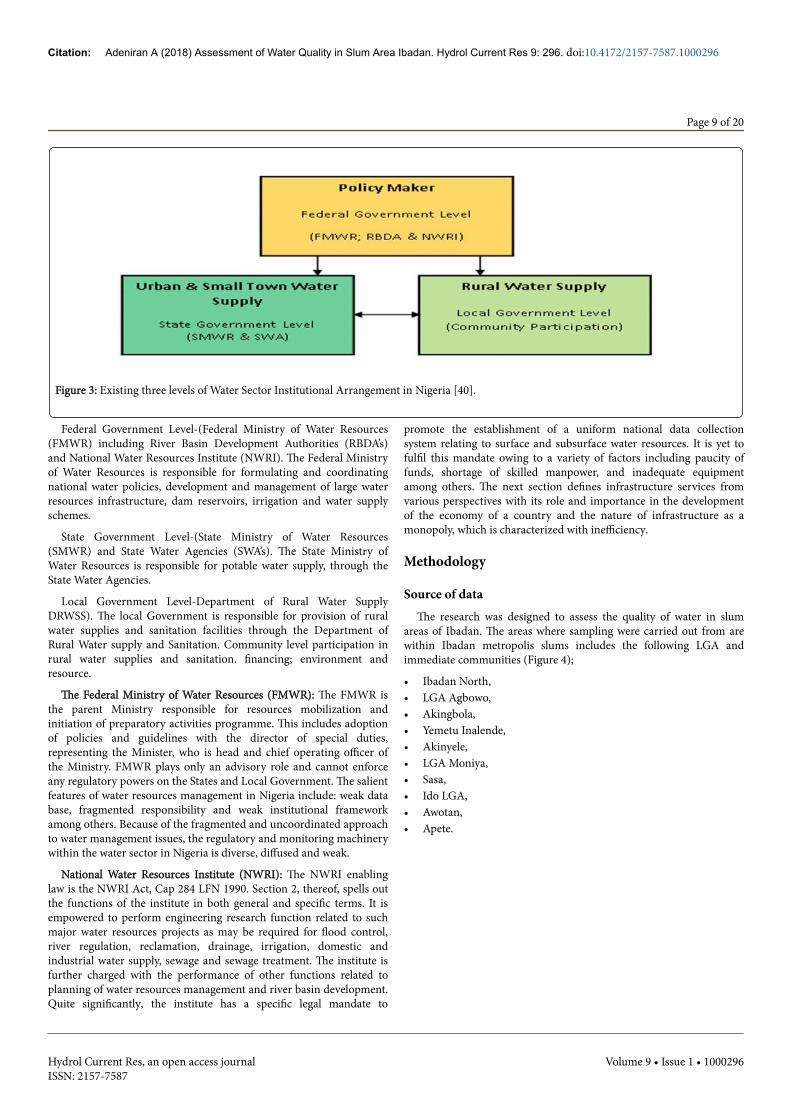
Figure 3: Existing three levels of Water Sector Institutional Arrangement in Nigeria [40].
Federal Government Level-(Federal Ministry of Water Resources(FMWR) including River Basin Development Authorities (RBDA’s)and National Water Resources Institute (NWRI). The Federal Ministryof Water Resources is responsible for formulating and coordinatingnational water policies, development and management of large waterresources infrastructure, dam reservoirs, irrigation and water supplyschemes.
State Government Level-(State Ministry of Water Resources(SMWR) and State Water Agencies (SWA’s). The State Ministry ofWater Resources is responsible for potable water supply, through theState Water Agencies.
Local Government Level-Department of Rural Water SupplyDRWSS). The local Government is responsible for provision of ruralwater supplies and sanitation facilities through the Department ofRural Water supply and Sanitation. Community level participation inrural water supplies and sanitation. financing; environment andresource.
The Federal Ministry of Water Resources (FMWR): The FMWR isthe parent Ministry responsible for resources mobilization andinitiation of preparatory activities programme. This includes adoptionof policies and guidelines with the director of special duties,representing the Minister, who is head and chief operating officer ofthe Ministry. FMWR plays only an advisory role and cannot enforceany regulatory powers on the States and Local Government. The salientfeatures of water resources management in Nigeria include: weak database, fragmented responsibility and weak institutional frameworkamong others. Because of the fragmented and uncoordinated approachto water management issues, the regulatory and monitoring machinerywithin the water sector in Nigeria is diverse, diffused and weak.
National Water Resources Institute (NWRI): The NWRI enablinglaw is the NWRI Act, Cap 284 LFN 1990. Section 2, thereof, spells outthe functions of the institute in both general and specific terms. It isempowered to perform engineering research function related to suchmajor water resources projects as may be required for flood control,river regulation, reclamation, drainage, irrigation, domestic andindustrial water supply, sewage and sewage treatment. The institute isfurther charged with the performance of other functions related toplanning of water resources management and river basin development.Quite significantly, the institute has a specific legal mandate to
promote the establishment of a uniform national data collectionsystem relating to surface and subsurface water resources. It is yet tofulfil this mandate owing to a variety of factors including paucity offunds, shortage of skilled manpower, and inadequate equipmentamong others. The next section defines infrastructure services fromvarious perspectives with its role and importance in the developmentof the economy of a country and the nature of infrastructure as amonopoly, which is characterized with inefficiency.
Methodology
Source of dataThe research was designed to assess the quality of water in slum
areas of Ibadan. The areas where sampling were carried out from arewithin Ibadan metropolis slums includes the following LGA andimmediate communities (Figure 4);
• Ibadan North,• LGA Agbowo,• Akingbola,• Yemetu Inalende,• Akinyele,• LGA Moniya,• Sasa,• Ido LGA,• Awotan,• Apete.
Citation: Adeniran A (2018) Assessment of Water Quality in Slum Area Ibadan. Hydrol Current Res 9: 296. doi:10.4172/2157-7587.1000296
Page 9 of 20
Hydrol Current Res, an open access journalISSN: 2157-7587
Volume 9 • Issue 1 • 1000296
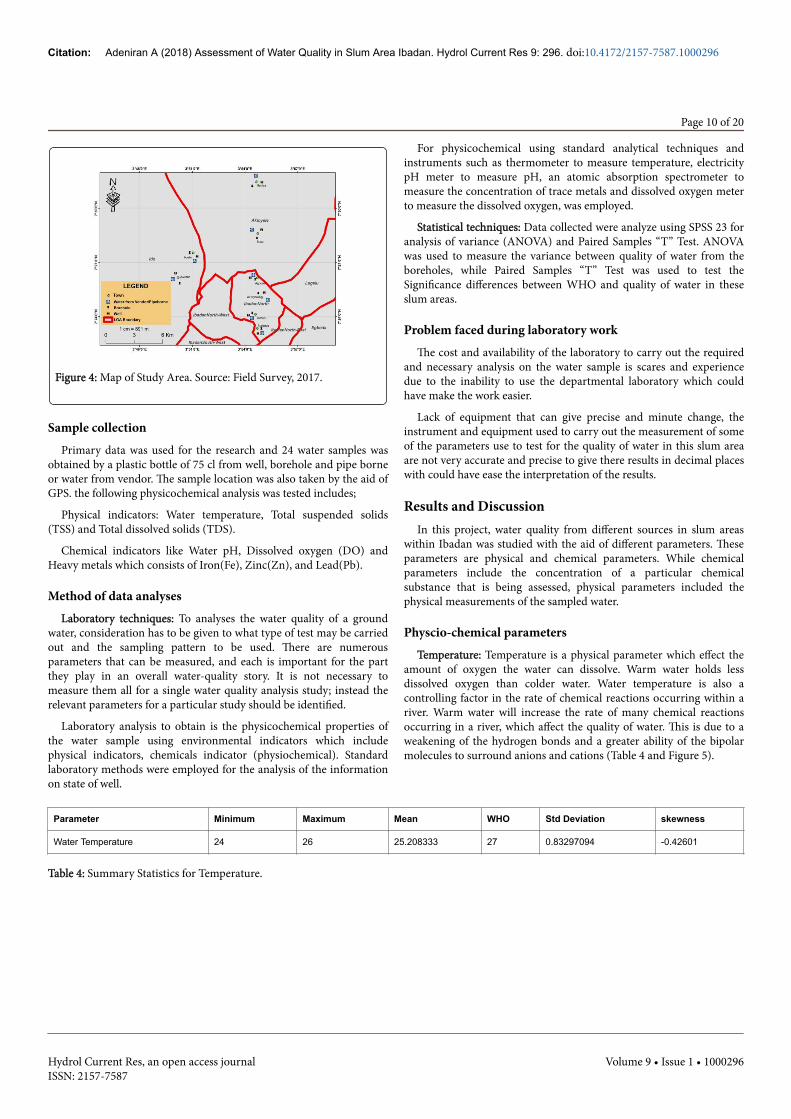
Figure 4: Map of Study Area. Source: Field Survey, 2017.
Sample collectionPrimary data was used for the research and 24 water samples was
obtained by a plastic bottle of 75 cl from well, borehole and pipe borneor water from vendor. The sample location was also taken by the aid ofGPS. the following physicochemical analysis was tested includes;
Physical indicators: Water temperature, Total suspended solids(TSS) and Total dissolved solids (TDS).
Chemical indicators like Water pH, Dissolved oxygen (DO) andHeavy metals which consists of Iron(Fe), Zinc(Zn), and Lead(Pb).
Method of data analysesLaboratory techniques: To analyses the water quality of a ground
water, consideration has to be given to what type of test may be carriedout and the sampling pattern to be used. There are numerousparameters that can be measured, and each is important for the partthey play in an overall water-quality story. It is not necessary tomeasure them all for a single water quality analysis study; instead therelevant parameters for a particular study should be identified.
Laboratory analysis to obtain is the physicochemical properties ofthe water sample using environmental indicators which includephysical indicators, chemicals indicator (physiochemical). Standardlaboratory methods were employed for the analysis of the informationon state of well.
For physicochemical using standard analytical techniques andinstruments such as thermometer to measure temperature, electricitypH meter to measure pH, an atomic absorption spectrometer tomeasure the concentration of trace metals and dissolved oxygen meterto measure the dissolved oxygen, was employed.
Statistical techniques: Data collected were analyze using SPSS 23 foranalysis of variance (ANOVA) and Paired Samples “T” Test. ANOVAwas used to measure the variance between quality of water from theboreholes, while Paired Samples “T” Test was used to test theSignificance differences between WHO and quality of water in theseslum areas.
Problem faced during laboratory workThe cost and availability of the laboratory to carry out the required
and necessary analysis on the water sample is scares and experiencedue to the inability to use the departmental laboratory which couldhave make the work easier.
Lack of equipment that can give precise and minute change, theinstrument and equipment used to carry out the measurement of someof the parameters use to test for the quality of water in this slum areaare not very accurate and precise to give there results in decimal placeswith could have ease the interpretation of the results.
Results and DiscussionIn this project, water quality from different sources in slum areas
within Ibadan was studied with the aid of different parameters. Theseparameters are physical and chemical parameters. While chemicalparameters include the concentration of a particular chemicalsubstance that is being assessed, physical parameters included thephysical measurements of the sampled water.
Physcio-chemical parametersTemperature: Temperature is a physical parameter which effect the
amount of oxygen the water can dissolve. Warm water holds lessdissolved oxygen than colder water. Water temperature is also acontrolling factor in the rate of chemical reactions occurring within ariver. Warm water will increase the rate of many chemical reactionsoccurring in a river, which affect the quality of water. This is due to aweakening of the hydrogen bonds and a greater ability of the bipolarmolecules to surround anions and cations (Table 4 and Figure 5).
Parameter Minimum Maximum Mean WHO Std Deviation skewness
Water Temperature 24 26 25.208333 27 0.83297094 -0.42601
Table 4: Summary Statistics for Temperature.
Citation: Adeniran A (2018) Assessment of Water Quality in Slum Area Ibadan. Hydrol Current Res 9: 296. doi:10.4172/2157-7587.1000296
Page 10 of 20
Hydrol Current Res, an open access journalISSN: 2157-7587
Volume 9 • Issue 1 • 1000296
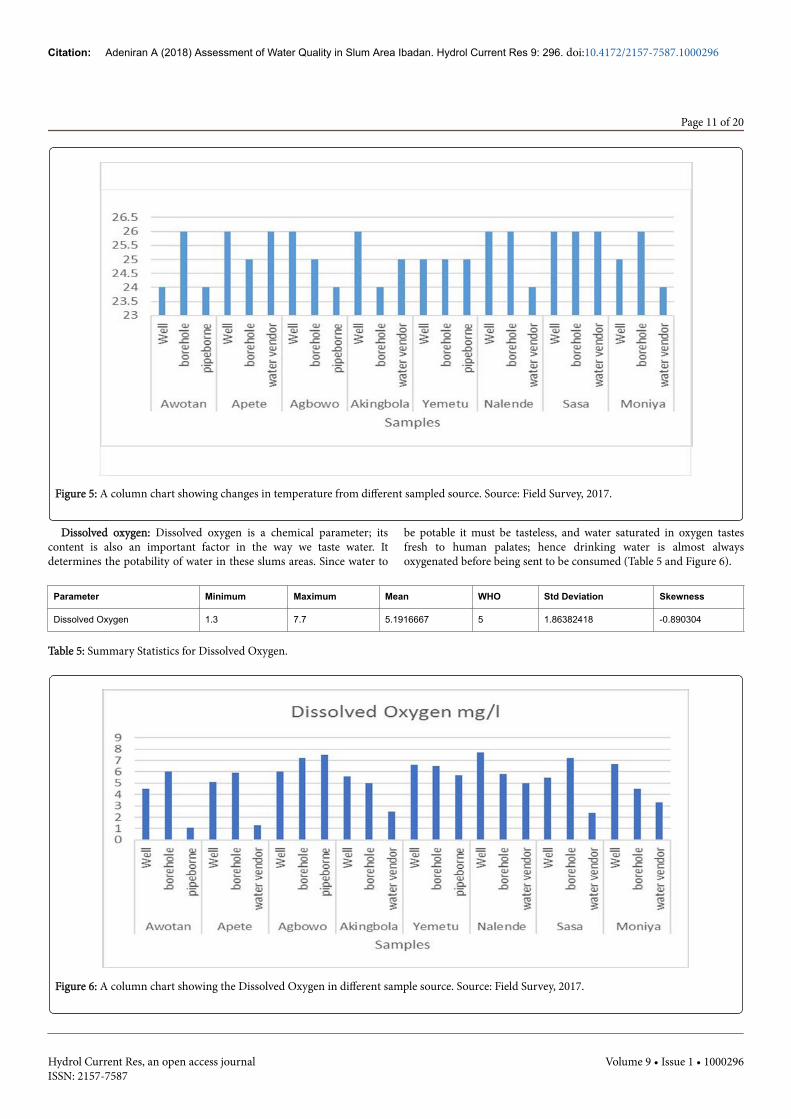
Figure 5: A column chart showing changes in temperature from different sampled source. Source: Field Survey, 2017.
Dissolved oxygen: Dissolved oxygen is a chemical parameter; itscontent is also an important factor in the way we taste water. Itdetermines the potability of water in these slums areas. Since water to
be potable it must be tasteless, and water saturated in oxygen tastesfresh to human palates; hence drinking water is almost alwaysoxygenated before being sent to be consumed (Table 5 and Figure 6).
Parameter Minimum Maximum Mean WHO Std Deviation Skewness
Dissolved Oxygen 1.3 7.7 5.1916667 5 1.86382418 -0.890304
Table 5: Summary Statistics for Dissolved Oxygen.
Figure 6: A column chart showing the Dissolved Oxygen in different sample source. Source: Field Survey, 2017.
Citation: Adeniran A (2018) Assessment of Water Quality in Slum Area Ibadan. Hydrol Current Res 9: 296. doi:10.4172/2157-7587.1000296
Page 11 of 20
Hydrol Current Res, an open access journalISSN: 2157-7587
Volume 9 • Issue 1 • 1000296

Relationship between dissolved oxygen and water temperature: Themost important feature of temperature is the interdependence it haswith dissolved oxygen content. There are two methods by whichdissolved oxygen content is considered percentage saturation and
concentration (mg/l). These two measures are interrelated throughtemperature, as the dissolved oxygen content of water is highlytemperature dependent (Figure 7).
Figure 7: Relationship between maximum dissolved oxygen content (i.e. saturation) and temperature. Source: Field Survey, 2017.
Water pH: Chemists think of water as naturally disassociating intotwo separate ions: the hydroxide (OH-) and hydrogen (H+) ions.
H2O= OH-+ H+
The acidity of water is given by the hydrogen ion, and hence pH (themeasure of acidity) is a measure of the concentration of hydrogen ionspresent. Infact it is the log of the inverse concentration of hydrogenions.
pH=log1/[H+]
This works out on a scale between 1 and 14, with 7 being neutral. ApH value less than 7 indicates an acid solution; greater than 7 a basicsolution (also called alkaline). It is important to bear in mind that
because the pH scale is logarithmic (base 10) a solution with pH value5 is ten times as acidic as one with pH value 6. In natural waters the pHlevel may vary considerably. The acidity of a river is an importantcontrol for the amount of dissolved ions present, particularly metalspecies. The more acidic a river is the more metallic ions will be held insolution.
In Ibadan the below sampled analysis shows a minimum pH of 5.75and a maximum of 7.1 that Awotan well (Sample 1) is the most acidicwhich is therefore not safe to consume and not potable. And that thewater from vendor at Apete (Sample 6) is neutral and the most potable.Since the WHO standard is 6.5-8.5, therefore only Sample 3 and 6meets with the provided standards (Table 6 and Figure 8).
Parameter Minimum Maximum Mean WHO Std Deviation Skewness
Water pH 5.75 7.1 6.2479167 7.5 0.2643282 0.979846
Table 6: Summary Statistics for Water pH.
Citation: Adeniran A (2018) Assessment of Water Quality in Slum Area Ibadan. Hydrol Current Res 9: 296. doi:10.4172/2157-7587.1000296
Page 12 of 20
Hydrol Current Res, an open access journalISSN: 2157-7587
Volume 9 • Issue 1 • 1000296
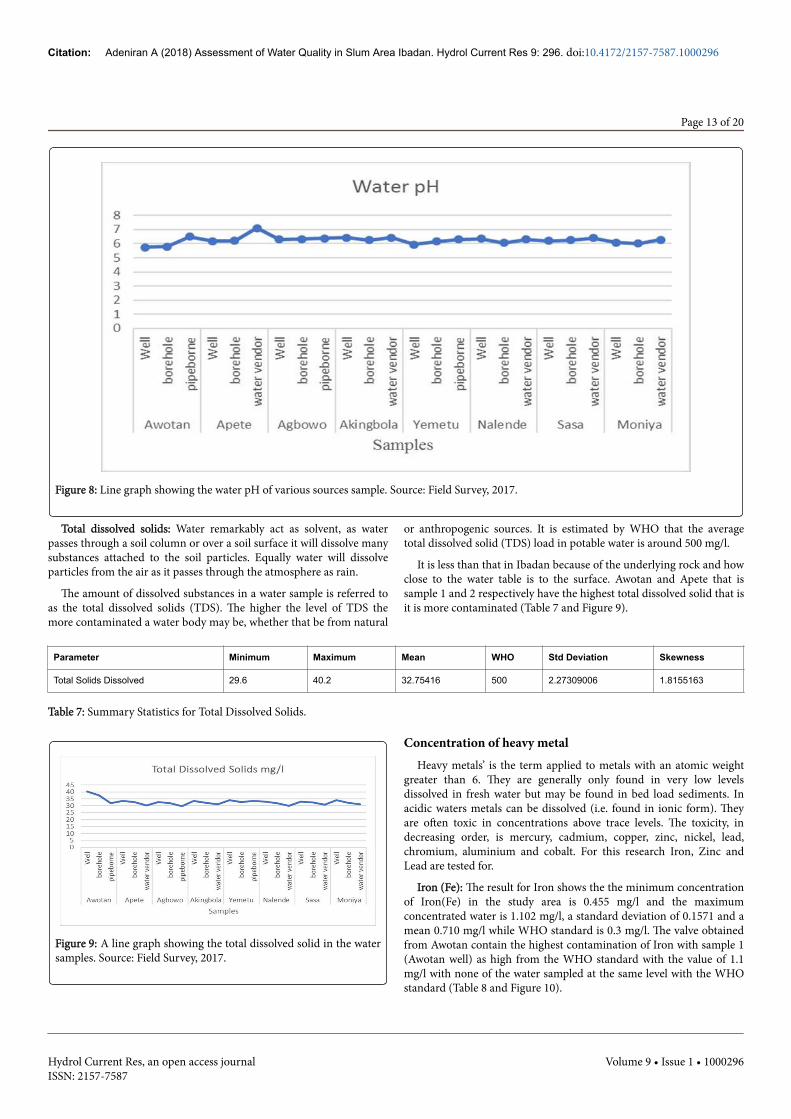
Figure 8: Line graph showing the water pH of various sources sample. Source: Field Survey, 2017.
Total dissolved solids: Water remarkably act as solvent, as waterpasses through a soil column or over a soil surface it will dissolve manysubstances attached to the soil particles. Equally water will dissolveparticles from the air as it passes through the atmosphere as rain.
The amount of dissolved substances in a water sample is referred toas the total dissolved solids (TDS). The higher the level of TDS themore contaminated a water body may be, whether that be from natural
or anthropogenic sources. It is estimated by WHO that the averagetotal dissolved solid (TDS) load in potable water is around 500 mg/l.
It is less than that in Ibadan because of the underlying rock and howclose to the water table is to the surface. Awotan and Apete that issample 1 and 2 respectively have the highest total dissolved solid that isit is more contaminated (Table 7 and Figure 9).
Parameter Minimum Maximum Mean WHO Std Deviation Skewness
Total Solids Dissolved 29.6 40.2 32.75416 500 2.27309006 1.8155163
Table 7: Summary Statistics for Total Dissolved Solids.
Figure 9: A line graph showing the total dissolved solid in the watersamples. Source: Field Survey, 2017.
Concentration of heavy metalHeavy metals’ is the term applied to metals with an atomic weight
greater than 6. They are generally only found in very low levelsdissolved in fresh water but may be found in bed load sediments. Inacidic waters metals can be dissolved (i.e. found in ionic form). Theyare often toxic in concentrations above trace levels. The toxicity, indecreasing order, is mercury, cadmium, copper, zinc, nickel, lead,chromium, aluminium and cobalt. For this research Iron, Zinc andLead are tested for.
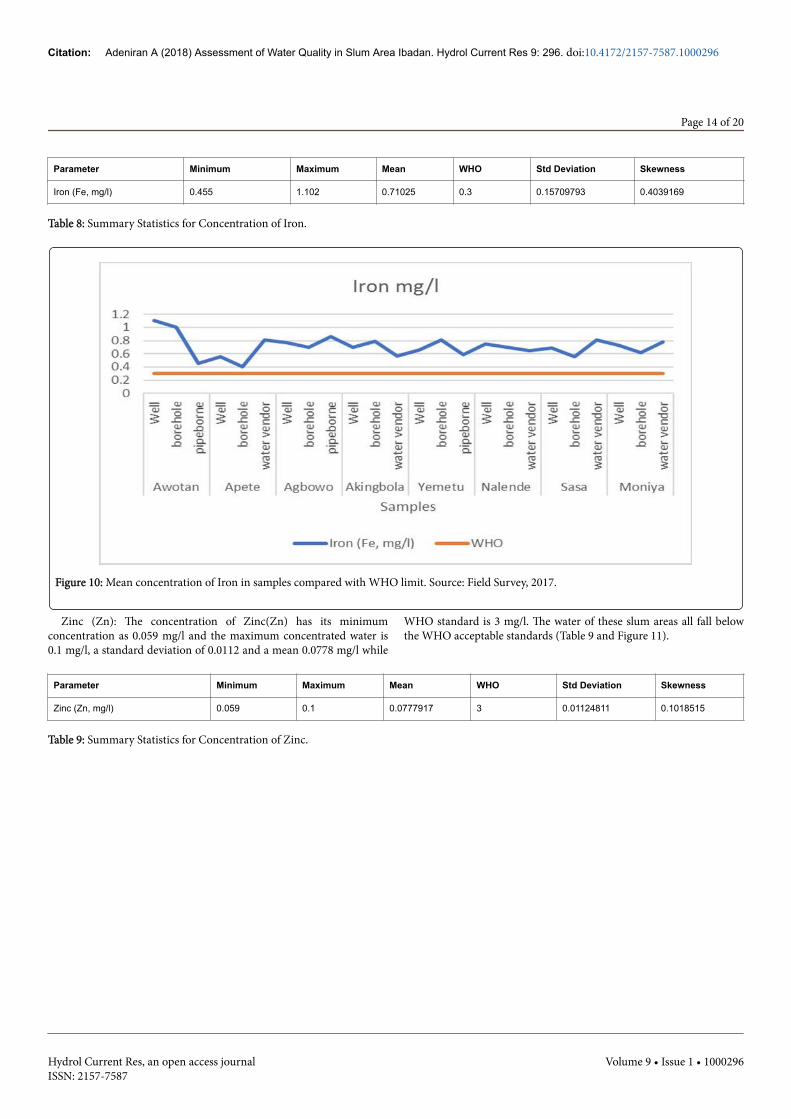
Iron (Fe): The result for Iron shows the the minimum concentrationof Iron(Fe) in the study area is 0.455 mg/l and the maximumconcentrated water is 1.102 mg/l, a standard deviation of 0.1571 and amean 0.710 mg/l while WHO standard is 0.3 mg/l. The valve obtainedfrom Awotan contain the highest contamination of Iron with sample 1(Awotan well) as high from the WHO standard with the value of 1.1mg/l with none of the water sampled at the same level with the WHOstandard (Table 8 and Figure 10).
Citation: Adeniran A (2018) Assessment of Water Quality in Slum Area Ibadan. Hydrol Current Res 9: 296. doi:10.4172/2157-7587.1000296
Page 13 of 20
Hydrol Current Res, an open access journalISSN: 2157-7587
Volume 9 • Issue 1 • 1000296
Parameter Minimum Maximum Mean WHO Std Deviation Skewness
Iron (Fe, mg/l) 0.455 1.102 0.71025 0.3 0.15709793 0.4039169
Table 8: Summary Statistics for Concentration of Iron.
Figure 10: Mean concentration of Iron in samples compared with WHO limit. Source: Field Survey, 2017.
Zinc (Zn): The concentration of Zinc(Zn) has its minimumconcentration as 0.059 mg/l and the maximum concentrated water is0.1 mg/l, a standard deviation of 0.0112 and a mean 0.0778 mg/l while
WHO standard is 3 mg/l. The water of these slum areas all fall belowthe WHO acceptable standards (Table 9 and Figure 11).
Parameter Minimum Maximum Mean WHO Std Deviation Skewness
Zinc (Zn, mg/l) 0.059 0.1 0.0777917 3 0.01124811 0.1018515
Table 9: Summary Statistics for Concentration of Zinc.
Citation: Adeniran A (2018) Assessment of Water Quality in Slum Area Ibadan. Hydrol Current Res 9: 296. doi:10.4172/2157-7587.1000296
Page 14 of 20
Hydrol Current Res, an open access journalISSN: 2157-7587
Volume 9 • Issue 1 • 1000296
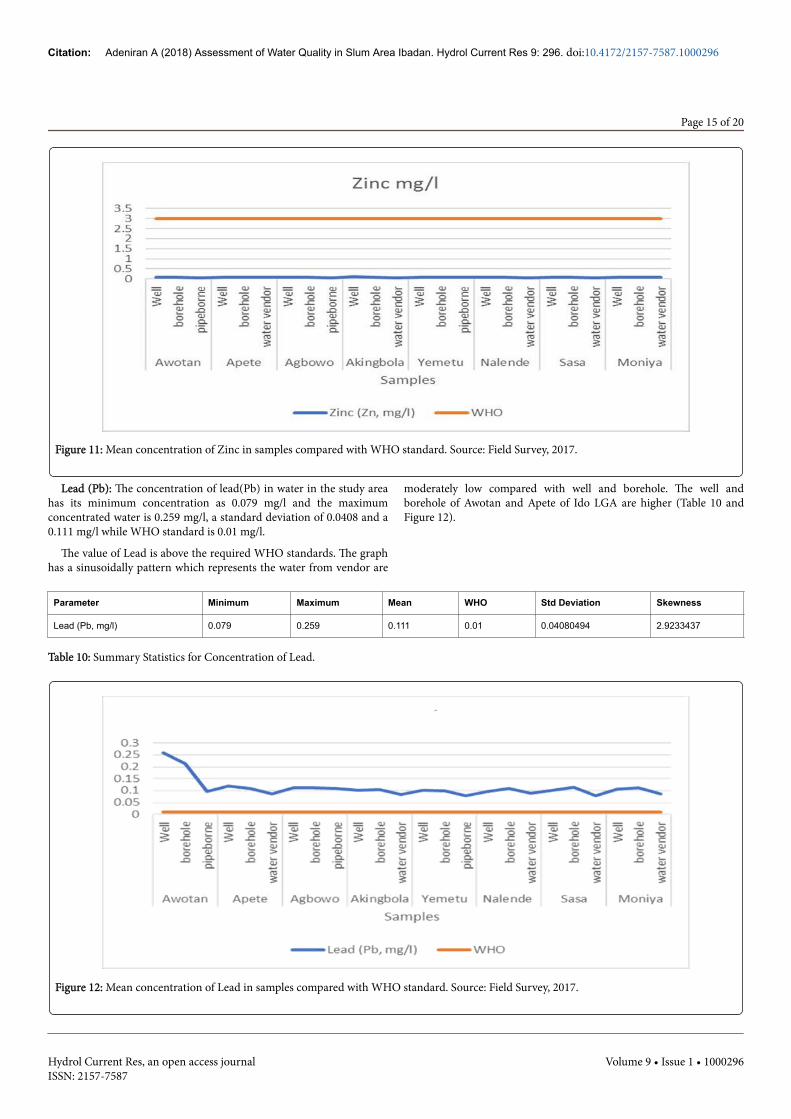
Figure 11: Mean concentration of Zinc in samples compared with WHO standard. Source: Field Survey, 2017.
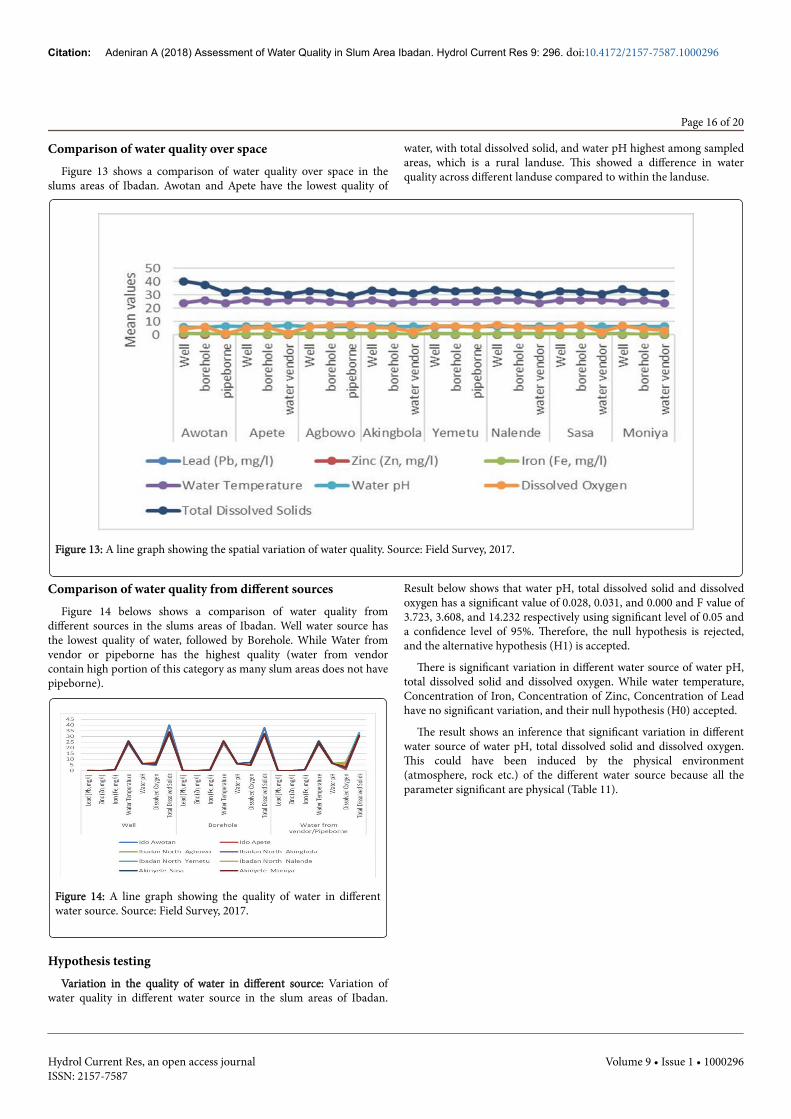
Lead (Pb): The concentration of lead(Pb) in water in the study areahas its minimum concentration as 0.079 mg/l and the maximumconcentrated water is 0.259 mg/l, a standard deviation of 0.0408 and a0.111 mg/l while WHO standard is 0.01 mg/l.
The value of Lead is above the required WHO standards. The graphhas a sinusoidally pattern which represents the water from vendor are
moderately low compared with well and borehole. The well andborehole of Awotan and Apete of Ido LGA are higher (Table 10 andFigure 12).
Parameter Minimum Maximum Mean WHO Std Deviation Skewness
Lead (Pb, mg/l) 0.079 0.259 0.111 0.01 0.04080494 2.9233437
Table 10: Summary Statistics for Concentration of Lead.
Figure 12: Mean concentration of Lead in samples compared with WHO standard. Source: Field Survey, 2017.
Citation: Adeniran A (2018) Assessment of Water Quality in Slum Area Ibadan. Hydrol Current Res 9: 296. doi:10.4172/2157-7587.1000296
Page 15 of 20
Hydrol Current Res, an open access journalISSN: 2157-7587
Volume 9 • Issue 1 • 1000296
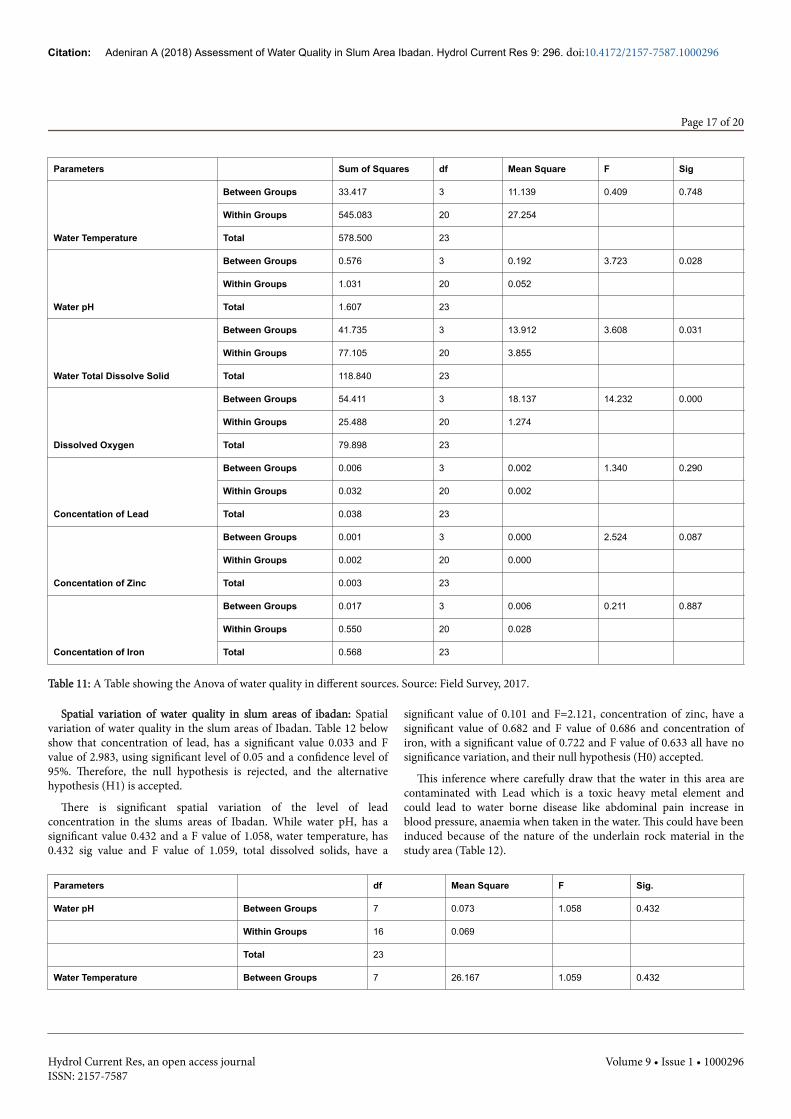
Comparison of water quality over spaceFigure 13 shows a comparison of water quality over space in the
slums areas of Ibadan. Awotan and Apete have the lowest quality of
water, with total dissolved solid, and water pH highest among sampledareas, which is a rural landuse. This showed a difference in waterquality across different landuse compared to within the landuse.
Figure 13: A line graph showing the spatial variation of water quality. Source: Field Survey, 2017.
Comparison of water quality from different sourcesFigure 14 belows shows a comparison of water quality from
different sources in the slums areas of Ibadan. Well water source hasthe lowest quality of water, followed by Borehole. While Water fromvendor or pipeborne has the highest quality (water from vendorcontain high portion of this category as many slum areas does not havepipeborne).
Figure 14: A line graph showing the quality of water in differentwater source. Source: Field Survey, 2017.
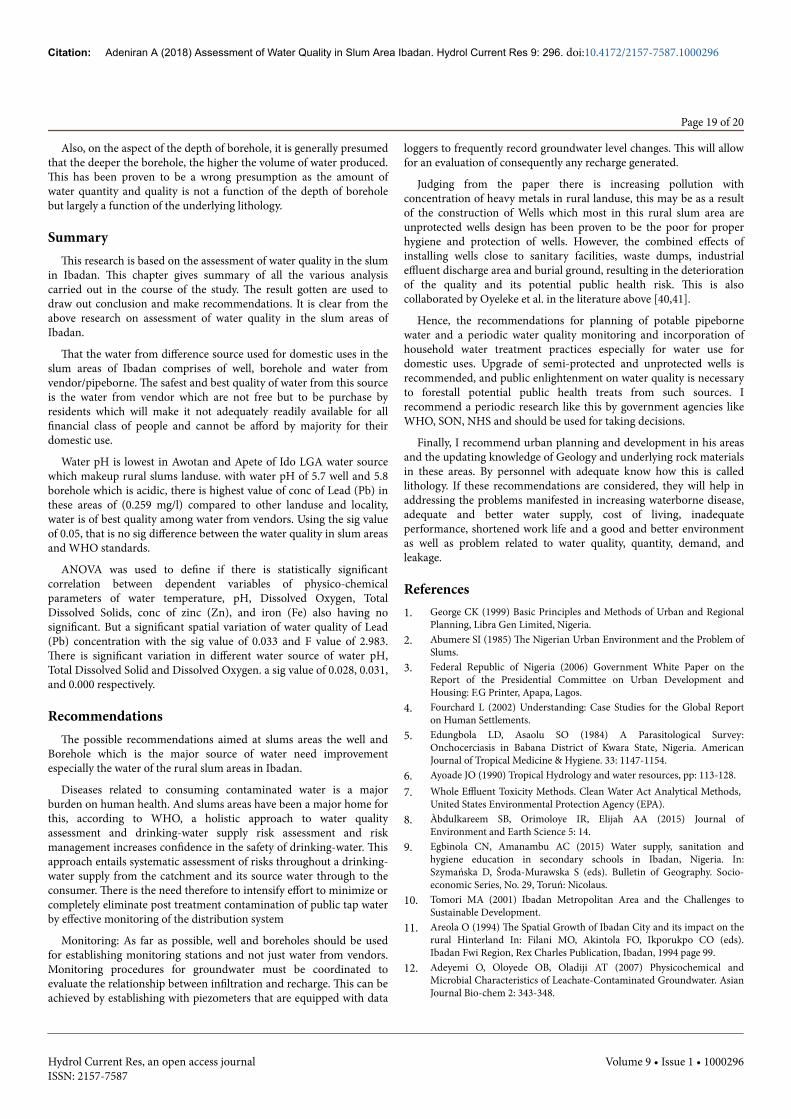
Hypothesis testingVariation in the quality of water in different source: Variation of
water quality in different water source in the slum areas of Ibadan.
Result below shows that water pH, total dissolved solid and dissolvedoxygen has a significant value of 0.028, 0.031, and 0.000 and F value of3.723, 3.608, and 14.232 respectively using significant level of 0.05 anda confidence level of 95%. Therefore, the null hypothesis is rejected,and the alternative hypothesis (H1) is accepted.
There is significant variation in different water source of water pH,total dissolved solid and dissolved oxygen. While water temperature,Concentration of Iron, Concentration of Zinc, Concentration of Leadhave no significant variation, and their null hypothesis (H0) accepted.
The result shows an inference that significant variation in differentwater source of water pH, total dissolved solid and dissolved oxygen.This could have been induced by the physical environment(atmosphere, rock etc.) of the different water source because all theparameter significant are physical (Table 11).
Citation: Adeniran A (2018) Assessment of Water Quality in Slum Area Ibadan. Hydrol Current Res 9: 296. doi:10.4172/2157-7587.1000296
Page 16 of 20
Hydrol Current Res, an open access journalISSN: 2157-7587
Volume 9 • Issue 1 • 1000296
Parameters Sum of Squares df Mean Square F Sig
Water Temperature
Between Groups 33.417 3 11.139 0.409 0.748
Within Groups 545.083 20 27.254
Total 578.500 23
Water pH
Between Groups 0.576 3 0.192 3.723 0.028
Within Groups 1.031 20 0.052
Total 1.607 23
Water Total Dissolve Solid
Between Groups 41.735 3 13.912 3.608 0.031
Within Groups 77.105 20 3.855
Total 118.840 23
Dissolved Oxygen
Between Groups 54.411 3 18.137 14.232 0.000
Within Groups 25.488 20 1.274
Total 79.898 23
Concentation of Lead
Between Groups 0.006 3 0.002 1.340 0.290
Within Groups 0.032 20 0.002
Total 0.038 23
Concentation of Zinc
Between Groups 0.001 3 0.000 2.524 0.087
Within Groups 0.002 20 0.000
Total 0.003 23
Concentation of Iron
Between Groups 0.017 3 0.006 0.211 0.887
Within Groups 0.550 20 0.028
Total 0.568 23
Table 11: A Table showing the Anova of water quality in different sources. Source: Field Survey, 2017.
Spatial variation of water quality in slum areas of ibadan: Spatialvariation of water quality in the slum areas of Ibadan. Table 12 belowshow that concentration of lead, has a significant value 0.033 and Fvalue of 2.983, using significant level of 0.05 and a confidence level of95%. Therefore, the null hypothesis is rejected, and the alternativehypothesis (H1) is accepted.
There is significant spatial variation of the level of leadconcentration in the slums areas of Ibadan. While water pH, has asignificant value 0.432 and a F value of 1.058, water temperature, has0.432 sig value and F value of 1.059, total dissolved solids, have a
significant value of 0.101 and F=2.121, concentration of zinc, have asignificant value of 0.682 and F value of 0.686 and concentration ofiron, with a significant value of 0.722 and F value of 0.633 all have nosignificance variation, and their null hypothesis (H0) accepted.
This inference where carefully draw that the water in this area arecontaminated with Lead which is a toxic heavy metal element andcould lead to water borne disease like abdominal pain increase inblood pressure, anaemia when taken in the water. This could have beeninduced because of the nature of the underlain rock material in thestudy area (Table 12).
Parameters df Mean Square F Sig.
Water pH Between Groups 7 0.073 1.058 0.432
Within Groups 16 0.069
Total 23
Water Temperature Between Groups 7 26.167 1.059 0.432
Citation: Adeniran A (2018) Assessment of Water Quality in Slum Area Ibadan. Hydrol Current Res 9: 296. doi:10.4172/2157-7587.1000296
Page 17 of 20
Hydrol Current Res, an open access journalISSN: 2157-7587
Volume 9 • Issue 1 • 1000296

Within Groups 16 24.708
Total 23
Water Total Dissolve Solid Between Groups 7 8.170 2.121 0.101
Within Groups 16 3.853
Total 23
Dissolved Oxygen Between Groups 7 3.774 1.129 0.393
Within Groups 16 3.343
Total 23
Concentation of Lead Between Groups 7 0.003 2.983 0.033
Within Groups 16 0.001
Total 23
Concentation of Zinc Between Groups 7 0.000 0.686 0.682
Within Groups 16 0.000
Total 23
Concentation of Iron Between Groups 7 0.018 0.633 0.722
Within Groups 16 0.028
Total 23
Table 12: A Table showing the Anova the spatial variation of water quality. Source: Field Survey, 2017.
Difference between the water quality in the study area and whostandards: Significant difference between the water quality in thisregion and WHO standards. The student one sample T test of twosample equal variable is =0.1750456, using the significant level of 0.05
and confidence interval of the difference of 95%. Since 0.350 is > than0.05. Therefore, the null hypothesis is accepted or retain. There is nosignificance difference between water quality and WHO standards(Table 13).
Paired Differences95% Confidence Interval ofthe Difference t DF Sig. (2tailed)
Mean Std. DeviationStd. ErrorMean Lower Upper
Pair 1
Mean ValuesWHOStandard -67.5 176.275 66.626 -230.528 95.526 1.01 6 0.35
Table 13: A Table showing the mean of parameters and WHO standards. Source: Field Survey, 2017.
ConclusionThe quantity of water is as important as the quality, since these affect
the quantity and the quality of available water, water quality is used toexpress the suitability of water and sustainable to various uses orprocesses. It is affected by a wide range of natural and humaninfluences, the most important of the natural influences is hydrologicalinfluence.
The water qualities study was carried out in Ibadan using threelanduse (urban, peri urban and rural) in slum areas of Ibadan wereevaluated for these physicochemical parameters: temperature, totaldissolved solid (TDS), pH, and dissolved oxygen (DO), from well,borehole, water from vendor or pipeborne, from 8 localities and 3 LGA
in Ibadan. The results showed variations in the water qualityparameters the slum areas.
The evaluation carried out therefore implies a significant spatialvariation of water quality of Lead concentration and a significantvariation in different water source of water pH, total dissolved solidand dissolved oxygen respectively. The quality of water depreciateswith landuse type from rural to urban and that, Rural slums area in Idolocal government in Awotan and Apete have less potable water, thewater quality in this area are acidic this can be because ofanthropogenic activities like agriculture and refuse dump with haveaffected the groundwater.
Citation: Adeniran A (2018) Assessment of Water Quality in Slum Area Ibadan. Hydrol Current Res 9: 296. doi:10.4172/2157-7587.1000296
Page 18 of 20
Hydrol Current Res, an open access journalISSN: 2157-7587
Volume 9 • Issue 1 • 1000296
Also, on the aspect of the depth of borehole, it is generally presumedthat the deeper the borehole, the higher the volume of water produced.This has been proven to be a wrong presumption as the amount ofwater quantity and quality is not a function of the depth of boreholebut largely a function of the underlying lithology.
SummaryThis research is based on the assessment of water quality in the slum
in Ibadan. This chapter gives summary of all the various analysiscarried out in the course of the study. The result gotten are used todraw out conclusion and make recommendations. It is clear from theabove research on assessment of water quality in the slum areas ofIbadan.
That the water from difference source used for domestic uses in theslum areas of Ibadan comprises of well, borehole and water fromvendor/pipeborne. The safest and best quality of water from this sourceis the water from vendor which are not free but to be purchase byresidents which will make it not adequately readily available for allfinancial class of people and cannot be afford by majority for theirdomestic use.
Water pH is lowest in Awotan and Apete of Ido LGA water sourcewhich makeup rural slums landuse. with water pH of 5.7 well and 5.8borehole which is acidic, there is highest value of conc of Lead (Pb) inthese areas of (0.259 mg/l) compared to other landuse and locality,water is of best quality among water from vendors. Using the sig valueof 0.05, that is no sig difference between the water quality in slum areasand WHO standards.
ANOVA was used to define if there is statistically significantcorrelation between dependent variables of physico-chemicalparameters of water temperature, pH, Dissolved Oxygen, TotalDissolved Solids, conc of zinc (Zn), and iron (Fe) also having nosignificant. But a significant spatial variation of water quality of Lead(Pb) concentration with the sig value of 0.033 and F value of 2.983.There is significant variation in different water source of water pH,Total Dissolved Solid and Dissolved Oxygen. a sig value of 0.028, 0.031,and 0.000 respectively.
RecommendationsThe possible recommendations aimed at slums areas the well and
Borehole which is the major source of water need improvementespecially the water of the rural slum areas in Ibadan.
Diseases related to consuming contaminated water is a majorburden on human health. And slums areas have been a major home forthis, according to WHO, a holistic approach to water qualityassessment and drinking-water supply risk assessment and riskmanagement increases confidence in the safety of drinking-water. Thisapproach entails systematic assessment of risks throughout a drinking-water supply from the catchment and its source water through to theconsumer. There is the need therefore to intensify effort to minimize orcompletely eliminate post treatment contamination of public tap waterby effective monitoring of the distribution system
Monitoring: As far as possible, well and boreholes should be usedfor establishing monitoring stations and not just water from vendors.Monitoring procedures for groundwater must be coordinated toevaluate the relationship between infiltration and recharge. This can beachieved by establishing with piezometers that are equipped with data
loggers to frequently record groundwater level changes. This will allowfor an evaluation of consequently any recharge generated.
Judging from the paper there is increasing pollution withconcentration of heavy metals in rural landuse, this may be as a resultof the construction of Wells which most in this rural slum area areunprotected wells design has been proven to be the poor for properhygiene and protection of wells. However, the combined effects ofinstalling wells close to sanitary facilities, waste dumps, industrialeffluent discharge area and burial ground, resulting in the deteriorationof the quality and its potential public health risk. This is alsocollaborated by Oyeleke et al. in the literature above [40,41].
Hence, the recommendations for planning of potable pipebornewater and a periodic water quality monitoring and incorporation ofhousehold water treatment practices especially for water use fordomestic uses. Upgrade of semi-protected and unprotected wells isrecommended, and public enlightenment on water quality is necessaryto forestall potential public health treats from such sources. Irecommend a periodic research like this by government agencies likeWHO, SON, NHS and should be used for taking decisions.
Finally, I recommend urban planning and development in his areasand the updating knowledge of Geology and underlying rock materialsin these areas. By personnel with adequate know how this is calledlithology. If these recommendations are considered, they will help inaddressing the problems manifested in increasing waterborne disease,adequate and better water supply, cost of living, inadequateperformance, shortened work life and a good and better environmentas well as problem related to water quality, quantity, demand, andleakage.
References1. George CK (1999) Basic Principles and Methods of Urban and Regional
Planning, Libra Gen Limited, Nigeria.2. Abumere SI (1985) The Nigerian Urban Environment and the Problem of
Slums.3. Federal Republic of Nigeria (2006) Government White Paper on the
Report of the Presidential Committee on Urban Development andHousing: F.G Printer, Apapa, Lagos.
4. Fourchard L (2002) Understanding: Case Studies for the Global Reporton Human Settlements.
5. Edungbola LD, Asaolu SO (1984) A Parasitological Survey:Onchocerciasis in Babana District of Kwara State, Nigeria. AmericanJournal of Tropical Medicine & Hygiene. 33: 1147-1154.
6. Ayoade JO (1990) Tropical Hydrology and water resources, pp: 113-128.7. Whole Effluent Toxicity Methods. Clean Water Act Analytical Methods,
United States Environmental Protection Agency (EPA).8. Àbdulkareem SB, Orimoloye IR, Elijah AA (2015) Journal of
Environment and Earth Science 5: 14.9. Egbinola CN, Amanambu AC (2015) Water supply, sanitation and
hygiene education in secondary schools in Ibadan, Nigeria. In:Szymańska D, Środa-Murawska S (eds). Bulletin of Geography. Socio-economic Series, No. 29, Toruń: Nicolaus.
10. Tomori MA (2001) Ibadan Metropolitan Area and the Challenges toSustainable Development.
11. Areola O (1994) The Spatial Growth of Ibadan City and its impact on therural Hinterland In: Filani MO, Akintola FO, Ikporukpo CO (eds).Ibadan Fwi Region, Rex Charles Publication, Ibadan, 1994 page 99.
12. Adeyemi O, Oloyede OB, Oladiji AT (2007) Physicochemical andMicrobial Characteristics of Leachate-Contaminated Groundwater. AsianJournal Bio-chem 2: 343-348.
Citation: Adeniran A (2018) Assessment of Water Quality in Slum Area Ibadan. Hydrol Current Res 9: 296. doi:10.4172/2157-7587.1000296
Page 19 of 20
Hydrol Current Res, an open access journalISSN: 2157-7587
Volume 9 • Issue 1 • 1000296
13. Turner J (1976) Housing by People: Towards Autonomy in Buildingenvironment. London. Labyrinth Publication Ltd.
14. Tisong DA (2011) Slum Improvement in Ghana: the Study of Aboabo andAsawase in Kumasi. Kwame Nkrumah University of Science andTechnology, Kumasi.
15. Turner JFC, Rolf G (1967) Environmental Security and Housing input.16. UN-HABITAT (2011) Assessing Slums in the Development Context
United Nations Habitat Group.17. UN-HABITAT (2007) Press Release on its report. The Challenge of
Slums: Global Report on Human Settlements 2003.18. UN-HABITAT (2002) Expert group meeting on slum indicators: Secure
tenure, slums and global sample of cities, UN-HABITAT, Nairobi, p: 21.19. Fernandez RF (2011) Physical and Spatial Characteristics of Slum
Territories Vulnerable to Natural Disasters. Les Cahiers d'Afrique de l'Est,n° 44, French Institute for Research in Africa.
20. Agbola T (1987) Urban Renewal: a case study of Lagos MetropolitanArea. In: Onibokun P, Olokesusi F, Egunjobi L (eds). Urban Renewal inNigeria, NISER, Ibadan.
21. Mabogunje AL (1968) Urbanization in Nigeria. University of LondonPress, London.
22. Cohen A (1973) Custom and Politics in Urban Africa. A Study of HausaMigrants in Yoruba Towns. University of California Press, Berkeley andLos Angeles.
23. Agbola T, Olatubara CO, Alabi M (2001) Student on-campus housing atbursting point.
24. Diersing N (2009) Water Quality: Frequently Asked Questions. FloridaBrooks National Marine Sanctuary, Key West, FL.
25. Johnson DL, Ambrose SH, Bassett TJ, Bowen ML, Crummey DE, et al.(1997) Meanings of environmental terms. Journal of EnvironmentalQuality 26: 581-589.
26. WaterAid (2011) Sustainability framework.27. Akinyode BF (1998) An appraisal of community improvement
programmes (CIP) in developing countries. A case study of Word BankAssisted Urban Renewal Project in Ibadan. Thesis for the Master of Urbanand Regional Planning, Ibadan.
28. McKenzie D (2009) Urban water supply in India: Status, reform optionsand possible lessons. Water Policy 11: 442-460.
29. Faniran A (1983) New Approach to Water Supply in DevelopingCountries: Cases from The Nigerian Situation. Nature Science Forum 7:271-275.
30. Gray NF (1999) Water technology: an introduction for environmentalscientists and engineers. An introduction to the engineering approach forcontrolling water pollution.
31. Benhaddya ML, Hadjel M (2013) Spatial distribution and contaminationassessment of heavy metals in surface soils of Hassi Messaoud, Algeria.Environ Earth Sci 71: 1473-1486.
32. Turekian KK, Wedepohl KH (1961) Distribution of the elements in somemajor units of the earth’s crust. Geol Soc Am Boll 72: 175-192.
33. WHO (2011) Guidelines for Drinking-water Quality. 4th edn, WorldHealth Organization.
34. WHO (2004) Guidelines for drinking-water quality. 3rd edn. Vol. 1,Geneva.
35. Canencia C, Oliva P, Dalugdug D, Marlou D, Emano E, et al. (2016)Slaughter waste effluents and river catchment watershed contaminationin Cagayan de Oro City, Philippines Research Gate 9: 2.
36. Oyeleke O (2015) Assessment of some heavy metals in the surroundingsoils of an automobile battery factory in Ibadan, Nigeria. African Journalof Environmental Science and Technology pp: 31-46.
37. Evans B, van der Voorden C, Peal A (2009) Public Funding forSanitation- The many faces of sanitation subsidies. Water Supply andSanitation Collaborative Council (WSSCC), Geneva, Switzerland, p: 35.
38. Ribeiro CHR, Araujo M (2002) Mathematical modelling as amanagement tool for water quality control of tropical Bieberibe estuary.NE Brazil.
39. Akpor B (2011) Challenges in meeting the MDGs: The Nigerian DrinkingWater Supply and Distribution Sector. Journal of Environmental Scienceand Technology 4: 480-489.
40. WHO/UNICEF/WSSCC (2004) Global water supply and sanitationassessment 2000 report, Geneva: World Health Organization/UnitedNations Children’s Fund Water Supply and Sanitation CollaborativeCouncil.
41. Oliver M (2005) At a Watershed: Ecological Governance and SustainableWater Management in Canada. University of Victoria, Canada.
Citation: Adeniran A (2018) Assessment of Water Quality in Slum Area Ibadan. Hydrol Current Res 9: 296. doi:10.4172/2157-7587.1000296
Page 20 of 20
Hydrol Current Res, an open access journalISSN: 2157-7587
Volume 9 • Issue 1 • 1000296