hydroinformatics and the web: analytics and dissemination
TRANSCRIPT

Hydroinformatics and the Web:Analytics and Dissemination of Hydrology Datafor Climate Change and Sustainability
DRASHTI PATHAK1, APARNA S. VARDE1,2, GERARD DE MELO3,4
and CLEMENT ALO2,5
1Department of Computer Science, Montclair State University, NJ, USA2Environmental Management PhD Program, Montclair State University, NJ, USA3Hasso Plattner Institute, University of Potsdam, Germany4Department of Computer Science, Rutgers University, NJ, USA5Dept. of Earth and Environmental Science, Montclair State Univ., NJ, USA
Climate change and global sustainability are among the most urgent concerns facing humanity.
One important aspect of this is hydrology, i.e., the scientific study of the movement, distributionand management of water. In light of the pervasiveness of Web technology and more broadly
of information and communication technology (ICT), this article presents an overview of recent
advances in Web data analytics for hydrology and hydroinformatics, via scientific perspectives,experiments, and tools pertaining to hydrology data and its relevance to areas such as climate
change. Researchers have conducted studies on hydrological problems that are spreading globally,
and the role of the Web is crucial here for providing ubiquitous access to information, enablingits efficient analysis and adequately disseminating the results via websites and apps. This aids in
predictive analytics and decision support. We address the management, mining, and dissemination
of hydrology data with the long-term goal of global sustainability. We survey classical and state-of-the-art works in hydroinformatics and the Web, also including recent COVID-19 related issues,
and discuss notable open avenues for future research both with regard to climate change as well
as the future of the Web.
DOI: 10.1145/3427478.3427481 http://doi.acm.org/10.1145/3427478.3427481
1. INTRODUCTION
Scientific applications have been among the principal drivers of the growth of the WorldWide Web ever since its conception at CERN in 1989. The numerous applications of theWeb now span the gamut of scientific domains. Scientists often rely on the Web as a use-ful platform for obtaining data, conducting lab studies, performing online experiments,exchanging results, and in recent times also invoking it as a medium for communication(as opposed to in-person meetings), thereby facilitating collaborator interactions, video-conferencing for seminars and much more. Since many scientific studies today are data-driven (rather than the traditional hypothesis-driven), various tools and techniques in datamining, machine learning and web data management play a significant role in automation,analysis and dissemination [Provost and Fawcett ; Aggarwal et al. 2019; Zadeh 2003]. In
SIGWEB Newsletter Autumn 2020

2 · Pathak et al.
fact, the realm of data science has evolved as a fairly multi-disciplinary area, spanning var-ious fields such as biology, medicine, climate science, engineering, economics and others[Gao et al. 2018; Grossman et al. 2001; Einav and Levin 2014].
In this article, we dwell on the broad field of climate science with particular focus onhydrology, i.e., the study of water. As we know, water is one of our most vital naturalresources, without which there would be no life on Earth. Hydrology is a science that hasevolved in response to the necessity to comprehend the complex water systems across theglobe and assist in providing solutions to water-related problems [United States Geologi-cal Survey 2019]. A related area is hydroinformatics, which considers information man-agement and analysis with respect to hydrology [Abbott 1991]. Today, hydroinformaticsleverages the advances in ICT (information and communication technology) in addition toclassical methodologies in data science for storing, processing and mining data, and usingthe discovered knowledge in pertinent applications. We present a survey on hydroinformat-ics in this article with respect to Web technology, considering its overall impact on climatechange and sustainability. We focus on how hydrology data is analyzed and broadcast tothe masses using cutting edge tools and techniques. We delve into papers on water datamanagement, mining and dissemination. Topics discussed in this article include precipi-tation studies, climate change, water quality management, cyber-infrastructure for waterresources, online modeling tools and techniques in hydrology, water contamination anal-ysis, websites and apps on hydroinformatics, and decision support in hydrology. We alsodiscuss water-related issues associated with the recent COVID-19 pandemic.
The analytical approaches harnessed in the works surveyed in this article span various datascience techniques such as regression analysis and artificial neural networks. Geospatialdata management is utilized in some works, while principles from Human Computer Inter-action (HCI) and Internet of Things (IoT) are deployed in others.
To the best of our knowledge, ours is one of the first surveys on Web data analytics anddissemination in hydrology and its impact on global sustainability. This survey article maybe particularly relevant to multi-disciplinary researchers working across data science andclimate science related areas. This includes Web development, data mining, HCI, IoT,climate change and geoinformatics.
The rest of this article is organized as follows. Section 2 addresses Web data managementand mining in the realm of hydrology, focusing mainly on analytics. Section 3 describesthe development of useful web systems and mobile applications in hydroinformatics, fo-cusing on dissemination and decision support. Section 4 addresses the recent COVID-19pandemic with respect to the theme of this article. Section 5 states the conclusions alongwith open issues for future work.
2. WEB DATA MANAGEMENT AND MINING IN HYDROINFORMATICS
Runoff Forecasting with Data Mining: Runoff refers to the draining away of water (andsubstances in it) from the surface of an area of land, building structures, etc. Runoff fore-casting is a nonlinear and complex process, useful for designing canals, planning watermanagement, predicting natural calamities such as floods and drought. Certain modelshave been developed for runoff forecasting with specific attention to flood and rainfall es-timation [Mishra et al. 2015]. These models have been developed by using AI and dataSIGWEB Newsletter Autumn 2020

Hydroinformatics and the Web · 3
mining with techniques such as regression analysis, clustering, artificial neutral networks(ANN), support vector machines (SVM), genetic algorithms (GA), rough sets, and fuzzylogic [Russell and Norvig 2020]. Hydrology data stored on the Web has been subjected toanalysis, mainly using the following methods.
—Clustering – used for grouping in order to monitor similarities between areas pertainingto rainfall, flood occurrence, and also water quality.
—Regression analysis – used for hypothesis testing, modeling the relationships betweenhydrological parameters, and for water quality assessment.
—Artificial Neural Networks (ANN) – used for computing models based on hydrologicaltime series data, the advantages being that they require less data, are capable for longduration forecasting and much more.
—Support Vector Machines (SVMs) – used for robust binary classification aiming to max-imize the accuracy of the different forecasting situations.
These techniques have been found particularly effective for hydrological prediction in dis-astrous situations such as flooding and are also useful for water resource management.While mathematical models have also been developed for this purpose, it is found thatthey require too much data and time involvement for forecasting and yet often only yieldmarginally superior results compared to more automated AI and data mining techniques.Hence, the approaches described herein are often preferred, especially given the fact thatdata evolves rapidly in this era of climate change, due to which rapid forecasting with effi-cient training is imperative. Since data is widely available on the Web today, its ubiquitousaccess with respect to the changing climate makes such AI-based predictive analytics agood choice.
Fig. 1: SWATshare online modeling results (left), HET rainfall-runoff views (right) [Merwade et al. 2012]
Educational Resources and Knowledge Discovery: Researchers [Merwade et al. 2012]have developed a GIS-infused model sharing platform called SWATShare (Soil Water As-sessment Tool Share). It endows students and educators with the ability to conduct simula-tions online, as well as to publish, share and visualize model results to study the impact ofland use change on hydrology. The SWATShare resource constitutes an online modelingenvironment. In addition, it is also useful to understand the water cycle of a watershed.Accordingly, a Hydrology Exploration Toolkit (HET) has been developed to access rain-fall and runoff views using web services, such that students can analyze data on specific
SIGWEB Newsletter Autumn 2020
4 · Pathak et al.
watersheds. Both SWATshare and HET are developed based on the WaterHUB systembuilt at Purdue University [Merwade et al. 2012]. The goal of WaterHUB is to arrangea cyber-infrastructure for education and training on water-related issues and offer guid-ance on how to save water. WaterHUB draws on the Structured Query Language (SQL)via MySQL [Oracle 2020] and is designed on the Purdue HUBzero framework, an opensource web-based scientific gateway system that provides a turnkey platform for users toaccess, use, share and contribute data as well as tools. Additionally, WaterHUB facilitatesonline teaching and learning activities via user groups, discussion forums, project wikis,ratings and citations.
Figure 1 portrays parts of SWATshare and HET. The left side shows a visualization ofonline modeling results from SWATshare while the right side depicts rainfall and runoffviews using HET. Systems such as SWATshare, HET and WaterHUB contribute to globalsustainability by addressing land use change (related to climate change), guiding people inwater-saving procedures and offering Web-based data exchange for education and trainingon hydrology. These systems harness technology in Web-based data management andknowledge discovery for educational resources in hydroinformatics.
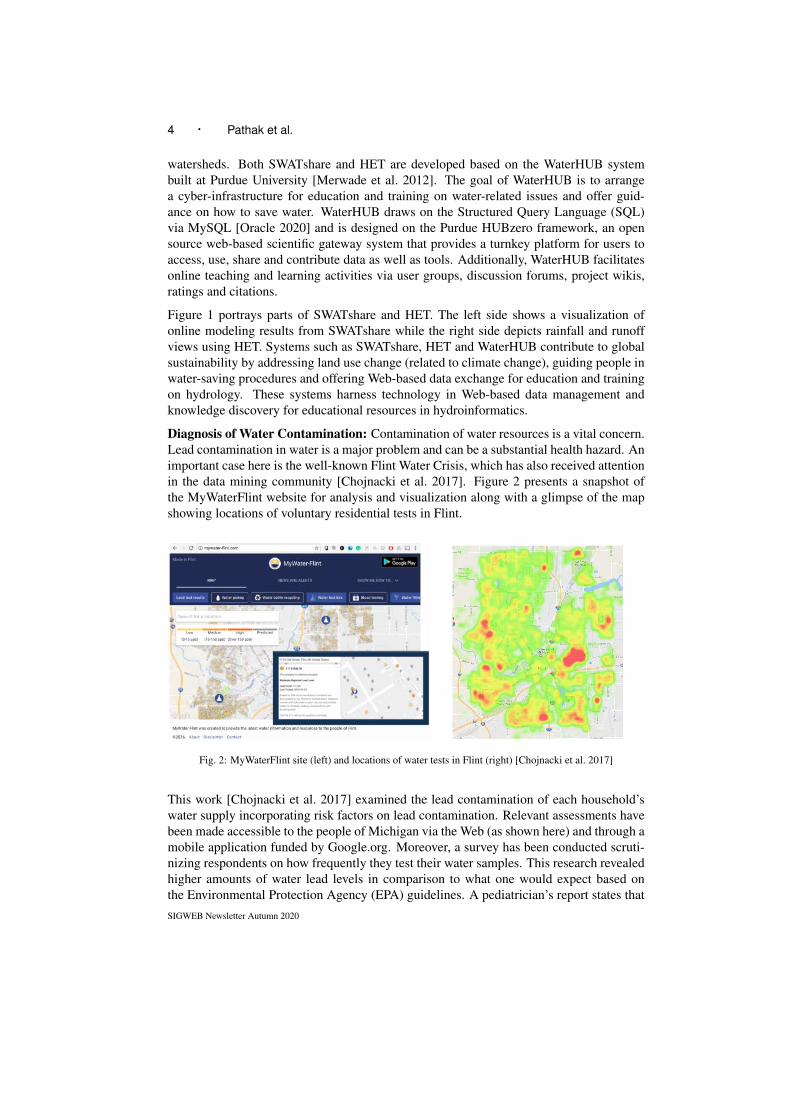
Diagnosis of Water Contamination: Contamination of water resources is a vital concern.Lead contamination in water is a major problem and can be a substantial health hazard. Animportant case here is the well-known Flint Water Crisis, which has also received attentionin the data mining community [Chojnacki et al. 2017]. Figure 2 presents a snapshot ofthe MyWaterFlint website for analysis and visualization along with a glimpse of the mapshowing locations of voluntary residential tests in Flint.
Fig. 2: MyWaterFlint site (left) and locations of water tests in Flint (right) [Chojnacki et al. 2017]
This work [Chojnacki et al. 2017] examined the lead contamination of each household’swater supply incorporating risk factors on lead contamination. Relevant assessments havebeen made accessible to the people of Michigan via the Web (as shown here) and through amobile application funded by Google.org. Moreover, a survey has been conducted scruti-nizing respondents on how frequently they test their water samples. This research revealedhigher amounts of water lead levels in comparison to what one would expect based onthe Environmental Protection Agency (EPA) guidelines. A pediatrician’s report states thatSIGWEB Newsletter Autumn 2020

Hydroinformatics and the Web · 5
there has been a drastic increase of lead levels in the blood of children from Flint. Pregnantwomen and elderly people have also been exposed to the lead in the water. This researchhas evaluated pertinent datasets, including residential water testing data, sentinel watertesting data, parcel data, service line data, and census block level data. These datasets havebeen used to further analyze the results of the lead contamination in water.
This research has aroused much attention and is still ongoing. Steps are being taken tofully eliminate the lead content in the water. Such work proves the effectiveness of dataanalytics with regard to crucial issues such as water contamination, which may severelyaffect health of the population. The related Website serves as a useful source of informationdissemination to the common public.
Analysis of Precipitation Data: Climate change can influence weather trends and pre-cipitation levels across the globe. Some areas experience excessive precipitation with thepossibility of flooding and landslides, while others receive very little precipitation with thepotential of drought, wildfires, agricultural problems, poor air quality and health issues.Scientists claim that rising temperatures due to global warming could increase evaporationand transpiration, causing excessive precipitation with adverse impacts [Kirschbaum andMcMillan 2018]. Globally disseminating and analyzing precipitation data is useful espe-cially in this age of ever-growing big data [Sellars et al. 2013]. Accordingly, precipitationstudies have been conducted in domains spanning climate science and data science. Agauge-based global dataset called REGEN is discussed in recent work [Contractor et al.2019]. It provides daily precipitation data on temporal land coverage for the period of1950–2013. As per REGEN, there are notable changes in rainfall from 1950 to 2013 inwell-gauged areas.
Fig. 3: Precipitation analysis tool: trendline (left), lasso selection view (right) [Karthikeyan et al. 2020]
An interactive tool for visualization and analysis of precipitation data has been devel-oped [Karthikeyan et al. 2020] to enable ubiquitous access and facilitate conducting stud-ies. This tool is customized for Sub-Saharan Africa since the region is among the mostseverely affected by climate change worldwide. This tool is designed to be particularlyuser-friendly, such that experts (e.g., data scientists, climate scientists) as well as the com-mon public (farmers, local planning agencies etc.) can easily comprehend its functionality.It deploys Web-based software such as ArcGIS (Aeronautical Reconnaissance CoverageGeographic Information System) [Environmental Systems Research Institute 2020] andTableau [Salesforce 2013]. ArcGIS is used for geoprocessing of big data of the order ofterabytes to extract meaningful information. Tableau is harnessed to provide dashboards,
SIGWEB Newsletter Autumn 2020

6 · Pathak et al.
trendlines, custom filters, zooming and panning, as well as rectangle, radial and lasso selec-tion. Figure 3 provides a glimpse into this tool. The left side shows a precipitation trend-line with a date filter, while the right side shows lasso selection (enabling users to drawfreehand shapes around given regions for specific views) along with a date and latitude–longitude filter. This tool on Sub-Saharan precipitation data facilitates the identification ofspecific regions needing attention in hydro-climate studies. It promotes future predictionsbased on past data. While this tool caters to Sub-Saharan Africa, the methods and softwaredescribed in this work can be applied to other world regions with adequate adaptation.
Such works in general [Contractor et al. 2019; Karthikeyan et al. 2020] exemplify theimportance of data science in recent precipitation studies. They address issues such asubiquitous information access via the Web and user-friendly analysis for the common pub-lic. They make broader impacts on climate change by providing relevant datasets andanalytical features for precipitation studies.
3. WEB SYSTEMS AND MOBILE APPLICATIONS FOR HYDROINFORMATICS
DSS for Water Resource Management: Modern information systems and technologiesare making efforts to find solutions and improve conditions of water resource managementand the hydrological modeling of river catchments. The knowledge on how to collect, storeand process information about the quantity, quality and distribution of water resources in ariver catchment has been studied [Iliev et al. 2010]. In this research, a Web-based decisionsupport system (DSS) helps in finding the best possible solutions on various problemsrelated to water resource management and its protection. Its functionalities include:
—Calculating operations in specialized applications on hydrological data processing andeconomic activities
—Assisting decision-making in river basin water management via digital maps and geo-graphic information
—Finding preventive measures for protection from catastrophes—Searching index data, documents, video and audio information in water related knowl-
edge bases—Organizing seminars, briefings etc. on water management with national and international
coordination
The architecture of this Web-based DSS comprises several components including Web-based services, geographic information, communication centers etc. The system is illus-trated in Figure 4. This DSS has been developed in Bulgaria and is targeted towards re-gional water resource management, aiding in its case studies. Yet it has global impact withrespect to its functionalities, and its architecture can be deployed in similar systems else-where. This DSS exemplifies the use of Web technology in conjunction with GIS and otherfeatures to provide a useful platform for Web-based dissemination of valuable hydrologicalinformation, helpful in achieving sustainable solutions to water management.
Apps for Hydroclimatic Parameters: There are parameters related to hydrology dataand climate such as precipitation and humidity. It is important to gain access to such dataanywhere, anytime to facilitate decision-making by local government bodies and to provideSIGWEB Newsletter Autumn 2020

Hydroinformatics and the Web · 7
Fig. 4: Architecture of Web-based DSS for water resource management [Iliev et al. 2010]
valuable information to the common public, in addition to offering ubiquitous informationretrieval and predictive analytics to scientists. This motivates the development of apps toretrieve information on hydroclimatic parameters and provide suitable predictions on theirfuture values. Data in the respective domains as well as techniques in data science are veryimportant in app development [Basavaraju and Varde 2016]. Such apps may be gearedtowards specific geolocations.
An Android app has been developed for disseminating precipitation data in Sub-SaharanAfrica [Karthikeyan et al. 2020]. This app takes a particular geolocation and date as itsinput and displays the average, minimum, maximum and total precipitation in that loca-tion, thus providing key local data at-a-glance. This can be particularly useful for dataanalytics in agricultural studies. Rain-fed agriculture is a kind of farming relying on rain-fall for water, and accounting for more than 95% of farmed land in Sub-Saharan Africa(also 90% in Latin America, 75% in the Near East and North Africa, 65% in East Asiaand 60% in South Asia) [Serdeczny et al. 2016]. Information retrieval for precipitationdata can thus benefit rain-fed agriculture by aiding in crop cultivation-related planning ac-tivities. An easily accessible Sub-Saharan African precipitation app can offer localizedinformation to farmers and other residents to plan daily activities and make key decisions,thereby enhancing global sustainability. This Sub-Saharan precipitation app leverages theNetwork Common Data Format (NetCDF) [Rew and Davis 1990] to collect precipitationdata from climate science sources, and ArcGIS [Environmental Systems Research Institute2020] for mapping and conversion of the data into a SQLite (Structured Query Languagelightweight) format [Bentley et al. 2019] in order to proceed with KB (Knowledge Base)development. It has a geocoder mapping API (Application Programming Interface) to mapthe respective geolocation to a latitude–longitude value, climatic modeling to connect thelatitude–longitude values to precipitation values, and an app user interface to serve theoutput to the user on different kinds of devices, including IoT ones.
Principles from Human-Computer Interaction [Rogers et al. 2015] are important in design-ing such apps. For instance, this Sub-Saharan precipitation app draws on metaphors asillustrative descriptions of a concept, e.g., clouds and droplets to depict rainfall. The de-sign follows Fitt’s Law [Boritz and Cowan 1991], which states that the time to retrieve anobject is directly proportional to its size and inversely proportional to its distance from theopening screen. This entails striving to render objects (metaphors, buttons, entry fields etc.)
SIGWEB Newsletter Autumn 2020

8 · Pathak et al.
sufficiently large for users to spot them easily, yet sufficiently small to fit on a single screen.It is also advisable to maintain simple navigation such that all objects are easily reachablefrom the opening screen for the users to find them quickly. Additionally, its design hasbeen based on ethnographic studies [Rogers et al. 2015] to obtain thorough knowledge ofthe concerned domain via observation and analysis. For this app, Sub-Saharan Africa hasbeen studied with regard to its geography, the bare necessities of people etc., in addition tothe knowledge of climate scientists to guide app development.
Fig. 5: Snapshot of prediction with hydro-climate data app in NJ Passaic [Pathak et al. 2019]
Another mobile app for hydro-climate data in the NJ Passaic region [Pathak et al. 2019]goes beyond information retrieval. A snapshot of the input and output displayed by thisapp is depicted in Figure 5. The app provides predictions of future hydroclimatic parametervalues in addition to retrieving those from the past, pertaining to specific locations. Ittargets climate scientists, government bodies, small business owners as well as generalresidents. The input to the app is the name of a given geolocation (which is mapped tolatitude–longitude geo-coordinates), a date (past or future up to 2075), temperature unit(Celsius / Fahrenheit) and a preferred climatic model for prediction with a link to thedescription of each model (default used if no selection). The output constitutes recordedor estimated values for average precipitation, average humidity as well as maximum andminimum temperatures for that geolocation and date. HCI and IoT considerations similarto those for the Sub-Saharan precipitation app are used in the design and development ofthis hydro-climate data app for NJ Passaic. The climatic models used for prediction inthis app are CCSM (Community Climate System Model) [Gent et al. 2011], MRI CCGM(Meteorological Research Institute model of Japan) [Yukimoto et al. 2012], and BCC CSM(Beijing Climate Center Climate System Model) [Beijing Climate Center 2012], which arewidely studied in climate science. The default model is MRI CCGM [Yukimoto et al.2012], since it is the most feasible model with the highest global acceptance as found fromethnographic studies, interviews with stakeholders and particularly the inputs of domainexperts in climate science involved with this work.
Apps for Water Quality Information: The quality of water is critical, not only for drink-ing and cooking, but also for additional purposes such as bathing. This motivates the devel-opment of mobile applications (apps) for ubiquitous access to water quality information.SIGWEB Newsletter Autumn 2020

Hydroinformatics and the Web · 9
In an interesting piece of work [Jonoski et al. 2013] that is part of an EU (European Union)research project in hydroinformatics, apps are made available to people for adequate wa-ter quality information management. The focus is on outdoor recreational activities, e.g.,swimming and bathing. These mobile phone apps are integrated with Web applications.
Fig. 6: Feedback messages from water quality app users [Jonoski et al. 2013]
The water quality model here employs the open source MOHID modeling package1 basedon the MOHID system [Viegas et al. 2009]. This is a nonlinear 3D hydrological modelingsystem with object-oriented programming, combining various mathematical models andproviding GUIs (graphical user interfaces) for pre-processing and post-processing. Theapps rely on the Google Maps API for location-tracking. These apps foster bidirectionalcommunication on water quality between water management authorities and end-users,i.e., the common public. Water quality alerts are provided to end users for giving them up-dates from the management authorities using simple terms such as “swimming allowed”,“swimming not advisable” etc. The end-users in turn can provide any feedback for assis-tance needed via the apps. Figure 6 depicts mobile phone feedback messages incorporatedinto the Website within which the apps are integrated.
In two case studies conducted using these apps on regions in the Netherlands, it has beenfound that the apps are very effective. Overall, this work [Jonoski et al. 2013] indicates the
1Available at the site http://www.mohid.com
SIGWEB Newsletter Autumn 2020

10 · Pathak et al.
importance of hydroinformatics in applications pertaining to sports and recreation. Whilethese may be of secondary importance compared to potable water and crisis management,they are examples of advances in sustainable living, especially beneficial to smart cities.
Cloud-based Water Quality Monitoring: Since water is indispensable, it should be mon-itored and maintained very carefully, and waste should be avoided. In order to ascertaina high potable water quality and also to prevent contamination, methods for water qualitymonitoring (WQM) with the help of wireless sensor networks (WSNs) and the cloud havebeen proposed [Adu-Manu et al. 2017]. The authors of the study emphasize that whilearound 71% of the world is filled with water, only 2.5% of this is fresh water; and that insome African countries, approximately 3/4 of the drinking water is derived from under-ground sources. Hence, the monitoring of water quality is highly critical. The presentedWQM, as illustrated in Figure 7, uses online Web-based storage via the cloud along withremote monitoring stations. As found in recent surveys, e.g., [Chandra et al. 2019; Pawlishand Varde 2018] spanning several works, cloud-based systems offer adequate services insuch large scale applications. Likewise in this WQM system, information retrieval, anal-ysis and reporting are all conducted using cloud services. The system deploys WSNs fordata acquisition and transfer. The standard use case is to check the quality of water withregard to any chemical, physical and biological properties, while also analyzing water con-ditions. The WQM system ensures that there is a freshwater source in rivers, lakes, ponds,streams and much more.
Fig. 7: Water quality monitoring system using cloud technology [Adu-Manu et al. 2017]
This cloud-based WQM deploying WSNs overcomes the drawbacks of manual WQM sys-tems, mainly for the following reasons:
—Sensors and cloud services enable collection of consistent hydrology data
—Frequent sampling of water quality is easily achievable
—Measurements of water quality can be conveyed to targeted users for real-time analysis
—User feedback can be applied to alter sampling frequencies for enhanced performance
Systems of this sort in the realm of hydroinformatics have substantial potential for impacton global sustainability, particularly in regions with water scarcity or in times of crisis.SIGWEB Newsletter Autumn 2020

Hydroinformatics and the Web · 11
4. COVID-19 AND HYDROLOGY
The recent coronavirus global pandemic has caused substantial hardship and concern.While this has led to doctors and other healthcare professionals rush to the need of thehour, it has also made numerous researchers from multiple domains focus their effortson contributing towards the analysis, diagnosis, prevention of spread as well as investiga-tion of potential treatments and vaccines for COVID-19. This accounts for health, social,economic and other issues. Data science has played a crucial role in much of this researchproviding techniques for analysis and dissemination. This also applies to hydrology-relatedinvestigations. Not all observations are negative. Some water sources have become cleanerdue to the COVID-19 lockdown, as e.g. depicted in Figure 8. The image from 2020 (right)is clear enough to show what lies beneath the surface of the water in the Venice canals.
Fig. 8: Venice canals 2019 (left), 2020 (right); cleared in COVID-19 lockdown [European Space Agency 2020]
Fig. 9: Spatial variation of in-house access to basic needs in Sub-Saharan Africa [Ekumah et al. 2020]
SIGWEB Newsletter Autumn 2020

12 · Pathak et al.
COVID-19 and Water-Related Amenities: Some researchers [Ekumah et al. 2020] ad-dress the issue of how the COVID-19 pandemic has extensively affected humanity overallin the Sub-Saharan African region. Clearly, basic amenities such as water, food and sani-tation are essential, and hence some people who are not able to easily access these needsmay have to leave their homes during the lockdown. In such cases, the risk of them gettingaffected by COVID-19 and also causing further spread of the disease may increase. There-fore certain preventive measures are taken by governmental organizations in the respectiveregions, such as to infuse innovative gender and age sensitive support services. Theseinclude water supply and portable sanitation in order to facilitate adherence to the pre-ventive measures recommended by healthcare experts, i.e., maintaining social distancing,hand-washing, and partial or total lockdowns.
Figure 9 depicts a map of Sub-Saharan Africa with spatial variations of in-house access tobare necessities, including water and other amenities [Ekumah et al. 2020]. This enablesat-a-glance views of the proactive measures taken by the organizations in the respectiveregions. These views are useful to healthcare professionals and others aiming to provideimmediate help, and to data scientists and environmental researchers conducting furtherstudies in these areas. Such views assist analysis for scientific and economic purposes.
Correlation of Climatic Parameters and COVID-19: A recent article [Wu et al. 2020]addresses the global crisis of COVID-19 with respect to the greatest challenges encoun-tered based on climatic parameters such as humidity. It analyzes the effects of temperatureand relative humidity on daily new cases and daily new deaths due to COVID-19. It alsoreemphasizes the fact that elderly people and patients with pre-existing medical problemsare at higher risk if infected by COVID-19. Their findings suggest that temperature and rel-ative humidity are both negatively correlated with daily new COVID-19 cases and deaths.This is illustrated in Figure 10, which presents a graphical plot of these parameters versusCOVID-19 case counts [Wu et al. 2020].
Such data may be useful in epidemiological and medical studies on COVID-19, as it revealsinteresting information on the relationships between climatic conditions and COVID-19.Findings of this sort have the potential to ultimately provide guidance regarding recom-mended preventive measures for COVID-19 from a climate standpoint.
Impacts of COVID-19 on Water Consumption: Studies based on water consumption andCOVID-19 proffer interesting experiments and results. A notable study [Kalbusch et al.2020] focuses on the preventive measures being taken on water consumption in Joinville,Southern Brazil due to COVID-19. Certain analyses have been conducted on the waterconsumption of different categories of users, i.e., those in commercial, industrial, public,and residential buildings. Water consumption data has been gathered by remote telemetry,via the deployment of IoT sensors attached to consumption meters of the water distributionsystems in the respective types of buildings. The results suggest that the COVID-19 spreadprevention measures have had a significant impact on urban water consumption.
Figure 11 provides box-plots symbolizing water consumption before and after the deploy-ment of measures to avoid contagion by COVID-19 [Kalbusch et al. 2020]. One of theobservations is a decrease in commercial, industrial and public usage of water, and a slightincrease in the residential consumption of water. This accords with the idea of peoplespending less time at their workplaces and in public areas and more time at home. Such
SIGWEB Newsletter Autumn 2020

Hydroinformatics and the Web · 13
Fig. 10: Effects of temperature, relative humidity on daily new COVID-19 cases/deaths [Wu et al. 2020]
analyses are useful to comprehend the diverse effects of the pandemic on water consump-tion and provide useful inputs for related studies.
Fig. 11: Box-plots before (0) and after (1) COVID-19 preventive measures [Kalbusch et al. 2020]
All the works surveyed in this section indicate how significant data science related tech-niques are in addressing the recent global pandemic. Statistical metrics, geo-maps, graph-ical plots and various analytical methods help in understanding relationships between pa-rameters, while Web technology aids in broadcasting the relevant data and the experimentalresults to the concerned audience. We have only focused on hydrological information perti-nent to COVID-19 in this section, since the theme of this survey article is hydroinformatics.In general, data science has a played a remarkable role in dealing with this pandemic.
SIGWEB Newsletter Autumn 2020

14 · Pathak et al.
5. CONCLUSIONS AND OPEN ISSUES
In this survey article, we delve into the realm of hydroinformatics, with particular referenceto the role of Web technology and data science. To the best of our knowledge, this isamong the first few surveys in the area of hydroinformatics and the Web. We addressWeb data management and mining in hydrology with respect to analytics, and Web-basedsystems along with mobile applications with respect to dissemination. We also brieflycover research pertaining to the COVID-19 pandemic relevant to hydroinformatics.
The theme of this article sparks much interest, proffering the scope for further research. Afew open avenues based on the works surveyed herein are as follows.
(1) Investigating deep learning techniques in detail for issues such as runoff forecasting
(2) Evaluating traditional mathematical models in hydrology and heuristic models in hy-droinformatics with comparative studies
(3) Building more educational tools in pertinent areas such as climate science and envi-ronmental management based on the advances in data science, especially Web andcloud technologies
(4) Deploying transfer learning on big data in hydroinformatics, urban studies and COVID-19 analysis to achieve efficient and accurate results in targeted applications
(5) Implementing more apps on both Android as well as iOS platforms to further enhanceubiquitous access of information in hydroinformatics and related areas, thus contribut-ing to smart living and smart mobility
(6) Learning from the results of some studies herewith to solve water-related problemssuch as contamination, thus contributing to smart environment and healthcare
(7) Conducting opinion mining on social media posts of the public in various regions togauge their reactions on water-related policies via sentiment analysis, and conveyingfeedback to urban agencies in line with transparency for smart governance
(8) Contributing further to the diagnosis, prevention and cure of COVID-19 with datascience related research and development, relevant to hydrology as well as other areas
We ourselves are considering further work on mining hydrological data from social mediaposts, based on the success of some of our earlier projects in relevant areas [Puri et al.2018; Gandhe et al. 2018; Varghese et al. 2020], along with the fact that social mediamining is of remarkable interest today in domain-specific applications as found from manystudies [Du et al. 2019; Dahal et al. 2019; Sachdeva et al. 2016; Wang et al. 2017]. Theparadigm of the geo-social web [Scellato 2011], entailing aspects such as socio-spatialfeatures and location-as-a-service, provides challenging opportunities for further researchas well. This is especially with reference to geo-informatics that constitutes a broaderrealm, encompassing hydroinformatics and related areas. Overall, we conclude that there isample opportunity for impact in the area of hydrology and the Web, including analytics anddissemination of data. Such impact may benefit climate change and global sustainability,which clearly merit substantial consideration and effort.SIGWEB Newsletter Autumn 2020

Hydroinformatics and the Web · 15
ACKNOWLEDGMENTS
Aparna Varde receives support through the Faculty Scholarship Program in Computer Sci-ence and the Doctoral Faculty Program in Environmental Management at Montclair StateUniversity. She has obtained external research grant funding through PSEG (NJ), NSF(USA) and internal funding through the SGPD grant at Montclair. Clement Alo is sup-ported by the Faculty Scholarship and Doctoral Faculty programs at Montclair State Uni-versity, and has received funding from the Institute for Sustainability Studies therein.
REFERENCES
ABBOTT, M. B. 1991. Hydroinformatics: information technology and the aquatic environment. Avebury Tech-nical, Aldershot, UK.
ADU-MANU, K. S., TAPPARELLO, C., HEINZELMAN, W. B., KATSRIKU, F. A., AND ABDULAI, J. 2017.Water quality monitoring using wireless sensor networks: Current trends and future research directions. ACMTransactions on Sensor Networks 13, 1, 4:1–4:41.
AGGARWAL, C. C., BOUNEFFOUF, D., SAMULOWITZ, H., BUESSER, B., HOANG, T., KHURANA, U., LIU,S., PEDAPATI, T., RAM, P., RAWAT, A., WISTUBA, M., AND GRAY, A. G. 2019. How can AI automateend-to-end data science? CoRR abs/1910.14436.
BASAVARAJU, P. AND VARDE, A. S. 2016. Supervised learning techniques in mobile device apps forAndroids.ACM SIGKDD Explorations 18, 2, 18–29.
BEIJING CLIMATE CENTER, B. 2012. Climate System Model. http://forecast.bcccsm.ncc-cma.net/web/channel-43.htm.
BENTLEY, BLOOMBERG, NAVIGATION DATA STANDARD, AND EXPENSIFY. 2019. SQLite Database bySQLite Consortium. https://www.sqlite.org/index.html.
BORITZ, J. AND COWAN, W. B. 1991. Fitts’s law studies of directional mouse movement. In Graphics Interface(GI). 216–223.
CHANDRA, S., VARDE, A. S., AND WANG, J. 2019. A Hive and SQL case study in cloud data analytics. InIEEE Annual Ubiquitous Computing, Electronics & Mobile Communication Conference, UEMCON. 112–118.
CHOJNACKI, A., DAI, C., FARAHI, A., SHI, G., WEBB, J., ZHANG, D. T., ABERNETHY, J. D., AND
SCHWARTZ, E. M. 2017. A data science approach to understanding residential water contamination in Flint.In ACM KDD Conference. 1407–1416.
CONTRACTOR, S., DONAT, M., ALEXANDER, L., ZIESE, M., MEYER-CHRISTOFFER, A., SCHNEIDER, U.,RUSTEMEIER, E., BECKER, A., DURRE, I., AND VOSE, R. 2019. Rainfall estimates on a gridded network(REGEN) – a global land-based gridded dataset of daily precipitation from 1950–2013. Hydrology and EarthSystem Sciences Discussions, 1–30.
DAHAL, B., KUMAR, S., AND LI, Z. 2019. Topic modeling and sentiment analysis of global climate changetweets. Social Network Analysis and Mining, Springer 9, 24.
DU, X., KOWALSKI, M., VARDE, A. S., DE MELO, G., AND TAYLOR, R. W. 2019. Public opinion matters:Mining social media text for environmental management. ACM SIGWEB Newsl. 2019, Autumn, 5:1–5:15.
EINAV, L. AND LEVIN, J. 2014. Economics in the age of big data. Science 346, 6210.EKUMAH, B., ARMAH, F. A., YAWSON, D. O., QUANSAH, R., NYIEKU, F. E., OWUSU, S. A., ODOI, J. O.,
AND AFITIRIA, A.-R. 2020. Disparate on-site access to water, sanitation, and food storage heighten the riskof COVID-19 spread in sub-saharan africa. Environmental Research 189.
ENVIRONMENTAL SYSTEMS RESEARCH INSTITUTE, E. 2020. ArcGIS Online. https://www.arcgis.com/index.html.
EUROPEAN SPACE AGENCY, E. 2020. Deserted Venetian Lagoon. https://www.esa.int/ESA_Multimedia/Images/2020/04/Deserted_Venetian_lagoon.
GANDHE, K., VARDE, A., AND DU, X. 2018. Sentiment analysis of Twitter data with hybrid learning for rec-ommender applications. In IEEE Ubiquitous Computing, Electronics and Mobile Communications Conference(UEMCON). New York, NY, 57–63.
GAO, X., CHEN, J. Y., AND ZAKI, M. J. 2018. Multiscale and multimodal analysis for computational biology.IEEE ACM Transactions on Computational Biology and Bioinformatics 15, 6, 1951–1952.
SIGWEB Newsletter Autumn 2020

16 · Pathak et al.
GENT, P., DANABASOGLU, G., DONNER, L., HOLLAND, M., HUNKE, E., JAYNE, S., LAWRENCE, D.,NEALE, R., RASCH, P., VERTENSTEIN, M., WORLEY, P., YANG, Z., AND ZHANG, M. 2011. The com-munity climate system model version 4. Journal of Climate 24, 19, 4973–4991.
GROSSMAN, R., KAMATH, C., KUMAR, V., KEGELMEYER, P., AND NAMBURU, R. 2001. Data Mining forScientific and Engineering Applications. Kluwer Academic Publishers.
ILIEV, R., KIRILOV, L., AND BOURNASKI, E. 2010. Web-based decision support system in regional waterresources management. In ACM CompSysTech (International Conference on Computer Systems and Tech-nologies). 323–328.
JONOSKI, A., ALMORADIE, A., KHAN, K., POPESCU, I., AND VAN ANDEL, S. 2013. Google Android mobilephone applications for water quality information management. Journal of Hydroinformatics, 1137–1149.
KALBUSCH, A., HENNING, E., BRIKALSKI, M. P., DE LUCA, F. V., AND KONRATH, A. C. 2020. Impactof coronavirus (COVID-19) spread-prevention actions on urban water consumption. Elsevier Public HealthEmergency Collection.
KARTHIKEYAN, D., SHAH, S., VARDE, A., AND ALO, C. 2020. Interactive visualization and app developmentfor precipitation data in Sub-Saharan Africa. In IEEE IEMTRONICS - International IoT, Electronics andMechatronics Conference.
KIRSCHBAUM, M. AND MCMILLAN, A. 2018. Warming and elevated CO2 have opposing influences on tran-spiration: Which is more important? Current Forestry Reports Journal 1, 21, 10.
MERWADE, V., FENG, W., ZHAO, L., AND SONG, C. 2012. WaterHUB a resource for students and educatorsfor learning hydrology. In ACM XSEDE (Extreme Science and Engineering Discovery Environment).
MISHRA, S., SARAVANAN, C., AND DWIVEDI, V. 2015. Study of time series data mining for real time hydro-logical forecasting. International Journal of Computer Applications, 6–17.
ORACLE. 2020. MySQL enterprise edition. https://www.mysql.com/.PATHAK, D., VARDE, A. S., ALO, C., AND OTENG, F. 2019. Ubiquitous access for local water management
through HCI based app development. In IEEE Annual Ubiquitous Computing, Electronics & Mobile Commu-nication Conference, UEMCON. 227–233.
PAWLISH, M. J. AND VARDE, A. S. 2018. The DevOps paradigm with cloud data analytics for green businessapplications. ACM SIGKDD Explorations 20, 1, 51–59.
PROVOST, F. AND FAWCETT, T. Data science and its relationship to big data and data-driven decision making.Big Data 1, 1, 51–74.
PURI, M., DU, X., VARDE, A., AND DE MELO, G. 2018. Mapping ordinances and tweets using smart citycharacteristics to aid opinion mining. In The Web Conference (WWW) Companion Volume. Lyon, France,1721–1728.
REW, R. AND DAVIS, G. 1990. NetCDF: An interface for scientific data access. IEEE Computer Graphics andApplications 10, 4, 76–82.
ROGERS, Y., SHARP, H., AND PREECE, J. 2015. Interaction Design: Beyond Human-Computer Interaction,4th ed. Wiley.
RUSSELL, S. AND NORVIG, P. 2020. Artificial Intelligence: A Modern Approach, 4th ed. Prentice Hall.SACHDEVA, S., MCCAFFREY, S., AND LOCKE, D. 2016. Social media approaches to modeling wildfire smoke
dispersion: Spatiotemporal and social scientific investigations. Information, Communication and Society 20, 8,1146–1161.
SALESFORCE. 2013. Tableau helps people see and understand data: What do you want to do with yours?https://www.tableau.com/.
SCELLATO, S. 2011. ”beyond the social web: the geo-social revolution” by Salvatore Scellato with Ching-manAu Yeung as coordinator. ACMSIGWEB Newsl. Autumn 2011, 5:1–5:5.
SELLARS, S., NGUYEN, P., CHU, W., GAO, X., HSU, K., AND SOROOSHIAN, S. 2013. Computational earthscience: Big data transformed into insight. EOS Transactions, AGU 94, 32, 277.
SERDECZNY, O., ADAMS, S., BAARSCH, F., CUOMOU, D., ROBINSON, A., HARE, B., SCHAEFFER, M.,PERRETTE, M., AND REINHARDT, J. 2016. Climate change impacts in Sub-Saharan Africa: From physicalchanges to their social repercussions. Regional Environmental Change, ISSN: 1436–3798.
UNITED STATES GEOLOGICAL SURVEY, U. 2019. What is hydrology? https://www.usgs.gov/special-topic/water-science-school/science/what-hydrology.
SIGWEB Newsletter Autumn 2020

Hydroinformatics and the Web · 17
VARGHESE, C., VARDE, A. S., AND DU, X. 2020. An ordinance-tweet mining app to disseminate urbanpolicy knowledge for smart governance. In Responsible Design, Implementation and Use of Information andCommunication Technology - Conference on e-Business, e-Services, and e-Society, Part II, Springer LNCS.Vol. 12067. 389–401.
VIEGAS, C., NUNES, S., FERNANDES, R., AND NEVES, R. 2009. Contribution on bathing water quality afterrainfall events in Costa do Estoril: A tool to implement an alert system for bathing water quality. Journal ofCoastal Research, 1691–1695.
WANG, S., ZHANG, X., CAO, J., HE, L., STENNETH, L., YU, P., LI, Z., AND HUANG, Z. 2017. Computingurban traffic congestions by incorporating sparse GPS probe data and social media data. ACM Transactionson Information Systems 35, 4, 1–30.
WU, Y., JING, W., LIU, J., MA, Q., YUAN, J., WANG, Y., DU, M., AND LIU, M. 2020. Effects of temperatureand humidity on the daily new cases and new deaths of COVID-19 in 166 countries. Science of the TotalEnvironment 729, 139051.
YUKIMOTO, S., ADACHI, Y., HOSAKA, M., SAKAMI, T., YOSHIMURA, H., HIRABARA, M., TANAKA, T.,SHINDO, E., TSUJINO, H., DEUSHI, M., MIZUTA, R., YABU, S., OBATA, A., NAKANO, H., KOSHIRO, T.,OSE, T., AND KITOH, A. 2012. A new global climate model of the meteorological research institute: MRI-CGCM3 – model description and basic performance. Journal of the Meteorological Society of Japan SeriesII 90A, 23–64.
ZADEH, L. A. 2003. From search engines to question-answering systems - The need for new tools. In WebIntelligence, First International Atlantic Web Intelligence Conference, AWIC by Springer LNCS. Vol. 2663.15–17.
Drashti Pathak completed her MS in Computer Science from Montclair State University (NJ, USA) in 2019.She obtained her Bachelors degrees in Psychology from Hunter College at CUNY (The City University of NewYork) in NYC (NY, USA). She has been a Preschool teacher for three years and thus has interesting experienceof working with children’s education. She has made technical presentations in IEEE and Sigma Xi venues alongwith a research paper publication in IEEE, all based on her MS research. Other notable outcomes of her MS workinclude two Android apps built in the areas of hydro-climate data management and food donation respectively.These apps involved teamwork, Drashti being the lead developer.
Aparna Varde is an Associate Professor of Computer Science at Montclair State University (NJ). Her researchspans Data Science, AI and multi-disciplinary work on areas such as commonsense knowledge, smart cities andtext mining. She has 100+ publications, and 3 best paper awards at IEEE conferences. She has been a visitingresearcher at the Max Planck Institute for Informatics, Germany. She is the founder of PIKM (ACM CIKMPhD workshop) and has co-chaired it 5 times, in addition to being a reviewer / PC member for many journals/ conferences (e.g. TKDD, WWW). She has been the dissertation advisor for 2 PhD students in EnvironmentalManagement; research advisor for many MS, BS students in Computer Science; and external mentor / examinerfor 4 PhD students worldwide. She obtained her PhD and MS in Computer Science from Worcester PolytechnicInstitute (Massachusetts) and BE in Computer Engineering from the University of Bombay, India. Please seewww.montclair.edu/˜vardea for details.
Gerard de Melo is a Full Professor and Chair of Artificial Intelligence and Intelligent Systems at Hasso PlattnerInstitute, University of Potsdam, Germany. He is also a Visiting Professor at Rutgers University (NJ, USA),where he serves as the Director of the Deep Data Lab. He has published over 100 papers on NLP, AI, and BigData analytics, with Best Paper/Demo awards at WWW 2011, CIKM 2010, ICGL 2008, and the NAACL 2015Workshop on Vector Space Modeling. Prior to joining Rutgers, he was a faculty member at Tsinghua University,a Post-Doctoral Research Scholar at ICSI/UC Berkeley, and a doctoral candidate at the Max Planck Institute forInformatics. Notable research projects include Lexvo.org and the Universal WordNet. For more information,please consult http://gerard.demelo.org.
Clement Alo is an Associate Professor in the Department of Earth and Environmental science at Montclair StateUniversity. His research integrates climate modeling, terrestrial ecosystem modeling, hydrological modeling, andobservational data for atmospheric and land surface variables to examine the evolution of Earth’s biosphere andwater resources in response to climate variability and change. A key practical focus of his prediction studies isgenerating science based information on environmental vulnerability associated with global change for effectiveenvironmental management. He obtained his PhD from the University of Connecticut, MA from Clark Universityand BS from the University of Science and Technology, Ghana. He teaches courses in Climatology and Hydrologyamong others.
SIGWEB Newsletter Autumn 2020