environmental and ecological hydroinformatics to...
TRANSCRIPT
Environmental and ecological hydroinformatics to
support the implementation of the European Water
Framework Directive for river basin management
A. van Griensven, L. Breuer, M. Di Luzio, V. Vandenberghe, P. Goethals,
T. Meixner, J. Arnold and R. Srinivasan
ABSTRACT
A. van Griensven
UNESCO-IHE Institute for Water Education,
Department of Hydroinformatics and Knowledge
Management,
P.O. Box 3015, 2601 DA, DELFT,
The Netherlands
Ghent University,
BIOMATH: Department of Applied Mathematics,
Biometrics and Process Control,
Coupure Links 653, B-9000, Ghent,
Belgium
L. Breuer
Justus-Liebig-University Giessen, Institute for
Landscape Ecology and Resources
Management (ILR),
Heinrich-Buff-Ring 26, 35392, Giessen,
Germany
M. Di Luzio
Texas A&M University,
Environmental Blackland Research and Extension
Center,
720 E. Blackland Road, Temple, TX7650,Texas, USA
V. Vandenberghe
Ghent University,
BIOMATH: Department of Applied Mathematics,
Biometrics and Process Control,
Coupure Links 653, B-9000, Ghent, Belgium
P. Goethals
Ghent University,
Department Applied Ecology and Environmental
Biology,
J. Plateaustraat 22, B-9000, Gent, Belgium
T. Meixner
University of Arizona, Colledge of Engineering,
Department of Hydrology and Water Resources,
845 North Park Avenue, Tucson AZ 85721-0158,
USA
J. Arnold
Arnold,USDA-ARS,
Grassland Soil and Water Research Laboratory,
808 East Blackland Road Temple TX76502, USA
R. Srinivasan
Texas A&M University,
Spatial Sciences Laboratory,
1500 Research Parkway, Suite B223,
College Station, TX77845, USA
Research and development in hydroinfomatics can play an important role in environmental
impact assessment by integrating physically-based models, data-driven models and other
Information and Communication Tools (ICT). An illustration is given in this paper describing the
developments around the Soil and Water Assessment Tool (SWAT) to support the implementation
of the EU Water Framework Directive. SWAT operates on the river basin scale and includes
processes for the assessment of complex diffuse pollution; it is open-source software, which
allows for site-specific modifications to the source and easy linkage to other hydroinformatics
tools. A crucial step in the world-wide applicability of SWAT was the integration of the model into
a GIS environment, allowing for a quick model set-up using digital information on terrain
elevation, land use and management, soil properties and weather conditions. Model analysis
tools can be integrated with SWAT to assist in the tedious tasks of model calibration, parameter
optimisation, sensitivity and uncertainty analysis and allows better understanding of the model
before addressing scientific and societal questions. Finally, further linkage of SWAT to ecological
assessment tools, Land Use prediction tools and tools for Optimal Experimental Design shows
that SWAT can play an important role in multi-disciplinary eco-environmental impact assessment
studies.
Key words | catchment modelling, eco-hydrology, environmental hydroinformatics, EU water
framework directive, model integration, SWAT
doi: 10.2166/hydro.2006.010
239 Q IWA Publishing 2006 Journal of Hydroinformatics | 08.4 | 2006
RIVER BASIN MODELLING FOR THE WATER
FRAMEWORK DIRECTIVE
A worldwide increase in consumption of water has led to
problems such as water scarcity and water pollution. A
decrease in quantity and quality threatens human health and
also impacts the environment and aquatic ecology. This
awareness has induced more stringent legislation such as the
EuropeanWater FrameworkDirective (WFD) (EU2000). The
WFD does not prescribe fixed measures or best practices, but
promotes toelaborate a river basin specificplanningwhere the
different functions ofwater bodies, all sources of pollution and
an active involvement of all stakeholders are integrated at the
river basin scale with targets set for the desired ecological
quality. TheWFD imposes a planning process that consists of
an identification of the system with an impact-effect analysis,
the set-up of a programme of measures and the implemen-
tation and evaluation of the latter, supported by monitoring
programmes for water physico-chemistry and ecology. This
process requires the integration, synthesis, analysis and
communication of large amounts of information and knowl-
edge on the geophysical, biological, social and economical
aspects in order to assist in the decision making process.
Although many environmental modelling methods exist,
their practical application to support river management is
rather limited (van Griensven & Vanrolleghem 2006). In
particular for river restorationmanagement, there is a need for
tools to guide the investments needed to meet the ecological
status targeted by the EuropeanWater Framework Directive.
In recent years, several practical concepts and software
systems have been developed related to environmental
decision support, e.g. Rizzoli & Young (1997); Paggio et al.
(1999); Reed et al. (1999); Young et al. (2000); Booty et al.
(2001); Lam & Swayne (2001); Argent (2004); Voinov et al.
(2004). From a technical point of view, one can opt to build
a new model for each application or to utilize existing
models where possible. The first approach has the benefit of
control in the models design and linkage, but requires a long
model development period. The second approach saves on
development time, but requires additional work to link
existing models (Lam et al. 2004).
However, when suitablemodels are already available, it is
probably the better option. The use of the linked models can
also be a good start to learning what processes are of major
importance for the different simulations and which can be
neglected.Sincewatersheds formthephysical borders for river
basin management, catchment modelling is the most appro-
priate reference frame for integrated modelling. Even though
there exist several catchment tools and models in today’s
scientific community, their application has focused largely on
scientific and not on societal questions. There is a need to
simplify some of these tool sets, for example when developing
decision support systems. In addition, it is of crucial
importance to improve the dissemination of these tools to
decision makers and stakeholders by education and training.
About 50 peer-reviewed papers already discussed the
applicationof SWATonpollution loss studies for awide range
of small to large river basins (Gassman et al. 2005). Several of
these studies refer to the application of SWAT with regard to
the US water quality legislation such as for Total Maximum
Daily Load (TMDL) analysis or Best Management Practices
(BMP). With the European Water Framework Directive in
mind, SWAT was applied in the framework of several EU
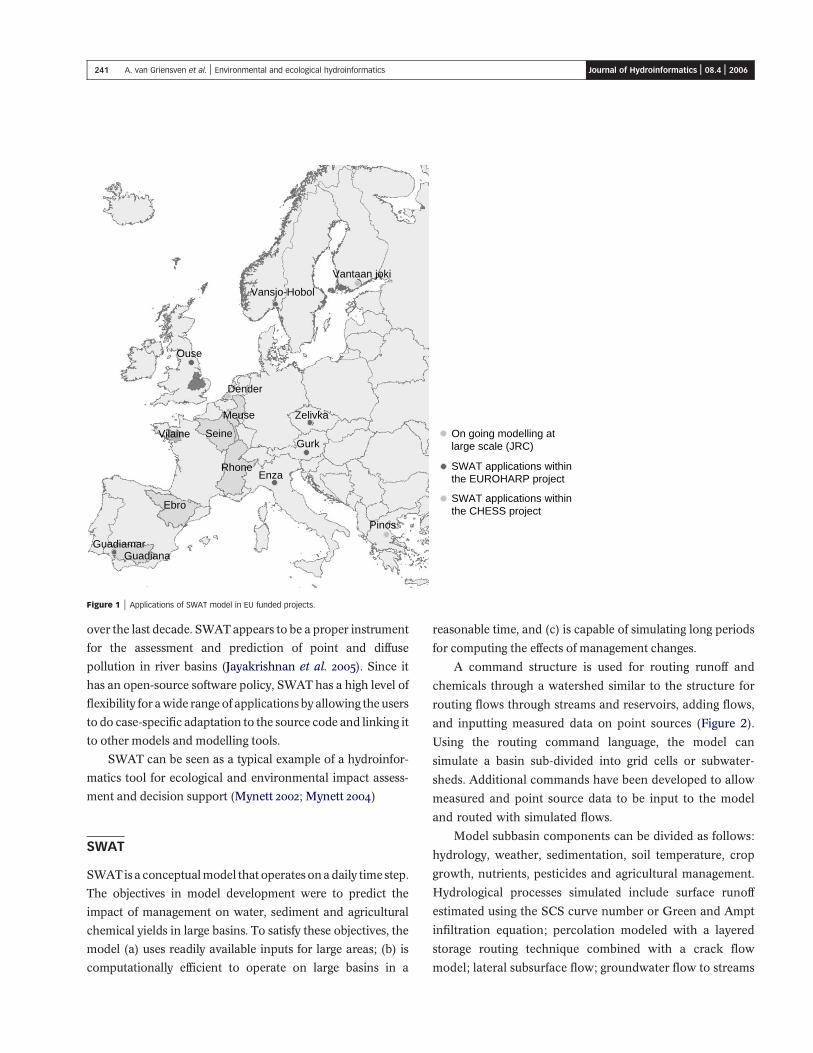
researchprojects oncatchmentmodelling (Figure1) suchas in
CHESS (2001) to investigate the effect of climate change on
water quality in European rivers, in TempQsim (2004) for the
analysis of Mediterranean and semi-arid catchments with
intermittent flow regimes, in EUROHARP (2004) for nutrient
modelling studies and inBMW(2004) for the use in integrated
modelling assessment. In the latter project, SWAT was
successfully evaluated against the qualitative diffuse pollution
benchmark criteria for the application ofmodels for theWater
FrameworkDirective, where it received a ‘good’ classification
on 70%of the questions and at no point during the assessment
a ‘not recommended’ for use (Dilks et al. 2003). SWAT has
been applied in Europe for sediment, nitrogen and phosphor-
ous predictions, among many others, in several watersheds in
Finland (Grizzetti et al. 2003), several watersheds in Belgium
(vanGriensven&Bauwens 2005), in theUK(Dilks et al. 2003),
for large scale applications in Europe (Bouraoui et al. 2005)
and on low mountain range catchments in central Germany
within the framework of the Joint Research Project SFB299
(Fohrer et al. 2002, 2005).
This paper describes initiatives with the Soil and Water
Assessment Tool (SWAT) (Arnold et al. 1998) that were done
240 A. van Griensven et al. | Environmental and ecological hydroinformatics Journal of Hydroinformatics | 08.4 | 2006
over the last decade. SWATappears to be a proper instrument
for the assessment and prediction of point and diffuse
pollution in river basins (Jayakrishnan et al. 2005). Since it
has an open-source software policy, SWAT has a high level of
flexibility for awide rangeof applications by allowing the users
to do case-specific adaptation to the source code and linking it
to other models and modelling tools.
SWAT can be seen as a typical example of a hydroinfor-
matics tool for ecological and environmental impact assess-
ment and decision support (Mynett 2002;Mynett 2004)
SWAT
SWATis a conceptualmodel that operates onadaily timestep.
The objectives in model development were to predict the
impact of management on water, sediment and agricultural
chemical yields in large basins. To satisfy these objectives, the
model (a) uses readily available inputs for large areas; (b) is
computationally efficient to operate on large basins in a
reasonable time, and (c) is capable of simulating long periods
for computing the effects of management changes.
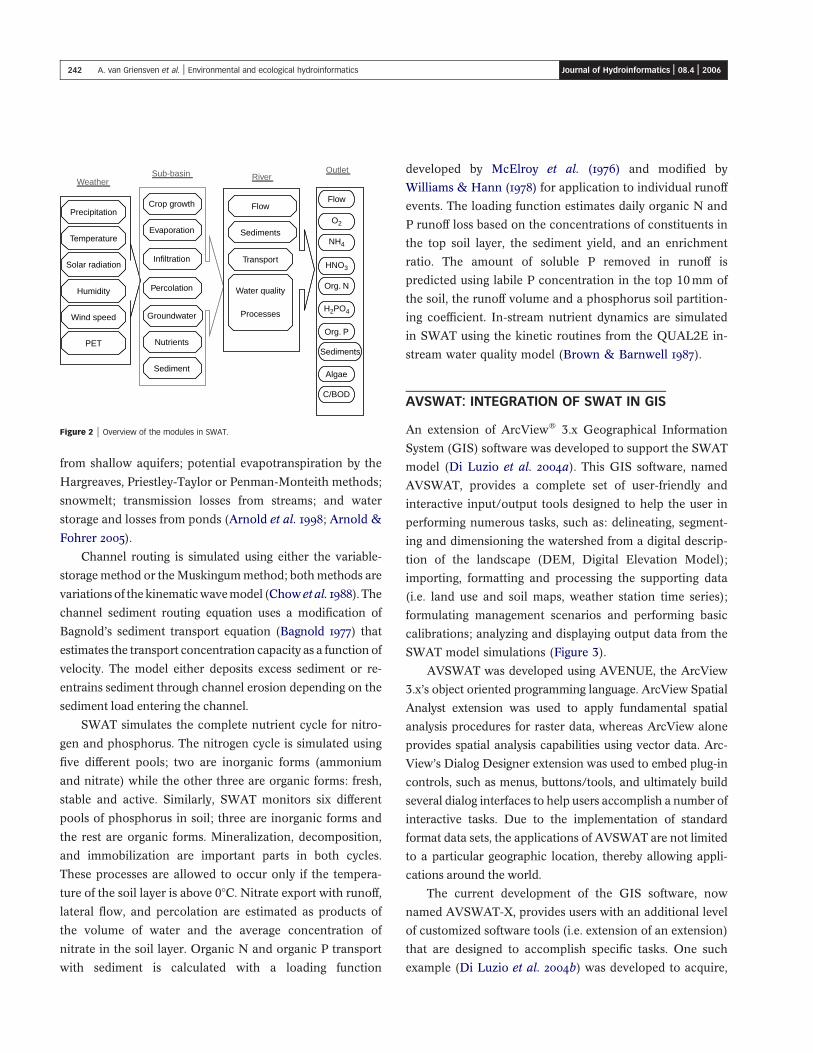
A command structure is used for routing runoff and
chemicals through a watershed similar to the structure for
routing flows through streams and reservoirs, adding flows,
and inputting measured data on point sources (Figure 2).
Using the routing command language, the model can
simulate a basin sub-divided into grid cells or subwater-
sheds. Additional commands have been developed to allow
measured and point source data to be input to the model
and routed with simulated flows.
Model subbasin components can be divided as follows:
hydrology, weather, sedimentation, soil temperature, crop
growth, nutrients, pesticides and agricultural management.
Hydrological processes simulated include surface runoff
estimated using the SCS curve number or Green and Ampt
infiltration equation; percolation modeled with a layered
storage routing technique combined with a crack flow
model; lateral subsurface flow; groundwater flow to streams
Vilaine
Ebro
GuadianaGuadiamar
Ouse
Zelivka
Pinos
Vantaan joki
Vansjo-Hobol
Meuse
Seine
RhoneEnza
GurkOn going modelling atlarge scale (JRC)
SWAT applications withinthe EUROHARP project
SWAT applications withinthe CHESS project
Dender
Figure 1 | Applications of SWAT model in EU funded projects.
241 A. van Griensven et al. | Environmental and ecological hydroinformatics Journal of Hydroinformatics | 08.4 | 2006
from shallow aquifers; potential evapotranspiration by the
Hargreaves, Priestley-Taylor or Penman-Monteith methods;
snowmelt; transmission losses from streams; and water
storage and losses from ponds (Arnold et al. 1998; Arnold &
Fohrer 2005).
Channel routing is simulated using either the variable-
storagemethod or theMuskingummethod; bothmethods are
variations of the kinematicwavemodel (Chow et al. 1988). The
channel sediment routing equation uses a modification of
Bagnold’s sediment transport equation (Bagnold 1977) that
estimates the transport concentration capacity as a function of
velocity. The model either deposits excess sediment or re-
entrains sediment through channel erosion depending on the
sediment load entering the channel.
SWAT simulates the complete nutrient cycle for nitro-
gen and phosphorus. The nitrogen cycle is simulated using
five different pools; two are inorganic forms (ammonium
and nitrate) while the other three are organic forms: fresh,
stable and active. Similarly, SWAT monitors six different
pools of phosphorus in soil; three are inorganic forms and
the rest are organic forms. Mineralization, decomposition,
and immobilization are important parts in both cycles.
These processes are allowed to occur only if the tempera-
ture of the soil layer is above 08C. Nitrate export with runoff,
lateral flow, and percolation are estimated as products of
the volume of water and the average concentration of
nitrate in the soil layer. Organic N and organic P transport
with sediment is calculated with a loading function
developed by McElroy et al. (1976) and modified by
Williams & Hann (1978) for application to individual runoff
events. The loading function estimates daily organic N and
P runoff loss based on the concentrations of constituents in
the top soil layer, the sediment yield, and an enrichment
ratio. The amount of soluble P removed in runoff is
predicted using labile P concentration in the top 10mm of
the soil, the runoff volume and a phosphorus soil partition-
ing coefficient. In-stream nutrient dynamics are simulated
in SWAT using the kinetic routines from the QUAL2E in-
stream water quality model (Brown & Barnwell 1987).
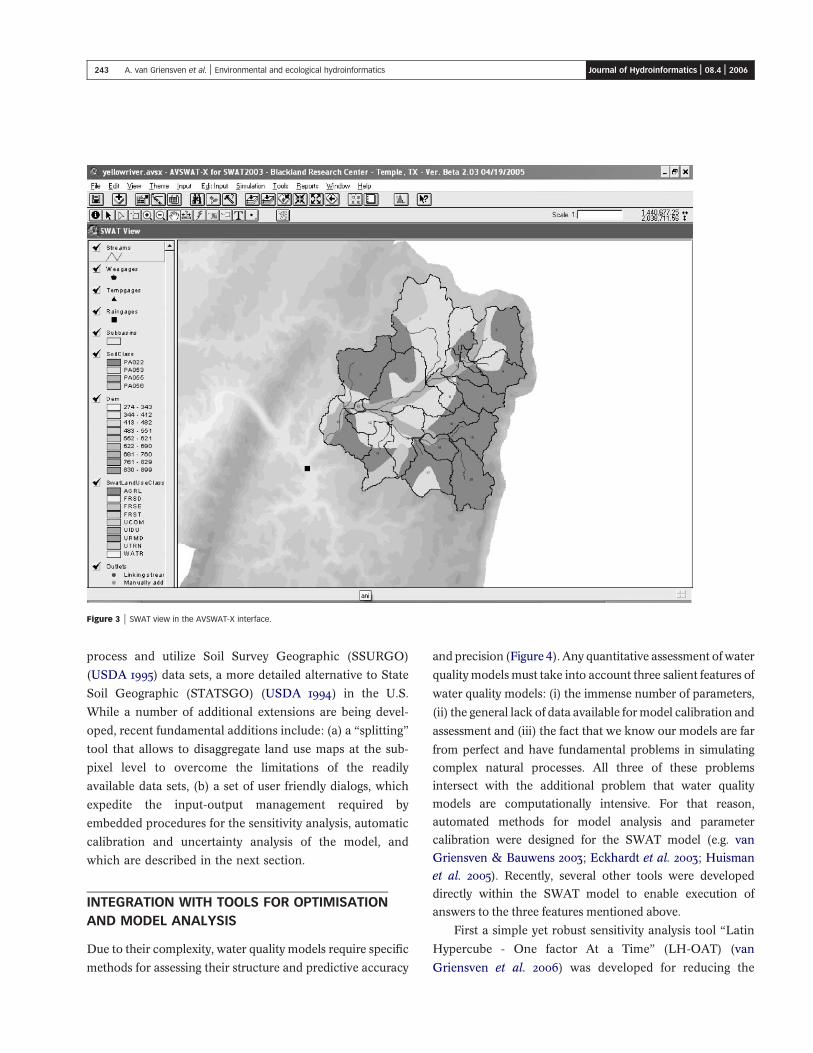
AVSWAT: INTEGRATION OF SWAT IN GIS
An extension of ArcVieww 3.x Geographical Information
System (GIS) software was developed to support the SWAT
model (Di Luzio et al. 2004a). This GIS software, named
AVSWAT, provides a complete set of user-friendly and
interactive input/output tools designed to help the user in
performing numerous tasks, such as: delineating, segment-
ing and dimensioning the watershed from a digital descrip-
tion of the landscape (DEM, Digital Elevation Model);
importing, formatting and processing the supporting data
(i.e. land use and soil maps, weather station time series);
formulating management scenarios and performing basic
calibrations; analyzing and displaying output data from the
SWAT model simulations (Figure 3).
AVSWAT was developed using AVENUE, the ArcView
3.x’s object oriented programming language. ArcView Spatial
Analyst extension was used to apply fundamental spatial
analysis procedures for raster data, whereas ArcView alone
provides spatial analysis capabilities using vector data. Arc-
View’s Dialog Designer extension was used to embed plug-in
controls, such as menus, buttons/tools, and ultimately build
several dialog interfaces to help users accomplish a number of
interactive tasks. Due to the implementation of standard
format data sets, the applications of AVSWAT are not limited
to a particular geographic location, thereby allowing appli-
cations around the world.
The current development of the GIS software, now
named AVSWAT-X, provides users with an additional level
of customized software tools (i.e. extension of an extension)
that are designed to accomplish specific tasks. One such
example (Di Luzio et al. 2004b) was developed to acquire,
PET
Flow
O2
NH4
HNO3
Org. N
H2PO4
Org. P
Sediments
Algae
C/BOD
Sub-basin
Crop growth
Evaporation
Infiltration
Percolation
Groundwater
Nutrients
Sediment
River
Flow
Sediments
Transport
Water quality
Processes
Weather
Precipitation
Temperature
Solar radiation
Humidity
Wind speed
Outlet
Figure 2 | Overview of the modules in SWAT.
242 A. van Griensven et al. | Environmental and ecological hydroinformatics Journal of Hydroinformatics | 08.4 | 2006
process and utilize Soil Survey Geographic (SSURGO)
(USDA 1995) data sets, a more detailed alternative to State
Soil Geographic (STATSGO) (USDA 1994) in the U.S.
While a number of additional extensions are being devel-
oped, recent fundamental additions include: (a) a “splitting”
tool that allows to disaggregate land use maps at the sub-
pixel level to overcome the limitations of the readily
available data sets, (b) a set of user friendly dialogs, which
expedite the input-output management required by
embedded procedures for the sensitivity analysis, automatic
calibration and uncertainty analysis of the model, and
which are described in the next section.
INTEGRATION WITH TOOLS FOR OPTIMISATION
AND MODEL ANALYSIS
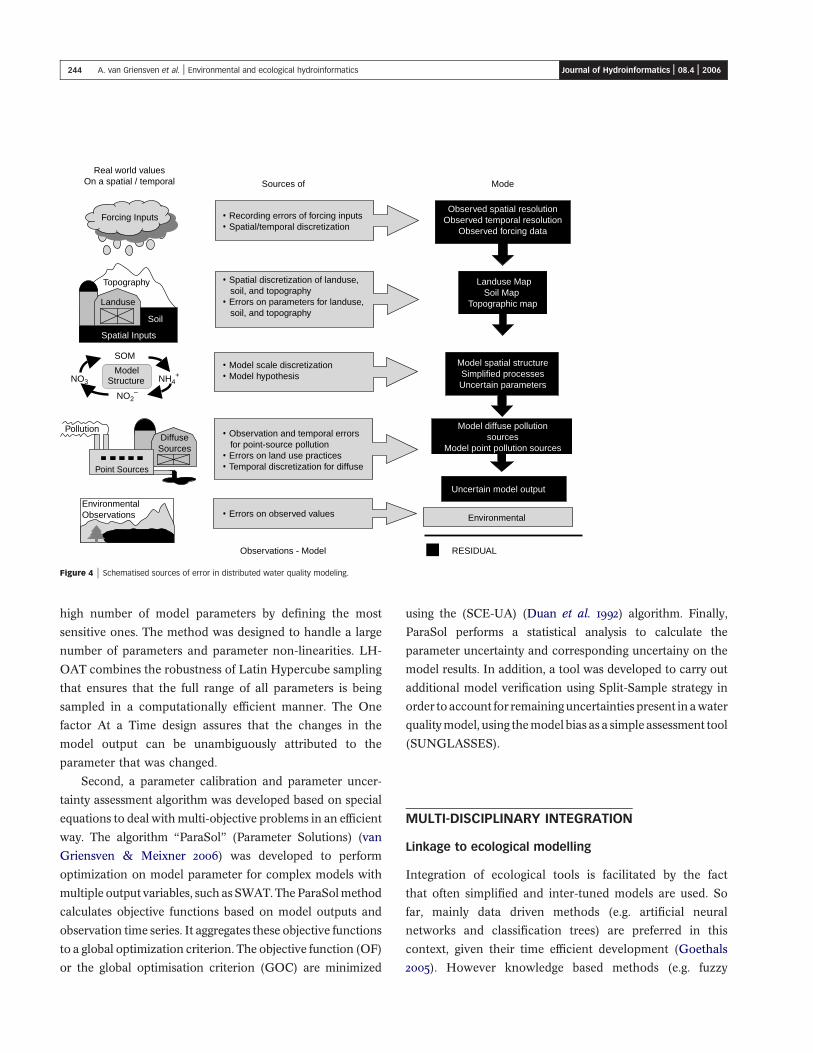
Due to their complexity, water quality models require specific
methods for assessing their structure and predictive accuracy
andprecision (Figure 4). Any quantitative assessment ofwater
qualitymodelsmust take into account three salient features of
water quality models: (i) the immense number of parameters,
(ii) the general lack of data available formodel calibration and
assessment and (iii) the fact that we know our models are far
from perfect and have fundamental problems in simulating
complex natural processes. All three of these problems
intersect with the additional problem that water quality
models are computationally intensive. For that reason,
automated methods for model analysis and parameter
calibration were designed for the SWAT model (e.g. van
Griensven & Bauwens 2003; Eckhardt et al. 2003; Huisman
et al. 2005). Recently, several other tools were developed
directly within the SWAT model to enable execution of
answers to the three features mentioned above.
First a simple yet robust sensitivity analysis tool “Latin
Hypercube - One factor At a Time” (LH-OAT) (van
Griensven et al. 2006) was developed for reducing the
Figure 3 | SWAT view in the AVSWAT-X interface.
243 A. van Griensven et al. | Environmental and ecological hydroinformatics Journal of Hydroinformatics | 08.4 | 2006
high number of model parameters by defining the most
sensitive ones. The method was designed to handle a large
number of parameters and parameter non-linearities. LH-
OAT combines the robustness of Latin Hypercube sampling
that ensures that the full range of all parameters is being
sampled in a computationally efficient manner. The One
factor At a Time design assures that the changes in the
model output can be unambiguously attributed to the
parameter that was changed.
Second, a parameter calibration and parameter uncer-
tainty assessment algorithm was developed based on special
equations to deal withmulti-objective problems in an efficient
way. The algorithm “ParaSol” (Parameter Solutions) (van
Griensven & Meixner 2006) was developed to perform
optimization on model parameter for complex models with
multiple output variables, such asSWAT. TheParaSolmethod
calculates objective functions based on model outputs and
observation time series. It aggregates these objective functions
to a global optimization criterion. The objective function (OF)
or the global optimisation criterion (GOC) are minimized
using the (SCE-UA) (Duan et al. 1992) algorithm. Finally,
ParaSol performs a statistical analysis to calculate the
parameter uncertainty and corresponding uncertainy on the
model results. In addition, a tool was developed to carry out
additional model verification using Split-Sample strategy in
order toaccount for remaininguncertainties present inawater
qualitymodel, using themodel bias as a simple assessment tool
(SUNGLASSES).
MULTI-DISCIPLINARY INTEGRATION
Linkage to ecological modelling
Integration of ecological tools is facilitated by the fact
that often simplified and inter-tuned models are used. So
far, mainly data driven methods (e.g. artificial neural
networks and classification trees) are preferred in this
context, given their time efficient development (Goethals
2005). However knowledge based methods (e.g. fuzzy
EnvironmentalObservations
Real world valuesOn a spatial / temporal Sources of Mode
Forcing Inputs • Recording errors of forcing inputs• Spatial/temporal discretization
Observed spatial resolutionObserved temporal resolution
Observed forcing data
Landuse
Soil
Topography
Spatial Inputs
• Spatial discretization of landuse, soil, and topography• Errors on parameters for landuse, soil, and topography
Landuse MapSoil Map
Topographic map
NO3
NO2–
NH4+
SOM
ModelStructure
• Model scale discretization• Model hypothesis
Model spatial structureSimplified processesUncertain parameters
Point Sources
DiffuseSources
Pollution • Observation and temporal errors for point-source pollution• Errors on land use practices• Temporal discretization for diffuse
Model diffuse pollutionsources
Model point pollution sources
Uncertain model output
Environmental • Errors on observed values
RESIDUALObservations - Model
Figure 4 | Schematised sources of error in distributed water quality modeling.
244 A. van Griensven et al. | Environmental and ecological hydroinformatics Journal of Hydroinformatics | 08.4 | 2006
logic, Bayesian belief networks) can be of considerable
importance as well, in particular when enough data of
good quality are lacking to develop data driven models
(Adriaenssens et al. 2004).
A practical example of coupling SWAT results to
ecological modelling is presented by Vandenberghe et al.
(2005). This research was performed on the river Dender in
Flanders. The riverDender is highly affectedbynutrient inflow
from agricultural and wastewater discharges from industries
and households. Additionally, habitat modifications were
established to ease flood control and guarantee boat traffic.
These modifications have had a severe impact on the habitat
characteristics and induced a completely different fish com-
munity compared to natural conditions. To gain a better
understanding of these combined effects, water qualitymodels
of the Dender river were developed in ESWAT, a SWAT2000
version that was extendedwith hourly hydrological andwater
quality processes (van Griensven & Bauwens 2001). Pollution
at theupstreamboundary is estimatedusingdailywaterquality
data for dissolved oxygen (DO), biologically oxygen demand
(BOD), nitrate (NO32), and ammonia (NH4
þ). Point pollution
inputs comprise wastewater treatment plants outlets, indus-
tries and untreated household effluents. Land management
and agricultural processes are taken into account to calculate
diffuse pollution to the river.
The outputs of the model were used as inputs for
ecological data driven models to predict presence or
absence of fish species. These latter models allow predicting
communities on the basis of the outcomes of the water
quality model simulations and habitat data. For this
purpose, classification trees were constructed on the basis
of the Weka software (Witten & Frank 2000) using an
algorithm to grow and prune so-called “C4.5” classification
trees. A dataset was constructed on the basis of electrofish-
ing data, collected in rivers of Flanders. In total, 168
measurements were used, of which in 50% of the cases pike
was present. A training set of 112 instances was used for
classification tree development, while 56 instances served
for validation of the model. In both subsets, 50% of the
instances were characterized by pike presence. In addition
to the presence/absence of pike, seven variables (river
characteristics) were available to induce the classification
tree model: width, slope, depth, electrical conductivity,
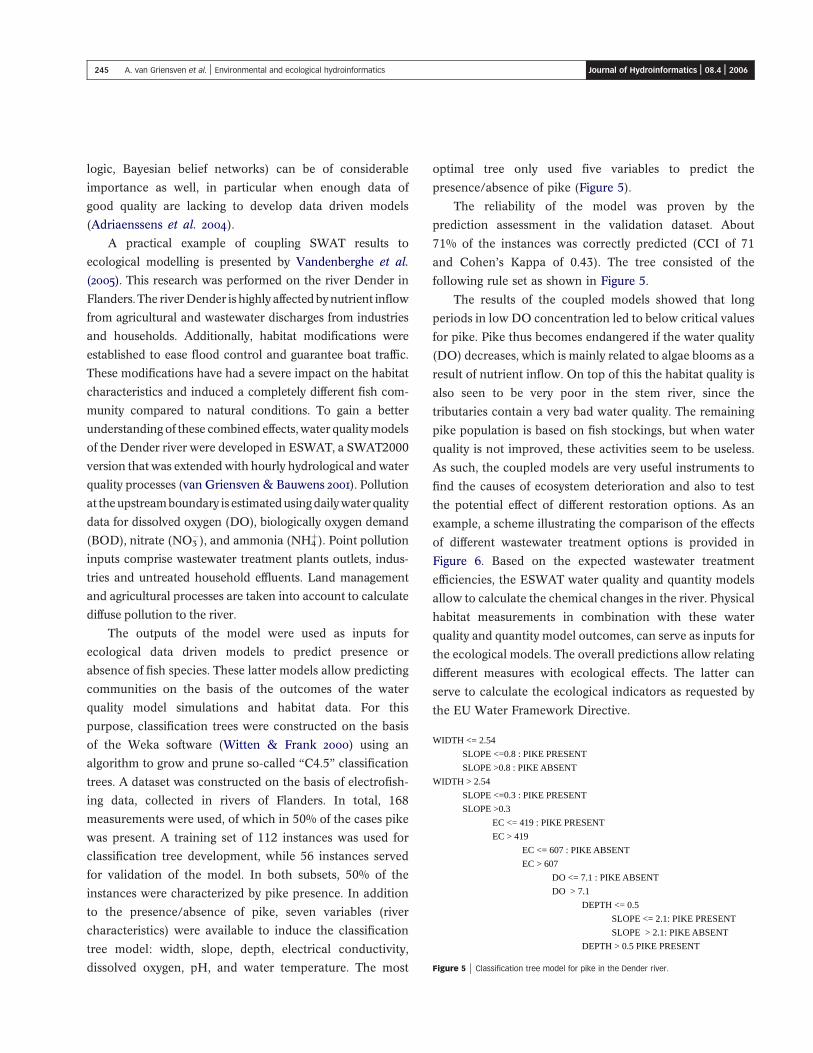
dissolved oxygen, pH, and water temperature. The most
optimal tree only used five variables to predict the
presence/absence of pike (Figure 5).
The reliability of the model was proven by the
prediction assessment in the validation dataset. About
71% of the instances was correctly predicted (CCI of 71
and Cohen’s Kappa of 0.43). The tree consisted of the
following rule set as shown in Figure 5.
The results of the coupled models showed that long
periods in low DO concentration led to below critical values
for pike. Pike thus becomes endangered if the water quality
(DO) decreases, which is mainly related to algae blooms as a
result of nutrient inflow. On top of this the habitat quality is
also seen to be very poor in the stem river, since the
tributaries contain a very bad water quality. The remaining
pike population is based on fish stockings, but when water
quality is not improved, these activities seem to be useless.
As such, the coupled models are very useful instruments to
find the causes of ecosystem deterioration and also to test
the potential effect of different restoration options. As an
example, a scheme illustrating the comparison of the effects
of different wastewater treatment options is provided in
Figure 6. Based on the expected wastewater treatment
efficiencies, the ESWAT water quality and quantity models
allow to calculate the chemical changes in the river. Physical
habitat measurements in combination with these water
quality and quantity model outcomes, can serve as inputs for
the ecological models. The overall predictions allow relating
different measures with ecological effects. The latter can
serve to calculate the ecological indicators as requested by
the EU Water Framework Directive.
WIDTH <= 2.54
SLOPE <=0.8 : PIKE PRESENT
SLOPE >0.8 : PIKE ABSENT
WIDTH > 2.54
SLOPE <=0.3 : PIKE PRESENT
SLOPE >0.3
EC <= 419 : PIKE PRESENT
EC > 419
EC <= 607 : PIKE ABSENT
EC > 607
DO <= 7.1 : PIKE ABSENT
DO > 7.1
DEPTH <= 0.5
SLOPE <= 2.1: PIKE PRESENT
SLOPE > 2.1: PIKE ABSENT
DEPTH > 0.5 PIKE PRESENT
Figure 5 | Classification tree model for pike in the Dender river.
245 A. van Griensven et al. | Environmental and ecological hydroinformatics Journal of Hydroinformatics | 08.4 | 2006
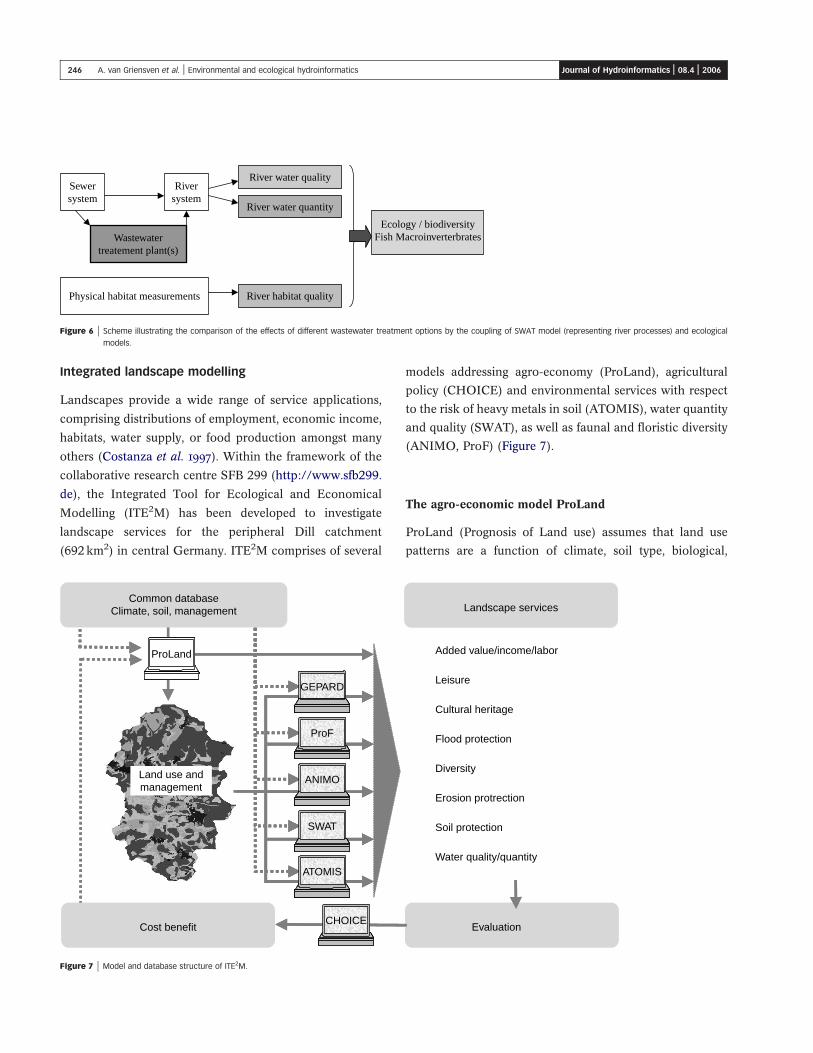
Integrated landscape modelling
Landscapes provide a wide range of service applications,
comprising distributions of employment, economic income,
habitats, water supply, or food production amongst many
others (Costanza et al. 1997). Within the framework of the
collaborative research centre SFB 299 (http://www.sfb299.
de), the Integrated Tool for Ecological and Economical
Modelling (ITE2M) has been developed to investigate
landscape services for the peripheral Dill catchment
(692km2) in central Germany. ITE2M comprises of several
models addressing agro-economy (ProLand), agricultural
policy (CHOICE) and environmental services with respect
to the risk of heavy metals in soil (ATOMIS), water quantity
and quality (SWAT), as well as faunal and floristic diversity
(ANIMO, ProF) (Figure 7).
The agro-economic model ProLand
ProLand (Prognosis of Land use) assumes that land use
patterns are a function of climate, soil type, biological,
Sewersystem
Wastewatertreatement plant(s)
Riversystem
River water quality
Physical habitat measurements
River water quantity
River habitat quality
Ecology / biodiversityFish Macroinverterbrates
Figure 6 | Scheme illustrating the comparison of the effects of different wastewater treatment options by the coupling of SWAT model (representing river processes) and ecological
models.
ProLand
ANIMO
EvaluationCost benefitCHOICE
ProLand
Land use andmanagement
ANIMO
GEPARD
ATOMIS
SWAT
ProF
ANIMOANIMO
Added value/income/labor
Leisure
Cultural heritage
Flood protection
Diversity
Erosion protrection
Soil protection
Water quality/quantity
Landscape servicesCommon database
Climate, soil, management
Figure 7 | Model and database structure of ITE2M.
246 A. van Griensven et al. | Environmental and ecological hydroinformatics Journal of Hydroinformatics | 08.4 | 2006

economic and social conditions (Weinmann et al. 2005).
The spatial distribution of these data form the basis for the
allocation of land use systems, assuming land rent max-
imizing behaviour of the land user for any parcel of land.
Land rent is defined as the sum of monetary yields including
all subsidies minus input costs, depreciation, taxes and
opportunity costs for employed capital and labour. As a
result, two different types of model outputs are derived: (i)
maps of the potential spatial land use distribution and (ii)
sets of aggregated key indicators to characterise the
economic performance of land use.
The eco-hydrologic model SWAT-N
A modified version of SWAT has been applied to predict
hydrological and nitrogen fluxes on the landscape scale
(SWAT-N, Pohlert et al. 2006). The hydrological com-
ponents differ in the way of representing interflow by (i)
simulating soil anisotropy and (ii) parameterizing the
deepest soil horizon to account for the fissured rock aquifer
characteristic in the Dill catchment. To improve the
simulations of N turnover and export in the Dill catchment,
SWAT was coupled to the mineralization and nitrification
modules of the biogeochemistry model DNDC and to the
denitrification module of CropSyst.
The biodiversity models ANIMO and ProF
The spatially explicit landscape model ANIMO (Steiner &
Kohler 2003), a cellular automaton, quantifies the effect of
land use change on regional diversity. The model assumes
that each habitat (land use) has its own species inventory
depending on environmental, regional and historical con-
straints. An intrinsic species pool is determined with its
portions of habitat generalists and specialists. Single cells
interact with neighbouring cells in the way that habitat
generalists disperse into surrounding cells, whereas habitat
specialists remain static. The number of species in a cell (a-
diversity) is affected by the species inventory surrounding
the cell (habitat dissimilarity, b-diversity). The overall g-
diversity of a landscape is the product of a- and b-diversity.
To assess floristic diversity the habitat model ProF
(Prognosis of Floristic richness) is applied. ProF is a probabil-
istic GIS tool that is based on the mosaic concept. It assumes
that species richness is determined by habitat variability and
heterogeneity and the proportion of natural, semi-natural and
anthropogenic vegetation (Waldhardt et al. 2004).
The heavy metal accumulation soil model ATOMIS
The Assessment Tool for Metals in Soils (ATOMIS; Reiher
et al. 2004) provides site-specific estimates of the fate of heavy
metals such asNi, Cu, Zn, Cd, and Pb in top soils.Metal input
by land management is derived from ProLand data, whereas
atmospheric input is taken fromprecipitationmeasurements.
Metal concentrations in soil solution are calculated using
general purpose Freundlich isotherms, considering soil
sorption characteristics such as pH, SOC, clay and heavy
metal content. ATOMIS identifies areas where geologic
background in combination with site characteristics leads
to potential enrichment of heavy metals due to agricultural
land use and management. SWAT-N estimates on mean
annual percolation rates from the top soil horizon and mean
annual evapotranspiration rate are used as input for
ATOMIS.Sustainability of landuseandmanagementoptions
can be assessed by comparing the predicted future totalmetal
concentrations to legally specified threshold values. ATO-
MIS outputs can finally be used by ProLand to calculate
opportunity costs in terms of sustainable heavymetal criteria.
Trade-off and win-win situations
Integrating the results obtained by ITE2M can assist in the
definition of sustainable land use concepts. Based on the
same spatial land use and management information
provided by ProLand the remaining members of ITE2M
predict combinations of ecological landscape services such
as faunal and floristic diversity, N export from rivers,
groundwater recharge, or metal accumulation in soils. In
combination with the economic services simulated by
ProLand, trade-offs and win-win situation on land use and
management can be predicted, as is shown in Figure 7 for
the Aar catchment, a 60km2 subcatchment of the Dill
catchment. The basis of this evaluation is an extensification
of pasture management, the so called suckler cow land
management scenario. In this scenario, cows and their
offspring are kept on the meadows all year around to save
infrastructural farmstead costs and labour. In the present
247 A. van Griensven et al. | Environmental and ecological hydroinformatics Journal of Hydroinformatics | 08.4 | 2006
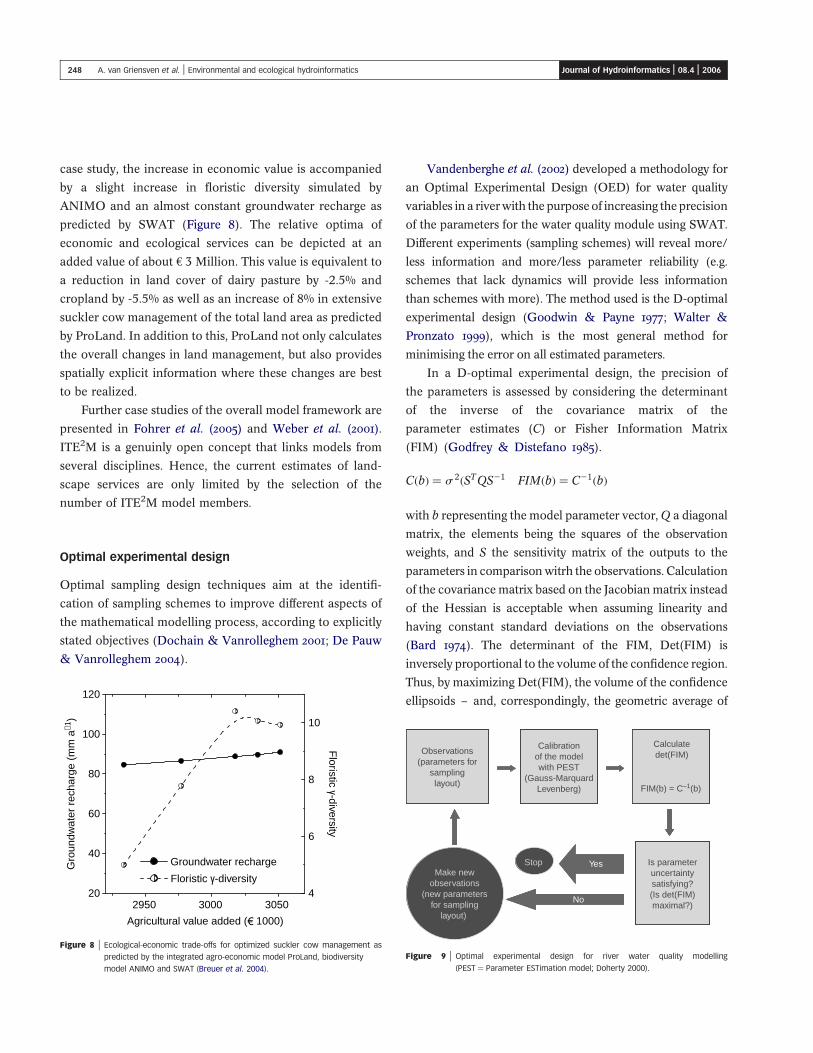
case study, the increase in economic value is accompanied
by a slight increase in floristic diversity simulated by
ANIMO and an almost constant groundwater recharge as
predicted by SWAT (Figure 8). The relative optima of
economic and ecological services can be depicted at an
added value of about e 3 Million. This value is equivalent to
a reduction in land cover of dairy pasture by -2.5% and
cropland by -5.5% as well as an increase of 8% in extensive
suckler cow management of the total land area as predicted
by ProLand. In addition to this, ProLand not only calculates
the overall changes in land management, but also provides
spatially explicit information where these changes are best
to be realized.
Further case studies of the overall model framework are
presented in Fohrer et al. (2005) and Weber et al. (2001).
ITE2M is a genuinly open concept that links models from
several disciplines. Hence, the current estimates of land-
scape services are only limited by the selection of the
number of ITE2M model members.
Optimal experimental design
Optimal sampling design techniques aim at the identifi-
cation of sampling schemes to improve different aspects of
the mathematical modelling process, according to explicitly
stated objectives (Dochain & Vanrolleghem 2001; De Pauw
& Vanrolleghem 2004).
Vandenberghe et al. (2002) developed a methodology for
an Optimal Experimental Design (OED) for water quality
variables in a riverwith the purposeof increasing the precision
of the parameters for the water quality module using SWAT.
Different experiments (sampling schemes) will reveal more/
less information and more/less parameter reliability (e.g.
schemes that lack dynamics will provide less information
than schemes with more). The method used is the D-optimal
experimental design (Goodwin & Payne 1977; Walter &
Pronzato 1999), which is the most general method for
minimising the error on all estimated parameters.
In a D-optimal experimental design, the precision of
the parameters is assessed by considering the determinant
of the inverse of the covariance matrix of the
parameter estimates (C) or Fisher Information Matrix
(FIM) (Godfrey & Distefano 1985).
CðbÞ ¼ s 2ðSTQS21 FIMðbÞ ¼ C21ðbÞ
with b representing the model parameter vector, Q a diagonal
matrix, the elements being the squares of the observation
weights, and S the sensitivity matrix of the outputs to the
parameters in comparisonwitrh the observations. Calculation
of the covariance matrix based on the Jacobianmatrix instead
of the Hessian is acceptable when assuming linearity and
having constant standard deviations on the observations
(Bard 1974). The determinant of the FIM, Det(FIM) is
inversely proportional to the volume of the confidence region.
Thus, by maximizing Det(FIM), the volume of the confidence
ellipsoids – and, correspondingly, the geometric average of
2950 3000 305020
40
60
80
100
120
4
6
8
10
Groundwater rechargeGro
undw
ater
rec
harg
e (m
m a
−1)
Floristic γ-diversity
Floristic γ-diversity
Agricultural value added ( 1000)
Figure 8 | Ecological-economic trade-offs for optimized suckler cow management as
predicted by the integrated agro-economic model ProLand, biodiversity
model ANIMO and SWAT (Breuer et al. 2004).
Observations(parameters for
samplinglayout)
Calibrationof the modelwith PEST
(Gauss-MarquardLevenberg)
Calculatedet(FIM)
FIM(b) = C–1(b)
Is parameteruncertaintysatisfying?(Is det(FIM)maximal?)
Yes
No
StopMake new
observations(new parameters
for samplinglayout)
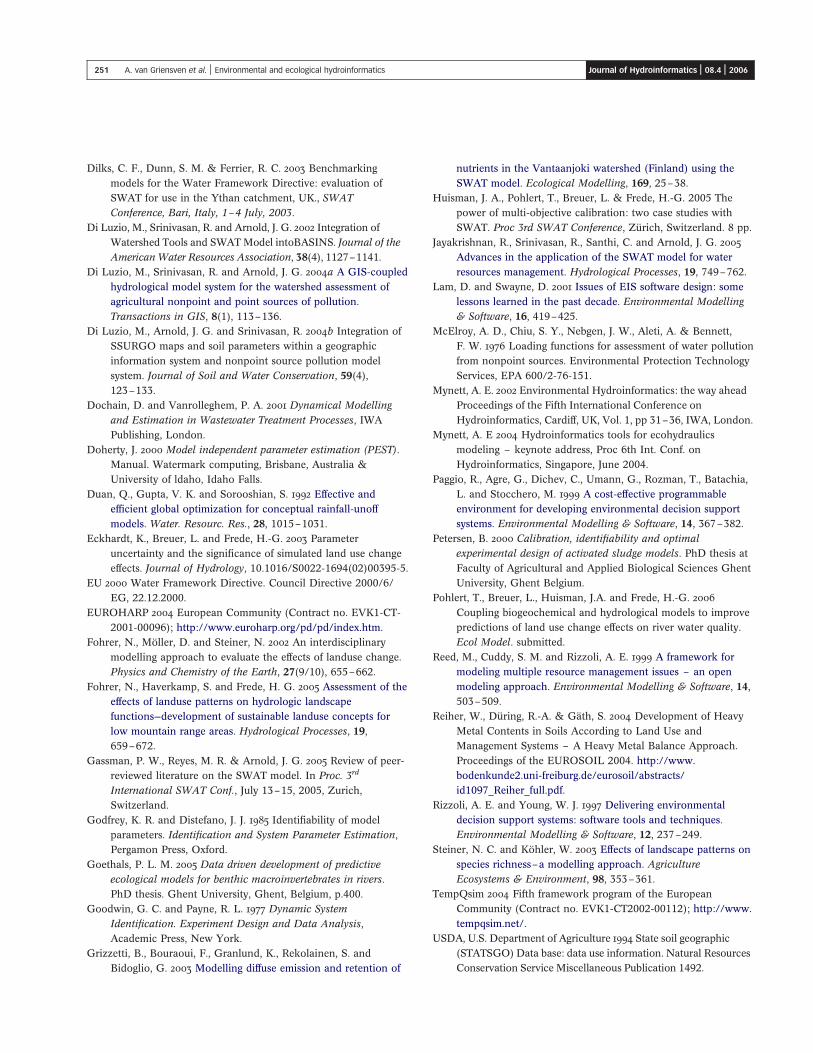
Figure 9 | Optimal experimental design for river water quality modelling
(PEST ¼ Parameter ESTimation model; Doherty 2000).
248 A. van Griensven et al. | Environmental and ecological hydroinformatics Journal of Hydroinformatics | 08.4 | 2006
the parameter errors - is minimized. D-optimal experiments
also have the advantage of being invariant with respect to
any scaling of the parameters (Petersen 2000). An extra
aspect to be considered here is that for non-linear models
the FIM is parameter dependent. The OED technique thus
requires an initial data set to calibrate the model. Non-
accurate parameter estimates may therefore lead to an
inefficient experimental layout. This means that for the
processes related to the non-accurate parameters better
measurements could be identified. The design can only be
approached by an iterative process of data collection and
design refinement, known as a “sequential design” (Casman
et al. 1988). Figure 9 shows the iterative scheme that is used
to find the optimal measurements starting with a model that
is calibrated with the currently available data. The different
steps are explained in more detail hereafter.
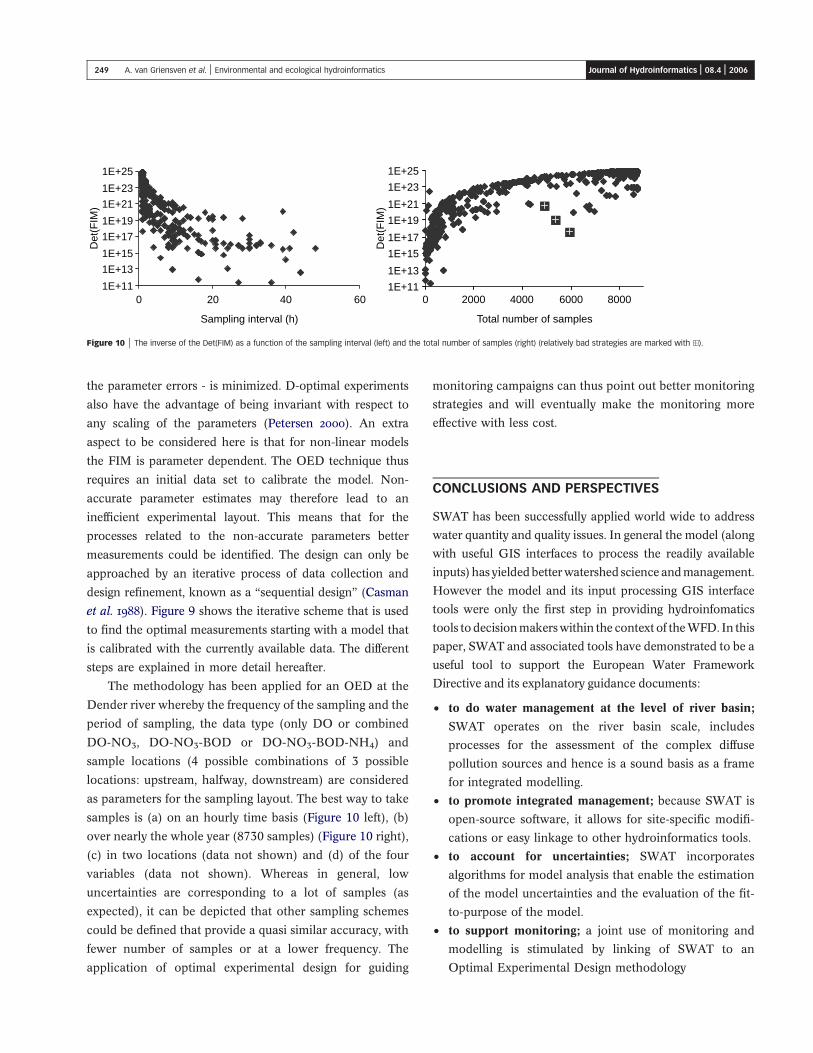
The methodology has been applied for an OED at the
Dender river whereby the frequency of the sampling and the
period of sampling, the data type (only DO or combined
DO-NO3, DO-NO3-BOD or DO-NO3-BOD-NH4) and
sample locations (4 possible combinations of 3 possible
locations: upstream, halfway, downstream) are considered
as parameters for the sampling layout. The best way to take
samples is (a) on an hourly time basis (Figure 10 left), (b)
over nearly the whole year (8730 samples) (Figure 10 right),
(c) in two locations (data not shown) and (d) of the four
variables (data not shown). Whereas in general, low
uncertainties are corresponding to a lot of samples (as
expected), it can be depicted that other sampling schemes
could be defined that provide a quasi similar accuracy, with
fewer number of samples or at a lower frequency. The
application of optimal experimental design for guiding
monitoring campaigns can thus point out better monitoring
strategies and will eventually make the monitoring more
effective with less cost.
CONCLUSIONS AND PERSPECTIVES
SWAT has been successfully applied world wide to address
water quantity and quality issues. In general the model (along
with useful GIS interfaces to process the readily available
inputs) has yieldedbetterwatershed science andmanagement.
However the model and its input processing GIS interface
tools were only the first step in providing hydroinfomatics
tools todecisionmakerswithin the context of theWFD. In this
paper, SWAT and associated tools have demonstrated to be a
useful tool to support the European Water Framework
Directive and its explanatory guidance documents:
† to do water management at the level of river basin;
SWAT operates on the river basin scale, includes
processes for the assessment of the complex diffuse
pollution sources and hence is a sound basis as a frame
for integrated modelling.
† to promote integrated management; because SWAT is
open-source software, it allows for site-specific modifi-
cations or easy linkage to other hydroinformatics tools.
† to account for uncertainties; SWAT incorporates
algorithms for model analysis that enable the estimation
of the model uncertainties and the evaluation of the fit-
to-purpose of the model.
† to support monitoring; a joint use of monitoring and
modelling is stimulated by linking of SWAT to an
Optimal Experimental Design methodology
1E+11
1E+13
1E+15
1E+17
1E+19
1E+21
1E+23
1E+25
0 20 40 60
Sampling interval (h)
Det
(FIM
)
1E+11
1E+13
1E+15
1E+17
1E+19
1E+21
1E+23
1E+25
0 2000 4000 6000 8000
Total number of samples
Det
(FIM
)
Figure 10 | The inverse of the Det(FIM) as a function of the sampling interval (left) and the total number of samples (right) (relatively bad strategies are marked with i).
249 A. van Griensven et al. | Environmental and ecological hydroinformatics Journal of Hydroinformatics | 08.4 | 2006
† to set targets for ecological quality; this is illustrated by
the examples of linkage to ecological assessment tools as
provided in this paper
† to support public participation; an important develop-
ment around SWAT is the integration into the GIS post-
processing tool AVSWAT that graphically displays the
results.
However, applications in Europe can also be hampered by
difficulties in data availability or the lack of regional
databases. Only recently, the development of some Euro-
pean databases has been started (Breuer et al. 2003; Breuer
& Frede 2006). Therefore, an integrated data and modelling
tool such as the “BASINS” modelling evironment for the
US (Di Luzio et al. 2002), would be of great necessity. In
such a modeling environment several homogenized data on
land use, soil properies, climate conditions, river networks,
discharges, point sources etc. can be provided and for-
matted for direct use. Within the European multi-national
structure with its different data policies, as well as multi-
faceted ways of soil and land use classification, one of the
main difficulties lies in the data homogenization itself. Also,
more developments would enhance external use of the
SWAT model results. Important benefits could be obtained
from a further integration into an internet interface to allow
for web-based simulations or web-based post-processing of
the model results. Finally, an open source policy for not
only the SWAT model but also for the GIS interface would
stimulate further integration with other tools or would offer
more flexibilities for case-dependent developments in
model codes. In general, it can be concluded that
Environmental and Ecological Hydroinformatics tools
prove to be quite valuable for implementing the European
Water Framework Directive for River Basin Management.
REFERENCES
Adriaenssens, V., De Baets, B., Goethals, P. L. M. & De Pauw, N.
2004 Fuzzy rule-based models for decision support in
ecosystem management. The Science of the Total Environment,
319, 1–12.
Argent, R. M. 2004 An overview of model integration for
environmental applications – components, frameworks and
semantics. Environmental Modelling & Software, 19, 219–234.
Arnold, J. G. & Fohrer, N. 2005 Current capabilities and research
opportunities in applied watershed modeling. Hydrological
Processes, 19, 563–572.
Arnold, J. G., Srinivasan, R., Muttiah, R. S. & Williams, J. R. 1998
Large area hydrologic modeling and assessment Part I: Model
development. Journal of the American Water Research
Association, 34(1), 73–89.
Bagnold, R. A. 1977 Bedload transport in natural rivers. Water
Resources Research, 13, 303–312.
Bard, Y. 1974 Nonlinear Parameter Estimation, Academic press,
New York and London.
BMW 2004 Benchmark Models for the Water Framework Directive.
Fifth framework program of the European Community
(Contractno.EVK1-CT2001-0093).
Booty, W. G., Lam, D. C. L., Wong, I. W. S. & Siconolfi, P. 2001Design
and implementation of an environmental decision support
system. Environmental Modelling & Software, 16, 453–458.
Bouraoui, F., Grizzetti, B., Mulligan, D. & Galbiati, L. L. 2005
Performance of the SWAT model in an inter-comparison of
nutrient loss quantification tools throughout Europe
(EUROHARP project). Proc 3rd SWAT Conference, Zurich,
Switzerland. http://www.brc.tamus.edu/swat/3rdswatconf/
PDF/day_1/Bouraoui.pdf.
Breuer, L., Eckhardt, K. & Frede, H.-G. 2003 Plant parameter
values for models in temperate climates. Ecological Modelling,
169, 237–293.
Breuer, L. & Frede, H.-G. 2006 PlaPaDa – an online plant
parameter data drill for eco-hydrological modelling
approaches. http://www.unigiessen.de/,gh1461/plapada/
plapada.html.
Breuer, L., Huisman, J. A., Steiner, N., Weinmann, B. & Frede, H.-G.
2004 Eco-hydrologic and economic trade-off functions in
watershed management. TWRI Technical Report 266, 255–261.
Brown, L. C. and Barnwell, T. O., Jr 1987 The Enhanced Water
Quality Models QUAL2E and QUAL2E-UNCAS
Documentation and User Manual. EPA Document EPA/600/
3-87/007. USEPA, Athens, GA.
Casman, E.A., Naiman, D. Q. and Chamberlain, C. E. 1988
Confronting the ironies of optimal design: nonoptimal
sampling designs with desirable properties. Water Resources
Research, 24(3), 409–415.
CHESS 2001 Climate, hydrochemistry and economics of surface-
water systems. EC Environment and Climate Research
Programme (Contract no. ENV4-CT-97-0440) http://www.
nwl.ac.uk/ih/www/research/images/chessreport.pdf.
Chow, V.T., Maidment, D.R. and Mays, L.W. 1988 Applied
Hydrology, McGraw-Hill, New York, NY.
Costanza, R., d’Arge, R., de Groot, R., Farber, S., Grasso, M.,
Hannon, B., Limburg, K., Naeem, S., O’Neill, R.V., Paruelo, J.,
Raskin, R. G., Sutton, P. and van den Belt, M. 1997 The value
of the world’s ecosystem services and natural capital. Nature,
387, 253–260.
De Pauw, D. & Vanrolleghem, P. A. 2004 Optimal experimental
design for model calibration: general procedure. In:
Proceedings of the 4th PhD symposium, Ghent, Belgium.
250 A. van Griensven et al. | Environmental and ecological hydroinformatics Journal of Hydroinformatics | 08.4 | 2006
Dilks, C. F., Dunn, S. M. & Ferrier, R. C. 2003 Benchmarking
models for the Water Framework Directive: evaluation of
SWAT for use in the Ythan catchment, UK., SWAT
Conference, Bari, Italy, 1–4 July, 2003.
Di Luzio, M., Srinivasan, R. and Arnold, J. G. 2002 Integration of
Watershed Tools and SWATModel intoBASINS. Journal of the
American Water Resources Association, 38(4), 1127–1141.
Di Luzio, M., Srinivasan, R. and Arnold, J. G. 2004a A GIS-coupled
hydrological model system for the watershed assessment of
agricultural nonpoint and point sources of pollution.
Transactions in GIS, 8(1), 113–136.
Di Luzio, M., Arnold, J. G. and Srinivasan, R. 2004b Integration of
SSURGO maps and soil parameters within a geographic
information system and nonpoint source pollution model
system. Journal of Soil and Water Conservation, 59(4),
123–133.
Dochain, D. and Vanrolleghem, P. A. 2001 Dynamical Modelling
and Estimation in Wastewater Treatment Processes, IWA
Publishing, London.
Doherty, J. 2000 Model independent parameter estimation (PEST).
Manual. Watermark computing, Brisbane, Australia &
University of ldaho, Idaho Falls.
Duan, Q., Gupta, V. K. and Sorooshian, S. 1992 Effective and
efficient global optimization for conceptual rainfall-unoff
models. Water. Resourc. Res., 28, 1015–1031.
Eckhardt, K., Breuer, L. and Frede, H.-G. 2003 Parameter
uncertainty and the significance of simulated land use change
effects. Journal of Hydrology, 10.1016/S0022-1694(02)00395-5.
EU 2000 Water Framework Directive. Council Directive 2000/6/
EG, 22.12.2000.
EUROHARP 2004 European Community (Contract no. EVK1-CT-
2001-00096); http://www.euroharp.org/pd/pd/index.htm.
Fohrer, N., Moller, D. and Steiner, N. 2002 An interdisciplinary
modelling approach to evaluate the effects of landuse change.
Physics and Chemistry of the Earth, 27(9/10), 655–662.
Fohrer, N., Haverkamp, S. and Frede, H. G. 2005 Assessment of the
effects of landuse patterns on hydrologic landscape
functions—development of sustainable landuse concepts for
low mountain range areas. Hydrological Processes, 19,
659–672.
Gassman, P. W., Reyes, M. R. & Arnold, J. G. 2005 Review of peer-
reviewed literature on the SWAT model. In Proc. 3rd
International SWAT Conf., July 13–15, 2005, Zurich,
Switzerland.
Godfrey, K. R. and Distefano, J. J. 1985 Identifiability of model
parameters. Identification and System Parameter Estimation,
Pergamon Press, Oxford.
Goethals, P. L. M. 2005 Data driven development of predictive
ecological models for benthic macroinvertebrates in rivers.
PhD thesis. Ghent University, Ghent, Belgium, p.400.
Goodwin, G. C. and Payne, R. L. 1977 Dynamic System
Identification. Experiment Design and Data Analysis,
Academic Press, New York.
Grizzetti, B., Bouraoui, F., Granlund, K., Rekolainen, S. and
Bidoglio, G. 2003 Modelling diffuse emission and retention of
nutrients in the Vantaanjoki watershed (Finland) using the
SWAT model. Ecological Modelling, 169, 25–38.
Huisman, J. A., Pohlert, T., Breuer, L. & Frede, H.-G. 2005 The
power of multi-objective calibration: two case studies with
SWAT. Proc 3rd SWAT Conference, Zurich, Switzerland. 8 pp.
Jayakrishnan, R., Srinivasan, R., Santhi, C. and Arnold, J. G. 2005
Advances in the application of the SWAT model for water
resources management. Hydrological Processes, 19, 749–762.
Lam, D. and Swayne, D. 2001 Issues of EIS software design: some
lessons learned in the past decade. Environmental Modelling
& Software, 16, 419–425.
McElroy, A. D., Chiu, S. Y., Nebgen, J. W., Aleti, A. & Bennett,
F. W. 1976 Loading functions for assessment of water pollution
from nonpoint sources. Environmental Protection Technology
Services, EPA 600/2-76-151.
Mynett, A. E. 2002 Environmental Hydroinformatics: the way ahead
Proceedings of the Fifth International Conference on
Hydroinformatics, Cardiff, UK, Vol. 1, pp 31–36, IWA, London.
Mynett, A. E 2004 Hydroinformatics tools for ecohydraulics
modeling – keynote address, Proc 6th Int. Conf. on
Hydroinformatics, Singapore, June 2004.
Paggio, R., Agre, G., Dichev, C., Umann, G., Rozman, T., Batachia,
L. and Stocchero, M. 1999 A cost-effective programmable
environment for developing environmental decision support
systems. Environmental Modelling & Software, 14, 367–382.
Petersen, B. 2000 Calibration, identifiability and optimal
experimental design of activated sludge models. PhD thesis at
Faculty of Agricultural and Applied Biological Sciences Ghent
University, Ghent Belgium.
Pohlert, T., Breuer, L., Huisman, J.A. and Frede, H.-G. 2006
Coupling biogeochemical and hydrological models to improve
predictions of land use change effects on river water quality.
Ecol Model. submitted.
Reed, M., Cuddy, S. M. and Rizzoli, A. E. 1999 A framework for
modeling multiple resource management issues – an open
modeling approach. Environmental Modelling & Software, 14,
503–509.
Reiher, W., During, R.-A. & Gath, S. 2004 Development of Heavy
Metal Contents in Soils According to Land Use and
Management Systems – A Heavy Metal Balance Approach.
Proceedings of the EUROSOIL 2004. http://www.
bodenkunde2.uni-freiburg.de/eurosoil/abstracts/
id1097_Reiher_full.pdf.
Rizzoli, A. E. and Young, W. J. 1997 Delivering environmental
decision support systems: software tools and techniques.
Environmental Modelling & Software, 12, 237–249.
Steiner, N. C. and Kohler, W. 2003 Effects of landscape patterns on
species richness–a modelling approach. Agriculture
Ecosystems & Environment, 98, 353–361.
TempQsim 2004 Fifth framework program of the European
Community (Contract no. EVK1-CT2002-00112); http://www.
tempqsim.net/.
USDA, U.S. Department of Agriculture 1994 State soil geographic
(STATSGO) Data base: data use information. Natural Resources
Conservation Service Miscellaneous Publication 1492.
251 A. van Griensven et al. | Environmental and ecological hydroinformatics Journal of Hydroinformatics | 08.4 | 2006
USDA, U.S. Department of Agriculture 1995 Soil survey geographic
(SSURGO) Data base: Data Use information. Natural Resources
Conservation Service Miscellaneous Publication 1527.
Vandenberghe, V., van Griensven, A. and Bauwens, W. 2002Detection
of the most optimal measuring points for water quality variables:
Application to the river water quality model of the river Dender
in ESWAT. Water Science & Technology, 46(3), 1–7.
Vandenberghe, V., van Griensven, A. and Bauwens, W. 2005
Propagation of uncertainty in diffuse pollution into water
quality predictions: application to the River Dender in
Flanders. Water Science & Technology, 51(3–4), 347–354.
van Griensven, A. and Bauwens, W. 2001 Integral modelling of
catchments. Water Science & Technology, 43(7), 321–328.
van Griensven, A. and Bauwens, W. 2003Multi-objective auto-
calibration for semi-distributed water quality models. Water
Resources Research, 39(10), 1348 doi: 10.1029/2003WR002284.
van Griensven, A. and Bauwens, W. 2005 Application and
evaluation of ESWAT on the Dender basin and Wister Lake
basin. Hydrolological Processes, 19(3), 827–838.
van Griensven, A. and Meixner, T. 2006 Methods to quantify and
identify the sources of uncertainty for river basin water quality
models. Water Science & Technology, 53(1), 51–59.
van Griensven, A., Meixner, T., Grunwald, S., Bishop, T., Di Luzio,
M. and Srinivasan, R. 2006 A global sensitivity analysis
method for the parameters of multi-variable watershed models.
Journal of Hydrology, 324(1–4), 10–23.van Griensven, A. and Meixner, T. 2006 Methods to quantify and
identify the sources of uncertainty for river basin water quality
models. Water Science & Technology, 53(11) 51–59.
Voinov, A., Fitz, C., Boumans, R. and Costanza, R. 2004 Modular
ecosystem modeling. Environmental Modelling & Software,
19, 285–304.
Waldhardt, R., Simmering, D. and Otte, A. 2004 Estimation and
prediction of plant species richness in a mosaic landscape.
Landscape Ecology, 19, 211–226.
Walter, E. and Pronzato, L. 1999 Identification of Parametric
Models from Experimental Data. Springer Verlag,
Heidelberg.
Weber, A., Fohrer, N. and Moller, D. 2001 Long-term land use
changes in a mesoscale watershed due to socio-economic
factors – effects on landscape and functions. Ecological
Modelling, 140, 125–140.
Weinmann, B., Schroers, J. O. and Sheridian, P. 2005 Simulating
the effects of decoupled transfer payments using the land use
model ProLand. Agrarwirtschaft, 54 in press.
Williams, J. R. & Hann, R. W. 1978 Optimal operation of large
agricultural watersheds with water quality constraints.
Technical Report No. 96, Texas Water Resources Institute,
Texas A&M University, College Station, TX.
Witten, I. H. & Frank, E. 2000 Data Mining: practical
machine learning tools and techniques with Java
implementations. Morgan Kaufmann Publishers, San
Francisco. 369 pp.
Young, W.J., Lam, D. C. L., Ressel, V. and Wong, I. W. 2000
Development of an environmental flows decision
support system. Environmental Modelling & Software,
15, 257–265.
252 A. van Griensven et al. | Environmental and ecological hydroinformatics Journal of Hydroinformatics | 08.4 | 2006