hydrogeology of hard rock aquifer system - a case …ijsrst.com/paper/1435.pdfsandy soil hill soil,...
TRANSCRIPT

IJSRST17378 | Received 25 Aug 2017 | Accepted : 05 Sep 2017 | September-October-2017 [(3) 7: 09-14]
© 2017 IJSRST | Volume 3 | Issue 7 | Print ISSN: 2395-6011 | Online ISSN: 2395-602X Themed Section: Science and Technology
9
Hydrogeology of Hard Rock Aquifer System - A Case Study from Turinjahalli
Watershed, Dharmapuri District, Tamilnadu, India M. Panneer
1*, R. Sivakumar
2
1Assistant Hydrogeologist, Central Ground Water Board, SECR, MoWR, RD and GR, Chennai, Tamil Nadu, India
2Associate Professor and Head, Department of Geology, Presidency College (Autonomous), Chennai, Tamil Nadu, India
ABSTRACT
Hydrogeology hard rock aquifer system is very complex and the occurrence and movement of groundwater mainly
controlled by secondary porosity developed from the weathering and structural deformity undergone by the rocks.
The study area forms part of the poly-metamorphic and multistructural Archaean complex is underlain by crystalline
formations consists of charnockite and hornblende biotite gneiss. There are major aquifer units delineated in the
watershed based on the aquifer parameters and water level behaviour. The aquifer units are weathered aquifers and
fractured aquifers, depth of weathered and fractured aquifers in the study area ranged between 2 to 29 m and 29 to
185 m respectively. The weathered aquifer contains water during monsoon season and becomes dry whereas the
fractured aquifers yield water and four to five sets of fractures encountered in the aquifer system. 103 monitoring
stations were established for groundwater level monitoring and carried out pre- and post-monsoon water level
measurements. The depth to water levels in observation wells tapping aquifer during pre monsoon ranged between
10.90 m.bgl and 25.30 m.bgl and during post monsoon ranged between 12 and 31.20 m.bgl. The water table
elevation map was prepared using the reduced levels for the monitoring stations to know the groundwater flow
direction in the watershed. The map reveals that groundwater flow direction is from south-west to east/north-east
direction. Based on Darcy’s equation, the rate of flow of groundwater in the aquifer system depends on the
hydraulic gradient and hydraulic conductivity. The total amount of groundwater flowing through aquifer system in
the watershed is 4.36 cubic meters per second.
Keywords : Hard Rock Aquifers, Water Levels, Groundwater Movement, Turinjahalli Watershed, Dharmapuri
I. INTRODUCTION
Thus the water is essential for sustenance of all forms of
life and is one of the principal elements which influence
economic, industrial and agricultural growth of the
mankind. The increasing demand and quest for
groundwater due to ever increasing population has
compelled mankind to efficiently manage this precious
resource. As groundwater continues to play an important
role in the development of the human civilization, there
arises a strong need for protecting groundwater from
increasing threat of over extraction and contamination.
Hence, it is important to understand the aquifer system
and its hydrodynamics so as to properly manage the
groundwater resources. About three-fourths of Tamil
Nadu state is underlain by hard crystalline rocks of
Archaean age (Ramesh et al., 1983 and Subramanian et
al., 2001), which are devoid of any primary porosity on
account of its massive and consolidated nature. The
occurrence and movement of groundwater in these rocks
are restricted to the weathered zone or fractures at depth
and the groundwater potential of these rocks, in general,
are poor (Sivaramakrishnan et al., 2016). The over
exploitation of groundwater resources, frequent drought
and erratic rainfall have leading to decline in
groundwater level and drying of aquifers has put a stress
on the available groundwater resources of Turinjahalli
watershed, Dharmapuri district, Tamiladu, India. Hence,
this watershed or aquifer system has been taken up in
this research study with an objective to delineate the
aquifer units, occurrence and movement of groundwater
in hard rock aquifers.
Study area
In order to understand the groundwater occurrence and
its movement in the hard rock aquifer system, the
Turinjahalli watershed is part of Vaniar River basin were

International Journal of Scientific Research in Science and Technology (www.ijsrst.com)
10
considered. The Turinjahalli watershed covers areas,
comprises of Morappur, Harur and Pappireddipatti
blocks, Dharmapuri district, Tamilnadu. The percentage
of area of watershed falls in the blocks of Morappur,
Harur and Pappireddipatti are 70, 23 and 7 percent
respectively. Harur and Kadathur are the major town
falls in the watershed. The total geographical area of the
watershed is 304.6 sq.km The study area is located
between North latitude 11◦59’00” to 12
◦07’ 15” and
E ast longitude 78◦12’ 45” to 78
◦32’ 00” and is
covered in parts of Survey of India toposheet Nos.
57L/4, 57L/8, 57L/12 and 57I/5. The topographic
elevation ranges from 314 to 1103 m above mean sea
level (a.msl). The population of the study area works out
as 102510. About 95 percent of the population resides in
rural areas. The administrative map of Turinjahalli
watershed are shown in figure 1.
Tuinjahalli River is ephemeral river and it is tributary of
Vaniar river (Nanadakumaran 2007). The river carries
substantial flow only during monsoon period. The
drainage patterns observed in the watershed are dentritic
to sub-parallel. Agriculture is main activities and about
60 percent of the area under agriculture activities.
Flowers, vegetables, paddy, maize and raggi are the
main crops, source of irrigation through groundwater
only. The geomorphic unit present in the watershed
includes buried pediments, valley fill, dissected hills,
pediment inselberg and inslberg complex. The soils
occur in this watershed are hill bottom soils and red
sandy soil hill soil, reserve forest soil, black cotton soil
and laterritic soil.
Figure 1. Administrative setup of Turinjahalli watershed
II. METHODS AND MATERIAL
Field studies included geological investigations, drilling
of bore wells, geophysical investigations and
groundwater level monitoring. In order to understand the
geology of the region, the available geological maps and
existing reports were studied. The thickness and
intensity of weathering were studied from borehole
lithological data, geophysical data and information from
river cuttings and well sections. To carry out the present
study, it was necessary to have more number of
representative wells. Hence, initially a well inventory
study was carried out in most of the wells present in this
area. The area under study has been studied on a regular
basis by monitoring of groundwater levels. 103
monitoring stations were established and basic data on
the monitoring stations such as depth, topographic
elevation, weathered thickness and fracture depth were
recorded. Water levels were monitored during pre and
post monsoon period, i.e. June and January months for
the period of two years from 2013 to 2015. Groundwater
level was measured in open wells and bore wells using
water measuring tape and water level recorders.
III. RESULTS AND DISCUSSION
Geology
The study area forms part of the poly-metamorphic and
multi-structural Archaean Complex of Peninsular India
and is underlain by crystalline formations with localised
very small patches of recent alluvial deposits along the
river. Charnockite and hornblende biotite gneisses occur
extensively in the watershed. Amphibolites, ultramafic
rocks and veins of pegmatite/quartz are seen in the rocks
all over the watershed. The hornblende biotite gneiss is
comparatively friable than the charnockite. The
hornblende biotite gneiss is more susceptible for
weathering and charnockite are less susceptible. The
geological map of the Turinjahalli watershed is shown in
figure 2. The two dimensional disposition of different
aquifers in the Turinjahalli watershed in different section
lines (figure 2) prepared and two dimensional aquifer
disposition with respect to depth is presented in figures
2a, and 2b respectively.

International Journal of Scientific Research in Science and Technology (www.ijsrst.com)
11
Figure 2. Geological map and section lines drawn for
two dimensional aquifers disposition
Aquifer system
Based on the results of groundwater exploration,
geophysical data (CGWB 2003, 2013) and field studies
undertaken in watershed, the rock formations grouped as
two aquifers system (Panneer et al., 2013, 2016) and the
aquifers exists in watershed are classified in to; Phreatic
aquifers, depth range from 2 to 29 m and contain water
during monsoon season, discharge ranged from
negligible to 180 litres per minute. The yield of large
diameter wells tapping the weathered mantle of
crystalline rocks ranges from 100 to 150 m3/day for a
drawdown of 3–6 m/day and is able to sustain pumping
for 1–2 hours. The specific capacity and transmissivity
values of weathered aquifer ranges from 6 to 28
lpm/m/dd and 12 to 20 m2/day respectively.
Groundwater in these aquifers occurs in un-confined
conditions. Fractured aquifers occur at depth ranges
from 29 to 185 m and contain water, yield of the
aquifers maximum of 150 lpm. Four to five sets of
fractures are encountered up to the depth of 200 m bgl in
a bore wells. The specific capacity and transmissivity
value in the fractured/fissured formations ranges from 3
to 150 lpm/m/dd and 0. 5 to 117.32 m2/day while the
storativity ranged from 4.37 x 10⁻⁴
to 7.89 x 10⁻³
. The
groundwater in this fractured/fissured formation occurs
under semi-confined to confined condition.
Figure 2a. Two dimensional aquifer dispositions along
line B-B´
Figure 2b. Two dimensional aquifer dispositions along line
C-C´.
Depth to water levels
The relationship between water level and rainfall was
studied from the seasonal and spatial variations in the
groundwater table. The groundwater level of the study
area is a composite representation of heads of the single
aquifer of two sub layers varying lithologically and
hydrogeologically. The wells monitored were tapping
both the aquifers and are hydrogeologically connected.
The map showing locations of groundwater level
monitoring stations are shown in figure 3.
Figure 3. Locations of monitoring ststion
During pre-monsoon in May 2014, the depth to water
levels in observation wells tapping the phreatic aquifer
in the basin ranged from 10.90 m.bgl (Location:
Ettiapatti) to 25.30 m.bgl (Location: Andipatti Pudur).
The depth to water level in the watershed is in the range
of 15 to 20 m.bgl in 80 percent of the wells analysed, 12
percent of wells analysed have recorded the water levels
between 20 to 25 mbgl, the water levels between 12 and
15 m.bgl in 6 percent of wells and one percents of wells

International Journal of Scientific Research in Science and Technology (www.ijsrst.com)
12
recorded water level less than 12 m and 25 to 30
respectively. The depth to water levels in the watershed
during pre-monsoon prepared using water level data of
monitoring stations in Turinjahalli watershed are shown
in figure 4.
Figure 4. Depth to water level map during pre-monsoon
During post monsoon in January 2015, the water levels
in the study area shown similar pattern water level of
pre-monsoon due to failure of monsoon. Continuous
withdrawal groundwater for agricultural and domestic
need the post-monsoon water is deeper than pre-
monsoon. The shallowest water levels less than 15 m
were observed predominantly in Kadathur and adjoining
area, where groundwater extraction is less as the surface
water tanks cater the agricultural needs. Majority of
observation wells showed water levels in the range of 15
to 20 m.bgl. Water levels in the range 20 to 25 m.bgl
were observed near the Harur town and adjoining area.
Deepest water levels greater than 30 m were observed in
north eastern part of the watershed, where the ground
water is withdrawn for Morapaur town cater the town
water supply. The map showing the depth to water level
map observed during post monsoon period is presented
in figure 5.
Figure 5. Depth to water level map during post
monsoon.
The seasonal fluctuations of ground water levels in the
aquifer system in the watershed have been analysed and
presented. The seasonal water level fluctuation in the
area has been analysed using the water level data of May
2014 and January 2015. The fluctuation of water levels
(figure 6) indicates the very little extent of
replenishment of shallow aquifers due to the monsoon
rainfall. The water level fluctuation in the study area
ranged from a decline of 1.72 m. (Location: Sunkarahalli)
to a rise of 7.30 m (Location: Punganur) during the
period. Rise in water levels during the period has been
observed in more than 68 percent of the wells
considered. The rise in water levels is in the range of 0
to 2 m. in about 70 percent of these wells, between >2
and 4 m in about 29 percent and more than 4 m in about
1 percent of well. Fall in water levels is observed in
about 32 percent observation wells in the study area with
a magnitude of less than 2 m during the period,
indicating recharge insufficient to compensate the
withdrawal of ground water from phreatic zone.
Figure 6. Seasonal water level fluctuation map.
A water-level contour map is a common tool used to
understand groundwater flow directions in a watershed.
Todd (1959) asserts that under steady state conditions,
flow lines lie perpendicular to water table contours.
From field measurements of static water levels in wells,
a water table elevation contour map can be constructed
for a watershed. Water level elevation contours were
generated using water levels and elevation data of
monitoring wells. The water level elevation map defines
the potentiometiric surface and distribution of potential
energy in the hard rock aquifer system. Each contour or
equipotential lines represents the line of equal hydraulic
gradients. Groundwater flows from high to low
hydraulic gradient as the case of surface water.
International Journal of Scientific Research in Science and Technology (www.ijsrst.com)
13
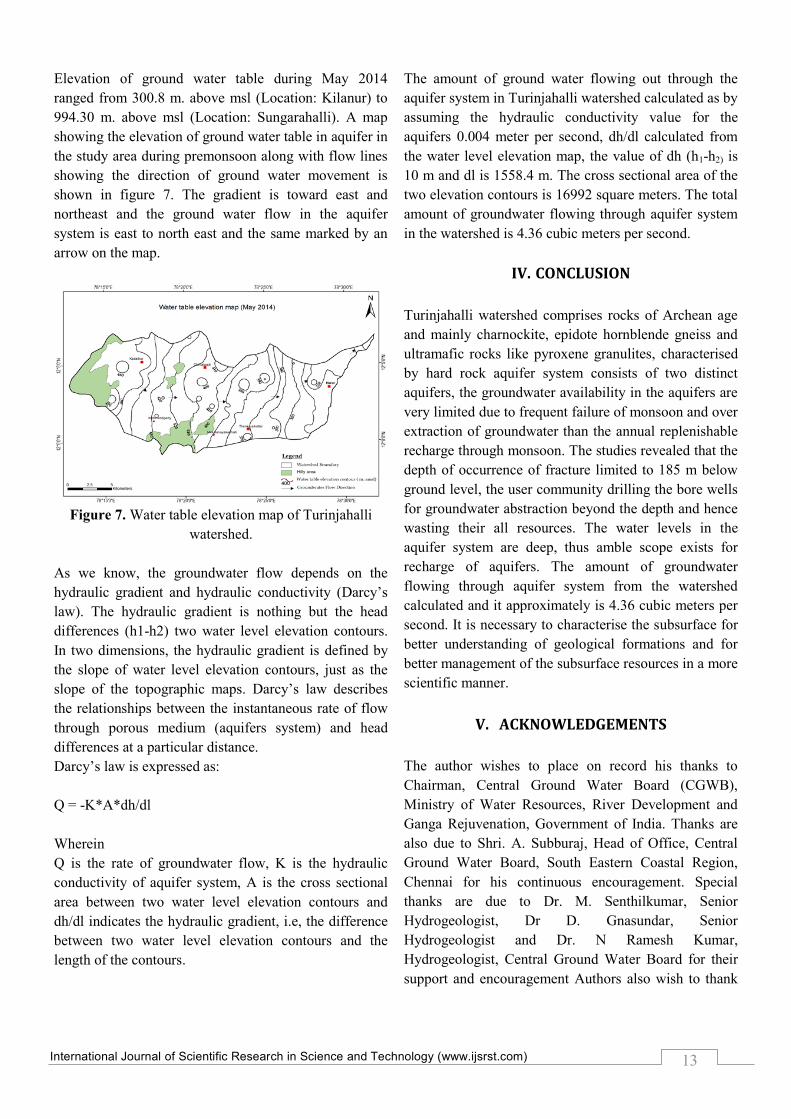
Elevation of ground water table during May 2014
ranged from 300.8 m. above msl (Location: Kilanur) to
994.30 m. above msl (Location: Sungarahalli). A map
showing the elevation of ground water table in aquifer in
the study area during premonsoon along with flow lines
showing the direction of ground water movement is
shown in figure 7. The gradient is toward east and
northeast and the ground water flow in the aquifer
system is east to north east and the same marked by an
arrow on the map.
Figure 7. Water table elevation map of Turinjahalli
watershed.
As we know, the groundwater flow depends on the
hydraulic gradient and hydraulic conductivity (Darcy’s
law). The hydraulic gradient is nothing but the head
differences (h1-h2) two water level elevation contours.
In two dimensions, the hydraulic gradient is defined by
the slope of water level elevation contours, just as the
slope of the topographic maps. Darcy’s law describes
the relationships between the instantaneous rate of flow
through porous medium (aquifers system) and head
differences at a particular distance.
Darcy’s law is expressed as:
Q = -K*A*dh/dl
Wherein
Q is the rate of groundwater flow, K is the hydraulic
conductivity of aquifer system, A is the cross sectional
area between two water level elevation contours and
dh/dl indicates the hydraulic gradient, i.e, the difference
between two water level elevation contours and the
length of the contours.
The amount of ground water flowing out through the
aquifer system in Turinjahalli watershed calculated as by
assuming the hydraulic conductivity value for the
aquifers 0.004 meter per second, dh/dl calculated from
the water level elevation map, the value of dh (h1-h2) is
10 m and dl is 1558.4 m. The cross sectional area of the
two elevation contours is 16992 square meters. The total
amount of groundwater flowing through aquifer system
in the watershed is 4.36 cubic meters per second.
IV. CONCLUSION
Turinjahalli watershed comprises rocks of Archean age
and mainly charnockite, epidote hornblende gneiss and
ultramafic rocks like pyroxene granulites, characterised
by hard rock aquifer system consists of two distinct
aquifers, the groundwater availability in the aquifers are
very limited due to frequent failure of monsoon and over
extraction of groundwater than the annual replenishable
recharge through monsoon. The studies revealed that the
depth of occurrence of fracture limited to 185 m below
ground level, the user community drilling the bore wells
for groundwater abstraction beyond the depth and hence
wasting their all resources. The water levels in the
aquifer system are deep, thus amble scope exists for
recharge of aquifers. The amount of groundwater
flowing through aquifer system from the watershed
calculated and it approximately is 4.36 cubic meters per
second. It is necessary to characterise the subsurface for
better understanding of geological formations and for
better management of the subsurface resources in a more
scientific manner.
V. ACKNOWLEDGEMENTS
The author wishes to place on record his thanks to
Chairman, Central Ground Water Board (CGWB),
Ministry of Water Resources, River Development and
Ganga Rejuvenation, Government of India. Thanks are
also due to Shri. A. Subburaj, Head of Office, Central
Ground Water Board, South Eastern Coastal Region,
Chennai for his continuous encouragement. Special
thanks are due to Dr. M. Senthilkumar, Senior
Hydrogeologist, Dr D. Gnasundar, Senior
Hydrogeologist and Dr. N Ramesh Kumar,
Hydrogeologist, Central Ground Water Board for their
support and encouragement Authors also wish to thank

International Journal of Scientific Research in Science and Technology (www.ijsrst.com)
14
their colleagues for their support and association in
many ways.
VI. REFERENCES
[1]. CGWB (2003) District Groundwater Management
Studies in parts of Dharmapuri district, Tamilnadu, p
69
[2]. CGWB (2013) Aquifer mapping report of Morappur
region Dharmapuri district, Tamil Nadu. Unpublished
CGWB report, p 55
[3]. Nandhakumaran, P, (2007). Integrated Hydrogeological
Studies for Sustainable Groundwater Management in
Vaniar Watershed, Tamil Nadu, India Unpublished
Ph.D Thesis, University of Madras, 167p
[4]. Panneer M, Sakthivel A (2016), Groundwater
Exploration in understanding the Aquifer dynamics,
EnviroGeoChimica Acta (2016) 3(1): 103-107
[5]. Ramesh, A and Tiwari, P.S (1983) Basic resource Atlas
of Tamil Nadu, University of Madras Publication,
Madras.
[6]. Subramanian, K.S. and Selvan, T.A. (2001) Geology of
Tamil Nadu. Geological Society of India, ISBN No:
81-85867-47-X, p 192
[7]. Sivaramakrishnan. J, Sooryanarayana K.R, Najeeb,
K.Md, (2014). Heterogeneity in hard rock aquifers of
Karnataka, India – A case study. EnviroGeoChimica
Acta (2014) I(4), p.236-242
[8]. Todd, D.K., (1980). Groundwater Hydrology,
2ndedition, John Wiley & Sons., New York, 535 p.