hydrogeological impact assessment minerals assessment site u7
TRANSCRIPT

Prepared for
Hydrogeological Impact Assessment Minerals Assessment Site U7; Calcutt, Wiltshire Final Report v2 December 2011

Wiltshire Council Site U7 – Hydrogeological Impact Assessment
Hydrogeological Impact Assessment December 2011 i
URS Scott Wilson Ltd Scott House Alençon Link Basingstoke Hampshire RG21 7PP Tel. +44 (0)1256 310 200 Fax. +44 (0)1256 310 201 www.scottwilson.com
Revision Schedule Hydrogeological Impact Assessment November 2011
Rev Date Details Prepared by Reviewed by Approved by
01 November 2011
Draft Tom Hargreaves Principal Hydrogeologist William King Hydrogeologist
Steve Cox Senior Hydrogeologist
Jane Sladen Technical Director
02 November 2011
Final Tom Hargreaves Principal Hydrogeologist
Steve Cox Senior Hydrogeologist
Jane Sladen Technical Director
03 December 2011
Final v2 Tom Hargreaves Principal Hydrogeologist
Steve Cox Senior Hydrogeologist
Jane Sladen Technical Director

Wiltshire Council Site U7 – Hydrogeological Impact Assessment
Hydrogeological Impact Assessment December 2011 ii
Limitations URS Scott Wilson Ltd (“URS Scott Wilson”) has prepared this Report for the sole use of Wiltshire Council (“Client”) in accordance with the Agreement under which our services were performed as set out in proposal P828378 dated 19 July 2011. No other warranty, expressed or implied, is made as to the professional advice included in this Report or any other services provided by URS Scott Wilson. This Report is confidential and may not be disclosed by the Client nor relied upon by any other party without the prior and express written agreement of URS Scott Wilson.
The conclusions and recommendations contained in this Report are based upon information provided by others and upon the assumption that all relevant information has been provided by those parties from whom it has been requested and that such information is accurate. Information obtained by URS Scott Wilson has not been independently verified by URS Scott Wilson, unless otherwise stated in the Report.
The methodology adopted and the sources of information used by URS Scott Wilson in providing its services are outlined in this Report. The work described in this Report was undertaken between August and November 2011 and is based on the conditions encountered and the information available during the said period of time. The scope of this Report and the services are accordingly factually limited by these circumstances.
Where assessments of works or costs identified in this Report are made, such assessments are based upon the information available at the time and where appropriate are subject to further investigations or information which may become available.
URS Scott Wilson disclaim any undertaking or obligation to advise any person of any change in any matter affecting the Report, which may come or be brought to URS Scott Wilson’s attention after the date of the Report.
Certain statements made in the Report that are not historical facts may constitute estimates, projections or other forward-looking statements and even though they are based on reasonable assumptions as of the date of the Report, such forward-looking statements by their nature involve risks and uncertainties that could cause actual results to differ materially from the results predicted. URS Scott Wilson specifically does not guarantee or warrant any estimate or projections contained in this Report.
Unless otherwise stated in this Report, the assessments made assume that the sites and facilities will continue to be used for their current purpose without significant changes.
Copyright
© This Report is the copyright of URS Scott Wilson Ltd. Any unauthorised reproduction or usage by any person other than the addressee is strictly prohibited.

Wiltshire Council Site U7 – Hydrogeological Impact Assessment
Hydrogeological Impact Assessment December 2011 iii
Table of Contents
1 Introduction........................................................................................ 7 1.1 Background .................................................................................................................... 7 1.2 Policy and Legislative Context ........................................................................................ 8 1.2.1 Legislation...................................................................................................................................8 1.2.2 National Policy ............................................................................................................................9 1.2.3 Local Policy...............................................................................................................................11
2 Assessment Method........................................................................ 14 2.1 Water Resources.......................................................................................................... 14
3 Baseline Conditions ........................................................................ 17 3.1 Site Description............................................................................................................. 17 3.2 Surface Water and Drainage......................................................................................... 18 3.2.1 River Thames............................................................................................................................19 3.2.2 Thames and Severn Canal........................................................................................................19 3.2.3 River Ray..................................................................................................................................20 3.2.4 Ampney Brook ..........................................................................................................................20 3.2.5 River Key ..................................................................................................................................20 3.2.6 Port Farm and Grains Farm Tributaries .....................................................................................20 3.2.7 Ponds .......................................................................................................................................20 3.2.8 Water Framework Directive Status ............................................................................................20 3.3 Geology ........................................................................................................................ 21 3.4 Hydrogeology ............................................................................................................... 23 3.4.1 Hydrogeological Units ...............................................................................................................23 3.4.2 Aquifer Properties .....................................................................................................................23 3.4.3 Groundwater Level Elevation and Fluctuations ..........................................................................23 3.4.4 Piezometry and Groundwater Movement...................................................................................27 3.4.5 Groundwater Flow Magnitude....................................................................................................28 3.4.6 Water Framework Directive Status ............................................................................................28 3.5 Land Designations........................................................................................................ 29 3.5.1 Source Protection Zones...........................................................................................................29 3.5.2 Protected Areas ........................................................................................................................30 3.5.3 Historic Land Use and Pollution Incidents..................................................................................31 3.5.4 Discharge Consents, Abstraction Licences and Other Abstractors .............................................32
4 Hydrogeological Risk Assessment ............................................... 34 4.1 Review of Activities Proposed and the Potential Impacts .............................................. 34 4.1.1 Site Operation and Post Extraction Plan....................................................................................34 4.1.2 Dewatering Activities.................................................................................................................35 4.1.3 Changes to the Recharge Characteristics and the Unsaturated Zone ........................................36 4.1.4 Water Quality ............................................................................................................................36 4.2 Receptors ..................................................................................................................... 36 4.2.1 Importance of the Receptors within the Study Area....................................................................37 4.2.2 Identification of Pathways..........................................................................................................38 4.3 Appraisal of Magnitude of Impact on Receptors............................................................ 38 4.3.1 Impacts during Construction/Gravel Extraction ..........................................................................38 4.3.2 Impacts during Post Operation Land Use ..................................................................................39

Wiltshire Council Site U7 – Hydrogeological Impact Assessment
Hydrogeological Impact Assessment December 2011 iv
4.4 Assessment of Significance of Effects .......................................................................... 42 4.5 Mitigation Measures...................................................................................................... 43 4.5.1 Elevated Levels of Suspended Solids........................................................................................43 4.5.2 Contamination from Chemicals and Fuel Stored on Site ............................................................43 4.5.3 Dewatering................................................................................................................................43 4.5.4 Post Operation Groundwater Levels ..........................................................................................44 4.6 Residual Effects............................................................................................................ 44
5 Site Investigations and Monitoring ............................................... 45
6 Conclusion ....................................................................................... 46
7 References ....................................................................................... 47 List of Drawings Drawing 1 Study Area Location Map Drawing 2 Study Area Geological Map List of Figures Figure 1 Site U7 Location Map........................................................................................................... 7 Figure 2 Site detailed elevation map with superficial geology............................................................ 17 Figure 3 Main Rivers and EA Flood Zones ....................................................................................... 18 Figure 4 Main Rivers and EA Flood Zones, detail at U7 site. ............................................................ 19 Figure 5 Site U7 Superficial Geology Map........................................................................................ 22 Figure 6 Site U7 Borehole Locations................................................................................................ 24 Figure 7 RTD Groundwater Level Hydrographs from 2003 to 2011................................................... 25 Figure 8 RTD Groundwater Level Response to Rainfall (Recharge) During 2010 ............................. 26 Figure 9 Surface Water Flow/Stage Response to Rainfall During 2010............................................. 26 Figure 10 Site U7 Groundwater Piezometry – Minimum levels (maOD) .............................................. 27 Figure 11 Source Protection Zones near U7....................................................................................... 30 Figure 12 SSSI/SAC/NNR sites near to U7 ........................................................................................ 31 Figure 13 Waste Sites near U7 .......................................................................................................... 32 List of Tables Table 1 Importance of Water Resource........................................................................................... 15 Table 2 Magnitude of Impact........................................................................................................... 16 Table 3 Significance of Effect.......................................................................................................... 16 Table 4 WFD assessment of surface water receptors in proximity of U7 site.................................... 21 Table 5 Geological succession in the area site U7 Calcutt............................................................... 21 Table 6 Groundwater levels at RTD monitoring locations near site U7............................................. 24 Table 7 RTD saturated aquifer thickness near site U7..................................................................... 25 Table 8 Groundwater Flow Though River Terrace Deposits............................................................. 28 Table 9 WFD assessment of groundwater bodies in proximity to site U7 ......................................... 29 Table 10 Discharge consents within 3 km of the centre of the U7 site................................................ 33 Table 11 Groundwater Abstraction Licences for the RTD Aquifer within 3 km of U7 site .................... 33 Table 12 Possible Private unlicensed abstractions from RTD within 3 km of U7 site .......................... 33 Table 13 Extent of Effect and Magnitude of Dewatering .................................................................... 36 Table 14 Importance of water receptors in proximity of the U7 site .................................................... 37 Table 15 Summary of Impacts of mineral extraction at U7 site .......................................................... 41 Table 16 Summary of significance of effects (before mitigation) ........................................................ 42

Wiltshire Council Site U7 – Hydrogeological Impact Assessment
Hydrogeological Impact Assessment December 2011 v
Glossary of Terms
Aquifer A geological formation that can store and transmit groundwater in significant quantities
A/HMWB Artificial and Heavily Modified Water Body. Acronym used in the morphological classification of waters by the Environment Agency
BAP Biodiversity Action Plan
BGS British Geological Survey
CFMP Catchment Flood Management Plans
Darcy’s Law Describes the flow of water through a porous medium: the rate of flow of water is proportional to both the hydraulic conductivity and the hydraulic gradient
DPD Development Plan Document
EA Environment Agency
EIA Environmental Impact Assessment
FRA Flood Risk Assessment
GWD Groundwater Directive 1980
GWR Groundwater Regulations
GWDD Groundwater Daughter Directive 2006
HRA Hydrogeological Risk Assessment
Hydraulic Conductivity A constant of proportionality in Darcy’s law that allows the calculation of the rate of groundwater flow from the hydraulic gradient. For a unit hydraulic gradient, the higher the hydraulic conductivity the higher the rate of groundwater flow
Hydraulic gradient In an aquifer this is the rate of change of groundwater level per unit distance in a given direction. Groundwater flows in the direction of the decline in hydraulic gradient
maOD Metres above ordnance datum. Units to measure elevations of, for example, water level or ground level. The ordnance datum is a reference level at

Wiltshire Council Site U7 – Hydrogeological Impact Assessment
Hydrogeological Impact Assessment December 2011 vi
Newlyn in Cornwall. It is equivalent to level above sea level.
MCS Minerals Core Strategies
MDC Mineral Development Control
NGR National Grid Reference
RTD River Terrace Deposits
SPZ Source Protection Zone
Transmissivity A measure of the ease at which water moves through a porous medium.
UKTAG United Kingdom Technical Advisory Group
WFD Water Framework Directive 2000

Wiltshire Council Site U7 – Hydrogeological Impact Assessment
Hydrogeological Impact Assessment December 2011 7
Reproduced from OS digital map data (c) crown copyright 2011. All rights reserved
1 Introduction 1.1 Background
The current report provides a hydrogeological risk assessment for the proposed mineral (sand and gravel) extraction site U7. The site occupies the land on the southern bank of the River Thames to the east of the A419 main road, from Calcutt towards Castle Eaton, north of Swindon (NGR SU 12 93). The location and extent of the site is shown in Figure 1. The study area of this report is the U7 site together with the territory up to 3 km from the site boundary.
Figure 1 Site U7 Location Map
This report provides an assessment of the potential impacts on water resources as a result of the proposed construction and operation of a sand and gravel quarry at the U7 site. In the context of this report, the term ‘Hydrogeology' covers the assessment of impacts on:
• Groundwater and surface water which is interconnected; and
• Water quality;
The following report sections introduce the assessment method and present the baseline conditions, potential impacts and mitigation measures. The assessment method follows the Environment Agency (EA) guidance Annex (j)1 and the site specific comments raised by the EA to the Wiltshire and Swindon Aggregates Minerals Site Allocations DPD – August 2010. A copy of the EA letter dated 29 Oct 2010 is provided in Annex A.
1 Environment Agency publication. “How to comply with your environmental permit Additional guidance for: H1 – Technical Annex to Annex (j): Hydrogeological Risk Assessments for Landfills and the Derivation of Groundwater Control Levels and Compliance Limits”. v2.0 April 2010.

Wiltshire Council Site U7 – Hydrogeological Impact Assessment
Hydrogeological Impact Assessment December 2011 8
1.2 Policy and Legislative Context There is a very wide range of legislation and policy pertaining to water resources and flood risk; however, this section only refers to water resources and flood risk related legislation and policy that is directly relevant to the proposed development and the range of potential impacts identified.
This water resources assessment has been undertaken considering the legislative guidance set out in national, regional and local plans.
1.2.1 Legislation
Water Framework Directive
The Water Framework Directive (WFD)2 establishes a framework for a European wide approach to action in the field of water policy. Its ultimate aim is to ensure all inland and near shore watercourses and water bodies (including groundwater) are of ‘Good’ status or better, in terms of ecological, but also chemical, biological and physical parameters, by the year 2015. Therefore, any activities or developments that could cause detriment to a nearby water resource, or prevent the future ability of a water resource to reach its potential status, must be mitigated so as to reduce the potential for harm and allow the aims of the Directive to be realised.
A water body is assessed for Ecological Status and Chemical Status as part of the WFD, the methodology for determining status has been set out by the UK Technical Advisory Group (UKTAG) on the WFD. The Environment Agency is responsible for monitoring and ensuring that the targets are met. Water Bodies are classed as either: High, Good, Moderate, Poor or Bad.
The Ecological Status is based on biological quality which includes invertebrates, fish and macrophytes; physicochemical quality which includes temperature, dissolved oxygen, salinity, pH and nutrients; and hydromorphological quality which assesses the range of available habitats.
Chemical Status is assessed on the presence and concentration of Priority Substances for which standards have been established. A full list is located in the UKTAG advice for classification. UKTAG has also proposed water quality, ecology, water abstraction and river flow standards to be adopted in order to ensure that water bodies in the UK (including groundwater) meet the required status.
The Groundwater Directive (80/68/EEC) and Groundwater Regulations 2009
The Groundwater Directive aims to protect groundwater from pollution by controlling discharges and disposal of certain dangerous substances to groundwater. In the UK, the Directive is implemented through the Groundwater Regulations. The Directive aims to protect groundwater under these Regulations by preventing or limiting the inputs of polluting substances into groundwater. Substances controlled under these Regulations fall into two categories:
• Hazardous substances are the most toxic and must be prevented from entering groundwater. Substances in this list may be disposed of to the ground, under a permit, but must not reach groundwater. They include pesticides, sheep dip, solvents, hydrocarbons,
2 Directive 2000/60/EC of the European Parliament and of the Council establishing a framework for the Community action in the field of water policy, http://ec.europa.eu/environment/water/water-framework/index_en.html

Wiltshire Council Site U7 – Hydrogeological Impact Assessment
Hydrogeological Impact Assessment December 2011 9
mercury, cadmium and cyanide. Hazardous substances replace the previous List 1 substances which came under the 1998 Groundwater Regulations (GWR).
• Non-hazardous pollutants are less dangerous, and can be discharged to groundwater under a permit, but must not cause pollution. Examples include sewage, trade effluent and most wastes. Non-hazardous pollutants include any substance capable of causing pollution and the list is much wider than the previous List 2 substances. For example, nitrate is included as a pollutant but it was excluded from List 2 in the 1998 GWR.
The Environmental Permitting (England and Wales) Regulations 2010 SI 2010:675
The Regulations replace those parts of the Water Resources Act 1991 that relate to the regulation of discharges to controlled waters (including groundwater). Under the Regulations, groundwater activities relate to inputs of pollutants to groundwater. The Regulations also replace the Groundwater Regulations 2009 which in turn recently replaced the Groundwater Regulations 1998.
The Regulations transpose the Groundwater Directive 1980 (hereafter GWD)3, the Water Framework Directive 2000 and Groundwater Daughter Directive 2006 (hereafter GWDD)4. The changes from the requirements of the GWD to the GWDD involve a period of transition. This is necessary partly because the GWD remains in force until it is repealed in December 2013 and meanwhile runs in parallel with the new Directive. It is clear from the wording of the Water Framework Directive that a level of protection at least equal to that in the GWD should be retained on repeal of that Directive. The Regulations therefore need to ensure that essential requirements of the GWD are not lost whilst facilitating a change from the old to the new Directives.
Floods and Water Management Act, 2010
The Act provides for a comprehensive management of flood risk for people, homes and businesses, helps safeguard community groups from unaffordable rises in surface water drainage charges and protects water supplies to the consumer.
Serious flooding can happen any time. Climate projections suggest extreme weather will happen more frequently in the future. This Act is central to reducing the flood risk associated with extreme weather.
1.2.2 National Policy
Groundwater Protection: Policy and Practice (GP3)
The Environment Agency’s core groundwater policy5 is
‘To protect and manage groundwater resources for present and future generations in ways that are appropriate for the risks that we identify’.
The Environment Agency’s framework for regulation and management of groundwater is provided in a set of documents, collectively known as Groundwater Protection: Policy and Practice (GP3). These describe their aims and objectives for groundwater, their technical approach to its management and protection and policies and approach to the application of legislation.
3 Directive 80/68/EEC on the protection of groundwater against pollution caused by certain dangerous substances (the Groundwater Directive – GWD) 4 Directive 2006/118/EC on the protection of groundwater against pollution and deterioration (the Groundwater Daughter Directive – GWDD) 5 www.environment-agency.gov.uk

Wiltshire Council Site U7 – Hydrogeological Impact Assessment
Hydrogeological Impact Assessment December 2011 10
In Source Protection Zone (SPZ) I, the Environment Agency will object to proposals for new developments such as waste treatment facilities (Policy P3-2 Planning). In all other areas, the Environment Agency apply a risk-based approach to management of non-landfill waste operations that present a risk to groundwater. Where necessary, activities are controlled via permits.
The EA for this site has emphasised particular policies; Policy P6-7 and P6-11
P6-7 Planning
Developers proposing schemes that pose a risk to groundwater resources, quality or abstractions must provide an acceptable hydrogeological risk assessment (HRA) to us and the planning authority. Any activities that can adversely affect groundwater must be considered including physical disturbance of the aquifer. If the HRA identifies unacceptable risks then the developer must provide appropriate mitigation. If this is not done or is not possible we will recommend that the planning permission is conditioned or object to the proposal.
P6-11 Planning Influencing
For any proposal which would physically disturb aquifers, lower groundwater levels, or impede or intercept groundwater flow, we will seek to achieve equivalent protection for water resources and the groundwater-dependent environment as if the effect were caused by a licensable abstraction.
Catchment Flood Management Plans
Catchment Flood Management Plans (CFMPs) have been prepared by the EA to give an overview of the flood risk across each river catchment. They recommend ways of managing those risks now and over the next 50-100 years.
CFMPs consider all types of inland flooding, from rivers, ground water, surface water and tidal flooding, but not flooding directly from the sea, (coastal flooding). They also take into account the likely impacts of climate change, the effects of how the EA use and manage the land, and how areas could be developed to meet present day needs without compromising the ability of future generations to meet their needs.
This Impact Assessment the covers an area designated in the CFMP has a low to moderate flood risk where the EA will take action with others to store water or manage run-off in locations that provide overall flood risk reduction or environmental benefits This policy will tend to be applied where there may be opportunities in some locations to reduce flood risk locally or more widely in a catchment by storing water or managing run-off. The policy has been applied to an area (where the potential to apply the policy exists), but would only be implemented in specific locations within the area, after more detailed appraisal and consultation.
Draft National Planning Policy Framework
The draft policy was published in July 2011 and sets out the Government’s economic, environmental and social planning policies for England. Taken together, these policies articulate the Government’s vision of sustainable development, which should be interpreted and applied locally to meet local aspirations. Local development plans must aim to achieve the objective of sustainable development. Relevant sections of the draft document include:

Wiltshire Council Site U7 – Hydrogeological Impact Assessment
Hydrogeological Impact Assessment December 2011 11
Mineral requirements
Local planning authorities should use the best available information to develop and maintain an understanding of the extent and location of mineral reserves in their areas and assess the projected demand for their use.
Environmental assessment
Planning policies and decisions should be based on up-to-date information about the natural environment and other characteristics of the area. A sustainability appraisal should be an integrated part of the plan preparation process, and should consider all the likely significant effects on the environment, economic and social factors.
Local Plans may require a variety of other environmental assessments, including under the Habitats Regulations where there is a likely significant effect on a European wildlife site (which may not necessarily be within the same local authority area) and Strategic Flood Risk Assessment. Wherever possible, assessments should share the same evidence base and be conducted over similar timescales, but local authorities should take care to ensure that the purposes and statutory requirements of different assessment processes are respected.
Assessments should be proportionate to the plan. They should not repeat the assessment of higher level policy. Wherever possible the local planning authority should consider how the preparation of any assessment will contribute to the plan’s evidence base. The process should be started early in the plan-making process and key stakeholders should be consulted in identifying the issues that the assessment must cover.
1.2.3 Local Policy
The Minerals and Waste Core Strategy Policies
The Minerals and Waste Core Strategy Policies were adopted in 2009 and they form part of the Local Development Framework for Wiltshire Council and Swindon Borough Council. The document sets out the visions, objectives and strategic spatial approach for managing minerals and waste developments over the period 2006 - 2026.
There are three core strategy policies that are relevant to this hydrogeological impact assessment:
MCS 1 (B): Generic Criteria for Guiding the Location of Minerals Development
In all cases, the process of identifying, appraising, designing and implementing proposals for new or extended sites for minerals extraction and / or recycling of construction and demolition wastes will be guided by the policies of the Minerals Core Strategy, other relevant DPDs and the following indicative criteria:
• the need for the mineral within the broad locations outlined in Section (A) or the need for recycling capacity within the broad locations identified in the Waste Core Strategy;
• likely effects on designated sites and other environmentally valuable features;
• likely effects on designated habitats and priority species;
• proximity to a defined flood zone and / or groundwater Source Protection Zone, and other water interests;
• proximity to local communities and the need to maintain and enhance the local landscape character and setting of settlements;

Wiltshire Council Site U7 – Hydrogeological Impact Assessment
Hydrogeological Impact Assessment December 2011 12
• proximity to primary end-use market(s);
• proximity to the Wiltshire HGV route network as defined in the County Freight Strategy and / or alternative transport modes; and
• the ability for a site or sites to deliver significant contributions to local, regional and national BAP targets for habitat creation and priority species as well as geodiversity gains where applicable.
MCS 7: Flooding
Development proposals must avoid or mitigate any aspect of the development that could potentially lead to an increase in a likelihood of flooding, and where appropriate provide additional flood storage capacity to increase protection for vulnerable land uses, taking into account the impacts of climate change where an opportunity / need is identified through the SFRA / FRA process.
MCS 10: Strategic Approach to Restoration and After-use of Mineral Sites
The restoration, after-care management and future after-use of mineral sites will be primary considerations in the process of planning for all new minerals development in Wiltshire and Swindon. Proposals for the restoration and management of mineral workings should be addressed at the earliest opportunity within the planning process.
Restoration schemes must be designed to prevent increased risks associated with flooding and / or bird strike and should include long-term environmental enhancement, in accordance with the Wiltshire, Swindon and Cotswold Water Park Biodiversity Action Plans and the South West Nature Map where appropriate.
The Minerals Development Control Policies
The Minerals Development Control Policies has three policies of relevance:
MDC1: Criteria for sustainable minerals development.
The Proposals for minerals development must contribute to the delivery of sustainable development in Wiltshire and Swindon by ensuring that the social, economic and environmental benefits of minerals development are maximised, and adverse impacts - including cross-boundary and cumulative impacts - are kept to an acceptable minimum.
MDC3: Managing the impact on surface water and groundwater resources
Proposals for minerals development will only be permitted where it can be demonstrated that appropriate controls will be made available to protect and, where appropriate, enhance the water environment. This includes making provisions to ensure the protection and maintenance of: The quality of groundwater, water courses and other surface water; and the volume / levels of groundwater, water courses and other surface water
Flood Risk Assessments (FRA) will be required for minerals development proposals in areas at risk of flooding or likely to contribute to flooding elsewhere, as appropriate to the nature and scale of the development, and must take into account cumulative effects with other existing or proposed development. Where a risk of flooding is identified through FRA, proposals must include measures to ensure the avoidance of and / or mitigation of that risk.
Where appropriate, development proposals will also be required to include provisions for the efficient use of water resources on site and the use of Sustainable Drainage Systems (SUDS).

Wiltshire Council Site U7 – Hydrogeological Impact Assessment
Hydrogeological Impact Assessment December 2011 13
MDC9: Restoration, aftercare and after-use management of minerals development
Proposals for minerals development will be permitted where it can be demonstrated that a high quality and appropriate restoration scheme will enable the long term maintenance and enhancement of the environment after the minerals development has ceased and at the earliest practicable opportunity.

Wiltshire Council Site U7 – Hydrogeological Impact Assessment
Hydrogeological Impact Assessment December 2011 14
2 Assessment Method 2.1 Water Resources
The assessment has been undertaken using the Source-Pathway-Receptor model, which is in line with the EA Horizontal Guidance Note H1 – Annex (j). This model identifies the potential sources or ‘causes’ of effect as well as the receptors (water resources) that could potentially be affected. However, the presence of a potential effect source and a potential receptor does not always infer an effect, there needs to be a clear mechanism or ‘pathway’ via which the source can have an effect on the receptor
The first stage in utilising the Source-Pathway-Receptor model is to identify the causes or ‘sources’ of potential impact. The sources have been identified through a review of the details of the proposed development, including the size and nature of the development, potential construction methodologies and timescales. This has been undertaken in the context of local conditions relative to water resources near the site, such as topography, geology, climatic conditions and potential sources of contamination.
The next stage is to undertake a review of the potential receptors, that is, the water resources themselves that have the potential to be affected. The identification of potential water resource receptors has been undertaken through a review of baseline data.
The last stage is to determine if there is an exposure pathway or a ‘mechanism’ allowing an effect to potentially occur between source and receptor.
Once potential effects on water resources are identified, it is necessary to determine how significant the effects are likely to be, to enable the identification of potential mitigation measures that can counteract negative effects. The effect on the receptors depends largely on the sensitivity of the receptor and the magnitude of effect experienced.
An assessment of the significance of each effect has been undertaken based on the methodology provided in the Web-based Transport Analysis Guidance; specifically the Water Environment Sub-Objective WebTAG Unit 3.3.11. This provides an appraisal framework for taking the outputs of the Environmental Impact Assessment process and analysing the key information of relevance to the water environment. The guidance is based on guidance prepared by the Environment Agency and builds on the water assessment methodology in Design Manual for Roads and Bridges (DMRB) 11:3:10. Although this method was designed primarily for transport projects it is applicable to and widely used for other development types.

Wiltshire Council Site U7 – Hydrogeological Impact Assessment
Hydrogeological Impact Assessment December 2011 15
Receptor Sensitivity
The sensitivity or importance of each water resource (the receptor) is based on its considered value, for example its value as an ecological habitat, as a source of drinking water or as a recreational resource (see Table 1).
Table 1 Importance of Water Resource Importance Criteria Examples
Very high Water resource with an importance and rarity at an international level with limited potential for substitution.
- A water resource making up a vital component of a protected Special Area of Conservation (SAC) or Special Protection Area (SPA) under the EC Habitats Directive - A water body achieving a status of ‘High status or potential’ under the WFD - Principal aquifer providing potable water to a large population - EC designated Salmonid fishery
High Water resource with a high quality and rarity at a national or regional level and limited potential for substitution.
- A water resource designated or directly linked to a Site of Special Scientific Interest (SSSI). - Principal aquifer providing potable water to a small population - A river designated as being of ‘Good status’ or with a target of Good status or potential under the WFD - A water body used for national sporting events such as regattas or sailing events - EC designated Cyprinid fishery
Medium Water resource with a high quality and rarity at a local scale; or Water resource with a medium quality and rarity at a regional or national scale.
- Secondary aquifer providing potable water to a small population - An aquifer providing abstraction water for agricultural and industrial use
Low Water resource with a low quality and rarity at a local scale.
- A non ‘main’ river or stream or other water body without significant ecological habitat

Wiltshire Council Site U7 – Hydrogeological Impact Assessment
Hydrogeological Impact Assessment December 2011 16
Magnitude of Impact
The magnitude of a potential impact is then established based on the likely degree of impact relative to the nature and extent of the proposed development (see Table 2). It is important to consider at this stage that potential impacts can be beneficial as well as adverse and it is the purpose of an EIA to highlight the full spectrum of potential impacts from a proposed development. The derivation of magnitude is carried out independently of the importance of the water resource.
Table 2 Magnitude of Impact Magnitude of Impact
Criteria Examples
High Impact results in a shift in a water bodies potential attributes.
- Loss of EU designated Salmonid fishery - Change in WFD classification of a water body. - Compromise employment source - Loss of flood storage/increased flood risk - Pollution of potable source of abstraction
Medium Results in impact on integrity of attribute or loss of part of attribute.
- Loss / gain in productivity of a fishery. - Contribution / reduction of a significant proportion of the effluent in a receiving river, but insufficient to change its WFD classification - Reduction / increase in the economic value of the feature.
Low Results in minor impact on water bodies attribute.
- Measurable changes in attribute, but of limited size and / or proportion.
Very Low Results in an impact on attribute but of insignificant magnitude to affect the use / integrity.
- Physical impact to a water resource, but no significant reduction / increase in quality, productivity or biodiversity. - No significant impact on the economic value of the feature. - No increase in flood risk
Significance of Effect
Once the magnitude of an impact is derived, the significance of the potential effect can then be derived by combining the assessments of both the importance of the water resource and the magnitude of the impact in a simple matrix (see Table 3 below).
Effects which are assessed to be major or moderate are considered to be significant; those that are minor and negligible are not considered to be significant.
Table 3 Significance of Effect Magnitude of Impact Sensitivity of
Receptor High Medium Low Very Low Very High Major Major / Moderate Moderate Moderate / Minor
High Major / Moderate Moderate Moderate / Minor Minor
Medium Moderate Moderate / Minor Minor Negligible
Low Moderate / Minor Minor Negligible Negligible

Wiltshire Council Site U7 – Hydrogeological Impact Assessment
Hydrogeological Impact Assessment December 2011 17
3 Baseline Conditions 3.1 Site Description
The application site occupies an area of approximately 173 hectares and is located between the villages Calcutt and Castle Eaton, to the north of Swindon in the county of Wiltshire, (National grid reference SU 12 93). The site lies within the flood plains of the River Thames that flows eastwards and northwards and forms a boundary of the site. A detailed topographic map of the site with a 0.25 m contour interval is shown in Figure 2. The land is at 76 mAOD adjacent to the river and rises just 4 m at the highest part of the site.
Figure 2 Site detailed elevation map with superficial geology Contours to the south of the site are not available. Pale yellow = alluvium, Green = 1st Terrace, Pale brown = 2nd Terrace, Brown = Head
There are four river terraces identified in the area. These were formed as the flood plain of the rivers that formerly flowed across the area during the Quaternary when the sea level was higher relative to the land surface. Changes in land and sea level due to the glaciations of the Quaternary have resulted in the distinct lowering of the river level. This has eroded the former flood plains leaving four identifiable terraces within the landscape. The highest terrace, known as the fourth terrace, has a level of 105 m and occurs on isolated hills such as Horcott Hill and Marston Hill. The third terrace is at about 85 m and is found at the western end of RAF Fairford.
Reproduced from OS digital map data (c) crown copyright 2011. All rights reserved CO7/080-CCSL. British Geological Survey. © NERC. All rights reserved

Wiltshire Council Site U7 – Hydrogeological Impact Assessment
Hydrogeological Impact Assessment December 2011 18
The second terrace is at around 80 m, the villages of Marston Meysey, Down Ampney and Castle Easton all have been built on this terrace. The first, youngest and lowest terrace has an elevation of approximately 75 m and forms an almost continuous strip about 2 km wide.
The U7 site lies predominantly within the alluvium and the first terrace of the River Terrace Deposits, adjacent to the River Thames and River Ray. There are some isolated areas raised about 4 m above the alluvium that are the second terrace, and the Head deposit could be reworked gravels from the second terrace.
3.2 Surface Water and Drainage The site is both drained and flooded by the River Thames and tributary streams. The River Ray and Ampney Brook both join the River Thames within the site as shown in Figure 3 and Figure 4.
Figure 3 Main Rivers and EA Flood Zones
Marston Meysey Brook
River Thames
Ampney Brook
River Ray
River Coln
River Key
River Thames
River Churn

Wiltshire Council Site U7 – Hydrogeological Impact Assessment
Hydrogeological Impact Assessment December 2011 19
Figure 4 Main Rivers and EA Flood Zones, detail at U7 site. Red lines = Site outline; Blue pentagon = Pond location Note: There are no EA marked flood defences in the vicinity of the site.
3.2.1 River Thames
The study area is located in the upper reaches of the River Thames catchment. The river flows broadly from west to east, although it meanders through the floodplain.
The River forms the northern boundary of the proposed U7 site. Both the River and the River Terrace Deposits (RTD) aquifer are assumed to be in hydraulic conductivity, although Alluvium may limit the interaction of these two water bodies.
3.2.2 Thames and Severn Canal
The Thames and Severn Canal is a historic feature, the remnants of which can still be observed in the study area. Where isolated ponds exist within the course of the Canal near Eysey Manor Farm, they are believed to be formed on puddled clay and are therefore largely hydraulically separated from the RTD aquifer (Tarmac Quarry Products Ltd, 1999).
The Thames and Severn Canal is not assessed within this Hydrogeological Risk Assessment, as it is on the opposite side of the River Thames from the U7 site and is not currently a functioning water body.
Pond

Wiltshire Council Site U7 – Hydrogeological Impact Assessment
Hydrogeological Impact Assessment December 2011 20
3.2.3 River Ray
The River Ray flows northwards from Swindon, passing under the A419, before running along the southeastern margin of the U7 site and then through the site to a confluence with the River Thames.
3.2.4 Ampney Brook
The Ampney Brook flows southwards, through the existing mineral extraction site at Eysey Manor Farm, towards a confluence with the River Thames near the northwest boundary of the U7 site.
3.2.5 River Key
The River Key flows northeast past Cricklade, and joins the River Thames upstream and around 300 m west of the proposed U7 site.
3.2.6 Port Farm and Grains Farm Tributaries
There are two un-named tributaries of the River Thames. They originate near Port Farm and Grain Farm, and so are referred to as the Port Farm and Grains Farm tributaries within this report.
The Port Farm tributary flows northwards, before turning northwest and through the northern limb of the U7 site. The Grains Farm tributary flows northwest and then northwards through the central section of the U7 site immediately west of Water Eaton House.
3.2.7 Ponds
There are five ponds identified close to or within the U7 site:
• Two ponds to the southwest of U7, near Kingshill Farm;
• Two ponds in the immediate vicinity of Water Eaton House, on the border of the U7 site; and
• One pond on the north side of the River Thames, opposite its confluence with the River Ray.
3.2.8 Water Framework Directive Status
The WFD sets a target of achieving overall ‘Good status’ in all water bodies (including rivers, streams, lakes, transitional and coastal water bodies, and groundwater) by 2027. For surface waters, Good status has an ecological and a chemical component; Good ecological status is measured on the scale High, Good, Moderate, Poor and Bad. Chemical status is measured as ‘Good’ or ‘Fail’.
Some surface water bodies are designated as ‘artificial’, this is because they may have been created or modified for a particular use such as water supply, flood protection, navigation or urban infrastructure. By definition, artificial and heavily modified water bodies are not able to achieve natural conditions. Instead the classification and objectives for these water bodies, and the biology they represent, are measured against ‘ecological potential’ rather than status.
The WFD status of surface water bodies of interest to the current study is provided in Table 4.

Wiltshire Council Site U7 – Hydrogeological Impact Assessment
Hydrogeological Impact Assessment December 2011 21
Table 4 WFD assessment of surface water receptors in proximity of U7 site
Water body Name / ID
Typology Description
Current Ecological Quality
Current Chemical Quality
2015 Predicted Ecological Quality
2015 Predicted Chemical Quality
River Thames (Churn to Coln) GB106039022990
Low Medium Calcareous
Poor Status
Does not require assessment
Poor Status Does not require assessment
Ampney and Poulton Brooks GB106039030300
Low Small Calcareous
Bad Status
Does not require assessment
Good Status Does not require assessment
River Ray (Lydiard Brook to Thames) GB106039023330
Low, Small, Calcareous
Moderate Status
Good Moderate Status
Good
River Key (Sources to Thames) GB106039023650
Low, Small, Calcareous
Moderate Status
Good Moderate Status
Good
3.3 Geology The superficial geology of the study area is illustrated in Figure 5 and Drawing 2. A summary of the geological formations and their approximate thickness is presented in Table 5. The geological information is based on the BGS 1:50,000 geology map, geological logs, information supplied by the EA, and previous hydrogeological reports conducted in the area; Eysey Manor Farm (Tarmac, 1999) and Roundhouse Farm Quarry (Hyder 2000). Oxford Clay occurs over all of the study area, either at surface outcrop (where superficials are absent) or below the River Terrace Deposits.
Table 5 Geological succession in the area site U7 Calcutt
Age Geological Formation Approximate Thickness (m)
Alluvium Up to 1.5 Pleistocene & Recent River Terrace Deposits Up to 6.2 Oxford Clay Formation 20 to 72 Upper Jurassic Kellaways Formation 12-20 Cornbrash Formation 4 Forest Marble Formation 27
Middle Jurassic
Great Oolite Limestone Formation 45

Wiltshire Council Site U7 – Hydrogeological Impact Assessment
Hydrogeological Impact Assessment December 2011 22
Figure 5 Site U7 Superficial Geology Map Pale yellow = Alluvium, Green = 1st RTD Terrace, Pale brown = 2nd RTD Terrace, Orange = 3rd RTD Terrace, Brown = Head. Note the whole map is underlain by Oxford Clay Formation which outcrops in the white area.
The youngest geological deposit is the recent Alluvium (clay, silt, sand and gravel). This lies within the current flood plain of the River Thames and some of the tributary streams, forming a strip that is 500 m wide at Calcutt, but narrowing to 250 m at the northern end of the U7 site.
The River Terrace Deposits (RTD) consist of four terraces and are described as being made up of sub-rounded platy and tabular gravels and sands with flints, shells and coral fragments. The gravels are comprised of sub-angular to sub rounded cobbles of limestone and quartzite and flint, while the sands consist of sub-rounded limestone grains and ooliths with coarse quartz and sub-rounded ironstone. The RTD form a thin drape of material forming an infill to broad shallow valleys and isolated deposits on hillsides.
The RTD lie over the much older bedrock or solid geology. These rocks comprise mainly limestone, claystone and some sandstone of Jurassic age. Structurally the bedrock is part of the dip slope of the Cotswold Hills and as such there is a shallow regional dip to the south east. Immediately underling the RTD at the site is the Oxford Clay Formation, a sequence of clays and shales described as a stiff to firm calcareous mudstone. The extensive faulting in the area results in a highly variable thickness of Oxford Clay Formation with a thickness range of between 30 and 80 m (Sen and Abbott, 1991).
A borehole within Marston Meysey village (location SU 1294 9754, BGS reference SU19/69A) drilled in 1982 to a depth of 168 m passes through 54 m of Oxford and Kellaways Clay before
Reproduced from OS digital map data (c) crown copyright 2011. All rights reserved CO7/080-CCSL. British Geological Survey. © NERC. All rights reserved

Wiltshire Council Site U7 – Hydrogeological Impact Assessment
Hydrogeological Impact Assessment December 2011 23
penetrating the Great and Inferior Oolite series. The U7 site lies south of this borehole, where the Oxford Clay Formation is expected to be thicker.
3.4 Hydrogeology 3.4.1 Hydrogeological Units
The superficial deposits (RTD and Alluvium) in the area are water bearing and are defined as a “Secondary A” aquifer by the EA. The aquifer constitutes a secondary aquifer on account of its limited thickness and lateral heterogeneity. The aquifer is unconfined and of importance for local abstraction. It is likely to contribute to surface water base flow. Where it is present, the Alluvium is likely to be in hydraulic continuity with the surface water and the RTD.
The Oxford Clay has a low permeability (an aquiclude) and acts as a hydraulic barrier between the superficial deposits and the principal aquifer at depth. The Middle Jurassic formations are classified as Major or Minor aquifers (Allen et al 1997) and as Principal aquifers by the EA. The deeper aquifers are not considered in detail in this report, as in the general area of the site they are unlikely to be hydraulically connected with the sand and gravel aquifer due to the presence of the Oxford Clay Formation.
3.4.2 Aquifer Properties
The publications regarding the major and minor aquifers in England and Wales (Allen et al 1997 and Jones et al 2000) do not provide any aquifer property data for the River Terrace Deposits aquifer. Estimates of hydraulic conductivity have been obtained from previous hydrogeological reports. These have compiled a range of theoretical aquifer properties that can broadly describe the hydrogeological conditions occurring beneath site.
The key information was collated by Eysey Manor Farm (Tarmac, 1999). The report documents a range of hydraulic conductivities, which were derived from the particle size distribution using the Hazen formula. Hydraulic conductivities ranged from 2 to over 7000 m/d with a median of 19 m/d. The variability of values indicates that the deposits are heterogeneous. Hydraulic conductivity values for RTD aquifer typically range between 1 and 100 m/d and therefore a representative value, for the purposes of the current evaluation, is considered to be 20 m/d, although the higher value of 100 m/d per day is also used to indicate the upper range of likely aquifer response.
3.4.3 Groundwater Level Elevation and Fluctuations
Manual and data logger information from the EA monitoring network demonstrates the range of water level fluctuations in the RTD aquifer. Details of the monitoring locations are provided in Table 6 and the groundwater hydrographs are shown in Figure 7.
The annual water level fluctuations in the RTD aquifer are typically around 1.3 m, as shown by Figure 7 and Table 6, for the period 2003 to 2011. The water level in the gravels is shown to vary rapidly over the period of a few days at the continuously monitored location, SU19/84. It is uncertain to what degree the water levels are impacted by previous and existing quarry activities associated with the Eysey Manor Farm and Round House Farm sites.
The monitored locations are some distance from the U7 site and on the opposite side of the River Thames, but are the nearest locations with available water level monitoring data. It is believed there are no monitoring data for boreholes within the U7 site, such as SU19SW79 and SU19SW7.

Wiltshire Council Site U7 – Hydrogeological Impact Assessment
Hydrogeological Impact Assessment December 2011 24
Figure 6 Site U7 Borehole Locations NB Only boreholes known to BGS are marked with a symbol.
Table 6 Groundwater levels at RTD monitoring locations near site U7 Groundwater Level
Borehole Reference NGR Minimum
(maOD) Maximum (maOD)
Fluctuation & year (m)
TW02/19a 412350,194230 75.93 77.20 1.27 (2003) TW05/09 412910,195004 74.82 76.06 1.24 (2010) SU19/84 412830,196690 74.78 76.46 1.68 (2010)
The groundwater levels in the RTD aquifer respond rapidly to recharge caused by rainfall during autumn and winter periods (Figure 8). The flow in the River Thames in the vicinity of SU19/84 responds to rainfall during both the summer and winter seasons, as seen in Figure 9.
The saturated thickness (see Table 7) of the aquifer varies over the area and through the seasons. The greatest thickness of saturated deposits occurs in the vicinity of the streams. The thickness ranges from 1.7 to 3.4 m, where monitoring data exists. At the edge of the aquifer the deposits may be dry for all or part of the year.
It is noted that where saturated thickness values are provided for boreholes SW19SW5 to SW19SW79 in Table 7, these are based on a single water level provided on the BGS borehole log i.e. they are not part of a monitoring network.
SU19SW79 SU19SW7
SU19SW56
SU19SW5
SU19/84
TW05/09
TW02/19a
Reproduced from OS digital map data (c) crown copyright 2011. All rights reserved CO7/080-CCSL. British Geological Survey. © NERC. All rights reserved
SU19SW57
SU19SW12
SU19SW9
SU19SW6
U7

Wiltshire Council Site U7 – Hydrogeological Impact Assessment
Hydrogeological Impact Assessment December 2011 25
Table 7 RTD saturated aquifer thickness near site U7
Borehole Reference
NGR (* inside U7)
Ground Level (maOD)
Base of RTD (maOD)
Depth to Water (m)
Saturated Thickness (m)
TW05/09 412910,195004 76.21 73.09 0.15 to 1.39 1.73 to 2.97 SU19/84 412830,196690 77.36 73.06 0.90 to 2.58 1.72 to 3.40 SU19SW5 410510,194250 79.2 76.6 n/k n/k SU19SW6 411500,194680 78.9 77.5 n/k n/k SU19SW7 411710,196840* 76.8 74.2 1.40 1.2 SU19SW9 410510,194090 78.0 75.56 n/k n/k SU19SW12 410810,193770 77.4 75.73 1.45 0.22 SU19SW56 412450,193940 c76.5 73.5 1.8 1.2 SU19SW57 412210,194070 c76.5 73.7 1.8 0.9 SU19SW79 411290,194030* c77 74 n/k n/k
74
75
76
77
78
2002 2003 2004 2005 2006 2007 2008 2009 2010 2011 2012
Wat
er L
evel
Ele
vatio
n (m
aOD
)
TW05/09 [ALEX FARM]
SU19/84 [Spotted Cow]
Figure 7 RTD Groundwater Level Hydrographs from 2003 to 2011

Wiltshire Council Site U7 – Hydrogeological Impact Assessment
Hydrogeological Impact Assessment December 2011 26
Figure 8 RTD Groundwater Level Response to Rainfall (Recharge) During 2010
0.1
1
10
100
10 10 10 10 10 10 10 10 10 10 10 10
Riv
er F
low
(m3 /s
) [lo
g sc
ale]
0
10
20
30
40
50
60
01/0
1/20
10
01/0
2/20
10
01/0
3/20
10
01/0
4/20
10
01/0
5/20
10
01/0
6/20
10
01/0
7/20
10
01/0
8/20
10
01/0
9/20
10
01/1
0/20
10
01/1
1/20
10
01/1
2/20
10
01/0
1/20
11
Dai
ly R
ainf
all T
otal
(mm
)
Rainfall at Fairford
Sum of Thames+Ray+Ampney Brook+Marston Mersy Brook
Figure 9 Surface Water Flow/Stage Response to Rainfall During 2010

Wiltshire Council Site U7 – Hydrogeological Impact Assessment
Hydrogeological Impact Assessment December 2011 27
3.4.4 Piezometry and Groundwater Movement
Figure 10 Site U7 Groundwater Piezometry – Minimum levels (maOD)
Groundwater in the superficial deposits occurs at a shallow depth and is anticipated to be unconfined. Due to the heterogeneous nature of interbedded sands, gravels and lower permeability layers there may be some areas where groundwater is locally confined. Groundwater flow in this type of aquifer will be via intergranular flow in the voids between the particles.
A piezometric map has been prepared to illustrate typical minimum level conditions within the superficial sand and gravel aquifer, see Figure 10. Across the U7 site the minimum levels range from about 77 m to 74.8 m and are likely to be very similar to surface water levels. The hydraulic gradient is 0.001 during both low and high level conditions.
The groundwater piezometric map shows that the RTD are discontinuous over the whole width of the broad west to east aligned valley. There is an area of slightly higher land devoid of RTD, forming an ‘island’ of Oxford Clay to the north of the River Thames. Groundwater flow within the Alluvium and first RTD terrace (‘yellow’ and ‘green’ on Figure 10) is assumed to split into two branches flowing around the ‘island’; the south-western half of the U7 site is located on the southern branch. However, much of the northeast limb of the U7 site is on higher ground away from the main groundwater and surface water flow, where only isolated deposits of the second RTD terrace exist.
Reproduced from OS digital map data (c) crown copyright 2011. All rights reserved CO7/080-CCSL. British Geological Survey. © NERC. All rights reserved
TW05/9 74.82
TW02/19a 75.93
77.0
77.5
76.0
74.5
76.0
75.0
76.5
75.5
Wiltshire Council Site U7 – Hydrogeological Impact Assessment
Hydrogeological Impact Assessment December 2011 28
3.4.5 Groundwater Flow Magnitude
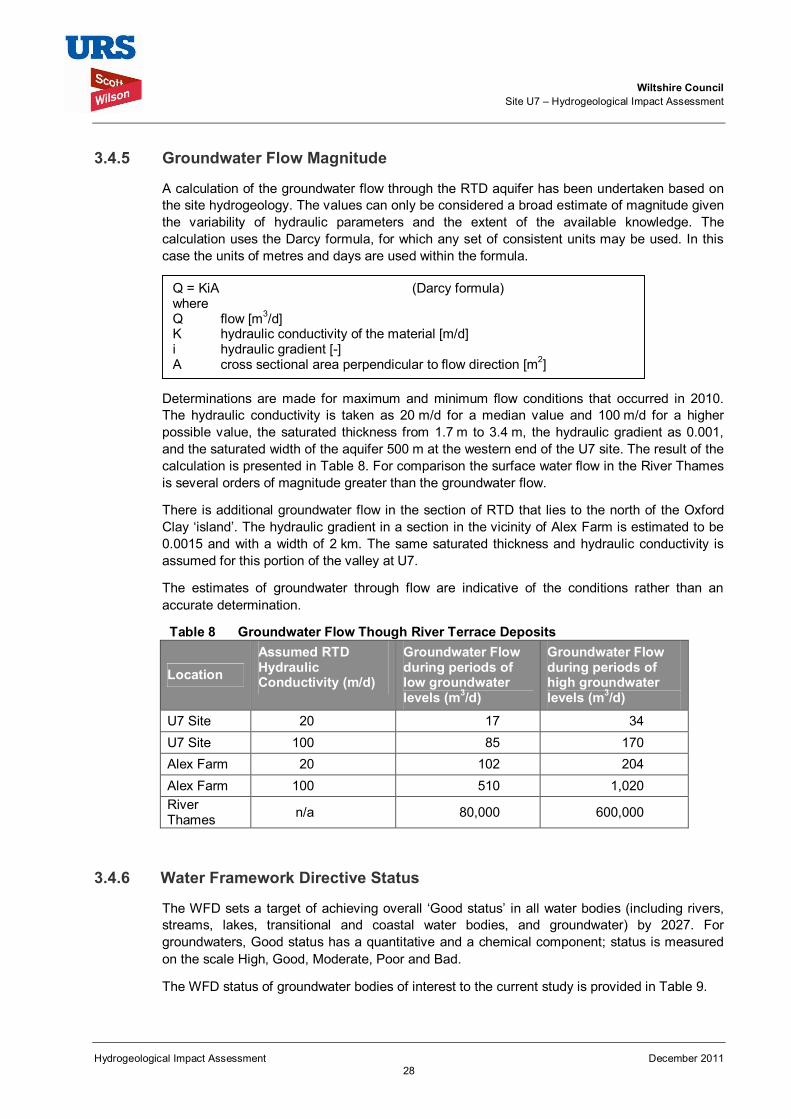
A calculation of the groundwater flow through the RTD aquifer has been undertaken based on the site hydrogeology. The values can only be considered a broad estimate of magnitude given the variability of hydraulic parameters and the extent of the available knowledge. The calculation uses the Darcy formula, for which any set of consistent units may be used. In this case the units of metres and days are used within the formula.
Determinations are made for maximum and minimum flow conditions that occurred in 2010. The hydraulic conductivity is taken as 20 m/d for a median value and 100 m/d for a higher possible value, the saturated thickness from 1.7 m to 3.4 m, the hydraulic gradient as 0.001, and the saturated width of the aquifer 500 m at the western end of the U7 site. The result of the calculation is presented in Table 8. For comparison the surface water flow in the River Thames is several orders of magnitude greater than the groundwater flow.
There is additional groundwater flow in the section of RTD that lies to the north of the Oxford Clay ‘island’. The hydraulic gradient in a section in the vicinity of Alex Farm is estimated to be 0.0015 and with a width of 2 km. The same saturated thickness and hydraulic conductivity is assumed for this portion of the valley at U7.
The estimates of groundwater through flow are indicative of the conditions rather than an accurate determination.
Table 8 Groundwater Flow Though River Terrace Deposits
Location Assumed RTD Hydraulic Conductivity (m/d)
Groundwater Flow during periods of low groundwater levels (m3/d)
Groundwater Flow during periods of high groundwater levels (m3/d)
U7 Site 20 17 34 U7 Site 100 85 170 Alex Farm 20 102 204 Alex Farm 100 510 1,020 River Thames n/a 80,000 600,000
3.4.6 Water Framework Directive Status
The WFD sets a target of achieving overall ‘Good status’ in all water bodies (including rivers, streams, lakes, transitional and coastal water bodies, and groundwater) by 2027. For groundwaters, Good status has a quantitative and a chemical component; status is measured on the scale High, Good, Moderate, Poor and Bad.
The WFD status of groundwater bodies of interest to the current study is provided in Table 9.
Q = KiA (Darcy formula) where Q flow [m3/d] K hydraulic conductivity of the material [m/d] i hydraulic gradient [-] A cross sectional area perpendicular to flow direction [m2]

Wiltshire Council Site U7 – Hydrogeological Impact Assessment
Hydrogeological Impact Assessment December 2011 29
Table 9 WFD assessment of groundwater bodies in proximity to site U7
Water Body Name / ID Current Quantitative Quality
Current Chemical Quality
2015 Predictive Quantitative Quality
2015 Predicted Chemical Quality
Superficial deposits (Upper Thames Gravels) GB40603G000200
Good Poor Good Poor
3.5 Land Designations 3.5.1 Source Protection Zones
Source Protection Zones (SPZ) are areas that have been designated by the EA. There are three zones; an inner or zone 1, outer or zone 2 and total catchment or zone 3. The zones have been determined to represent a 50 day travel time, a 400 day travel time, and the whole groundwater catchment for public water supply groundwater sources, respectively. These zones show the risk of contamination from any activities that might cause pollution in the area. The closer the activity to the source, then the greater the risk will be.
The SPZ map for the U7 site and surrounding area is shown in Figure 11. The site lies just to the south east of a total catchment for a source near Latton and near Meysey Hampton. The actual locations of the public water sources are not shown on the maps and their location cannot be given in documents that may be in the public domain.
The SPZ relate to groundwater abstractions from the Jurassic strata that lie below the Oxford Clay Formation. These aquifers (principal and secondary) outcrop to the north of Meysey Hampton and are also shown on the SPZ map as an additional overlay. It is normal convention to show at the surface the location of inner and outer zones irrespective as to whether the aquifer occurs at the surface. The total catchment is only usually shown where recharge from the surface can contribute to the source.

Wiltshire Council Site U7 – Hydrogeological Impact Assessment
Hydrogeological Impact Assessment December 2011 30
Figure 11 Source Protection Zones near U7.
3.5.2 Protected Areas
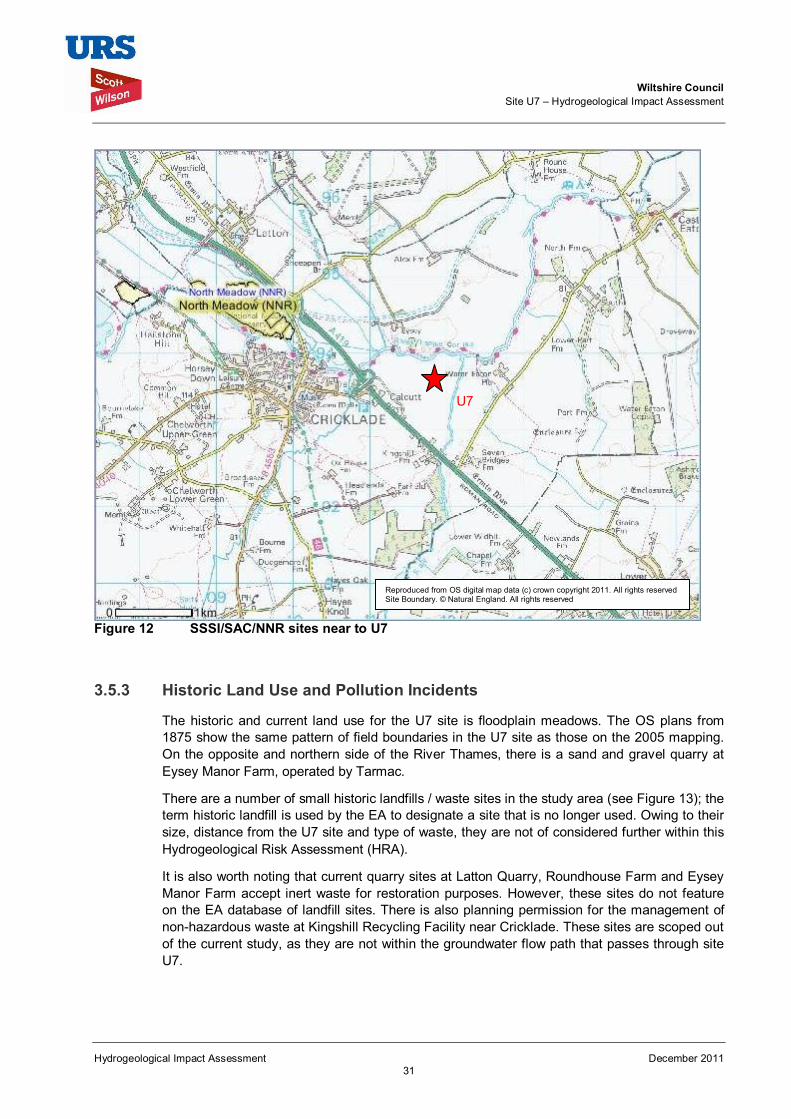
The North Meadow site lies upstream from U7, between Cricklade and Latton. It is a National Nature Reserve (NNR) a Site of Special Scientific Interest (SSSI) and a Special Area of Conservation (SAC). The land is owned by Natural England and is an old hay meadow that supports a great variety of wildflowers and owes its status to being one of the finest examples of lowland hay meadow in Europe. In particular it is known for having the largest UK population of rare Snakes Head Fritillaries Fritillaria meleagris which attract a large number of visitors.
The North Meadow SAC is on the north side of the main River Thames, and at its closest point, is 1.1 km from the edge of the U7 site. The location of the site is marked on Figure 12.
There are no other protected areas within 3 km of the U7 site.
U7
Wiltshire Council Site U7 – Hydrogeological Impact Assessment
Hydrogeological Impact Assessment December 2011 31
Figure 12 SSSI/SAC/NNR sites near to U7
3.5.3 Historic Land Use and Pollution Incidents
The historic and current land use for the U7 site is floodplain meadows. The OS plans from 1875 show the same pattern of field boundaries in the U7 site as those on the 2005 mapping. On the opposite and northern side of the River Thames, there is a sand and gravel quarry at Eysey Manor Farm, operated by Tarmac.
There are a number of small historic landfills / waste sites in the study area (see Figure 13); the term historic landfill is used by the EA to designate a site that is no longer used. Owing to their size, distance from the U7 site and type of waste, they are not of considered further within this Hydrogeological Risk Assessment (HRA).
It is also worth noting that current quarry sites at Latton Quarry, Roundhouse Farm and Eysey Manor Farm accept inert waste for restoration purposes. However, these sites do not feature on the EA database of landfill sites. There is also planning permission for the management of non-hazardous waste at Kingshill Recycling Facility near Cricklade. These sites are scoped out of the current study, as they are not within the groundwater flow path that passes through site U7.
Reproduced from OS digital map data (c) crown copyright 2011. All rights reserved Site Boundary. © Natural England. All rights reserved
U7

Wiltshire Council Site U7 – Hydrogeological Impact Assessment
Hydrogeological Impact Assessment December 2011 32
Figure 13 Waste Sites near U7
3.5.4 Discharge Consents, Abstraction Licences and Other Abstractors
A listing of all discharge consents issued by the EA within 3 km of the U7 site are given in Table 10 and details of the abstraction licences for the RTD aquifer in the same area are provided in Table 11. A more precise location of the abstraction licences can not be provided for security and confidentiality reasons.
Abstractions of less than 20 m3/d do not require an abstraction licence. There may be some water users who abstract from a well or borehole. However, an enquiry with Wiltshire Council did not reveal that there are any such water users in the vicinity known to the public heath department. A list of locations with wells/boreholes that may be used as a water supply from the RTD has been compiled from BGS records of water wells. A list of locations is given in Table 12, however, none of these locations appears to be associated with a building and are unlikely to be used for water supply.
Name: Manor Farm Down Operator: CWS Agriculture Waste: All types
Name: The old canal B4040 Operator: n/a Waste: Inert
Westmill Lane Operator: n.a Waste: Inert
Name: Bance Canal Tip Operator: n/a Waste: n/a
Kingshill Recycling Facility

Wiltshire Council Site U7 – Hydrogeological Impact Assessment
Hydrogeological Impact Assessment December 2011 33
Table 10 Discharge consents within 3 km of the centre of the U7 site
Name Grid Reference
Discharge Type
Eysey Manor Farmhouse SU1140094460 Domestic Property (Single) Calcutt Service Station SU1156092940 Domestic Property (Multiple) New House Kingshill Farm SU1173092700 Domestic Property (Single) Kingshill Recycling Centre SU1174092670 Material Recycling Treatment Facilities Kingshill Recycling Centre SU1190092600 Glass and Glassware Industry Nos 2,3 And 4 Seven Bridges Water Eaton SU1210092600 Domestic Property (Multiple) Cricklade SU1060094101 Sewage Disposal Works - water company Cricklade STW SU1059094000 Sewage Disposal Works - water company Kingshill Recycling Centre Cricklade Swindon Wilts SU1187592575 Industrial waste site
Cricklade (Hatchetts) SU1040093900 Sewerage Network - Pumping Station - water company
Calcutt Farmhouse SU1138092311 Domestic Property (Single) Park View Calcutt Farmhouse SU1138092310 Domestic Property (Single) Eysey Manor Farm Quarry SU1049095150 Extraction of Stone, Gravel, etc Eysey Manor Farmhouse SU1140094460 Domestic Property (Single)
Table 11 Groundwater Abstraction Licences for the RTD Aquifer within 3 km of U7 site
Licence Number Licence Holder
Distance from U7 Site (km)
Direction Use
28/39/04/008 The Cooperative Wholesale Society Ltd
2.8 North West Agricultural
28/39/05/0014 The Cooperative Wholesale Society Ltd
2.1 North West Agricultural
28/39/05/0046 Moreton C Cullimore (Gravels) Ltd 2.9 North East Mineral washing & dust
suppression
Table 12 Possible Private unlicensed abstractions from RTD within 3 km of U7 site
BGS Ref Location NGR Depth Distance from U7 Site (km)
SU19/20 Manor Farm Castle Eaton 413040,195120 n/k 0.5
SU19/19 The Oaks Down Ampney 411130,195950 n/k 2.0
SU19/17 Manor Farm Down Ampney 411550,196040 n/k 2.0
Wiltshire Council Site U7 – Hydrogeological Impact Assessment
Hydrogeological Impact Assessment December 2011 34
4 Hydrogeological Risk Assessment 4.1 Review of Activities Proposed and the Potential Impacts 4.1.1 Site Operation and Post Extraction Plan
The identification of the potential sources of impact of a development is undertaken by a review of the details of the scheme. This includes the size, nature, time scale, construction methods and post extraction land use.
The development for consideration at U7 East of Calcutt is the excavation of a sand and gravel mineral resource. At the detailed planning application stage the applicant will set out a proposed method by which the mineral resource is to be exploited; the current Hydrogeological Risk Assessment (HRA) precedes the planning application stage and therefore detailed plans have not been formulated. For the purpose of the HRA the sources of potential impact have been selected based upon typical gravel extractive industry practice.
It is assumed that the extractive phase of the mineral working will be done in a series of discrete cells. The topsoil and the overburden will be stripped from the area to be worked. Existing drains that cross the cell will be diverted and a new boundary drain is excavated. The water level in the gravel is lowered by pumping during the initial excavations. Once an excavated area has been established the sides that are not being extended may be sealed with overburden or the underlying Oxford Clay to reduce inflow to the works and the need for dewatering. Water is required for various processes in the mineral extraction including dust suppression and mineral washing. Often this water is obtained from groundwater abstraction. Settlement lagoons are required on site to control the turbidity of surface water.
Discharge of excess water from the site may form part of the site plan and a consent to carry out this activity will be required from the EA. The operator will need to ensure that water can achieve the water quality limits that are stipulated by the EA.
Once the mineral extraction of an exploited cell is complete, dewatering of that cell will cease. During the post extraction phase the clay seal of the working cells is broken. The quarry site will be changed into a series of small lakes, wet woodland, agricultural land and natural grassland. Water levels are expected to recover to around their original level, and where this is greater than the ground level lakes or ponds will form. In this HRA it is assumed that following the mineral extraction phase the quarry voids will not be backfilled with imported landfill material of any kind.
The potential sources of impact on the water environment for evaluation are:
• Removal of existing ponds/wetlands within the site area;
• Diversion of surface water drains;
• Removal of soil surface (Site recharge);
• Temporary changes to groundwater levels within the River Terrace Deposits (Dewatering);
• Removal of aquifer sand and gravel and replacement with a void (Site recharge);
• Filling of quarry void with extensive lake or lakes, and conversion of existing groundwater resource into a surface water resource (site recharge & regional flow);
• Spillage/Loss of pollutants to surface and groundwater;
• Long term modification of groundwater regime in the RTD; and
Wiltshire Council Site U7 – Hydrogeological Impact Assessment
Hydrogeological Impact Assessment December 2011 35
• Modification of surface water regimes.
The impacts caused by the quarrying can be broadly negative, positive or neutral with respect to any particular attribute. For example the creation of managed water bodies can have a positive impact by reducing the frequency of flood events.
There will be other impacts of the development including surface water flood risk, permanent loss of high value pastoral land, transport/roads, visual impact, habitats, biodiversity, economic, social issues and recreation/tourism. These aspects are not covered by this report.
4.1.2 Dewatering Activities
The development of the mineral extraction will necessitate the control of groundwater. The works are assumed to be carried out in the dry by artificially lowering the groundwater levels in the aquifer and the prevention/limiting of groundwater inflows to the works.
It is assumed that the lowering of groundwater levels will be achieved by dewatering pumping. At the U7 site the water table is within a few metres of the ground surface. The maximum depth of the workings is estimated to be 4 m, and the estimated saturated thickness and depth of dewatering will range between 1.5 and 3.5 m. The volume of groundwater inflow during dewatering and the influence of dewatering on groundwater levels beyond the workings are estimated. These estimated dewatering rates are considerably greater than the natural flow under the site.
It is assumed limiting of flow into the workings will be achieved by continued dewatering pumping and probably by the use of temporary bunds. The bunds could be made from the low permeability Oxford Clay Formation that underlies the site and low permeability clay horizons within the alluvium and RTD, known as overburden within the quarrying industry. The bunds would be arranged around the perimeter of the workings to limit groundwater ingress, and reduce the potentially adverse drawdown effects of dewatering spreading from the site.
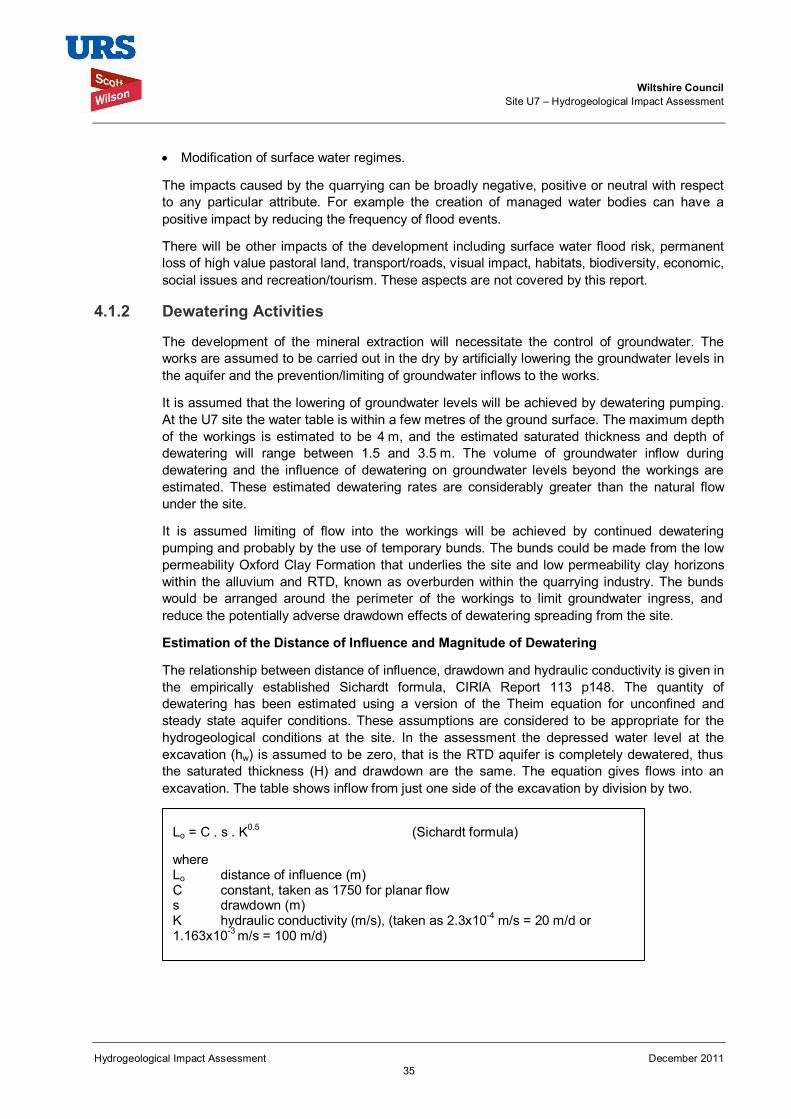
Estimation of the Distance of Influence and Magnitude of Dewatering
The relationship between distance of influence, drawdown and hydraulic conductivity is given in the empirically established Sichardt formula, CIRIA Report 113 p148. The quantity of dewatering has been estimated using a version of the Theim equation for unconfined and steady state aquifer conditions. These assumptions are considered to be appropriate for the hydrogeological conditions at the site. In the assessment the depressed water level at the excavation (hw) is assumed to be zero, that is the RTD aquifer is completely dewatered, thus the saturated thickness (H) and drawdown are the same. The equation gives flows into an excavation. The table shows inflow from just one side of the excavation by division by two.
Lo = C . s . K0.5 (Sichardt formula)
where Lo distance of influence (m) C constant, taken as 1750 for planar flow s drawdown (m) K hydraulic conductivity (m/s), (taken as 2.3x10⁻⁴ m/s = 20 m/d or 1.163x10⁻³ m/s = 100 m/d)

Wiltshire Council Site U7 – Hydrogeological Impact Assessment
Hydrogeological Impact Assessment December 2011 36
Table 13 Extent of Effect and Magnitude of Dewatering Drawdown [H-hw] (m)
Distance of influence (m) Inflow (m3/d) per 100m of working
K = 20 m/d K = 100 m/d K = 20 m/d K = 100 m/d 1.5 40 90 56 125 2.0 53 119 76 168 2.5 66 150 95 208 3.0 80 179 112 251 3.5 93 209 131 293
4.1.3 Changes to the Recharge Characteristics and the Unsaturated Zone
The quarrying activity will result in the removal of the vegetation, topsoil and clay rich subsoil (in combination known as overburden). For periods the Oxford Clay may be exposed. The land is currently used as pastoral farmland. The removal of the vegetation will reduce the water uptake by plants and hence evapotranspiration from the land. Where land surface is replaced by open water then evaporation will increase from the site area. It is not expected that these changes will result in any significant change of recharge to the secondary RTD aquifer.
4.1.4 Water Quality
The risk to groundwater quality can arise from the introduction of pollutants to the ground or by the mobilisation of existing contamination or sediment. At the U7 site there is neither evidence nor expectation of groundwater contamination. This risk factor is therefore not carried forward into the risk assessment matrix. There remains a possibility that once quarrying activities have removed an overburden from the sand and gravel deposits, any pollutant that is accidentally spilt on the site can rapidly move though the unsaturated zone, contaminate groundwater and result in a pollution plume from the site that may then reach surface water bodies.
Activities will result in mobilisation of sediment which has the potential to affect surface water quality.
4.2 Receptors The assessment of Baseline Conditions, as presented in Section 3, has identified the surface water and groundwater receptors presented in Table 14.
The water features that lie in different catchments to the proposed mineral site, that is, they drain to a tributary that joins the main river down stream of the site, are not considered to have a pathway, and are therefore excluded from this HRA. The key potential surface water receptors are those that are within the estimated zone of influence for dewatering (around 200 m).
Q = K.w.(H2 – hw2) / L0 (Theim equation)
where Q Flow or Pumping rate (m3/d) K hydraulic conductivity (m/d), taken as 20 or 100 m/d w width of strip evaluated, taken as 100 m H initial water level in the aquifer (m) hw lowered water level in the aquifer (m) taken as 1m Lo distance of influence (m)
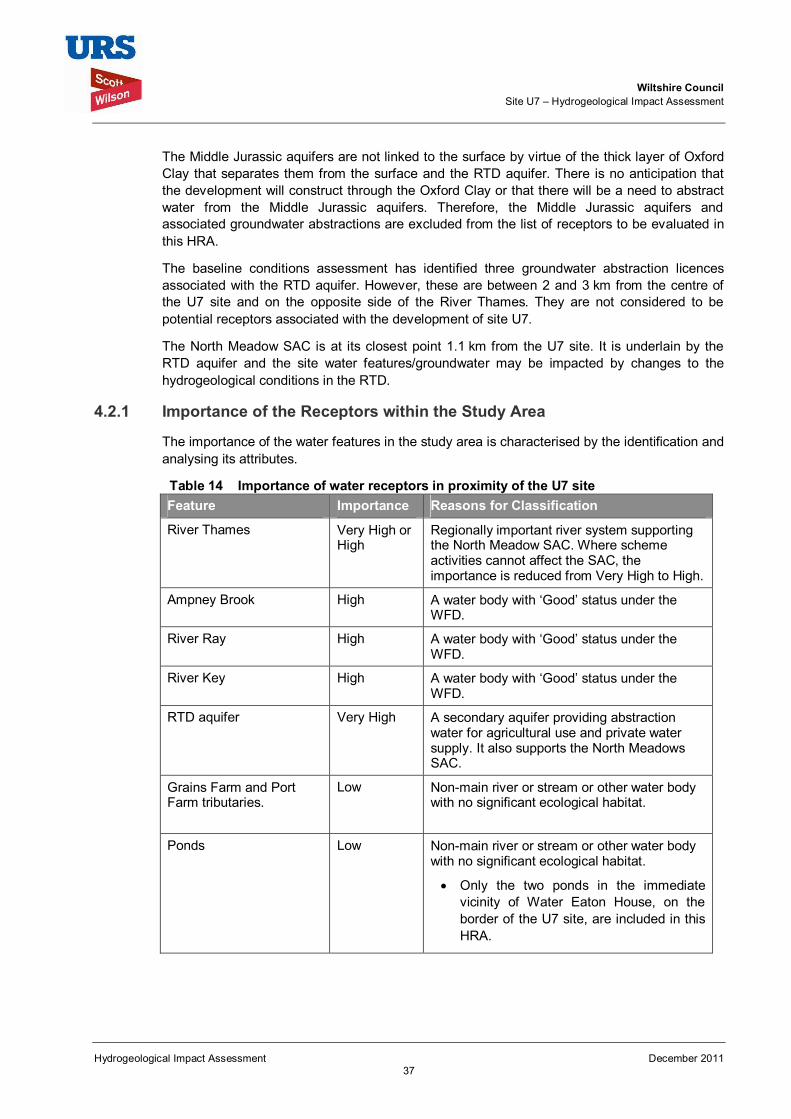
Wiltshire Council Site U7 – Hydrogeological Impact Assessment
Hydrogeological Impact Assessment December 2011 37
The Middle Jurassic aquifers are not linked to the surface by virtue of the thick layer of Oxford Clay that separates them from the surface and the RTD aquifer. There is no anticipation that the development will construct through the Oxford Clay or that there will be a need to abstract water from the Middle Jurassic aquifers. Therefore, the Middle Jurassic aquifers and associated groundwater abstractions are excluded from the list of receptors to be evaluated in this HRA.
The baseline conditions assessment has identified three groundwater abstraction licences associated with the RTD aquifer. However, these are between 2 and 3 km from the centre of the U7 site and on the opposite side of the River Thames. They are not considered to be potential receptors associated with the development of site U7.
The North Meadow SAC is at its closest point 1.1 km from the U7 site. It is underlain by the RTD aquifer and the site water features/groundwater may be impacted by changes to the hydrogeological conditions in the RTD.
4.2.1 Importance of the Receptors within the Study Area
The importance of the water features in the study area is characterised by the identification and analysing its attributes.
Table 14 Importance of water receptors in proximity of the U7 site Feature Importance Reasons for Classification
River Thames Very High or High
Regionally important river system supporting the North Meadow SAC. Where scheme activities cannot affect the SAC, the importance is reduced from Very High to High.
Ampney Brook High A water body with ‘Good’ status under the WFD.
River Ray High A water body with ‘Good’ status under the WFD.
River Key High A water body with ‘Good’ status under the WFD.
RTD aquifer Very High A secondary aquifer providing abstraction water for agricultural use and private water supply. It also supports the North Meadows SAC.
Grains Farm and Port Farm tributaries.
Low Non-main river or stream or other water body with no significant ecological habitat.
Ponds Low Non-main river or stream or other water body with no significant ecological habitat.
• Only the two ponds in the immediate vicinity of Water Eaton House, on the border of the U7 site, are included in this HRA.

Wiltshire Council Site U7 – Hydrogeological Impact Assessment
Hydrogeological Impact Assessment December 2011 38
4.2.2 Identification of Pathways
The pathway or mechanism provides a route or a method by which the potential source of impact could impact the receptors.
The assessment of baseline conditions in Section 3 indicates that the RTD aquifer and Alluvium deposits form a pathway between the identified surface water receptors and the proposed quarry development. Therefore, the RTD aquifer is both a pathway and a receptor.
A second pathway is artificial, and related to the operation of the scheme outlined in Section 4.1. It is assumed that dewatering will be required, and therefore it is likely there will be an associated discharge to a surface water course.
4.3 Appraisal of Magnitude of Impact on Receptors The proposed development has the potential to impact water resource features within the area. The significance of any effect will depend on the sensitivity of the water resource and the current conditions of the resources, the magnitude of any impact and the implementation of any mitigation measures during construction and operation.
Impacts arising as a result of the development, both positive and negative, are likely to affect the proposed development’s ability to satisfy the criteria outlined within relevant local, national and international planning policy and legislation.
It has been assumed that any quarrying phase effects are temporary and any post extraction phase effects are permanent.
4.3.1 Impacts during Construction/Gravel Extraction
The assessment of impact is based on an assumed gravel extraction scheme. The predicted potential impact is highly uncertain as a result of lack of information and design details. The impact assessment does however identify those elements of any future design where mitigation will be desirable to reduce the impact upon water features.
Impacts on surface water receptors
Key impacts that may result from operation of the site are associated with dewatering activities, as surface water courses are likely to be in hydraulic continuity with the RTD aquifer. Dewatering of the aquifer may result in the loss of flow from the surface water receptors; this would be most significant during periods of low flow. The potential magnitude of this impact is considered to be High without any mitigation measures for the lower reach of the River Ray; the ‘Good Status’ of this water body could be compromised by the dewatering abstractions. The potential magnitude of impact is Low (not medium or high) for the River Thames, owing to high river flows relative to estimated dewatering volumes, and Low for the River Key and Down Ampney Brook, as only the very lowest reaches (confluence with the River Thames) have the potential to be impacted. The potential magnitude of impacts on the Grains Farm and Port Farm tributaries, and those ponds at the boundary of the U7 site, is deemed to be High, as without appropriate mitigation these features may be heavily damaged.
A key impact that may result from the site operation is the generation of a surface water discharge containing a high suspended sediment load. The operation of the site will generate turbid waters as a result of removal of excess rainwater and seepage water from the quarry area and other exposed areas. Mineral washing to remove fines from the product also creates waste water with a high suspended sediment load. Turbid water may also arise from pumped groundwater that will be created by the lowering of groundwater levels. The waste water will
Wiltshire Council Site U7 – Hydrogeological Impact Assessment
Hydrogeological Impact Assessment December 2011 39
have an adverse impact upon local surface water bodies. The potential magnitude of this impact is considered to be High for the River Ray; the ‘Good Status’ of this water body could be compromised. The potential magnitude of the impact is considered to be Medium (not high) for the River Thames owing to the magnitude of the river flow i.e. good dilution, and High for the Grains Farm and Port Farm tributaries, as existing natural flows are expected to be low i.e. poor dilution. It is assumed that the ponds would not be used as a discharge point and therefore the potential impacts are Very Low. There can be no impacts on water bodies up-gradient of site e.g. River Key.
Washout facilities (washing of tools, plant and equipment), storage and use of various liquids and soluble solids and fuel storage and handling all have the potential to result in pollution of watercourses. If stored material is in liquid form or comes into contact with water, there is potential for runoff into nearby water bodies, or percolation into the substrate, which could contaminate groundwater. Activities in close proximity to the water bodies pose a risk to the direct spillage of contaminants into water bodies. The potential magnitude of the above impacts is considered to be High for the River Ray, as the integrity of the water body could be affected. The potential magnitude of impacts is considered to be Medium (not high) for the River Thames owing to the magnitude of the river flow i.e. good dilution, and High for the Grains Farm and Port Farm tributaries, as existing natural flows are expected to be low i.e. poor dilution. The potential magnitude of impact on the ponds close to the boundary of the U7 site is High.
Throughout the operation of the proposed development, there will be vehicles passing in and out of the site. Runoff containing elevated suspended sediment levels from these activities poses a possible risk by potentially increasing sediment loads in nearby watercourses should this sediment enter surface water drains or runoff directly to watercourses. High sediment input can have direct adverse effects on adjacent surface watercourses by increasing turbidity and reducing dissolved oxygen levels. Other effects include reduced light penetration and plant growth, smothering of vegetation and bed substrates, impacting invertebrate and fish communities, and destruction of feeding areas, refuges and breeding/ spawning areas. The magnitude of the above impacts is considered to be Medium on the River Ray, as the impacts could be significant, but are unlikely to change the WFD status of the water body. The potential magnitude of the impact is considered to be Low for the River Thames owing to the magnitude of the river flow i.e. good dilution, and Medium for the Grains Farm and Port Farm tributaries, as existing natural flows are expected to be low i.e. poor dilution. There are unlikely to be any impacts on the ponds, and therefore the Very Low category is assigned.
Impacts on groundwater receptors
The main impact on groundwater is expected to arise from the dewatering activities associated with sand and gravel extraction. To enable removal of sand and gravel under dry conditions the water level in the RTD will be lowered by pumping around the perimeter of the excavation. The lowing of groundwater levels extends from the perimeter of the site to approximately 200 m. There are no existing users of groundwater resources within 200 m of the site and the nearest ecological site is the North Meadow NNR/SSSI/SAC, which is around 1.1 km upstream of U7, and therefore considered to be beyond the extent of the dewatering impact. The potential magnitude of impact is assessed to be Low.
4.3.2 Impacts during Post Operation Land Use
Impacts on surface water receptors
The post quarrying land use is assumed to restore the site to a series of small lakes, wet woodland, agricultural land and natural grassland. The active dewatering of surface water from
Wiltshire Council Site U7 – Hydrogeological Impact Assessment
Hydrogeological Impact Assessment December 2011 40
the quarry voids will stop and they will backfill with groundwater and rainfall. The difference to the hydrological system post operation compared with before the development is twofold. There will be an increase in open water in the environment, and this will result in a greater evaporative loss and thus a marginal reduction of baseflow flows to the River Thames. Secondly the open water could result in a more rapid response to rainfall events, thus potentially making the rivers more prone to flooding if the lakes are directly connected to them.
The overall contribution of these effects from a 172 ha site is considered to be Very Low when compared to the stream flows in the River Thames at this point in the river catchment.
Impacts on groundwater receptors
The removal of the RTD aquifer over a section of the river valley will modify the groundwater flow regime. If the perimeter of the post operation surface water bodies is less permeable than the RTD aquifer they replace, then it is possible an increase in groundwater levels up-gradient (to the west) of the quarry site may occur. There will be an associated decrease in groundwater levels down-gradient of the quarry site. However, owing to the distances to the nearest groundwater receptors, the magnitude of impact is deemed to be Very Low.

Wiltshire Council Site U7 – Hydrogeological Impact Assessment
Hydrogeological Impact Assessment December 2011 41
Table 15 Summary of Impacts of mineral extraction at U7 site Impact Source Receptors Magnitude Quarry Operation/Excavation
River Ray High River Thames and North Meadow SAC
Low
River Key Low Down Ampney Brook Low Grains Farm tributary High Port Farm tributary High Ponds at U7 boundary High
Dewatering Quarry
RTD aquifer GW abstractors and North Meadow SAC
Low
River Ray High River Thames and North Meadow SAC
Medium
Grains Farm tributary High Port Farm tributary High
Elevated levels of suspended solids in run-off and dewatering discharge
Quarry
Ponds at U7 boundary Very Low River Ray High River Thames and North Meadow SAC
Medium
Grains Farm tributary High Port Farm tributary High
Contaminants in site run-off Quarry
Ponds at U7 boundary High River Ray Medium River Thames and North Meadow SAC
Low
Grains Farm tributary Medium Port Farm tributary Medium
Elevated levels of suspended solids in run-off
Roads outside quarry
Ponds at U7 boundary Very Low Post Construction Land Use
River Ray Very Low Surface water flows and water quality
Former Quarry River Thames Very Low
Groundwater Level Former Quarry
RTD aquifer GW abstractors and North Meadow SAC
Very Low

Wiltshire Council Site U7 – Hydrogeological Impact Assessment
Hydrogeological Impact Assessment December 2011 42
4.4 Assessment of Significance of Effects As described in Section 2.1, the significance of effects is a product of the magnitude of the impact and the importance of the receptor. The significance of effects associated with the development of the U7 site is identified in Table 16.
Table 16 Summary of significance of effects (before mitigation)
Potential Impact Receptor Water Feature
Importance or Sensitivity of Water Feature
Magnitude of Potential Impact
Significance of Effect Before Mitigation
Quarry Operation/Excavation
River Ray High High Major / Moderate adverse River Thames and North Meadow SAC
Very High Low Moderate adverse
River Key High Low Moderate / Minor adverse Down Ampney Brook High Low Moderate / Minor adverse Grains Farm tributary Low High Moderate / Minor adverse Port Farm tributary Low High Moderate / Minor adverse Ponds at U7 boundary
Low High Moderate / Minor adverse
Dewatering
RTD aquifer GW abstractors and North Meadow SAC
Very High Low
Moderate adverse
River Ray High High Major / Moderate adverse River Thames and North Meadow SAC
High Medium Moderate adverse
Grains Farm tributary Low High Moderate / Minor adverse Port Farm tributary Low High Moderate / Minor adverse
Elevated levels of suspended solids in run-off and dewatering discharge
Ponds at U7 boundary
Low Very Low Negligible
River Ray High High Major / Moderate adverse River Thames and North Meadow SAC
High Medium Moderate adverse
Grains Farm tributary Low High Moderate / Minor adverse Port Farm tributary Low High Moderate / Minor adverse
Contaminants in site run-off
Ponds at U7 boundary
Low High Moderate / Minor adverse
River Ray High Medium Moderate adverse River Thames and North Meadow SAC
High Low Moderate / Minor adverse
Grains Farm tributary Low Medium Minor adverse Port Farm tributary Low Medium Minor adverse
Elevated levels of suspended solids in run-off on roads
Ponds at U7 boundary
Low Very Low Negligible
Post Construction Land Use
River Ray High Very Low Minor adverse Surface water flows and water quality River Thames and
North Meadow SAC High Very Low Minor adverse
Groundwater Level RTD aquifer GW abstractors and North Meadow SAC
Very High Very Low
Moderate / Minor adverse
Wiltshire Council Site U7 – Hydrogeological Impact Assessment
Hydrogeological Impact Assessment December 2011 43
4.5 Mitigation Measures The summary of significance of effects is provided in Table 16. The effect of some of the potential impacts on the receiving water bodies is potentially significant (moderate or major) and may cause pollution and adverse impacts. The most significant effects are those associated with the River Ray.
Mitigation measures will be required for the potential impacts to minimise their effects or reduce the likelihood of an impact occurring. These measures will need to be embedded within the design, once the proposed scheme has been defined in greater detail. However, an outline of the mitigation measures that can guard against the impacts is provided in the following Sections. The measures are all good practice within the aggregate extractive industry.
4.5.1 Elevated Levels of Suspended Solids
The generation of surface water from the site with elevated turbidity and /or contaminants poses a significant potential effect before mitigation of site operation. Mitigation measures required in any scheme will include:
• Lagoons of sufficient size and mode of operation to permit the fine material to settle out of suspension;
• The levels of the site drains to be organised so that surface water runoff from working areas does not immediately leave the site; and
• Vehicle and wheel washing facilities and mineral washing are required to ensure that fine material is not transferred to public roads from tyres.
4.5.2 Contamination from Chemicals and Fuel Stored on Site
The mitigation measures to reduce the significance of the effect should include:
• Fuel to be stored in tanks sited on an impervious base surrounded by bunds;
• Limit vehicle servicing to be undertaken on areas of hardstanding in the aggregate processing plant site area;
• Lubricants to be limited to a small supply to be kept on drip trays in a locked container in the aggregate processing plant area;
• A supply of materials to ensure a rapid clear up of any fuel or oil spillage must be maintained on site in readiness for use; and
• Should any spillage occur then the affected area of ground shall be excavated and removed from the site to an appropriately constructed licensed waste site.
4.5.3 Dewatering
The potential impact of dewatering may be minimised by working the area in phases and cells. The influence of dewatering is not expected to extend for more than two hundred metres from the site. This impact can be reduced or mitigated against by returning the water upstream of the site in recharge trenches.
The quarrying plans should be designed to include a zone with no dewatering structures (stand-off) in close proximity to the watercourses and buildings. The use of clay bunds or seals within the working cells will reduce the groundwater seepage into the site and can thus reduce the dewatering that will be required.

Wiltshire Council Site U7 – Hydrogeological Impact Assessment
Hydrogeological Impact Assessment December 2011 44
The scheme for site operation will need to have mitigation in place to control the turbidity of waters that leave the site and therefore protect surface water quality. The use of settlement lagoons to mitigate against this impact is necessary.
The dewatering activities may impact upon flows in watercourses in the vicinity of the site. This may be mitigated by returning water from the dewatering system to the surface water. This will require a consent from the EA and the water will need to comply with the conditions of quantity, quality and periods of operation that are stipulated in the consent.
4.5.4 Post Operation Groundwater Levels
The design of the site restoration should plan to create a series of carefully managed small lakes, wet woodland, agricultural land and natural grassland at different levels and the use of bund material to form features. These could be arranged so that the final surface water levels are similar to the pre-development groundwater levels in the area. With these measures in place the groundwater levels in the adjacent parts of the RTD aquifer that are not extracted will be unaffected. The changes to the groundwater regime outside of the site as a result of the quarrying and post operational plan are anticipated to be insignificant with no adverse impacts predicted.
4.6 Residual Effects Once mitigation measures have been implemented the major and moderately significant effects can be reduced so that they become insignificant.

Wiltshire Council Site U7 – Hydrogeological Impact Assessment
Hydrogeological Impact Assessment December 2011 45
5 Site Investigations and Monitoring Prior to commencement of the quarry scheme, a site investigation and associated monitoring will be required to establish the baseline conditions, including:
• Distribution and thickness of sand and gravel within the superficial deposits;
• Hydraulic properties of the aquifer from in-situ testing;
• Groundwater levels and water quality across the site;
• Surface water flows, levels and water quality; and
• Identification of aquatic ecology in the ponds.
The data will be used to:
• Assess hydraulic relationships between surface water bodies and the RTD aquifer and gain an improved understanding of the groundwater flow regime;
• Identify the levels of any existing contamination in the RTD aquifer and surface water bodies (and implications for dewatering and discharge consents);
• Determine if there is aquatic ecology of importance within the ponds; and
• Understand the potential for subsidence issues at properties and roads along the boundary of the proposed mineral sites.
The location of monitoring points and the frequency of monitoring will need to be agreed with the Environment Agency.
Following data collection, the Hydrogeological Impact Assessment along with mitigation measures must be reviewed.

Wiltshire Council Site U7 – Hydrogeological Impact Assessment
Hydrogeological Impact Assessment December 2011 46
6 Conclusion A hydrogeological risk assessment has been undertaken for the proposed site U7 to identify whether the development of an aggregate quarry is likely to have significant residual effects upon water features.
The water features that could be potentially adversely impacted by a development are the River Thames, River Ray, River Key, Ampney Brook, Grains Farm tributary, Port Farm tributary, ponds near Water Eaton House, and the River Terrace Deposits aquifer. The River Thames and River Terrace Deposits aquifer also support the North Meadows SAC, which is located around 1.1 km upstream of the U7 site. The deeper Oolitic Limestone Principal Aquifer that is used for public water supply and has source protection zones has been scoped out of the risk assessment, owing to the thickness of the Oxford Clay Formation.
There are potential significant effects due to dewatering activities and turbid water entering the surface watercourses. Mitigation measures, most of which can be embedded into the design of the quarry, can be designed to ensure that the residual effects are insignificant.
The hydrogeological risk assessment will need to be reviewed once baseline monitoring data have been collected.

Wiltshire Council Site U7 – Hydrogeological Impact Assessment
Hydrogeological Impact Assessment December 2011 47
7 References Allen DJ, Brewerton LJ, Coleby LM, Gibbs BR, Lewis MA, MacDonald AM, Wagstaff SJ and Williams AT. 1997. The physical properties of major aquifers in England and Wales. BGS Tech.Rep. WD/97/34 – EA R&D Pub. 8
CIRIA.2000. Report C515 - Groundwater Control - Design and Practice.
Hyder Consulting, May 2000. Roundhouse Farm Quarry Hydrological and Hydrogeological Assessment.
Jones HK, Morris BL, Cheney CS, Brewerton LJ, Merrin PD, Lewis MA, MacDonald AM, Coleby LM, Talbot JC, McKenzie AA, Bird MJ, Cunningham J and Robinson VK. 2000. The physical properties of minor aquifers in England and Wales. BGS Tech.Rep. WD/00/4 – EA R&D Pub. 68
Sen and Abbott, 1991. Hydrogeological investigation of a fault in clay. QJEG v24 pp413-425.
Tarmac Quarry Products Ltd - Hydrogeology Unit, July 1999. Eysey Manor Farm: An assessment of the potential impacts upon the water environment of the proposed extraction of sand and gravel and restoration to agriculture, lakes and nature conservation after-uses.

Wiltshire Council Site U7 – Hydrogeological Impact Assessment
Hydrogeological Impact Assessment December 2011
ANNEX A