hydroclimatic controls on water balance and water level...
TRANSCRIPT
HYDROLOGICAL PROCESSESHydrol. Process. 20, 4155–4172 (2006)Published online in Wiley InterScience(www.interscience.wiley.com) DOI: 10.1002/hyp.6424
Hydroclimatic controls on water balance and water levelvariability in Great Slave Lake
J. J. Gibson,* T. D. Prowse and D. L. PetersNational Water Research Institute, Water & Climate Impacts Research Centre, University of Victoria, Victoria BC V8W 2Y2, Canada
Abstract:
On average, 86% of riverine discharge to Great Slave Lake, Northwest Territories, Canada, was gauged during theperiod 1964–1998, offering an unprecedented opportunity to study and understand controls on water balance of alarge northern lake at the headwaters of the Mackenzie River. A functional daily water balance model, incorporatingmeasurements of riverine inflow, precipitation on the lake surface, evaporation, and riverine outflow was developed,which predicts the amplitude and frequency of annual water level fluctuations, and closes the water balance to withinš6% for 28 of 35 years and š11% for the remaining 7 years, with an overall systematic error of C2%. Annual waterbalance estimates for the period 1964–1998 reveal that about 74% of inflow into Great Slave Lake originates from thePeace-Athabasca catchments that enter the lake via the Slave River, whereas 21% is derived from other catchmentsbordering Great Slave Lake, and 5% from precipitation on the lake surface. An estimated 94% of water losses occurby riverine outflow to the Mackenzie River and 6% by evaporation from the lake surface. The primary driving forcebehind water level fluctuations in Great Slave Lake, including the post-regulation period following development ofthe W.A.C. Bennett Dam, is shown to be climate-driven precipitation variability in the Peace-Athabasca basins. Asimple precipitation regression model is developed to simulate water level fluctuations in Great Slave Lake over thepast 100 years. Copyright 2006 John Wiley & Sons, Ltd.
KEY WORDS water budget; climate impacts; Great Lakes; evaporation; Arctic; northern hydrology
Received 7 September 2004; Accepted 10 September 2005
INTRODUCTION
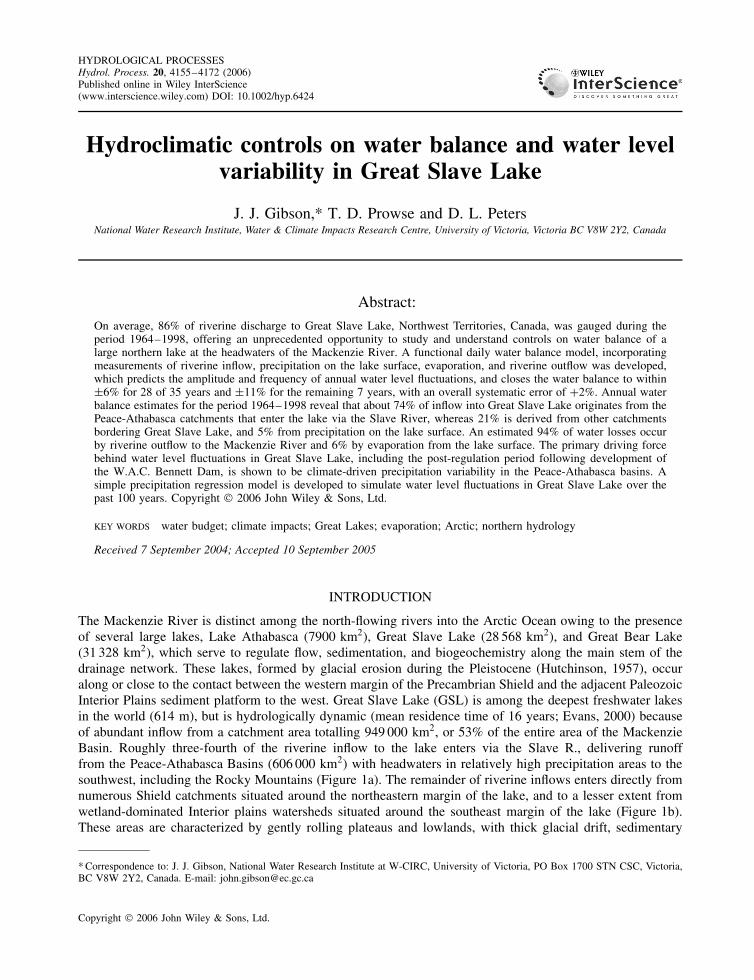
The Mackenzie River is distinct among the north-flowing rivers into the Arctic Ocean owing to the presenceof several large lakes, Lake Athabasca (7900 km2), Great Slave Lake (28 568 km2), and Great Bear Lake(31 328 km2), which serve to regulate flow, sedimentation, and biogeochemistry along the main stem of thedrainage network. These lakes, formed by glacial erosion during the Pleistocene (Hutchinson, 1957), occuralong or close to the contact between the western margin of the Precambrian Shield and the adjacent PaleozoicInterior Plains sediment platform to the west. Great Slave Lake (GSL) is among the deepest freshwater lakesin the world (614 m), but is hydrologically dynamic (mean residence time of 16 years; Evans, 2000) becauseof abundant inflow from a catchment area totalling 949 000 km2, or 53% of the entire area of the MackenzieBasin. Roughly three-fourth of the riverine inflow to the lake enters via the Slave R., delivering runofffrom the Peace-Athabasca Basins (606 000 km2) with headwaters in relatively high precipitation areas to thesouthwest, including the Rocky Mountains (Figure 1a). The remainder of riverine inflows enters directly fromnumerous Shield catchments situated around the northeastern margin of the lake, and to a lesser extent fromwetland-dominated Interior plains watersheds situated around the southeast margin of the lake (Figure 1b).These areas are characterized by gently rolling plateaus and lowlands, with thick glacial drift, sedimentary
* Correspondence to: J. J. Gibson, National Water Research Institute at W-CIRC, University of Victoria, PO Box 1700 STN CSC, Victoria,BC V8W 2Y2, Canada. E-mail: [email protected]
Copyright 2006 John Wiley & Sons, Ltd.
4156 J. J. GIBSON, T. D. PROWSE AND D. L. PETERS
(a)
(b)
(c)
Figure 1. Maps of (a) the Mackenzie Basin showing major sub-basins and large lakes, (b) Great Slave Lake and water level and precipitationmonitoring sites, (c) catchments tributary to Great Slave Lake. Note that catchment numbers refer to Table I; ug is ungauged
bedrock, and extensive areas of lakes, muskeg, and swamp, in contrast to a thin, discontinuous cover of glacialdrift overlying crystalline bedrock, which creates disorganized drainage and myriad lakes within PrecambrianShield areas (Louie et al., 2002).
The most significant flow regulation structure within the GSL drainage is the Bennett Dam, which impoundsan estimated 4Ð1 ð 1010 m3 of water (Muzik, 1985) in the Williston Reservoir on the Peace River. Despite itsconsiderable distance from Great Slave Lake, filling of the dam during 1968–1971 resulted in diversion of1Ð2 times the annual flow from the river (Peters and Prowse, 2001). Regulation of the river also has shifted thepattern of seasonal flows and dampened flow extremes, creating a less variable annual flow regime (Prowseet al., 2002a). Such changes may also affect ice conditions, flooding, fluvial geomorphology, and riparianvegetation in the lower Peace River, Peace-Athabasca Delta, and Slave River Delta (Prowse and Conly, 2002b).
While numerous process and modelling studies on hydrology have been undertaken within the MackenzieBasin, most recently as part of the Canadian Global Energy and Water Cycle Experiment (Stewart et al.,1998; Rouse, 2000; Rouse et al., 2003a), few studies have focused on the water cycle processes of thelarge high-latitude lakes. Notable exceptions include Kerr (1997) who summarized the 1973–1992 monthlywater balances for Great Slave and Great Bear Lakes, Blanken et al. (2000) who provided the first directmeasurements of evaporation from a high-latitude northern lake (GSL) using eddy correlation methods, andMenard et al. (2002) who modelled GSL ice phenology. Other studies have provided baseline information onrelated issues such as the effect of ice on the hydraulics of the Mackenzie River at the outlet of GSL (Hicks
Copyright 2006 John Wiley & Sons, Ltd. Hydrol. Process. 20, 4155–4172 (2006)DOI: 10.1002/hyp
HYDROCLIMATIC CONTROLS ON GSL WATER LEVEL FLUCTUATIONS 4157
et al., 1995) and preliminary assessment of the potential impacts of climate change on runoff in sub-basinsof the Mackenzie (Soulis et al., 1994). One of the major limitations of the study by Kerr (1997) was thatthe lack of evaporation measurements for high-latitude lakes required that evaporation be incorporated intothe residual error, to a large extent preventing rigorous assessment of sources of uncertainty and variabilityin the water balance. The role of large lakes, a primary unknown in the hydroclimatology of the MackenzieBasin identified by Lawford (1994), has remained one of the primary objectives of future GEWEX processand modelling studies within the basin (Rouse, 2000). Fortunately, basic monitoring information, such aswater level data, are available at four stations on Great Slave Lake from 1938 to the present. The mean waterlevel of Great Slave Lake over the period 1938–99 was 156Ð60 š 0Ð22 (1std) masl, but with considerablevariability both annually and interannually. Record high water levels of 157Ð23 m were observed in August1997, while record low water levels of 156Ð03 m were observed in October 1981, giving an historical rangeof about 1Ð2 m. High water levels resulted mainly from a management decision to release water from theW.A.C. Bennett Dam because it appeared at the time that the berm was weakening (M.English, pers. comm.)(Note that wind seiche events can produce similar water level changes over short time-periods). Typical annualfluctuations are on the order of 0Ð4m. It is also significant to note that an average 86% of riverine inflow fromthe catchment area of GSL has also been gauged by the Water Survey of Canada (WSC) during 1964–98,and similar information is available to estimate outflows. Precipitation monitoring at several stations has alsobeen conducted around the periphery of the lake over the same period.
This paper presents an historical water balance analysis for Great Slave Lake for the period 1964–98,with the aim of examining potential sensitivity of the system to climate and water resources impacts overthe past 35 years. One primary motivation for the study is to assess the potential impacts of changing lakelevels on the structure and function of the Slave River delta, including depositional energy distribution andlocation of sedimentation. This work extends the water balance analysis of Kerr (1997) by 15 years, includingthe period of initial filling of the Williston reservoir, and includes two additional climate-driven dryingcycles. In addition, this analysis benefits from knowledge gained through the recent studies on ice phenologyand evaporation process by Menard et al. (2002) and Blanken et al. (2000), respectively, to constrain theevaporation component of the water cycle; which as we show is important for characterizing variability in theterms of water balance and for examining the underlying causes of water balance and water level variabilityof GSL. A functional daily water balance model of the lake is developed, which is capable of predicting theamplitude and frequency of annual water level fluctuations in Great Slave Lake. Overall, this paper describesthe basic characteristics of the water balance of GSL such as throughflow and water level relationships,identifies the principle sources of uncertainty in the water balance, and demonstrates the predominant climaticcontrol of precipitation in the Peace-Athabasca basin on the observed wetting and drying cycles that the lakehas undergone over a 35-year period. Knowledge of the basic water balance characteristics of Great SlaveLake also sheds light on the role of large lakes in controlling Mackenzie Basin runoff and highlights thesensitivity of northern Great Lakes to hydroclimatic processes in more southerly areas.
METHODOLOGY AND DATASETS
The basic strategy employed to compute the water balance relies on estimation of total inflow as the sumof riverine inflows and precipitation directly on the lake surface, and estimation of total outflow as the sumof riverine discharge and evaporation from the lake surface, using water level records to characterize storagechanges. The potential role of groundwater is also discussed, although direct estimates of subsurface exchangeare unavailable. The annual water balance was computed for calendar years (1 January–31 December) on thebasis of the relationship
I C P � Q � E D dS/dt š G š error �1�
where I is the mean annual riverine inflow to the lake (m3 s�1), P is the mean annual precipitation on thelake surface (m3 s�1), Q is the mean annual riverine outflow (m3 s�1), E is the mean annual evaporation
Copyright 2006 John Wiley & Sons, Ltd. Hydrol. Process. 20, 4155–4172 (2006)DOI: 10.1002/hyp

4158 J. J. GIBSON, T. D. PROWSE AND D. L. PETERS
(m3 s�1), dS/dt is the mean change in lake storage (m3 s�1), and the residual šG š error includes error inall measurements including the net groundwater exchange (m3 s�1). A working model was also developedto test the model’s robustness for predicting daily water balance and water level changes. Data used for thecomputations are described in the subsequent text.
On-lake precipitation
Precipitation data from Environment Canada weather stations in the vicinity of Great Slave Lake wereused to estimate the precipitation falling directly on the lake surface. The lake surface area (28 568 km2) wasdivided into sub-regions using a Theissen polygon approach (see Dingman, 2002, p. 121) so that precipitationof the whole lake was weighted according to the fraction of sub-basin situated closest to each individualprecipitation station. This approach was considered adequate owing to small differences in relief betweenprecipitation stations and the lake, and the small influence of precipitation in the overall water balance.Several combinations were assessed to test the sensitivity of the results by the elimination of one, two, orthree stations (Table I) Rouse et al. (2003b).
The results shown in Table I indicate that errors associated with the choice of precipitation stations areexpected to be less than about 5%, even if up to three recording stations are eliminated. As precipitationaccounts for only 5% of total inflows to the lake, errors in the water balance due to the choice of Theissenpolygons is evidently negligible (<1%). More significant are the potential errors due to systematic gaugeundercatch related to error in snow accumulation measurements, and those due to wetting losses, traceprecipitation events, and wind effects (Woo et al., 1983; Metcalfe and Goodison, 1993). Metcalfe et al.(1999) provide an adjusted archive to account for these effects at 16 stations in the Northwest Territories.These adjusted data suggest a mean annual precipitation of approximately 340 mm at Yellowknife for theperiod 1968–1996, which is 25% larger than values reported in the standard climate archive. Although thedata of Metcalfe et al. (1999) likely provide a more accurate view of precipitation accumulation, it is arguablewhether such revisions truly reflect available water input unless sublimation losses are taken into account.Sublimation losses during winter can be significant, perhaps 20% of snowfall under optimal blowing snowconditions (Pomeroy et al., 1997). The use of unadjusted precipitation in the current analysis, where stationstypically receive 50% of annual precipitation as snowfall, is justified as it partially accounts for the combinedeffect of precipitation undercatch (C25%) and sublimation losses (�10%). As the on-lake precipitation isonly a small contribution to the total inflow into GSL, the resulting errors in the water balance are expectedto be on the order of 1–1Ð5%, which is adequate for the purposes of this analysis. No effort was thereforemade to account for special factors such as lake-effect, snowfall, and rainfall.
Table I. Mean Annual Precipitation (mm) on Lake evaluated by several Theissen Polygon Combinations. Note that Yel-lowknife and Hay River were considered critical stations and were used in all combinations. Note that Column 7, the
scenario yielding an estimate closest to the calculated mean value, was used in the analysis
PrecipitationStation
AnnualPrecipitation
Theissen PolygonCombination
1964–19981 2 3 4 5 6 7
Yellowknife A 269Ð7 0Ð17 0Ð19 0Ð19 0Ð55 0Ð19 0Ð55 0Ð17Hay River A 322Ð0 0Ð25 0Ð25 0Ð23 0Ð26 0Ð25 0Ð28 0Ð23Fort Reliance 270Ð7 0Ð14 0Ð14 0Ð14 0Ð16 — 0Ð16 0Ð14Fort Providence A 303Ð8 — — 0Ð02 0Ð02 — — 0Ð02Fort Resolution A 313Ð7 0Ð41 0Ð41 0Ð41 — 0Ð55 — 0Ð41Snare Rapids 241Ð7 0Ð02 — — — — — 0Ð02Predicted precipitation on Lake — 297Ð7 298Ð3 297Ð9 281Ð4 304Ð3 281Ð8 297Ð3% Error (relative to mean D 294Ð1 mm) — 1Ð2 1Ð4 1Ð3 �4Ð3 3Ð4 4Ð2 1Ð1
Copyright 2006 John Wiley & Sons, Ltd. Hydrol. Process. 20, 4155–4172 (2006)DOI: 10.1002/hyp
HYDROCLIMATIC CONTROLS ON GSL WATER LEVEL FLUCTUATIONS 4159
The following precipitation station weightings were calculated from the Theissen polygon analysis and usedto estimate the precipitation over the lake: Yellowknife (17%), Hay River (23%), Fort Reliance (14Ð2%), FortProvidence (2%), Fort Resolution (41%), Snare Rapids (2%). For running the operational daily water balancemodel, snow and rain were accounted for separately to allow snow accumulation to occur on lake ice fromthe time of freeze-up until 1 May. Snow was then melted and added to the lake storage over a period of15 days, which was intended to roughly simulate the spring melt cycle.
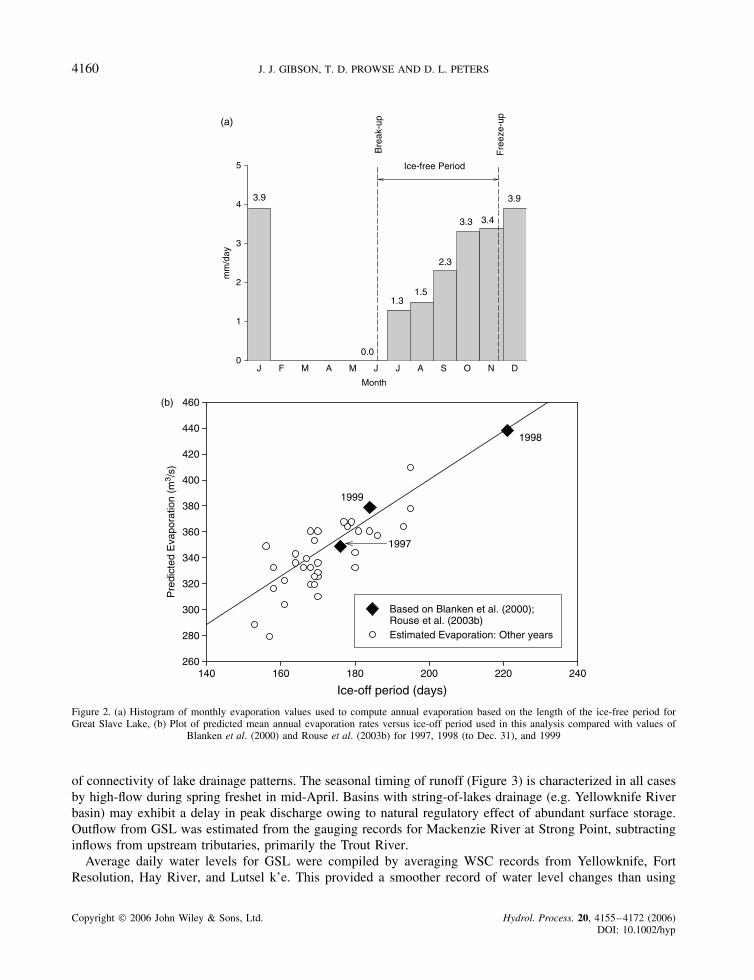
Lake evaporation. Lake evaporation for the entire ice-free periods of 1997 and 1998, the last two yearsof the water balance period used in this analysis, was taken directly from eddy covariance measurements byBlanken et al. (2000). They showed that evaporation of 386 š 127 mm measured for 1997 was significantlylower than the evaporation of 486 š 144 mm measured for 1998, (the latter also including 7 days measuredduring 1 January–7 January 1999) due to a protracted ice-free period that lasted until 12 December 1997 and8 January 1999, respectively. Blanken et al. (2000) also demonstrated that cumulative evaporation was similarin both years between mid-August and mid-November, and that higher totals for 1998–1999 were mainly dueto a protracted ice-free season associated with the 1997–1998 El Nino. Rouse et al. (2003b) concluded thatthe date of ice break-up in June exerts the main control on the final freeze-up date and thereby the annualevaporation total because heat storage during this high-sun season drives latent and sensible heat fluxes intothe late fall and early winter.
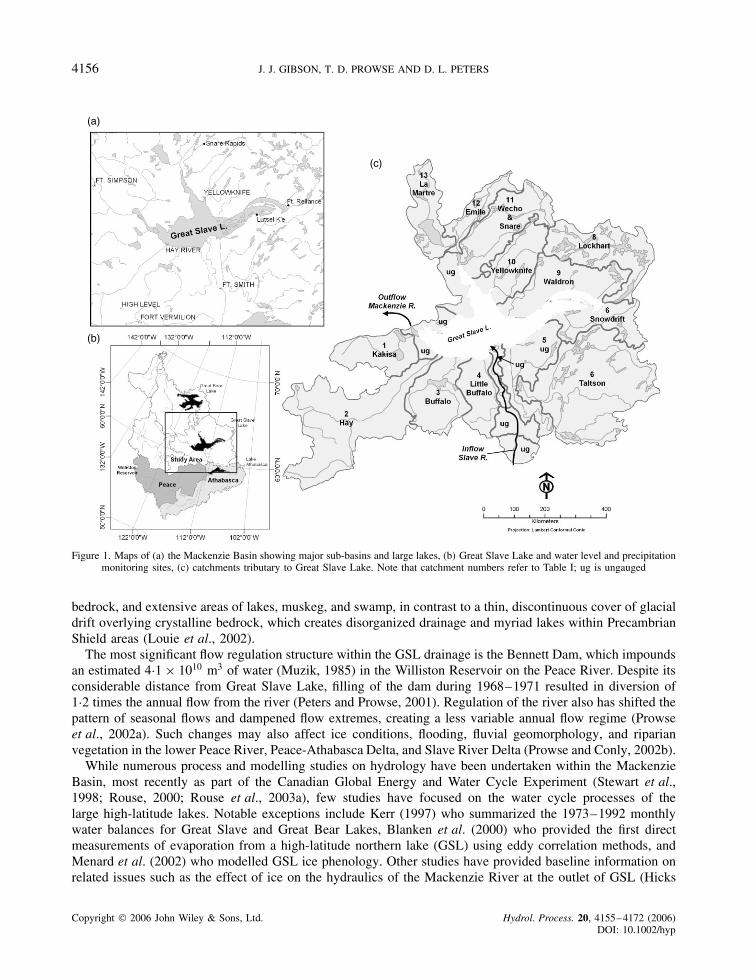
Since evaporation estimates were not available for 1964–1996, an evaporation algorithm was developedto account for variations in annual evaporation that would have occurred owing to variations in the ice-freeperiod, assuming similar monthly evaporation rates in each year, as noted by Blanken et al. (2000). For thecalculations, ice-free period was characterized from historical records of freeze-up and break-up dates thatwere measured on Back Bay near Yellowknife (Lenormand et al., 2002) and adjusted to match the systematicoffset noted between the Back Bay record and whole lake estimates predicted using SSM/I 85 GHz passivemicrowave imagery (Figure 11 in Menard et al., 2002). The algorithm integrates an evaporation functionbased on monthly values estimated by Blanken et al. (2000), combined with knowledge of the shifting ice-free period, to estimate the annual evaporation (Figure 2(a)). The reconstructed estimates of evaporation forthe 1964–96 period, which are predictably correlated with the ice-free period (Figure 2(b)), are found torange from 275 to 410 mm yr�1 with a mean of 336 mm yr�1. E/P ratios are also within a reasonable rangeof 0Ð96–1Ð86 with a mean of 1Ð5, and broadly consistent with available annual estimates computed from theHydrological Atlas of Canada (see Figure 1Ð10 in Gibson, 1996; see also plates 3 and 17 in denHartog andFerguson, 1978). Evaporation measured in 1999 by Rouse et al. (2003b), a follow-on to the study of Blankenet al. (2000), is also shown for comparison.
Riverine inflows and lake levels
Riverine inflows were taken from HYDAT (Environment Canada, 2001) for WSC gauging stations on adaily basis. On average, 86% of the contributing area was gauged during 1964–1998, which is considerablybetter than for the lower Great Lakes of North America (¾35%). Estimates of flow for an additional 9% ofthe contributing areas/years were reconstructed with partial records, where available, through comparison withbasin hydrographs with similar observed hydrologic responses. Approximately 5% of the contributing area hadno representative gauging records, and these areas were assigned values from basins with similar morphology.A summary of riverine inflows (Table II) emphasizes the dominance of the Slave River inflows derived fromthe Peace-Athabasca basins, both in terms of volumetric inflows and higher mm yr�1 runoff from these moresoutherly basins with headwaters in the Rocky Mountains. Average runoff from Shield basins (i.e. Taltson,Lockhart, Waldron, Yellowknife, Emile, Wecho and Snare) ranges from about 51 to 157 mm yr�1 and tendsto be higher, in general, than runoff from basins situated on interior plains areas (i.e. Kakisa, Hay, Buffalo,Little Buffalo, La Martre), which ranges from 27 to 83 mm yr�1. Runoff variability among the sub-basinsreflects the basin gradient and roughness, fraction of lake cover, evaporation-transpiration losses, and degree
Copyright 2006 John Wiley & Sons, Ltd. Hydrol. Process. 20, 4155–4172 (2006)DOI: 10.1002/hyp
4160 J. J. GIBSON, T. D. PROWSE AND D. L. PETERS
Month
J J JF M MA A S O N D
mm
/day
0
1
2
3
4
5
3.9
1.5
2.3
3.3 3.4
3.9
1.3
Ice-free Period
Fre
eze-
up
Bre
ak-u
p
0.0
Ice-off period (days)140 160 180 200 220 240
Pre
dict
ed E
vapo
ratio
n (m
3 /s)
260
280
300
320
340
360
380
400
420
440
460
Based on Blanken et al. (2000);Rouse et al. (2003b)Estimated Evaporation: Other years
1998
1997
1999
(a)
(b)
Figure 2. (a) Histogram of monthly evaporation values used to compute annual evaporation based on the length of the ice-free period forGreat Slave Lake, (b) Plot of predicted mean annual evaporation rates versus ice-off period used in this analysis compared with values of
Blanken et al. (2000) and Rouse et al. (2003b) for 1997, 1998 (to Dec. 31), and 1999
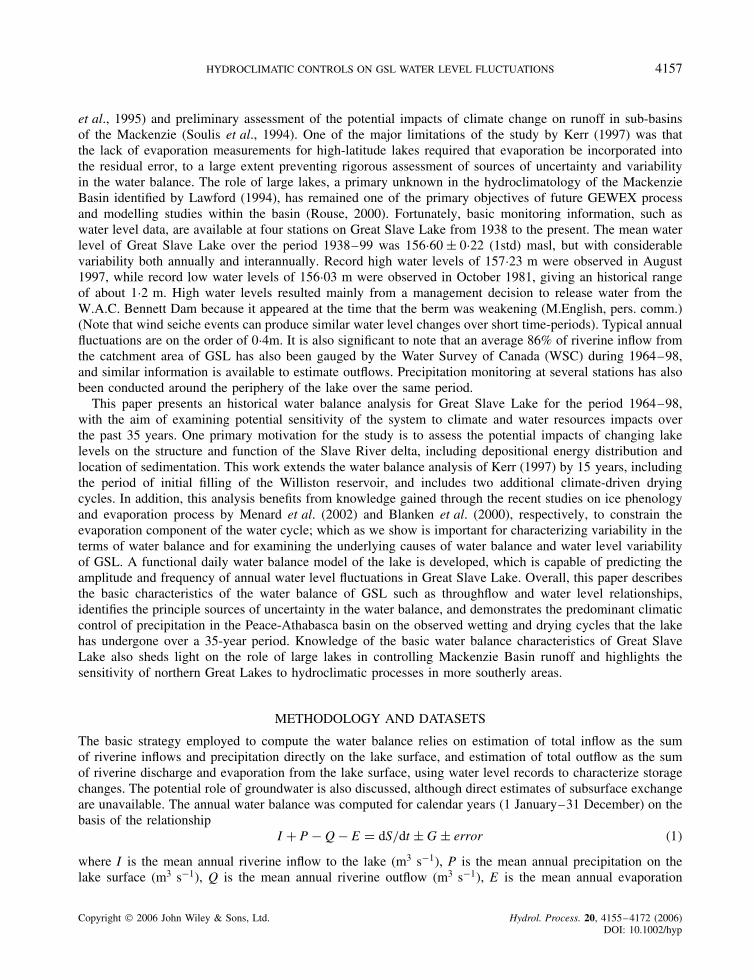
of connectivity of lake drainage patterns. The seasonal timing of runoff (Figure 3) is characterized in all casesby high-flow during spring freshet in mid-April. Basins with string-of-lakes drainage (e.g. Yellowknife Riverbasin) may exhibit a delay in peak discharge owing to natural regulatory effect of abundant surface storage.Outflow from GSL was estimated from the gauging records for Mackenzie River at Strong Point, subtractinginflows from upstream tributaries, primarily the Trout River.
Average daily water levels for GSL were compiled by averaging WSC records from Yellowknife, FortResolution, Hay River, and Lutsel k’e. This provided a smoother record of water level changes than using
Copyright 2006 John Wiley & Sons, Ltd. Hydrol. Process. 20, 4155–4172 (2006)DOI: 10.1002/hyp

HYDROCLIMATIC CONTROLS ON GSL WATER LEVEL FLUCTUATIONS 4161
Tabl
eII
.A
nnua
lw
ater
bala
nce
sum
mar
y,19
64–
98
Yea
rB
reak
-up
Dat
eFr
eeze
-up
Dat
eIc
e-fr
eeSe
ason
days
Inflo
wm
3s�1
Out
flow
m3
s�1E
vapo
ratio
nm
3s�1
Pre
cipi
tati
onm
3s�1
Tota
lE
rror
m3
s�1
Lak
est
orag
ech
ange
m3
s�1
Wl
chan
gem
Avg
Wat
erle
vel
m
E/P
m3
m�3
E/I
m3
m�3
Slav
eR
.In
flow
Frac
tion
m3
m�3
Are
alFr
acti
onG
auge
d
1964
6/22
12/8
169
5280
5430
354
193
307
�5�0
Ð005
156Ð8
11Ð8
10Ð0
60Ð7
10Ð8
419
656/
1311
/28
168
4932
5039
319
218
158
�70
�0Ð07
715
6Ð77
1Ð45
0Ð06
0Ð77
0Ð84
1966
6/23
12/1
017
048
0448
2136
124
217
834
0Ð037
156Ð6
91Ð4
70Ð0
70Ð7
30Ð8
419
676/
2512
/10
168
4641
4768
361
222
158
�93
�0Ð10
315
6Ð69
1Ð61
0Ð07
0Ð71
0Ð84
1968
6/16
12/1
117
835
5737
5136
423
111
7�1
91�0
Ð211
156Ð5
71Ð5
60Ð1
00Ð6
30Ð8
419
696/
1711
/20
156
3564
3512
349
191
86�3
0�0
Ð033
156Ð4
31Ð5
20Ð0
80Ð6
40Ð8
319
706/
812
/518
033
5635
3234
419
431
224
0Ð026
156Ð3
61Ð7
50Ð0
90Ð7
10Ð8
619
716/
1811
/18
153
3675
3598
288
188
48�1
0�0
Ð012
156Ð5
11Ð5
20Ð0
80Ð7
60Ð8
619
726/
612
/918
643
3637
7935
722
2�2
3018
90Ð2
0915
6Ð60
1Ð59
0Ð09
0Ð76
0Ð86
1973
6/11
11/1
515
748
7645
8427
929
2�2
8870
0Ð077
156Ð6
80Ð9
40Ð0
60Ð7
20Ð8
619
746/
512
/218
056
2647
6533
230
1�6
0218
70Ð2
0615
6Ð79
1Ð09
0Ð07
0Ð70
0Ð86
1975
6/1
12/1
119
347
8545
9236
421
7�1
77�1
44�0
Ð159
156Ð7
51Ð6
60Ð0
80Ð5
70Ð8
619
766/
912
/10
184
4925
4824
361
208
30�1
2�0
Ð014
156Ð7
41Ð7
10Ð0
70Ð7
40Ð8
919
776/
1311
/30
170
4851
4413
325
186
�247
470Ð0
5215
6Ð71
1Ð73
0Ð07
0Ð75
0Ð87
1978
6/24
12/5
164
4139
3889
343
210
�252
�141
�0Ð15
615
6Ð64
1Ð62
0Ð09
0Ð77
0Ð87
1979
6/3
12/1
519
544
1243
4537
820
149
�48
�0Ð05
315
6Ð69
1Ð86
0Ð08
0Ð77
0Ð88
1980
6/8
11/2
517
031
9033
2931
020
914
5�1
06�0
Ð117
156Ð4
31Ð4
70Ð0
90Ð8
30Ð8
819
816/
2212
/316
433
5433
7833
618
913
1�4
0�0
Ð044
156Ð4
31Ð7
60Ð1
00Ð7
30Ð8
819
826/
2712
/215
838
6038
9433
220
532
816
80Ð1
8615
6Ð49
1Ð60
0Ð08
0Ð68
0Ð88
1983
6/12
11/2
816
940
0343
0831
923
145
249
0Ð054
156Ð5
61Ð3
60Ð0
70Ð6
90Ð8
819
846/
2211
/27
158
4395
3963
316
270
�198
197
0Ð217
156Ð6
61Ð1
60Ð0
70Ð6
50Ð8
819
856/
2012
/416
746
2347
7533
922
515
3�1
19�0
Ð132
156Ð7
31Ð4
90Ð0
70Ð6
20Ð8
819
866/
1212
/10
181
4245
4273
361
212
64�1
02�0
Ð113
156Ð7
11Ð6
80Ð0
80Ð6
40Ð8
819
876/
2111
/29
161
4579
4209
322
236
�330
10Ð0
0115
6Ð62
1Ð35
0Ð07
0Ð73
0Ð90
1988
6/16
12/3
170
5031
4478
336
318
�322
172
0Ð190
156Ð7
31Ð0
40Ð0
70Ð5
50Ð9
019
896/
1412
/117
045
0145
2132
919
777
�71
�0Ð07
915
6Ð77
1Ð64
0Ð07
0Ð70
0Ð90
1990
6/15
11/2
316
143
5845
9430
428
023
3�1
9�0
Ð022
156Ð7
01Ð0
70Ð0
70Ð7
50Ð8
919
916/
1812
/12
177
4706
4960
368
287
438
850Ð0
9415
6Ð75
1Ð27
0Ð07
0Ð58
0Ð85
1992
6/14
11/3
016
947
8252
5432
521
650
4�8
3�0
Ð092
156Ð7
81Ð4
90Ð0
60Ð6
20Ð8
519
936/
1212
/24
195
4064
4331
410
217
264
�202
�0Ð22
315
6Ð64
1Ð87
0Ð09
0Ð70
0Ð85
1994
6/16
12/1
217
940
8041
8836
822
427
715
0Ð016
156Ð6
11Ð6
30Ð0
80Ð8
00Ð8
519
956/
2012
/316
632
7831
1733
217
8�1
05�7
6�0
Ð084
156Ð4
01Ð8
40Ð1
00Ð7
80Ð8
419
966/
1712
/216
854
9348
0733
218
1�1
1542
40Ð4
6815
6Ð73
1Ð80
0Ð06
0Ð79
0Ð84
1997
6/19
12/1
217
661
2160
0336
834
131
130
0Ð144
156Ð9
40Ð9
60Ð0
50Ð7
60Ð8
419
985/
311/
722
146
9152
6543
836
612
9�5
07�0
Ð560
156Ð7
71Ð1
20Ð0
90Ð7
00Ð8
4m
ean
6/14
12/4
173
4432
4380
344
231
51�8
�0Ð00
915
6Ð65
1Ð50
0Ð08
0Ð71
0Ð86
1st
d7
1014
690
654
3147
253
156
0Ð172
0Ð13
0Ð27
0Ð01
0Ð07
0Ð02
Copyright 2006 John Wiley & Sons, Ltd. Hydrol. Process. 20, 4155–4172 (2006)DOI: 10.1002/hyp

4162 J. J. GIBSON, T. D. PROWSE AND D. L. PETERS
mea
n di
scha
rge
(m3 /
s)
0.01
0.1
1
10
100
1000
10000
Slave R.
Yellowknife R.
Snowdrift R.
Little Buffalo R.
Hay R.
Buffalo R.
MJ F A M J J A S O N D
Figure 3. Average hydrographs
a single station alone and served to filter the effect of wind seiche events, which are common on the lake(Sortland, 1994; Gardner et al., 2006). Water level records were used to calibrate the water balance model asdescribed in the following section. The study area, watershed boundaries, and key hydrometric stations areshown in Figure 1.
RESULTS AND DISCUSSION
Model calibration
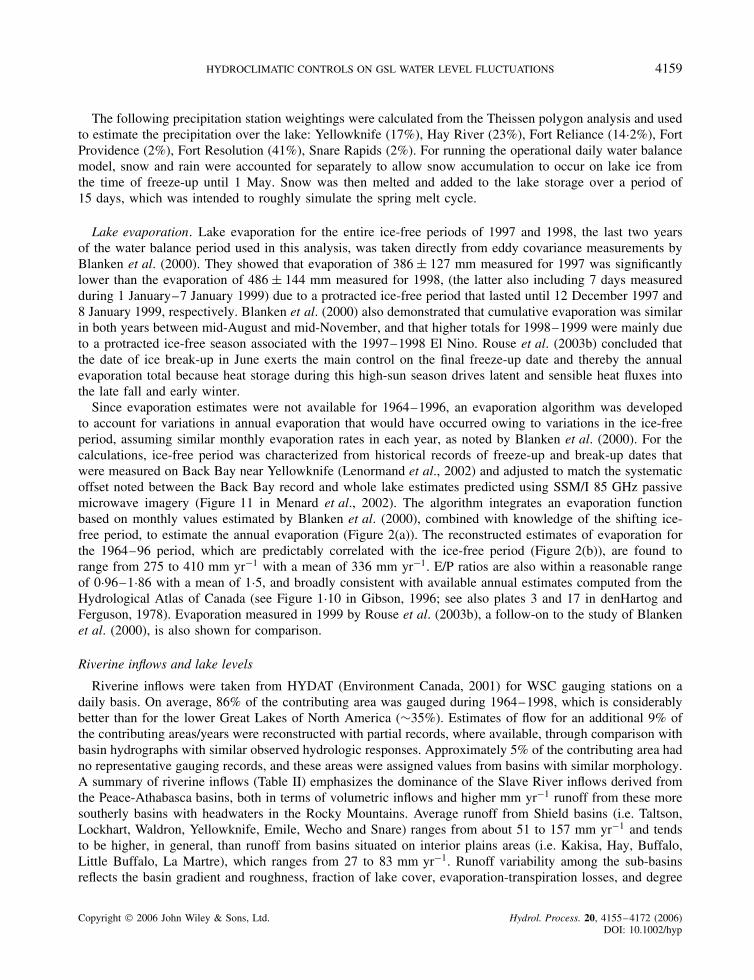
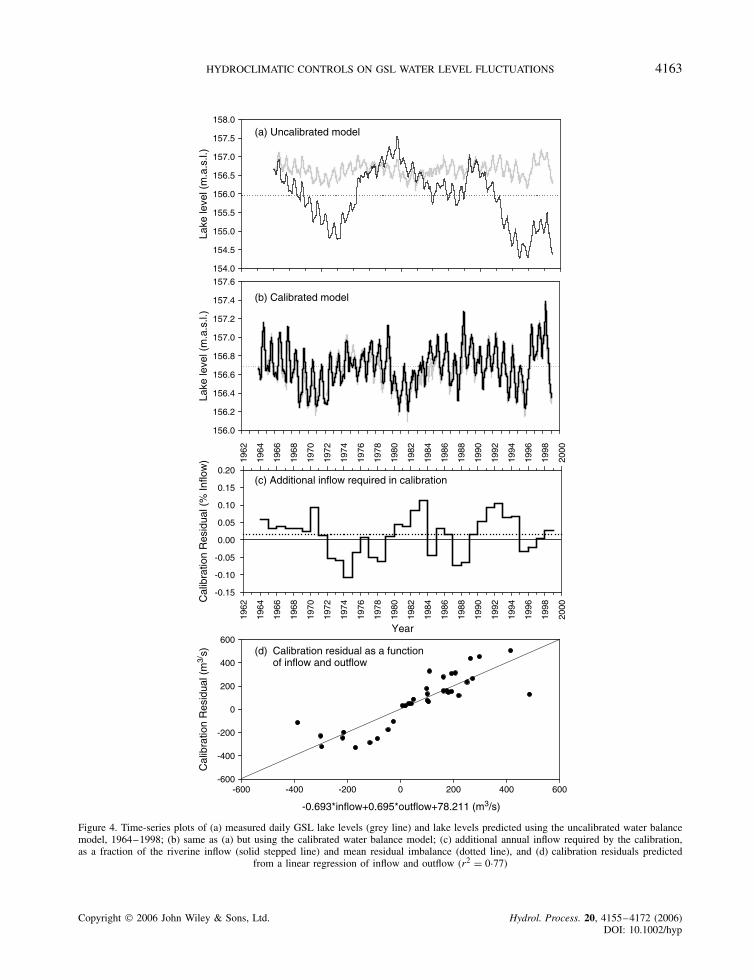
An operational water balance model based on the datasets described earlier was run on a daily time-step, andaveraged to obtain annual and long-term estimates of the water budget components of GSL (Tables II and III).Although seasonal fluctuations in GSL water levels were reasonably replicated using an uncalibrated waterbalance model, which initially confirmed the dominant control of water balance on lake levels, exaggeratedmulti-year drift and an overall decline in water levels were predicted by the uncalibrated model (Figure 4(a)).Drift in the lake level predictions is attributable to accumulation of very minor imbalances in the year-to-yearinputs and outputs, while long-term decline reflects minor, systematic under-estimation of inputs or over-estimation of outputs to the system. While errors in precipitation and evaporation undoubtedly contribute tothe underlying annual and interannual imbalances, the magnitude of the disparities is found to frequentlyexceed the total estimated evaporation and/or precipitation. Suggested upward adjustments to precipitation forstations in northern Canada (e.g. Metcalfe et al., 1999) were tested and were able to resolve the predicted long-term decline in water levels, but they do not correct for the multi-year (bi-directional) drift (see Figure 4(a)).The dominance of riverine inflow and outflow in the water balance, and the magnitude and bi-directional
Copyright 2006 John Wiley & Sons, Ltd. Hydrol. Process. 20, 4155–4172 (2006)DOI: 10.1002/hyp
HYDROCLIMATIC CONTROLS ON GSL WATER LEVEL FLUCTUATIONS 4163
-0.693*inflow+0.695*outflow+78.211 (m3/s)
-600 -400 -200 0 200 400 600
Cal
ibra
tion
Res
idua
l (m
3/s)
-600
-400
-200
0
200
400
600Year
1962
1964
1966
1968
1970
1972
1974
1976
1978
1980
1982
1984
1986
1988
1990
1992
1994
1996
1998
2000
1962
1964
1966
1968
1970
1972
1974
1976
1978
1980
1982
1984
1986
1988
1990
1992
1994
1996
1998
2000
Cal
ibra
tion
Res
idua
l (%
Inflo
w)
-0.15
-0.10
-0.05
0.00
0.05
0.10
0.15
0.20
Lake
leve
l (m
.a.s
.l.)
156.0
156.2
156.4
156.6
156.8
157.0
157.2
157.4
157.6
Lake
leve
l (m
.a.s
.l.)
154.0
154.5
155.0
155.5
156.0
156.5
157.0
157.5
158.0
(a) Uncalibrated model
(b) Calibrated model
(c) Additional inflow required in calibration
Calibration residual as a functionof inflow and outflow
(d)
Figure 4. Time-series plots of (a) measured daily GSL lake levels (grey line) and lake levels predicted using the uncalibrated water balancemodel, 1964–1998; (b) same as (a) but using the calibrated water balance model; (c) additional annual inflow required by the calibration,as a fraction of the riverine inflow (solid stepped line) and mean residual imbalance (dotted line), and (d) calibration residuals predicted
from a linear regression of inflow and outflow (r2 D 0Ð77)
Copyright 2006 John Wiley & Sons, Ltd. Hydrol. Process. 20, 4155–4172 (2006)DOI: 10.1002/hyp

4164 J. J. GIBSON, T. D. PROWSE AND D. L. PETERS
nature of the annual imbalances (up to š11%) suggest that discharge estimates/measurements may be themain source of uncertainty. The observed imbalances are expected, considering that portions of the basin areungauged, and the uncertainty associated with stream gauging at well-maintained stations typically ranges fromš5% for direct measurements using current meters to š10% for indirect measurements using rating curves(Tillery et al., 2001), with higher potential errors noted under ice conditions (Pelletier, 1990). To maintain abest-fit to the composite water level record for GSL on an interannual basis (Figure 4(b)), it was necessaryto calibrate the model for individual years by scaling the inflows by approximately š10% (Figure 4(c)).Although similar closure could justifiably be achieved by scaling the outflows or using a combination ofboth approaches, inflow was selected for the calibration as it was considered to be the largest source ofuncertainty owing to assumptions inherent in the process of upscaling to representative catchments, and inparticular, assignment of proxy runoffs for ungauged basins (see Table IV). As noted previously, ungaugedareas accounted for an average of 14% of the drainage area of GSL, varying between 10 and 16% dependingon which gauges were operating for individual years. Similar year-to-year scaling of precipitation and/orevaporation was not considered to be a justifiable approach because of their minor roles in the overall waterbalance (see Table III). Uncertainty in the composite water level record, conversion of water level changesto volumetric equivalents, and groundwater exchange are acknowledged as potential contributory factors, butlikely account for a small portion of the overall imbalance. Total inputs (riverine inflow + precipitation) inexcess of 2% of the total outputs (riverine outflow + evaporation) are required in the calibrated model toeliminate the long-term decline in the lake level trends for the 1964–1998 period (see Table III). Addition ofinflow to achieve the net calibration is considered reasonable as groundwater exchange would likely form apositive addition to the lake, given that it is situated in a regional topographic low. The apparent predictabilityof calibration residuals on an annual basis from a multi-linear regression of inflow and outflow (Figure 4(c))substantiates the conclusion that these imbalances arise mainly from uncertainty in the inflow/outflow gaugingrecords from year to year (r2 D 0Ð77). Overall, the calibrated daily model establishes an operational closure ofthe water budget to within š10%, which is useful for predicting GSL water levels on a seasonal to interannualbasis for the 1964–1998 period. It should be noted that the robustness of the calibrated model in predictingthe amplitude of seasonal lake level fluctuations is real, given that a common scaling factor (Figure 4(c))was applied uniformly to all daily inflows for each year. Of course, the degree of robustness in predictinginterannual variations in water balance is largely dependent on the inflow scaling factors. Nevertheless, thecalibrated model is shown herein to be a useful tool for investigating the sensitivity of the water balance tohydroclimatic forcings. The calibration exercise also plainly illustrates the inherent sensitivity of GSL waterlevels to small shifts in inflows and outflows. In the following sections, the mean water balance of the lake,and the seasonal and interannual relationships between water levels and water balance are examined anddiscussed in more detail using the calibrated water balance model.
Mean water balance
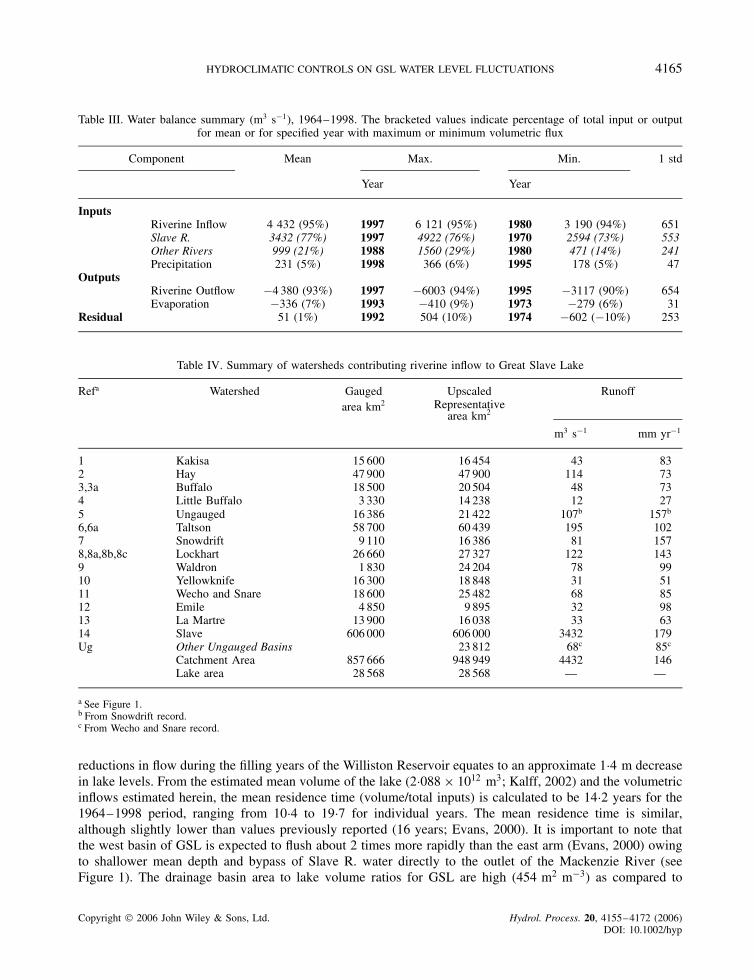
Long-term water balance of GSL, as summarized in Table III, is dominated by throughput of riverine waterentering via the Slave River and exiting via the Mackenzie River. Roughly 77% of the total inputs to the lakearise from the Peace-Athabasca drainage basin via the Slave River, while about 18 and 5% of input entersby other rivers and by precipitation on the lake surface, respectively. Among other river basins contributingto GSL, the Taltson (4%), Lockhart (3%), and Hay (2%) account for more than half of these inputs, whilenumerous smaller basins (Table IV) each contribute <2% to the long-term input. Output of water from GSL isdominated (93%) by outflow to the Mackenzie River, with a small fraction of water lost by evaporation (7%).As noted previously, modelled evaporation exceeds precipitation by approximately 50%, mean evaporationlosses (E/I) are close to 8%, and mean throughput (Q/I) is close to 92%.
The mean input of 1Ð47 ð 1011 m3 year�1 distributed across the lake area (2Ð856 ð 1010 m2) yields anestimate of the equivalent depth of inflow of 5Ð2 m year�1, about 4 m of which is derived from the Peace-Athabasca basins. Similar calculations for individual years range from about 3Ð8 to 7Ð1 m. For comparison,
Copyright 2006 John Wiley & Sons, Ltd. Hydrol. Process. 20, 4155–4172 (2006)DOI: 10.1002/hyp
HYDROCLIMATIC CONTROLS ON GSL WATER LEVEL FLUCTUATIONS 4165
Table III. Water balance summary (m3 s�1), 1964–1998. The bracketed values indicate percentage of total input or outputfor mean or for specified year with maximum or minimum volumetric flux
Component Mean Max. Min. 1 std
Year Year
InputsRiverine Inflow 4 432 (95%) 1997 6 121 (95%) 1980 3 190 (94%) 651Slave R. 3432 (77%) 1997 4922 (76%) 1970 2594 (73%) 553Other Rivers 999 (21%) 1988 1560 (29%) 1980 471 (14%) 241Precipitation 231 (5%) 1998 366 (6%) 1995 178 (5%) 47
OutputsRiverine Outflow �4 380 (93%) 1997 �6003 (94%) 1995 �3117 (90%) 654Evaporation �336 (7%) 1993 �410 (9%) 1973 �279 (6%) 31
Residual 51 (1%) 1992 504 (10%) 1974 �602 (�10%) 253
Table IV. Summary of watersheds contributing riverine inflow to Great Slave Lake
Refa Watershed Gaugedarea km2
UpscaledRepresentative
Runoff
area km2
m3 s�1 mm yr�1
1 Kakisa 15 600 16 454 43 832 Hay 47 900 47 900 114 733,3a Buffalo 18 500 20 504 48 734 Little Buffalo 3 330 14 238 12 275 Ungauged 16 386 21 422 107b 157b
6,6a Taltson 58 700 60 439 195 1027 Snowdrift 9 110 16 386 81 1578,8a,8b,8c Lockhart 26 660 27 327 122 1439 Waldron 1 830 24 204 78 9910 Yellowknife 16 300 18 848 31 5111 Wecho and Snare 18 600 25 482 68 8512 Emile 4 850 9 895 32 9813 La Martre 13 900 16 038 33 6314 Slave 606 000 606 000 3432 179Ug Other Ungauged Basins 23 812 68c 85c
Catchment Area 857 666 948 949 4432 146Lake area 28 568 28 568 — —
a See Figure 1.b From Snowdrift record.c From Wecho and Snare record.
reductions in flow during the filling years of the Williston Reservoir equates to an approximate 1Ð4 m decreasein lake levels. From the estimated mean volume of the lake (2Ð088 ð 1012 m3; Kalff, 2002) and the volumetricinflows estimated herein, the mean residence time (volume/total inputs) is calculated to be 14Ð2 years for the1964–1998 period, ranging from 10Ð4 to 19Ð7 for individual years. The mean residence time is similar,although slightly lower than values previously reported (16 years; Evans, 2000). It is important to note thatthe west basin of GSL is expected to flush about 2 times more rapidly than the east arm (Evans, 2000) owingto shallower mean depth and bypass of Slave R. water directly to the outlet of the Mackenzie River (seeFigure 1). The drainage basin area to lake volume ratios for GSL are high (454 m2 m�3) as compared to
Copyright 2006 John Wiley & Sons, Ltd. Hydrol. Process. 20, 4155–4172 (2006)DOI: 10.1002/hyp

4166 J. J. GIBSON, T. D. PROWSE AND D. L. PETERS
the Laurentian Great Lakes (34 m2 m�3), which explains the higher average rates of throughflow and 50%shorter average residence times for GSL. Note that mean residence times vary between 191 and 2Ð6 years forthe Laurentian Great Lakes, depending mainly on position in the drainage network. Average mean residencetimes of 30 years reflects an integrated estimate for all lakes.
Overall, the long-term water balance provides a view of the relative magnitude and importance of theriverine inflow and outflow components of the water balance, which are an order of magnitude larger thanthe estimated evaporation and on-lake precipitation (Table II). It is important to note these features whileconsidering the historical hydroclimatic forcings and regulatory impacts on the lake.
Seasonal and interannual variability
Good reproducibility of the amplitude and timing of seasonal water level fluctuations in most years between1964 and 1998 (Figure 4) suggests that the calibrated water balance model captures the dominant processescontrolling GSL lake levels. The seasonal cycle is largely a product of seasonality in the riverine inflows toGSL, predominantly via the Slave River. The most significant historical changes to the seasonal cycle of lakelevels occurred owing to regulation of the Peace River, which has effectively increased mean discharge fromthe Slave River during winter and reduced flows during the spring freshet and summer periods, apparentlyaffecting seasonal variations in lake levels in a similar way (Figure 5). Precisely defining the effect ofregulation on lake levels would require modelling of naturalized (without the effect of impoundment) flowsfor the post-regulation period; a topic beyond the scope of this investigation.
Typical interannual variations in water balance are described by standard deviations for the individual waterbalance terms calculated in Table III, which correspond to changes of š15% in total riverine inflows andoutflows, š20% in precipitation, and š10% for evaporation. Typical variability in the Slave River inflows
Jan Feb Mar Apr May Jun Jul Aug Sep Oct Nov Dec
Lake
leve
l (m
.a.s
.l.)
156.3
156.4
156.5
156.6
156.7
156.8
156.9
Pre-regulation (1938-67), Observed
Post-regulation (1972-96), Observed
Figure 5. Alteration in mean seasonal water level variations due to regulation, Great Slave Lake
Copyright 2006 John Wiley & Sons, Ltd. Hydrol. Process. 20, 4155–4172 (2006)DOI: 10.1002/hyp

HYDROCLIMATIC CONTROLS ON GSL WATER LEVEL FLUCTUATIONS 4167
(š16%) is reduced compared to other riverine inflows (š24%), reflecting persistence of discharge from Peace-Athabasca basin, and slightly higher variability in runoff from shield and wetland basins surrounding the lake.The fraction of riverine inflow derived from the Slave River, as shown in Table II, ranges from 57 to 83% inindividual years, averaging about 80%. Apart from a temporary decline in Slave River contributions during1968 and 1969, when significant Peace River discharge was abstracted to fill the Williston Reservoir, variationsin this proportion are predominantly influenced by hydroclimatic (precipitation and runoff) variability in thecontributing basins, as discussed later. Higher variability for shield basins, where string-of-lakes drainagesmay serve as sources or sinks of water in individual years, does not produce substantial variations in theannual water budget owing to the dominance and persistence of Slave River contributions. Note that thecomparatively low interannual variability in estimated evaporation rates may be an artifact of the ice-freeperiod algorithm used in the calculations. While the evaporation routine is a significant improvement overprevious studies, this is an indication of the need for further evaporation studies of the lake.
Evaporation/inflow ratios (E/I) are found to be strongly correlated with mean lake level (Figure 6), reflectingthe clear control of lake level on throughflow and hence discharge to the Mackenzie River. Year-to-yearvariations in E/I (Q/I) are restricted to a fairly narrow range, from approximately 6 to 10% (90 to 94%),which demonstrates that the lake has not experienced drying cycles severe enough to restrict outflows to theMackenzie River during the 1964–98 period, or is likely during the twentieth century. Future alterations ininflow due to climate or additional regulation could potentially lead to a more critical balance between inflowand outflow in the future, although the hydraulically controlled outlet is at approximately 153Ð5 masl (Hickset al., 1995), or 2Ð7 m below the historical low (Nov. 1980, 156Ð2 m), and the lake level has apparentlyremained stable to within 1Ð2 m during the last 70 years, including the period of filling of the WillistonReservoir and the historical low period in the mid-1940s. Approximately 4% of GSL water is held in hydraulicstorage (available for outflow) whereas 96% can be considered dead storage (below the current zero outflowthreshold), and yearly turnover is about 7%. Because GSL is a high throughflow system, the continuity of lakeoutflow in future will depend to a large extent on the changing climate conditions and on the voracity of waterabstraction in the contributing basins, particularly in the dominant source regions such as the Peace-Athabascabasin.
mean lake level (m)
156.3 156.4 156.5 156.6 156.7 156.8 156.9 157.0
evap
orat
ion/
inflo
w
0.04
0.05
0.06
0.07
0.08
0.09
0.10
0.11
r2=0.53
Figure 6. Plot of throughflow index (E/I) and water level relationships in Great Slave Lake. Correlation coefficient and 99% confidenceinterval for the linear regression is shown
Copyright 2006 John Wiley & Sons, Ltd. Hydrol. Process. 20, 4155–4172 (2006)DOI: 10.1002/hyp

4168 J. J. GIBSON, T. D. PROWSE AND D. L. PETERS
1965 1970 1975 1980 1985 1990 1995
Year
1965 1970 1975 1980 1985 1990 1995
Volumetricfluxes(m3/s)
2000
4000
6000
Yearly waterlevel change (m)
-0.5
0.0
0.5
Inflow + PrecipitationOutflow + EvaporationSlave R. inflowIncreasing/decreasing water levelshigh water level yearlow water level year
Damconstruction
W DD W DWD
Wetting (W)/Drying (D)
Cycles
Meanlakelevel(masl)
156.3156.4156.5156.6156.7156.8156.9157.0
Figure 7. Annual time-series illustrating years of increasing and decreasing GSL lake levels (shaded), and wetting and drying cycles (W/D)identified in the inputs (riverine inflow C precipitation), Slave River inflow, and outputs (riverine outflow C evaporation) from Great SlaveLake, 1964–1998. Years of high and low GSL lake levels, indicated with upward and downward triangles, tend to occur near the end of
wetting and drying cycles, respectively
Hydroclimatic controls on interannual wetting/drying cycles
Typical seasonal fluctuation in GSL water levels is close to 0Ð4 m. Three major interannual wetting (anddrying) cycles were also observed during the 1964–1998 period (Figure 7), marked by general increases(declines) in inputs (outputs) and related increases (declines) in GSL lake levels. Periods of wetting and drying,
Copyright 2006 John Wiley & Sons, Ltd. Hydrol. Process. 20, 4155–4172 (2006)DOI: 10.1002/hyp
HYDROCLIMATIC CONTROLS ON GSL WATER LEVEL FLUCTUATIONS 4169
as shown in Figure 7, are typically linked to cyclical variations in riverine inflow from the Slave River, whichstrongly controls the overall pattern of the total inputs and the resulting pattern of outputs via control of thelake stage. Minimum lake stages (Figure 7) were observed following periods of sustained drying (1980–1981,1995), and during the filling of the Williston Reservoir at the Bennett Dam (1968–1970). Maximum lakelevels were observed following periods of sustained wetting (1964, 1974, 1992, 1997). Interestingly, the mostrapid changes in lake level occurred during November 1995–August 1996, when lake levels rose by over1 m in response to wetter than normal climate conditions and additional water releases from the Willistonreservoir. Generally wet conditions and increasing water levels were also observed during much of the 1980s.The pattern that emerges from the time-series analysis is the overriding influence of the Slave River inflow,which is dependent on precipitation and runoff in the Peace-Athabasca Basin, on interannual variability inthe GSL water balance and in turn GSL water levels.
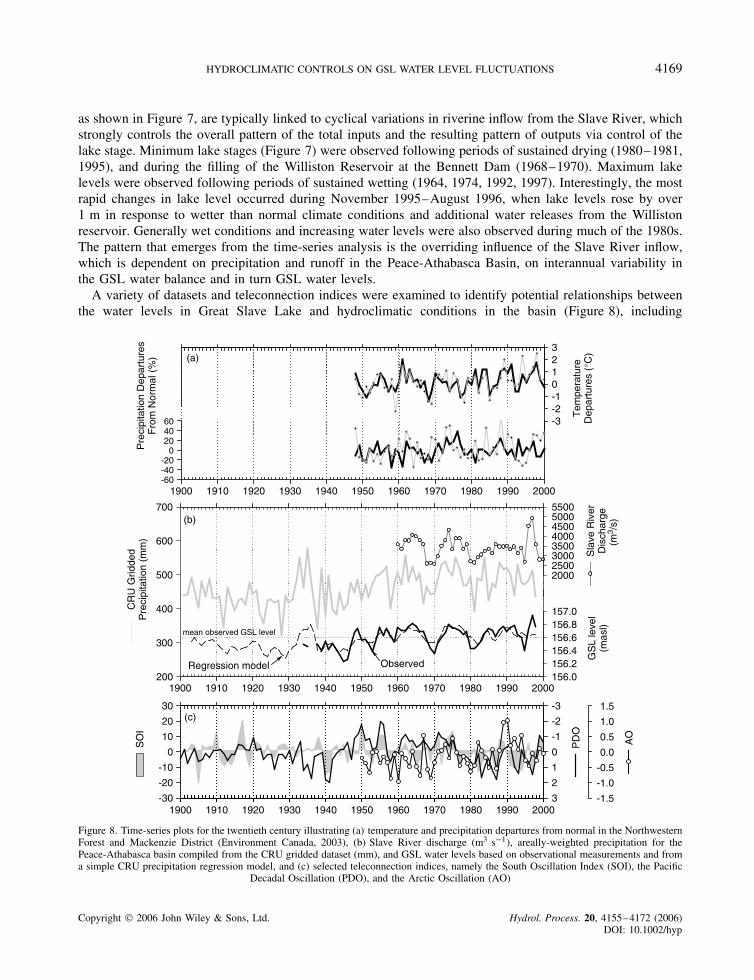
A variety of datasets and teleconnection indices were examined to identify potential relationships betweenthe water levels in Great Slave Lake and hydroclimatic conditions in the basin (Figure 8), including
Tem
pera
ture
Dep
artu
res
(°C
)
-3-2-10123
1900 1910 1920 1930 1940 1950 1960 1970 1980 1990 2000
CR
U G
ridde
dP
reci
pita
tion
(mm
)
200
300
400
500
600
700
Sla
ve R
iver
Dis
char
ge(m
3 /s)
20002500300035004000450050005500
GS
L le
vel
(mas
l)
156.0156.2156.4156.6156.8157.0
1900 1910 1920 1930 1940 1950 1960 1970 1980 1990 2000
Pre
cipi
tatio
n D
epar
ture
sF
rom
Nor
mal
(%
)
-60-40-20
0204060
1970 1990 2000
SO
I
-30
-20
-10
0
10
20
30
PD
O
-3
-2
-1
0
1
2
319601900 1910 1920 1930 1940 1950 1980
AO
-1.5
-1.0
-0.5
0.0
0.5
1.0
1.5
Regression model Observed
(a)
(b)
(c)
mean observed GSL level
Figure 8. Time-series plots for the twentieth century illustrating (a) temperature and precipitation departures from normal in the NorthwesternForest and Mackenzie District (Environment Canada, 2003), (b) Slave River discharge (m3 s�1), areally-weighted precipitation for thePeace-Athabasca basin compiled from the CRU gridded dataset (mm), and GSL water levels based on observational measurements and froma simple CRU precipitation regression model, and (c) selected teleconnection indices, namely the South Oscillation Index (SOI), the Pacific
Decadal Oscillation (PDO), and the Arctic Oscillation (AO)
Copyright 2006 John Wiley & Sons, Ltd. Hydrol. Process. 20, 4155–4172 (2006)DOI: 10.1002/hyp

4170 J. J. GIBSON, T. D. PROWSE AND D. L. PETERS
temperature and precipitation departures for the Northwestern Forest and Mackenzie Districts (EnvironmentCanada, 2003), Slave river runoff (Environment Canada, 2001), and CRU TS 2.0 gridded (0Ð5° ð 0Ð5°)observed precipitation for the Peace-Athabasca basins (Mitchell et al., 2004, see also Mitchell and Jones, 2005)(Northwestern Forest and Mackenzie District regions as defined by Environment Canada’s Climate Trends andVariations Bulletin, http://www.msc-smc.ec.gc.ca/ccrm/bulletin/). Correlation coefficients between the annualSlave River runoff and GSL water levels (1960–2002) are high (r2 D 0Ð76), although direct correlationbetween GSL water levels (rj) and areally-weighted annual precipitation (Pj) in the Peace-Athabasca basinis modest, largely due to a weaker relationship between basin precipitation and runoff (r2 D 0Ð16).
rj D 155Ð995 C 0Ð00128ŁPj r2 D 0Ð17
Precipitation/runoff relationships are complex within large systems, as in the Peace-Athabasca Basins(606 000 km2), where the runoff regime is strongly seasonal and includes a range of alpine to lowland sub-basins that individually respond to antecedent moisture conditions, a pronounced snowmelt cycle, summerrainfall events, and significant evapotranspirative losses during summer. Runoff ratios in sub-basins of thePeace-Athabasca basins are known to range from about 0Ð91 in alpine areas to 0Ð2 in lowland shield andwetland-dominated areas in the northeastern portions of the basin adjacent to lake Athabasca (Lawford,1994), and average 0Ð37 on the basis of the datasets presented herein. While mean monthly runoff andprecipitation are strongly correlated for the Peace-Athabasca basin (r2 D 0Ð78), annual runoff/precipitationratios vary considerably, from 0Ð29 to 0Ð5 for individual years during 1960–98, owing to antecedent moistureand other factors mentioned previously. Weaker direct correlations between precipitation and GSL water levelsare therefore expected.
A multi-linear regression analysis was also conducted using the gridded CRU TS 2Ð0 precipitation dataset forthe Peace-Athabasca basin, where GSL water level and precipitation relationships (1934–1935, 1938–1998)were interrogated using precipitation in the same year P and in the previous two years as shown below. Thisanalysis produced much higher correlations.
rj D 155Ð246 C �0Ð0011ŁPj� C �0Ð00175Ł�Pj�1� r2 D 0Ð48
rj D 155Ð068 C �0Ð000883ŁPj� C �0Ð00170Ł�Pj�1� C �0Ð000653Ł�Pj�2� r2 D 0Ð52
where rj and Pj are GSL lake level and annual precipitation in year j, Pj�1 being annual precipitation in theprevious year and Pj�2 being precipitation in the year before the previous year, suggests robust and predictableempirical relationships between precipitation and GSL water levels. Conceptually, this approach accounts forthe influence of antecedent moisture conditions and interannual storage of precipitation prior to runoff inthe Peace-Athabasca basins. Significant but slightly weaker correlations were found using the precipitationdepartures datasets (Figure 8(a)) as the regional datasets are not demarcated specifically for the contributingareas of Great Slave Lake. Comparison of several teleconnection indices with GSL water levels and alsowith precipitation revealed very poor correlations, in part due to the complexity and areal extent of the basin,and presumably due to hydrologic smoothing of the climatic signals over several years. The only significantcorrelation was found between the Arctic Oscillation Index and annual precipitation over the Peace-Athabascabasin (r2 D 0Ð11), although the correlation was not significantly improved by multi-linear regression usingseveral teleconnection indices or using the previous year approach described above. While there are no simplerelationships apparent between El Nino or other teleconnection cycles and water levels in Great Slave Lake,the predictability of water levels from multi-year precipitation in the Peace-Athabasca basin is encouraging,and warrants further analysis to dissect potential seasonal patterns. However, seasonality of lake levels, asshown in Figure 5, mirrors the seasonal shift in river flow that occurred after the Peace River was regulated,a factor that needs to be considered in any future analysis of water balance on a sub-annual time scale.
Forty-eight percent �138 km3� of the long-term annual discharge from the Mackenzie River to the ArcticOcean �290 km3 year�1� consists of outflow from Great Slave Lake, and a total of 57% originates from Great
Copyright 2006 John Wiley & Sons, Ltd. Hydrol. Process. 20, 4155–4172 (2006)DOI: 10.1002/hyp
HYDROCLIMATIC CONTROLS ON GSL WATER LEVEL FLUCTUATIONS 4171
Slave and Great Bear Lakes combined. While Great Bear Lake has significantly longer residence times andtherefore is expected to have a longer response time to precipitation variability in its contributing basin, GreatSlave Lake water levels are found to respond rapidly to changes in Slave River inflow, which appear to be theproduct of a 2–3 year dampening of upstream precipitation signals in the Peace-Athabasca basins. As a high(93%) throughflow system with a hydraulically controlled outlet, Great Slave Lake has limited hydrologicbuffering capacity, despite its mean residence time of 14Ð2 years. Nevertheless, the lake is expected to play amore dominant role in buffering biogeochemical parameters, which depend more strongly on residence time,and on sediment loading to the downstream reaches of the Mackenzie River and Arctic Ocean.
Concluding remarks
Evaporation remains a poorly known component of the water balance of Great Slave Lake; however, theobserved relationship between evaporation and ice-free period has been used in this analysis to constrainestimates and to allow a practical closure of the water balance for annual periods. Groundwater also remainsa principal unknown in the water budget, although its magnitude, as with evaporation, is expected to be asmall component of the overall water budget. Ongoing studies also include development of a naturalizedhistorical water budget of GSL for analyzing and partitioning the hydroclimatic and regulatory impacts onthe water level of GSL (see Gibson et al., 2006). This will expectedly improve upon the baseline hydrologicassessment of GSL on interannual and sub-annual time scales, and will provide a basis for evaluating potentialimpacts on the Slave River Delta. New efforts to monitor the stable isotope composition (18O and 2H) of GSLand the Mackenzie River system are also being undertaken to improve upon estimates of evaporation lossesand to constrain subsurface water exchanges. Combined, these efforts will contribute to a more quantitativeunderstanding of the role of large lakes on the Mackenzie River system, a major GEWEX study basin, aprimary freshwater source to the Arctic Ocean, and a potential factor driving North Atlantic thermohalinecirculation and global climate change.
ACKNOWLEDGEMENTS
The authors wish to thank T. Carter, R. MacKay, K. Eyvindson, and S. Livingston for assistance providedwith data processing and analysis. Thanks also to K. Bennett for GIS and mapping assistance. Financialsupport for this study was provided by a grant from the Northern Rivers Ecosystem Initiative of EnvironmentCanada. Insightful reviews by M. English and W. Rouse greatly contributed to improvement of an earlierversion of this manuscript.
REFERENCES
Blanken PD, Rouse WR, Cult AD, Spence C, Boudreau LD, Jasper JN, Kochubajda B, Schertzer WM, Marsh P, Verseghy D. 2000. Eddycovariance measurements of evaporation from Great Slave Lake, Northwest Territories, Canada. Water Resources Research 36(4):1069–1077.
denHartog G, Ferguson HL. 1978. Mean annual lake evaporation. Plate 17, Hydrological Atlas of Canada, Ottawa . Department of Fisheriesand Environment: Ottawa, Ontario, map.
Dingman SL. 2002. Physical Hydrology , 2nd edn. Prentice Hall: Upper Saddle River, New Jersey; 121.Environment Canada. 2001. HYDAT CD-ROM version 2Ð00 (January 24, 2001). Water and Sediment Data. Water Survey of Canada,
Environment Canada: Downsview, Ontario.Environment Canada. 2003. Climate Trends and Variations Bulletin. Ranked Regional Precipitation Departures Table, 1948–2003 . Meteo-
rological Service of Canada: Downsview, Ontario; http://www.msc.ec.gc.ca/ccrm/bulletin/regional e.cfm.Evans MS. 2000. The large lake ecosystems of northern Canada. Aquatic Health and Management 3: 65–79.Gardner JT, English MC, Prowse TD. 2006. Wind-forced seiche events on Great Slave Lake; hydrologic implications for the Slave River
Delta, NWT, Canada. Hydrological Processes 20(19): 4051–4072.Gibson JJ. 1996. Non-steady isotopic methods for estimating lake evaporation: development and validation in Arctic Canada. PhD thesis,
University of Waterloo: Waterloo, Canada; 238.Gibson JJ, Prowse TD, Peters DL. 2006. Partitioning impacts of climate and regulation on water level variability in Great Slave Lake.
Journal of Hydrology (in press).
Copyright 2006 John Wiley & Sons, Ltd. Hydrol. Process. 20, 4155–4172 (2006)DOI: 10.1002/hyp

4172 J. J. GIBSON, T. D. PROWSE AND D. L. PETERS
Hicks F, Chen X, Andres D. 1995. Effects of ice on the hydraulics of Mackenzie River at the outlet of Great Slave Lake, N.W.T.: a casestudy. Canadian Journal of Civil Engineering 22: 43–54.
Hutchinson GE. 1957. Geography, Physics, and Chemistry, A Treatise on Limnology , Vol. 1. Wiley: New York.Kalff J. 2002. Limnology: Inland Water Ecosystems Prentice-Hall . Upper Saddle River: New Jersey; 592.Kerr JA. 1997. Future water levels and flows for Great Slave and Great Bear Lakes, Mackenzie River, and Mackenzie Delta. In Mackenzie
Basin Impact Study, Final Report , Cohen SJ (eds). Atmospheric Environment Service, Environment Canada: Downsview; 73–91.Lawford RG. 1994. Knowns and Unknowns in the Hydroclimatology of the Mackenzie River Basin. Mackenzie Basin Impact Study, Interim
Report #2 . Environment Canada: Yellowknife; 173–196.Lenormand F, Duguay CR, Gauthier R. 2002. Development of a historical database for the study of climate change in Canada. Hydrological
Processes 16: 3707–3722.Louie PYT, Hogg WD, Mackay MD, Zhang X, Hopkinson RF. 2002. The water balance climatology of the Mackenzie Basin with reference
to the 1994/5 water year. Atmosphere-Ocean 40(2): 159–180.Menard P, Duguay CR, Flato GM, Rouse WR. 2002. Simulation of ice phenology on Great Slave Lake, Northwest Territories, Canada.
Hydrological Processes 16: 3691–3706.Metcalfe JR, Goodison BE. 1993. Correction of Canadian winter precipitation data. In Eighth Symposium on Meteorological Observations
and Instrumentation, Anaheim, California, 17–22 January 1993; 338–343.Metcalfe JR, Ishida S, Goodison BE. 1999. A Corrected Precipitation Archive for the Northwest Territories . Climate Research Branch,
Atmospheric Environment Service: Downsview, Ontario, Unpublished data available at the Mackenzie GEWEX Study Web Site at:http://www1.tor.ec.gc.ca/GEWEX/projects/precip corr/pcpncor.htm. (accessed on 15 May 1999).
Mitchell TD, Carter TR, Jones PD, Hulme M, New M. 2004. A comprehensive set of high-resolution grids of monthly climate forEurope and the globe: the observed record (1901–2000) and 16 scenarios (2001–2100). Tyndall Centre Working Paper 55; 30.http://www.cru.uea.ac.uk/.
Mitchell TD, Jones PD. 2005. An improved method of constructing a database of monthly climate observations and associated high-resolutiongrids. International Journal of Climatology 25: 693–712.
Muzik I. 1985. Recent hydrological changes of the Peace-Athabasca Delta. In Climate and Paleoclimate of Lakes, Rivers and Glaciers ,Muzik I, Kuhn M (eds). Universitatsverlag Wagner: Innsbruck; 175–182.
Pelletier PM. 1990. A review of techniques used by Canada and other northern countries for measurement and computation of streamflowunder ice conditions. Nordic Hydrology 21: 317–340.
Peters DL, Prowse TD. 2001. Regulation effects on the lower Peace River, Canada. Hydrological Processes 15: 3181–3194.Pomeroy JW, Marsh P, Gray DM. 1997. Application of a distributed blowing snow model to the Arctic. Hydrological Processes 11:
1451–1464.Prowse TD, Conly FM, Church M, English MC. 2002a. A review of hydroecological results of the Northern River Basins Study, Canada.
Part 1. Peace and Slave Rivers. River Research and Applications 18: 429–446.Prowse TD, Conly FM. 2002b. A review of hydroecological results of the Northern River Basins Study, Canada. Part 2. Peace–Athabasca
Delta. River Research and Applications 18: 447–460.Rouse WR. 2000. Progress in hydrological research in the Mackenzie GEWEX study, 2000. Hydrological Processes 14: 1667–1685.Rouse WR, Blyth EM, Crawford RW, Gyakum JR, Janowicz JR, Kochtubajda B, Leighton HG, Marsh P, Martz L, Pietroniro A, Ritchie H,
Schertzer WM, Soulis ED, Stewart RE, Strong GS, Woo MK. 2003a. Energy and water cycles in a high-latitude, north-flowing riversystem: summary of results from the Mackenzie GEWEX Study—Phase 1. Bulletin of the American Meteorological Society 84(1):73–87.
Rouse WR, Oswald CM, Binyamin J, Blanken PD, Schertzer WM, Spence C. 2003b. Interannual and seasonal variability of the surfaceenergy balance and temperature of central Great Slave Lake. Journal of Hydrometeorology 4(4): 720–730.
Sortland L. 1994. Wind/wave climatology of Great Slave Lake. Mackenzie Basin Impact Study, Interim Report #2 . Environment Canada:Yellowknife; 151–162.
Soulis ED, Solomon SI, Lee M, Kouwen N. 1994. Changes to the distribution of monthly and annual runoff in the Mackenzie Basinunder climate change using a modified square grid approach. Mackenzie Basin Impact Study, Interim Report #2 . Environment Canada:Yellowknife; 197–209.
Stewart RE, Leighton HG, Marsh P, Moore GWK, Rouse WR, Soulis ED, Strong GS, Crawford RW, Kochubajda B. 1998. The MackenzieGEWEX Study: the water and energy cycles of a major North American river basin. Bulletin of the American Meteorological Society 79:2665–2683.
Tillery AC, Phillips JV, Capesius JP. 2001. Potential errors associated with stage-discharge relations for selected streamflow-gaging stations,Maricopa County, Arizona, Water-Resources Investigations Report 00–4224, U.S. Geological Survey: Tuscon Arizona; 47.
Woo M-K, Heron R, Steer P. 1983. Comparison of weather station snowfall with winter snow accumulation in high Arctic basins.Atmosphere-Ocean 21(3): 312–325.
Copyright 2006 John Wiley & Sons, Ltd. Hydrol. Process. 20, 4155–4172 (2006)DOI: 10.1002/hyp