modelling the stress-strain ... - university of...
TRANSCRIPT

MODELLING THE STRESS-STRAIN BEHAVIOUR OF SATURATED
ROCKS UNDERGOING TRIAXIAL DEFORMATION USING COMPLEX
ELECTRICAL CONDUCTIVITY MEASUREMENTS
R W. J. G L O V E R 1 , J. B. G O M E Z 2, R G. M E R E D I T H 2, S. A. B O O N 2, E R. S A M M O N D S 2 and S. A. F. M U R R E L L 2
Ilnstitute of Fluid Sciences, Tohoku University, Sendai 980-77, Japan; 2Rock and Ice Physics Laboratory, Research School for Geological and Geophysical Sciences, University College London,
Gower Street, London, WC1E 6BT, U.K
Abstract. Measurement of complex electrical conductivity as a function of frequency is an extremely sensitive probe for changes in pore and crack volume, crack connectivity, and crack surface topogra- phy. Such measurements have been made as a function of pore fluid chemistry, hydrostatic confining pressure, as well as uniaxial and triaxial deformation. This paper will; (1) describe the effects of triax- ial deformation on the complex electrical conductivity of saturated porous rocks, (2) use the electrical data to model the mechanical stress-strain behaviour, and, (3) compare the modelled behaviour with the stress-strain behaviour measured during the deformation. Experimental conductivity data tracks how the rock undergoes compaction with progressive loss of crack volume, followed by dilatation due to new crack formation, growth of existing cracks, crack interlinkage, and finally failure, as axial strain is increased. We have used the complex electrical data to produce a direction-sensitive (anisotropic) crack damage parameter, and used it to calculate the effective Young's modulus by employing the models of Walsh and Bruner. Comparison of the synthetic stress-strain curves so produced, with the experimentally derived stress-strain curves shows good agreement, particularly for undrained tests. This modelling is an improvement on similar curves produced using isotropic crack damage parameters derived from acoustic emission data. The improvement is likely to be due to the directional sensitivity of the electrical conductivity measurement, and its ability to discriminate between the formation of isolated cracks, and those cracks that contribute to the inter-connected crack space i.e. those cracks upon which transport properties of the rock such as electrical conductivity, and mechanical properties depend most critically during triaxial deformation.
Key words: Complex electrical conductivity, Stress-strain modelling, Cracked solids, Triaxial defor- mation
1. Introduction
It is the challenge of transport property geoscientists to understand the effect of rock structure upon the transport of fluids, electrical current, and heat, through crustal rocks. These are important goals because the understanding of the composition, evolution, and dynamic processes occurring in the Earth's crust depend largely upon a good understanding of these basic transport processes. Indeed, they are central to many of the practical problems with environmental, commercial, social, and economic implications that we face today. For example, transport properties of saturated rocks are important in the efficient extraction of hydrocarbons, optimiza- tion of heat extraction from geothermal resources, safe design of repositories for
Surveys in Geophysics 17: 307-330, 1996.
308 p .w . J . GLOVER ET AL.
radioactive and chemically toxic wastes, and provision of water from underground water reservoirs.
Traditionally most effort has been given to understanding the effect of fluid flow through rocks. However, electrical methods are of growing importance as a way of investigating the interaction and migration of fluids through crustal rocks. Measurements of complex electrical conductivity as a function of frequency rep- resent an extremely sensitive probe for the change in pore and crack volume, crack connectivity, and crack surface topography. It is a very useful method for obtaining information about the structure of the rock under a wide range of environmental conditions.
One of the problems in the understanding of the flow of electrical currents through saturated rocks is the large number of rock properties that have the poten- tial to affect the measured electrical conductivity. We know the conductivity is affected by crack micro-structure parameterized by (i) total crack volume and size distribution, (ii) crack aspect ratio distribution, (iii) crack orientation distribution, and (iv) crack connectivity. It can also be affected by crack surface characteristics, such as (v) surface fractal dimension, (vi) crack surface area, and (vii) surface area connectivity. In the low temperature limit (0-250 ~ the electrical properties of electrolyte saturated rocks are dominated by the characteristics of the pore fluid; (viii) ionic concentration, (ix) ionic composition, and (x) pH. At higher tempera- tures the composition, properties, and relative abundances of mineral phases of the rock matrix become important as solid state conduction begins to be significant. Other researchers may include other parameters in this list, either in general, or for specific rock samples. What is more, each of these parameters will have dif- ferent contributions to the overall electrical properties of the rock depending upon the rock matrix, saturating fluid, and environmental conditions of temperature, confining pressure, deviatoric pressure, and pore-fluid pressure, and are further complicated by the natural anisotropy of most rock samples. The effect of each of these parameters will change during rock deformation, as cracks close, form, and propagate.
This, therefore, is the conundrum that electrical measurements on rocks offer: the interpretation of the conductivity in terms of physical parameters is complex, but this is also a measure of its great potential as a probe for elucidating a wide range of rock parameters.
It is important that we restrict our study to simplify the problem. Accordingly, the rest of this paper will deal with low temperatures, where all conduction occurs either through the pore fluid or along the surface of cracks and pores. We will also concentrate upon clean sandstones of high permeability. This allows us to ignore the complicating effect of clay minerals, and ensure that we can fully saturate our specimens reliably. Although measurements of complex electrical conductivity were also made as a function of frequency (20 Hz to 1 MHz) during each deformation test, only the variation at 1 kHz will be discussed. Unfortunately there is no space to include a discussion about how the electrical dispersions

MODELLING THE STRESS-STRAIN BEHAVIOUR OF SATURATED ROCKS 309
as a function of frequency, resulting from surface conduction, develop during deformation. The result of these restrictions allows us to study changes in the pore and crack micro-structure.
We have made complex electrical property measurements during triaxial defor- mation. Electrical properties at low frequencies (1 kHz), and low temperatures are controlled by conduction through the pore fluid, and the distribution of the pore and crack space. Consequently, these electrical properties are a function of the pore and crack micro-structure and the pore-fluid characteristics. Experimental data obtained during triaxial deformation tracks how the rock undergoes initial compaction and loss of crack volume, followed by dilation, due to new crack formation and growth of existing cracks, and eventually crack interlinkage, fracture localization and rock failure (Glover et al., 1994a). The in-phase component of conductivity at low fre- quencies monitors how crack volume changes perpendicular and along the axis of deformation, while the relative amounts of in-phase and out-of-phase current flow is a measure of the tortuosity of the pore and crack system.
We have related the change in new crack volume to micro-crack damage, and hence to the constitutive stress-strain behaviour describing the deformation history of the rock sample. To do this we have derived a direction-sensitive (anisotrop- ic) damage parameter in terms of mean new crack volume change, derived from electrical data. We then use the brittle damage models of Walsh (1965a; 1965b) and Bruner (1976) to derive stress-strain curves from the evolution of the damage parameter. These stress-strain curves can be compared with those measured during the deformation of rock sample. This approach is the same as that used by Sam- monds et al. (1994), but they used an isotropic damage parameter derived from AE data.
2. Experimental Procedures
2.1. SAMPLE MATERIAL
Darley Dale sandstone was used for all triaxial experiments. This is a well indurated feldspathic sandstone with a porosity in the range 16-28% and a high permeabil- ity. Measurements were performed on right cylinders with diameters of 40 ram, and length approximately 110 ram. Axial end surfaces were ground flat and par- allel. Each sample was saturated with initially pure deionized water that had been degassed by vacuum for 24 hours prior to use by using a vacuum technique.
2.2. TRIAXIAL DEFORMATION
Samples were sleeved with heat shrinkable polyolefin and placed in the pressure vessel/load frame assembly. A confining pressure of either 25 or 50 MPa was applied in stages, while monitoring changes in the complex electrical conductiv- ity from 20 Hz to 1 MHz. Triaxial deformation was started at a constant strain
310 P.W.J. GLOVER ET AL.
rate (1.6 • 10 -6 s -1 ) until failure occurred, during which the complex electrical conductivity was monitored.
Both drained and undrained tests were carried out. In the undrained tests, pore fluids were not allowed to drain freely during deformation, and the pore pressure was not monitored, leading to some uncertainty in the value of pore fluid pressure, and hence simple effective pressure during deformation. In the drained tests, the pore fluid was allowed to drain freely to atmospheric pressure, where it was col- lected in a glass measuring cylinder. The glass measuring cylinder was arranged on an electronic balance in such a way that the expelled/imbibed fluid volume could be measured gravimetrically. This volumetric information was used subsequently to calculate the value of the Archie exponent, ra, during deformation.
2.3. ELECTRICAL CONDUCTIVITY MEASUREMENT
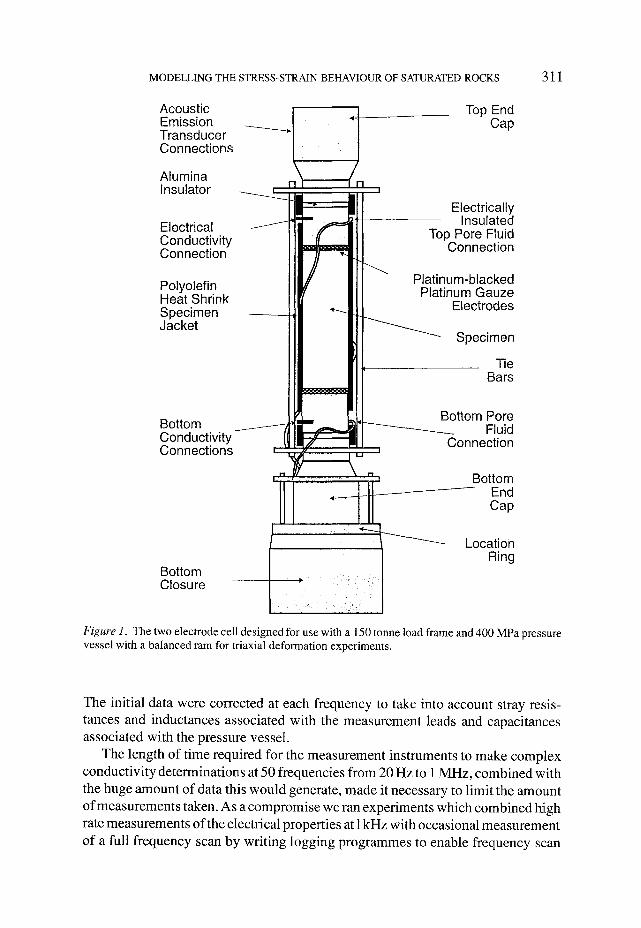
Complex electrical conductivity measurements have been made using a two elec- trode cell designed for use with a 150 tonne load frame and 400 MPa pressure vessel with a balanced ram for triaxial deformation experiments (Figure 1).
The electrodes were made from platinum-blacked platinum gauze (Glover et al., 1994b). In our previous work we employed four electrodes to reduce elec- trode polarization. We used two electrodes for uniaxial and triaxial deformation experiments because; (1) we found the use of well blacked platinum electrodes is sufficient to reduce electrode polarisation for frequencies greater than 20 Hz, (2) two electrodes are much easier to incorporate into a conductivity cell designed to apply axial stresses to the rock sample, and (3) we found the use of four elec- trodes gave large unwanted inductive coupling between the conductivity cell and the pressure vessel at high frequencies masking the true measurement signal.
The electrodes were attached to end pieces of hardened FV540 stainless steel which also contained fluid flow connections for making pore-fluid pressure, pore fluid volume, and permeability measurements. This block was isolated from the pressure vessel and load frame by plates of cold isostatically pressed pure recrys- tallised alumina from Degussa. Electrical leads were attached to the fluid flow and electrode block. All fluid flow lines were electrically isolated from the pressure ves- sel and load frame both inside and outside the vessel. These lines will be attached to a specially designed electrically insulating high volume high pressure separator, to allow fluid permeability measurements to be made using a double acting pore volumometer.
Complex conductivity measurements as a function of frequency, from 20 Hz to 1 MHz, were made using a HP 4284A impedance bridge which was controlled by computer. Software has been written to allow the computer to make lead cor- rections to the data, convert the physical measurements (complex conductances) into specific measurements (complex conductivity), and log the data. The software has the ability to display electrical data as in-phase and out-of-phase conductivity, resistivity, and permittivity as a function of frequency, or as Argand diagrams.
MODELLING THE STRESS-STRAIN BEHAVIOUR OF SATURATED ROCKS 311
Acoustic / Emission Transducer Connections
Alumina Insulator ~ _ ._,_=.
Electrical Conductivity Connection
Top End Cap
Electrically Insulated
Top Pore Fluid Connection
Polyolefin Heat Shrink Specimen Jacket
Platinum-blacked Platinum Gauze
Electrodes
Specimen
Tie Bars
Bottom _ _ - - ~ . a ~ ~J~--- - - - -~ Bottom Pore Fluid
Conductivity - ~ - Connection Connections r-
Bottom - End
Cap
Bottom Closure �84184184184 Location
Ring
Figure 1. The two electrode cell designed for use with a 150 tonne load frame and 400 MPa pressure vessel with a balanced ram for triaxial deformation experiments.
The initial data were corrected at each frequency to take into account stray resis- tances and inductances associated with the measurement leads and capacitances associated with the pressure vessel.
The length of time required for the measurement instruments to make complex conductivity determinations at 50 frequencies from 20 Hz to 1 MHz, combined with the huge amount of data this would generate, made it necessary to limit the amount of measurements taken. As a compromise we ran experiments which combined high rate measurements of the electrical properties at 1 kHz with occasional measurement of a full frequency scan by writing logging programmes to enable frequency scan

312 P.W.J. GLOVER ET AL.
measurements to be made as an interrupt in the background regular logging routine. This provided:
1. a complete set of complex resistivity, conductivity, and permittivity data for one frequency (1 kHz) every 15 seconds throughout the test.
2. a complete set of complex resistivity, conductivity, and permittivity data for 50 frequencies from 20 Hz to 1 MHz at ten to twenty points during the test. Only dataset 1 will be discussed in this paper.
The frequency used in the tests shown here was 1 kHz, and was chosen as the frequency at which the out-of-phase component of the electrical parameters was minimised, in order that the data would be a function of the pore and crack fluid vol- ume, with contributions from surface conduction and Maxwell-Wagner dispersion minimized.
3. Results and Discussion
Experiments were done to show the variation of the complex resistivity at 1 kHz for samples of Darley Dale sandstone saturated with initially pure water, together with the stress-strain behaviour. As already mentioned, the 1 kHz dataset is sensitive to changes in the pore and crack structure.
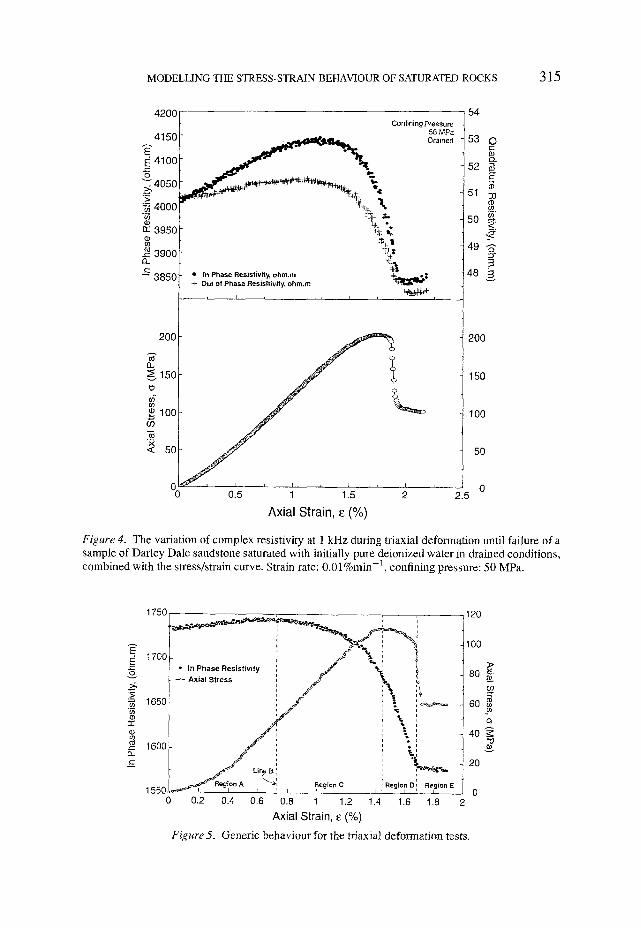
Figures 2-4 show the variation of the complex resistivity at 1 kHz for three samples of Darley Dale sandstone saturated with initially pure double distilled water as the samples were deformed axially until failure together with the stress- strain curve for each test. Figure 2 shows an undrained case in the presence of a 25 MPa hydrostatic confining pressure, Figure 3, an undrained case with a 50 MPa confining pressure, and Figure 4 a drained test with a 50 MPa confining pressure. The out-of-phase resistivity is much smaller because the frequency and salinities used in these tests minimizes it. The variation of the complex electrical behaviour has a generic behaviour which has been illustrated in Figure 5.
In the tow axial strain region (A, Figure 5) the primary process operating in the rock is compaction of pores and cracks. Pores and cracks that are most sensitive to closure are those with (i) low aspect ratios, and (ii) orientations perpendicular to the direction of principal stress. The relatively low levels of confining pressure result in the direction of principal stress being almost axial for the majority of the deformation. The dominating process, therefore, at low strains is the closure of cracks perpendicular to the direction of principal stress and the axis of the sample. Cracks with their long axis perpendicular to the sample axis are those that have least effect on the saturated rock electrical conductivity because they are perpendicular to the current flow and their loss provides little change in the tortuosity of the current flow paths. The effect of this closure is a small increase in the saturated rock electrical resistivity, as cracks perpendicular to the direction of current flow are subjected to volume loss and closure. The increase in resistivity
1750
100
1725
E E 1700
~;, 1675
�9 ~ 1650~
rr 1625
n x: 1600 _=
1575 �9 In P h a s e r e s i s t i v i t y �9 ~- Q u a d r a t u r e R e s i s t i v i t y " ~ l t t f l 4 -
I I I
" 8O
-g 60
40
2O
0 0.0
MODELLING THE STRESS-STRAIN BEHAVIOUR OF SATURATED ROCKS 313
0.5 1.0 1.5
Axial Strain, s (%)
22.0
10
21.5
21.0 m
_<. 20.5 .~
g 20.0 -~ g
100
80
60
40
20
0 2.0
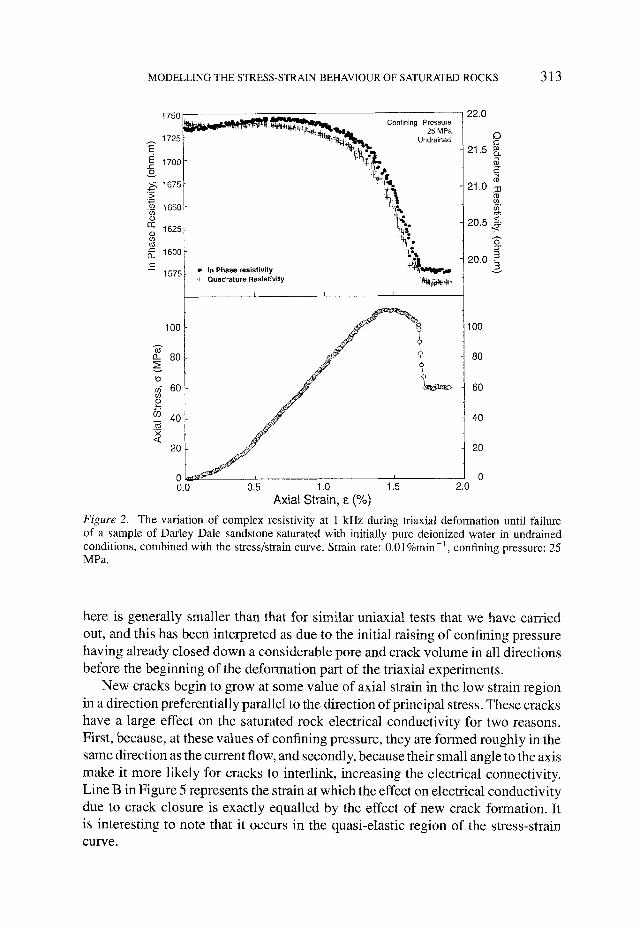
Figure 2. The variation of complex resistivity at 1 kHz during triaxial deformation until failure of a sample of Darley Dale sandstone saturated with initially pure deionized water in undrained conditions, combined with the stress/strain curve. Strain rate: 0.01%rain -1, confining pressure: 25 MPa.
here is generally smaller than that for similar uniaxial tests that we have carried out, and this has been interpreted as due to the initial raising of confining pressure having already closed down a considerable pore and crack volume in all directions before the beginning of the deformation part of the triaxial experiments.
New cracks begin to grow at some value of axial strain in the low strain region in a direction preferentially parallel to the direction of principal stress. These cracks have a large effect on the saturated rock electrical conductivity for two reasons. First, because, at these values of confining pressure, they are formed roughly in the same direction as the current flow, and secondly, because their small angle to the axis make it more likely for cracks to interlink, increasing the electrical connectivity. Line B in Figure 5 represents the strain at which the effect on electrical conductivity due to crack closure is exactly equalled by the effect of new crack formation. It is interesting to note that it occurs in the quasi-elastic region of the stress-strain curve.

314 P.w.J. GLOVER ET AL.
1420
1400
1380
O ~1360 >
1340
~ 1320
1300
~ 1280
140
120
o_ 100
80
~ 60 co �9 ~- 40
20
~ ~ , i . Cor, finingPressure 50 MPa
- r f ' ~ Undrained
!I .Ii ~
�9 In Phase resistivity ,~.~=~a=~'~ �9 . i ~ - - ~ ~ , , ~ ~ - -
+ Quadrnture Resmtwlty ~ J ~ ' " i I I
0 015 1 1.5 2.5
Axial Strain, e (%)
29.0 i
i28.5
128.0
27.5
27.0
26.5
140
120
s @ 2 @ 33
<
3
100
80
60
40
20
0
Figure 3. The variation of complex resistivity at 1 kHz during triaxial deformation until failure of a sample of Darley Dale sandstone saturated with initially pure deionized water in undrained conditions, combined with the stress/strain curve. Strain rate: 0.01%min -1, confining pressure: 50 MPa.
This demonstrates very well that it is naive to think of the straight line as representing elastic behaviour. It is important to recognise that it is rather due to the combined result of competing effects of the closure of a crack population perpendicular to the axis of deformation, and the concurrent growth and propagation of a population of cracks aligned at some angle to the axis of the deforming sample depending on the confining pressure.
For axial strains greater than this (region C), the effect of new cracks upon the electrical properties of the saturated rocks begins to dominate, producing an electrical resistivity maximum, which is followed by a sharp decrease in resistivity due to the combined effect of cracks growing in the same general direction as the current flow, and increasing connectivity as cracks interlink. It is interesting to note that this decrease in complex electrical resistivity occurs while the stress- strain relationship is still quasi-elastic, demonstrating both that there is new crack formation, with crack growth occurring at relatively low axial strains, and how
MODELLING THE STRESS-STRAIN BEHAVIOUR OF SATURATED ROCKS 315
4200 54
4150 E ~ 4100
"~4050 >
4000
3950
3900
- - 385(
20(
~15o
~ 100
< 50
Confining Pressure 50 MPa . . l l l ~ ~ ~ ~ Orained
�9 In Phase Resistivity, ohm.m + Out of Phase Reslsitivity, ohm.m ~ E'er=
, , , , , ~ ,
53 s c- O.
52 E
51 ~o
_. 50 <_.
4 9 ~" EY 3
48 g
200
150
100
50
~ 015 1 115 2 2.5 Axial Strain, ~ (%)
Figure 4. The variation of complex resistivity at 1 kHz during triaxial deformation until failure of a sample of Darley Dale sandstone saturated with initially pure deionized water in drained conditions, combined with the stress/strain curve. Strain rate: 0.01%min -1, confining pressure: 50 MPa.
1750
t7oc
"N
N 1650
g~
~ 1coo
1550,
/ , , s ~ In Phase Resistivity A x i a l S t r e s u ~ " r ~
o.A .,ooB, , .og,ono, .e,o~,o i .~ I
0.2 0.4 0.6 0.8 1 1.2 1.4 1.6 1.8
Axial Strain, ~ (%)
Figure5. Generic behaviour for the triaxia] deformation tests.
i 120
100
8O
60
40
2O
0
E
r
E -0

316 p.w.J. GLOVER ET AL.
electrical conductivity measurements are very sensitive to measurement direction. As axial strain increases further, cracks continue to form and propagate, leading to a decrease in the stress increment needed to cause axial deformation.
In region D crack linking becomes commonplace, dramatically reducing the tortuosity of current flow and hence electrical resistivity, which continues until failure. Dynamic rock failure occurred by fracture localization when sufficient cracks join up along a plane intersecting the sample. Failures took the classic form of one or more diagonal fractures crossing each other. The stress dropped to a lower level representing that needed to cause deformation by frictional sliding along the fractures. There is a discontinuous jump in electrical resistivity at this point. It is possible that this sudden unexpected jump is due to the failure of the procedure that uses measurements of axial strain to calculate complex resistivity from the measured complex resistance across the sample. It is important to note that there is no large decrease in resistivity at failure. This might have been expected for experiments on low porosity saturated crystalline rock samples. It may not occur here because the conduction through the pore structure of the rock between the major cracks remains high throughout the deformation. The process of deformation occurring during these experiments is the progressive growth of cracks with high individual electrical conductivity, in an already high conductivity matrix of porous rock. In this scenario, the formation of cracks decreases the electrical conductivity, but good connectivity through the pores of the rock, leads to good conductivity between individual cracks, which ensures that increased conductivity of the whole rock is observed throughout the process of deformation rather than all at once when the cracks link up at failure.
The complex electrical resistivity is constant post-failure. It would be expected that the resistivity would decrease further as deformation opens axial failure paths further. It is likely that the limit to the electrical resistivity is the result of having a limited amount of fluid capable of occupying these cracks in the undrained tests.
4. Mechanical Modelling from Crack Damage Parameters
In the following section we will use the symbol a to represent axial stress, and E to represent axial strain. In order not to confuse stress and conductivity in the equations we will use 2 to represent conductivity rather than its more usual symbol (~).
4.1. THE PHYSICAL BASIS OF MECHANICAL MODELLING
We will follow the procedure described by Cox and Meredith (1993), and Sam- monds et al. (1994) to relate the microcrack damage parameter derived from the complex electrical conductivity measurements to the constitutive stress-strain behaviour of triaxially deformed rocks. The fact that they use acoustic emission

MODELLING THE STRESS-STRAIN BEHAVIOUR OF SATURATED ROCKS 317
data to produce a crack damage parameter and we use a conductivity-derived dam- age parameter introduces some minor but important differences. In our case, it is necessary to deduce the crack damage parameter from the electrical properties of the rock. We choose data at low frequency (1 kHz) from rocks saturated with distilled water. This ensures that changes in the electrical parameters are sensitive only to changes in the pore and crack structure, and the pore fluid characteristics, without significant contributions from surface conduction.
We can conveniently summarize the procedure to invert tlhe stress-strain charac- teristics in the following three points: (1) Definition of a damage parameter based on conductivity data, (2) Use of the damage parameter as input to a model of the effective elastic moduli of cracked solids, and (3) Reconstruction of the stress-strain characteristics and comparison with the experimental curves. Cox and Meredith (1993) needed an additional fitting procedure to compute the free parameters in their model; this is not the case here, because the conductivity-derived damage parameter does not introduce lumped parameters to the inversion scheme.
The modelling strategy computes the normalized effective Young's modulus, (E~/E), as a function of the damage parameter, X- To compare these values with the experimental deformation data we need three additional pieces of information, namely: (i) X as a function of the strain, c, (ii) the value of the intrinsic Young's modulus, E, and (iii) the value for the pemlanent deformation, ~0, after unloading prior to the yield point (This permanent deformation is due to the initial closure of pores and cracks in the sample, and diminishes when the confining pressure is increased).
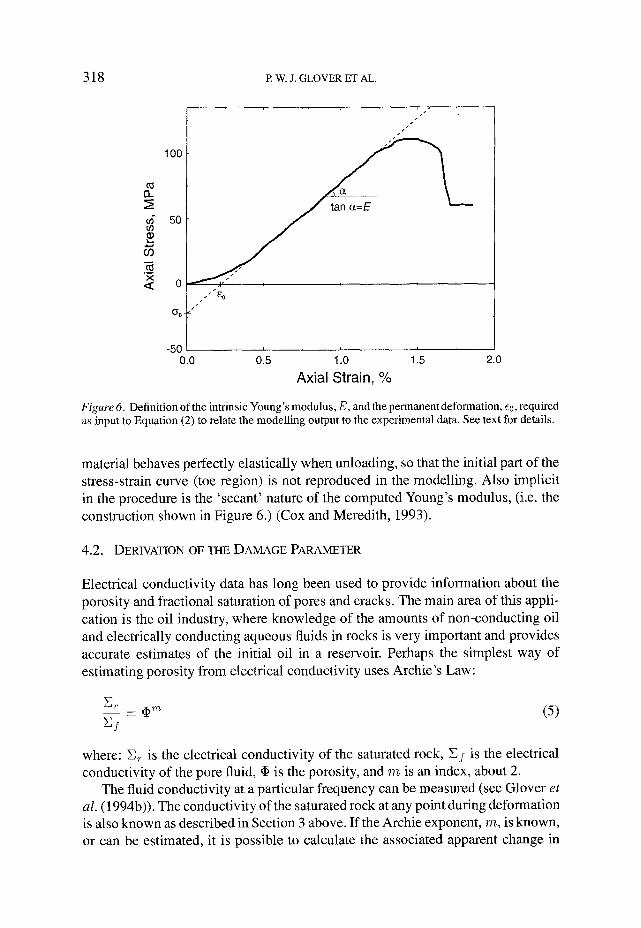
The first item in the list is readily available from the way the damage parameter is defined (see below). The other two items can be obtained from the experimental stress-strain curve, as shown in Figure 6. The Young's modulus, E, is calculated as the slope of the straight part of the stress-strain curve. The permanent deformation, ~0 is the value of the strain at which the straight part of the stress-strain curve, after extending it, intersects the strain axis. From Figure 6 we can infer Equations (1) and (2);
O- = O-o + EE (1)
o" o E0 : (2)
where O-o is the intercept at zero strain. After producing these parameters, the inverted stress-strain curves can be
expressed as;
O-model = [ ( J~ t /E )mode l " Eexp]E (3)
Emodel = Eexp -/- ~0 (4)
where the subscript 'exp' stands for experimental results and the subscript 'model' for modelled results. Behind Equations (3) and (4) lies the assumption that the
318 t,. W. J. GLOVER ET AL.
z;
09
(,0
X <:
100
50
0
I ~S
f
f J ~
-50 I , , , 0.0 0.5 1.0 1.5 2.0
Axial Strain, %
Figure 6. Definition of the intrinsic Young's modulus, E, and the permanent deformation, e0, required as input to Equation (2) to relate the modelling output to the experimental data. See text for details.
material behaves perfectly elastically when unloading, so that the initial part of the stress-strain curve (toe region) is not reproduced in the modelling. Also implicit in the procedure is the ' secant' nature of the computed Young's modulus, (i.e. the construction shown in Figure 6.) (Cox and Meredith, 1993).
4.2. DERIVATION OF THE DAMAGE PARAMETER
Electrical conductivity data has long been used to provide information about the porosity and fractional saturation of pores and cracks. The main area of this appli- cation is the oil industry, where knowledge of the amounts of non-conducting oil and electrically conducting aqueous fluids in rocks is very important and provides accurate estimates of the initial oil in a reservoir. Perhaps the simplest way of estimating porosity from electrical conductivity uses Archie's Law:
_ o n ( 5 ) ~ f
where: N~ is the electrical conductivity of the saturated rock, Ef is the electrical conductivity of the pore fluid, �9 is the porosity, and m is an index, about 2.
The fluid conductivity at a particular frequency can be measured (see Glover et
al. (1994b)). The conductivity of the saturated rock at any point during deformation is also known as described in Section 3 above. If the Archie exponent, ra, is known, or can be estimated, it is possible to calculate the associated apparent change in
MODELLING THE STRESS-STRAIN BEHAVIOUR OF SATURATED ROCKS 319
(a)
(b)
150
g_ 100
t)
50
<
0
/2/r ,~ ~..e.mo.,.,
0.0 1.0 2.0
1.5
c-
c-
O 1.0 O O
n -
0.5 E -6
-~ 0.0
o
3.0 0.3
Damage parameter Crack volume rate of change (normallsed)
0.2 r
..Q g l
0.1 3 O
0.0 ~
f i
0.0 1.0 2.0 3.0
AxiaFStrain, ~ (%)
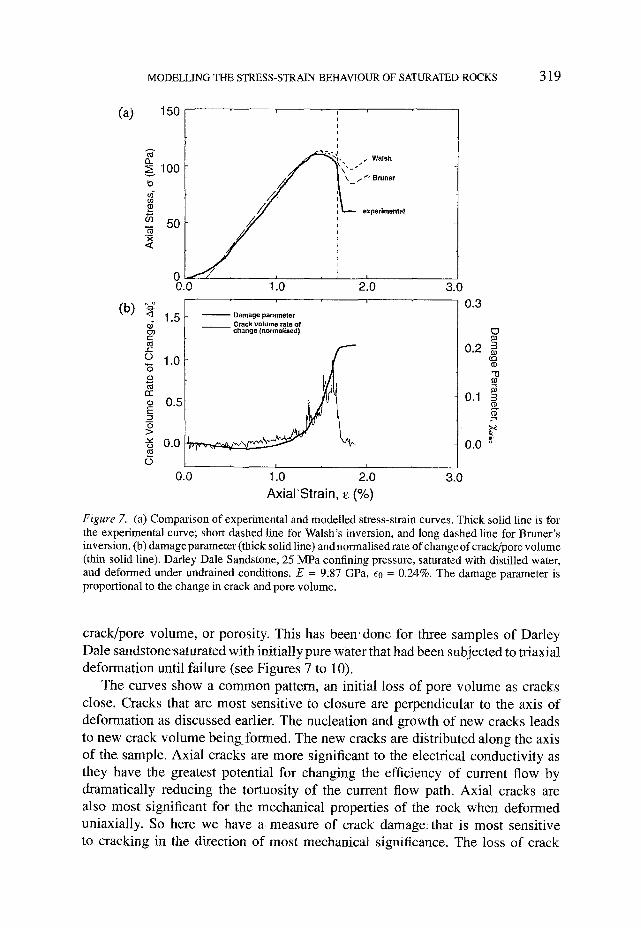
Figure 7. (a) Comparison of experimental and modelled stress-strain curves. Thick solid line is for the experimental curve; short dashed line for Walsh's inversion, and long dashed line for Bruner's inversion. (b) damage parameter (thick solid line) and normalised rate of change of crack/pore volume (thin solid line). Darley Dale Sandstone, 25 MPa confining pressure, saturated with distilled water, and deformed under undrained conditions. E = 9.87 GPa, co = 0.24%. The damage parameter is proportional to the change in crack and pore volume.
crack/pore volume, or porosity. This has been' done for three samples of Darley Dale sandstone'saturated with initially pure water that had been subjected to triaxial deformation until failure (see Figures 7 to 10).
The curves show a common pattern, an initial loss of pore volume as cracks close. Cracks that are most sensitive to closure are perpendicular to the axis of deformation as discussed earlier. The nucleation and growth of new cracks leads to new crack volume being formed. The new cracks are distributed along the axis of the sample. Axial cracks are more significant to the electrical conductivi ty as they have the greatest potential for changing the efficiency of current flow by dramatically reducing the tortuosity of the current flow path. Axial cracks are also most significant for the mechanical properties of the rock when deformed uniaxially. So here we have a measure of crack damage: that is most sensitive to cracking in the direction of most mechanical significance. The loss of crack

3 2 0 P .w.J . GLOVER ET AL.
(a) 150
g_ g loo
d
-~ 50 <
o
(b) .o
�9 i �9 i i
~, Walsh
\ Bruner \ j f
mental
0.0 1.0 2.0
<1 e"
0 "5
0
1.5 �9 Damage parameter - Crack volume rate of /
1.0
0.5
0.0
i i
0.0 1.0 2.0
Ax ia l St ra in , s (%)
3 .0
0 .3
0.2
0.1
0.0
3.0
CD
O
"13
3
o
o
Figure 8. S a m e as Figure 7, for DDS at 50 M P a conf in ing pressure . E = 10.93 GPa, e0 = 0.28%.
and pore volume due to compaction is soon compensated for by the growth of new cracks. The pore and crack volume continues increasing until failure, when it becomes constant.
The change in apparent pore volume measured electrically is not the same as the volumetric change in pore volume as it is usually understood, because the apparent pore volume measured electrically is implicitly weighted to favour both cracks that align axially, and new crack growth or crack propagation that tends to increase the pore and crack network connectivity.
Before going into specific details about how a crack damage (density) parameter can be derived from electrical data it is useful briefly to look at the definition of such a parameter. Crack density or damage parameters are usually defined as a ratio of crack volumes to the volume of the rock. For example Sammonds et al.
(1993) defined it as;
m
Nc3 (6) Xisotropic - - V

MODELLING THE STRESS-STRAIN BEHAVIOUR OF SATURATED ROCKS 321
(a) 200
~ 150
~100
'~ 50 <
(b) ~r <3
a;
c--
c-
o "5 0~ rr
E -6
t~
c3
0 0.0
1.5 t Damage parameter _ _ Crack volume rate of
change (normalfsed) 1.0
,~, "gz
/ /
i i
1.0 2.0
Walsh
\~ / / Brunet
experimental
0 .5
0.0
3.0
0 .2 ~a 3
r 0.1 -o
3
0,0 --"
g
-0.5 -0.1 0.0 1.0 2.0 3.0
Axia l Strain, e (%)
Figure 9. Same as F igure 7, for DDS at 50 MPa, drained condi t ions , rn index cons tan t ( m = 2 ) . /~ 10.2 GPa, eo = 0 .11%.
where, N is the total number of cracks of mean volume described by c 3, of a set of cracks where ci is an individual crack length and the crack length distribution is inferred to have a power law distribution due to the assumption that the dam- age evolved fractally, V is the volume of the rock sample, and Xisotropic is the resultant isotropic crack densi_i_~ parameter so produced. In the case of Sammonds et al. the values of N and e 3 were obtained from fractal based analysis of an acoustic emission dataset which provided values for the total number of cracks produced and information about their size distribution, but not information about their orientation or the extent to which each individual cracking event contributed to increasing the connectivity of the evolving crack network.
In the definition of a crack damage parameter from electrical data it is impor- tant to distinguish between loss of pore volume due to pore compaction, and pore volume gain due to the formation of new cracks, and the propagation of existing cracks. We have devised the following procedure to generate an anisotropic crack damage parameter from the electrical data. First we took Archie's empirical rela-
322 m.W.J. GLOVER ET AL.
Ca)
(b)
i
200 , ~
.~ 150 ~''
~ 100 g~
~, 50 ~ "
00.0 1.0 210 ,o 1.5 ' ' " ~ - ' ' ' Damage parameter < ~ Crack volume rate of (3~ - - change (normalised)
1.o ,c..)
m 0.5 r r
E 0.0
o -0.5 0.0 1.0 2.0
Axial Strain, a (%)
i
. t " Walsh
22+
3.0
0.2 E7
3 t Q 0
0.1 -o
3 ~b $-
0.0 -" g
-0.1 3.0
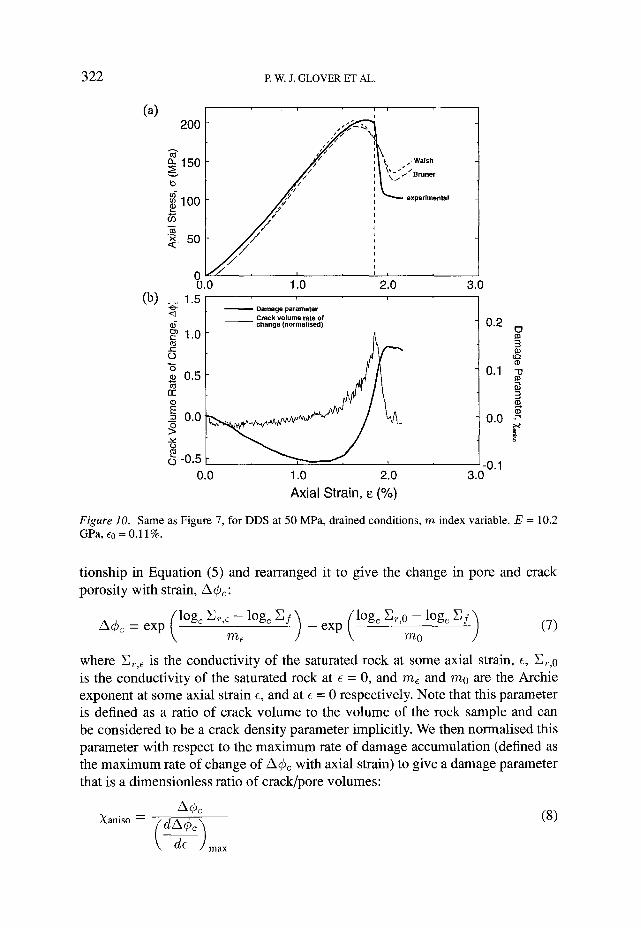
Figure 10. Same as Figure 7, for DDS at 50 MPa, drained conditions, m index variable. E = 10.2 GPa, e0 = 0.11%.
tionship in Equation (5) and rearranged it to give the change in pore and crack porosity with strain, A~D~:
A 4 7 ~ = e x p ( l~176 . . . . . e x p ( l~176176 (7)
where 2~,~ is the conductivity of the saturated rock at some axial strain, e, E~,0 is the conductivity of the saturated rock at e = 0, and m, and m0 are the Archie exponent at some axial strain e, and at e = 0 respectively. Note that this parameter is defined as a ratio of crack volume to the volume of the rock sample and can be considered to be a crack density parameter implicitly. We then normalised this parameter with respect to the maximum rate of damage accumulation (defined as the maximum rate of change of A4D~ with axial strain) to give a damage parameter that is a dimensionless ratio of crack/pore volumes:
A ~ (8) Xaniso -- ( d A q ~ c ~
\ ~ ] max

MODELLING THE STRESS-STRAIN BEHAVIOUR OF SATURATED ROCKS 323
where, ~ is strain, and )[aniso is an anisotropic crack density parameter derived from electrical conductivity data and used for subsequent modelling in the equations of Walsh (1965a, 1965b) and Bruner (1976). From Equation (8) we can easily compute the crack volume rate of change to have a good idea of when new cracks are created. This is done by differentiating the (normalised) crack damage parameter:
A ~ t c - - dXaniso d~ (9)
and this is also plotted in Figures 7 to 10 as thin solid lines in the lower portion of the figure.
We know all terms in expression (7) except the values for m. For the undrained tests at 25 MPa and 50 MPa (Figures 7 and 8), ra was not measured, but we may reasonably set it to the value 2 during the whole of the deformation. This is because it is known that m = 2 is most appropriate for permeable, high porosity sandstones, with a majority of equant pores with low aspect ratios, such as is the case for Darley Dale sandstone. It must be said, however, that the absolute value of m is unimportant, providing it is constant during deformation. This is because the calculated value of )C using Equation (8) has been normalised between ;V = 0 at
= 0, and X = 1 at that value of c when X is maximum, before use. It should be noted that the assumption that the Archie exponent, ra is constant
will not generally be the case as it is known that this exponent depends upon the aspect ratio of the cracks and pores. Exponents about 2 are relevant to rocks which contain a majority of equant, low aspect ratio pores. These tend to be high permeability, high porosity clean sandstones. Exponents less than 2 are possible for rocks containing high proportions of cracks with high aspect ratios. Since the aspect ratio of cracks and pores in the rock are likely to undergo considerable change during deformation, ra is also expected to change. However, significant variation in the value of ra was thought unlikely in the samples used in this work because all samples in this work were high porosity, high permeability sandstones, where the statistical value of m for the whole rock will be dominated by the characteristics of the background pore structure, even when a crack structure is well developed near failure.
We have also performed a deformation experiment in drained conditions which has provided us with a set of actual m values as a function of strain. For this particular sample we have been able to compare the results obtained with a constant ra value (m = 2) with an m value that is a measured function of strain, m = re(e). Figure 1 la plots ra versus ~, and Figure 1 lb compares the inferred damage parameters with constant and variable m before normalisation. As expected the m- value changes by only small amounts during deformation, resulting in differences in the damage parameters that are not very large. However, as we shall see in the next section, the use of a variable ra exponent changes the inverted stress-strain curves,

324 P.w.J. GLOVER ET AL.
( a ) 1 . 9 5 0
1 . 9 4 5 E
C
o 1.940 e',, x r
z 1.935 o <
1 . 9 3 0 ' 0.0 1.0 2.0
(b) 1.5 , , -O-
<1 Constant m
Variable m '-" 1 . 0 t -
O
"6
re Ill
E 0.0
2x: O
0 -N.F;_~ , ,
0.0 1.0 2.0
Axial Strain, a (%)
Figure 11. Comparison of the normalised rate of change of crack/pore volume obtained with a constant and variable ra index.
4.3. THEORETICAL MODELS OF CRACKED SOLIDS
Several authors have developed models to relate the change in elastic properties of a solid to the amount of damage induced by a deformation process. Some of these models take explicit account of anisotropic effects as non-random crack distribu- tions, and are tensorial in nature (e.g. Kachanov, 1980; Hudson, 1986; Sayers and Kachanov, 1991); others rely in the assumption of random crack orientation statis- tics, and use an scalar approach (Walsh, 1965a,b; O'Connell and Budiansky, 1974, 1976; Bruner, 1976; Kemeny and Cook, 1986). Due to the lack of information about the orientation statistics in our samples, and considering the preliminary character of the work, we will deal only with isotropic models of cracked solids. More specif- ically, two models have been tested for the inversion procedure, Walsh's (1965a) and Bruner's (1976) models, the former being valid for dilute crack densities and the latter for medium to high crack densities.

MODELLING THE STRESS-STRAIN BEHAVIOUR OF SATURATED ROCKS 325
In Walsh's model for a cracked solid, the Young's modulus for a body containing many cracks is found by separating the body into regions, each of which contains one crack, and assuming that the stresses applied on the boundaries of each region are the same as for the body as a whole. Then, the contributions to the overall strain from individual cracks are summed up to give the total strain. The aforementioned simplification is necessary to solve analytically the resulting equations, but it is also responsible for limiting the validity of the model to the dilute crack density limit. Once the interactions among neighbouring cracks become important the assumption of cracks 'feeling' the external stress field is no longer satisfactory.
Walsh based his model on the analytical solution of the stress field for a two- dimensional narrow elliptical crack, the width of which (in the plane of the crack) being equal to the length (Walsh (1965a) found that such cracks were only 15% more effective in increasing compressibility than an equal number of 'penny- shaped' cracks).
The general expression for the effective Young's modulus of a body containing cracks of any shape and orientation at which Walsh arrived using Betti's reciprocal theorem is;
1 1 2W~ E ' - E + ~2--V' (10)
where E ' is the Young's modulus of the cracked solid, E the Young's modulus of the intact solid, ~ the increase in strain energy of the body due to the cracks, cr the external applied stress, and V is the volume of the rock sample. Equation (10) is valid for any crack shape, but to solve it explicitly we need the expression for 14q for cracks of a particular shape. Using the elastic solution for a single elliptical crack in an infinite medium, Walsh arrived at the following expression for We, after summing up the contribution of each crack to the overall strain energy (and assuming random crack orientation statistics, plane stress conditions, and that the stresses around each crack were equal to the externally applied stresses):
27rcr2Ne 3 l~G - 3 E ' (11)
where N is the total number of cracks, and 6 their average length. Inserting Equation (11) into Equation (10) yields:
1 1( E ' - E 1 + 3 V J (12)
If we define now the scalar crack density parameter in the same way as Sammonds et al. (Equation (6)), and equate it with an experimental damage parameter derived either from acoustic emission data or from electrical data, we can finally express Equation (12) in terms of the experimental damage parameter:
E ' ( 4 ~ r ) -1 - - = 1 + 9r (13) e 5-
326 E W.J. GLOVER ET AL.
Equation (13) is the expression derived from the Walsh model that we will use in the inversion procedure, and Equations (7) and (8) will be used to derive the anisotropic crack damage parameter, Xaniso, from the measured electrical data.
Bruner's (1976) differential method to compute the effective moduli of cracked solids is based on a modification of the self-consistent scheme. The first self- consistent model of a cracked rock is due to O'Connell and Budiansky (1974, 1976). Very briefly, the method tries to account for crack interactions using an approach very similar to that of Walsh (1965b) but assuming that the cracks are embedded in a medium not with the properties of the intact (crack-less) body but with the properties of the cracked one. As was the Case in Walsh's model, O'Connell and Budiansky also assumed random crack orientation statistics. Blxmer (1976) has pointed out that the self-consistent scheme may overestimate crack interactions and proposed an alternative scheme, called a differential scheme, in which the crack density is increased in small steps and the elastic properties are recalculated incrementally, also assuming random crack orientations. Casted in other words, cracks are added one at a time, so that the modulus of the solid to which the cracks are being added is not constant (as was implicit in the self-consistent method of O'Connell and Budiansky) but varies from the intrinsic value E when the first crack is added, to the effective value E ' when the last crack is added. Bruner's model is based on the elastic solution for an isolated penny-shaped crack in an infinite three dimensional medium.
By using an incremental addition of cracks to the body, the resulting equations relating effective properties to crack density are in a differential form (hence the scheme's name). For the effective Young's modulus the equation can be written as;
d E ' _ 1 6 ( 1 - u'2)(10 - 3 U ' ) E , .
dx 45 ( 2 - u') (14)
Equation (14) is not amenable to explicit analytical solution because of its non- linearity. However, Brunet solved the equation approximately by noting that both E ' and u' are non-negative slowly varying functions of X, and integrating equation (14) by replacing each function by its value at u' = 0. The result is:
E t - - = e-~Xv (15) E
which is the other expression derived from Bruner's model that we will use in the inversion procedure, together with the anisotropic crack damage parameter, Xaniso, derived from the measured electrical data using Equations (7) and (8).
4.4. RECONSTRUCTING THE STRESS-STRAIN RELATIONSHIPS
We have applied the inversion strategy to three samples deformed at different confining pressures. The results are gathered in Figures 7 to 10. Figure 7 displays

MODELLING THE STRESS-STRAIN BEHAVIOUR OF SATURATED ROCKS 327
the results for a Darley Dale Sandstone (DDS) deformed at 25 MPa confining pressure, saturated with initially distilled water, and deformed under undrained conditions; Figure 8 is for a DDS at 50 MPa confining pressure, saturated with initially distilled water and deformed under undrained conditions; and Figures 9 and 10 are for a DDS at 50 MPa confining pressure, also saturated with initially pure water, but deformed under drained conditions, which has enabled us to monitor the change in the m index as a function of strain. Figure 9 depicts the results obtained with a constant r~ index (ra = 2 as for Figures 7 and 8), and Figure 10 the results using a variable m index.
In all figures, the lower graph shows the damage parameter and the pore volume change as inferred from conductivity measurements, and the upper graph shows the experimental stress-strain curve together with the inverted curves based upon Walsh and Brunet models.
Looking at the figures, we can notice the following points:
1. Toe region The modelled stress-strain curves intersect the strain axis at a non zero value, corresponding to the ~0 value used to invert them.
2. Straight region The straight part of the stress-strain curve is well modelled with both Walsh and Bruner models. In the samples deformed under undrained conditions both models coincide up to peak-stress (Figures 7 and 8). For the sample deformed under drained conditions both models diverge in the linear part of the stress-strain curve and maintain the difference thereafter. Notice also that for this particular sample it is not easy to distinguish a well defined straight part in the curve, indicating a non-linear behaviour throughout the deformation range.
3. Post-yield to pre-peak region (strain-hardening region) The region between yield point and peak stress is reasonably well modelled by both models in the samples deformed under undrained conditions, but not so for the one deformed under drained conditions, where a systematic departure from the experimental curve can be noticed. For this particular sample, Walsh's model seems to perform better than Bruner's for the variable ra inversion, and the other way round for the constant m inversion, although the differences are not very significant.
4. Post-peak to failure region (strain softening region) The post-peak part of the stress-strain curve is in all cases better reproduced by the inversion using Bruner's model, which is quite logical if we recall that the Walsh model of a cracked solid does not account for crack interactions. The sample deformed at 50 MPa confining pressure (Figure 8) is the best recovered by the inversion procedure, where Bruner's model almost matches the experimental

(a)
1.0
(b)
q l
LU
v
q l
LU
v
c:
I I I
0.5
0.0
-0.5
-1.0 -0.1
3.0
328 P.W.J. GLOVER ET AL.
i I I
O0 0.1 0.2 0.3 I i
Bruner's model
2.0
I 1
2 0 3
Damage Parameter, )G,,.so
Figure 12. Test of the inversion accuracy. (a) (s versus X for DDS at 25 MPa, (b) ln(E/E') versus X for the same sample. The middle straight section represents the range of X values for which the inversion works well.
stress-strain curve up to the residual stress region. For the 25 MPa sample (Figure 7) the inversion is not so satisfactory in the post-peak region, and neither model is able to reproduce accurately the final part of the curve. Finally, the inversion is still worse for the sample deformed under drained conditions (Figures 9 and 10), where the discrepancies between experimental and modelled curves are considerable. Even here, however, the modelling is as good as that produced from acoustic emission-derived isotropic crack damage parameters.
4.5. TESTING OF THE INVERSION PROCEDURE
How can we test the accuracy of the modelled stress-strain curves? Recalling Equations (13) and (15), which express the effective Young's modulus as a function

MODELLING THE STRESS-STRAIN BEHAVIOUR OF SATURATED ROCKS 329
of the damage parameter for Walsh and Bruner's model, respectively, we can rearrange them in the following way:
- 1 + A I X (16) E /
and
E In ~5 = A2X (17)
where A 1 = 47c/3 and A2 = 7r. If we plot E / E ~ versus X for Walsh's model, and ln(E/U) versus X for Bruner's model we should obtain a straight line if the method is going to perform well. Figure 12a plots E / E t versus ~ for the DDS sample deformed at 25 MPa confining pressure, and Figure 12b plots ln(E/E ~) versus X for the same sample. Note the particularly well developed central linear section, flanked by two diverging sections: the one on the left is related to the toe region of the stress-strain curve, and the one on the right with the post-peak stress region. Measuring the ~ values at which the divergence occurs and putting them in the damage parameter plot for the same sample (Figure 7a) we can infer the approximate strain value at which the inversion method breaks down. These values of the strain are marked in Figures 7-10 with vertical lines. It is worth noting that both Walsh and Bruner methods seem to be applicable up to similar strain values.
5. Conclusions
Measurement of the complex conductivity of saturated rocks during triaxial defor- mation has the potential for giving useful information concerning the closure and subsequent formation and growth of new cracks. It is particularly useful as it is sensitive to the orientation of the cracks that are closing, opening or propagat- ing. It is also useful to note how the conductivity measurement shows how early dilatation begins to occur (during the quasi-elastic part of the stress-strain curve) demonstrating that deformation in this strain range is not truly elastic, but linear due to a balance of the mechanical effects of crack closure perpendicular to the direction of principal stress, and the formation of tension cracks aligned in parallel with the direction of principal stress.
The sensitivity of complex electrical measurements to crack orientation, and crack connectivity, has been used to create a new direction sensitive (anisotropic) crack damage parameter. Stress-strain curves reconstructed using this damage parameter and the models of Walsh and Bruner show surprisingly good agreement with the measured stress-strain curves.
The improvement of this modelling over that using isotropic damage param- eters derived from acoustic emission measurements has been associated with the following differences between the two techniques. The acoustic emission derived

330 R w, J, GLOVER ET AL.
isotropic damage parameter is a body average parameter taking no notice of either the orientation of measured cracking, or whether that cracking is isolated, or con- tributes to increasing the connectivity of the crack network by linking other cracks. By comparison, the electrical conductivity derived anisotropic damage parameter is a body average parameter that implicitly weights the importance of cracks that form in the direction that will have greatest mechanical effect (axially for uniaxial tests and sub-axially for triaxial tests), and also implicitly takes more account of new cracking that contributes to increasing the connectivity of the crack network, the network that ultimately leads to the mechanical weakening of the sample prior to failure.
To our knowledge, this is the first time that a mechanical property varying during triaxial deformation, has been successfully modelled using information from the measurement of a transport property. It opens up the possibility of progress in deriving changes in electrical conductivity and fluid permeability from mechanical measurements made during deformation.
References
Bruner, W. M.: 1976, 'Comment on Seismic Velocities in Dry and Saturated Cracked Solids', J. Geophys. Res. 81, 2573-2576.
Cox, S. J. D. and Meredith, P. G.: 1993, 'Microcrack Formation and Material Softening in Rock Measured by Monitoring Acoustic Emissions', Int. J. Rock Mech. Min. Sci. & Geomech. Abstr. 30, 11-24.
Glover, P. W. J., Meredith, P. G., Sammonds, P. R. and Murrell, S. A. F.: 1994a, 'Measurements of Complex Electrical Conductivity and Fluid Permeability in Porous Rocks at Raised Confin- ing Pressures', In Rock Mechanics in Petroleum Engineering, Proceedings of EUROCK '94, SPEfISRM International Conference, Delft, The Netherlands, Balkema, Amsterdam, pp. 29-36.
Glover, P. W. J., Meredith, P. G., Sammonds, P. R. and Murrell, S. A. F.: 1994b, 'Ionic Surface Electrical Conductivity in Sandstone', J. Geophys. Res. 99(B 11), 21635-21650.
Hudson, J. A.: 1986, 'A Higher Order Approximation to the Wave Propagation Constants for a Cracked Solid', Geophys. J. Roy. Astron. Soc. 87,265-274.
Kachanov, M.: 1980, 'Continuum Model of Medium with Cracks', J. Eng. Mech. Div. Am. Soc. Civ. Eng. 106, 1039-1051.
Kemeny, J. and Cook, N. G. W.: 1986, 'Effective Moduli, Non-Linear Deformation and Strength of a Cracked Elastic Solid', Int. J. RoekMech. Min. Sci. & Geomeeh. Abstr. 23, 107-118.
O'Connell, R. J. and Budiansky, B.: 1974, 'Seismic Velocities in Dry and Saturated Cracked Solids', J. Geophys. Res. 79, 5412-5426.
O'Connell, R. J. and Budiansky, B.: 1976, 'Elastic Moduli of Cracked Solid', Int. J. Solid Struct. 12, 81-97.
Sammonds, P. R., Meredith, P. G., Murrell, S. A. F., and Main, I. G.: 1994, 'Modelling the Dam- age Evolution in Rock Containing a Pore Fluid by Acoustic Emission', In Rock Mechanics in Petroleum Engineering, Proceedings of EUROCK '94, SPE/ISRM International Conference, Delft, The Netherlands, Balkema, Amsterdam, pp. 897-904.
Sayers, C. M. and Kachanov, M.: 1991, 'A Simple Technique to Finding Effective Elastic Constants of Cracked Solids for Arbitrary Crack Orientation Statistics', Int. J. Solid Struct. 27, 81-97.
Walsh, J. B.: 1965a, 'The Effect of Cracks on the Compressibility of Rock', J. Geophys. Res. 70, 381-389.
Walsh, J. B.: 1965b, 'The Effect of Cracks on the Uniaxial Elastic Compression of Rocks', J. Geophys. Res. 70,381-389.