hydrocarbon potential of the meso-cenozoic turkana depression
TRANSCRIPT

Hydrocarbon potential of the Meso-Cenozoic Turkana Depression,
northern Kenya. II. Source rocks: quality, maturation, depositional
environments and structural control
M.R. Talbota,*, C.K. Morleyb, J.-J. Tiercelinc,d, A. Le Herissec,d, J.-L. Potdevine, B. Le Gallc,d
aGeological Institute, University of Bergen, Allegt. 41, 5007 Bergen, NorwaybUniversiti Brunei Darussalam, Jalan Tungku Link, Gadong BE1410, Brunei
cUMR CNRS 6538 ‘Domaines Oceaniques’, Institut Universitaire Europeen de la Mer, Place Nicolas Copernic, 29280 Plouzane, FrancedUniversite de Bretagne Occidentale, 6, avenue Le Gorgeu, B.P. 809, 29285 Brest, France
eUniversite des Sciences et Technologies de Lille, UFR des Sciences de la Terre, UMR CNRS Processus et Bilans des
Domaines Sedimentaires, 59655 Villeneuve d’Ascq Cedex, France
Received 14 March 2003; received in revised form 12 November 2003; accepted 14 November 2003
Abstract
Source rocks identified by drilling (Loperot-1 well) in the Lokichar Basin of the northern Kenya Rift were evaluated for source potential
using RockEval pyrolysis and palynofacies analysis. Results indicate moderate to good oil source potential from algal-prone source rocks.
The original sediments accumulated in a large freshwater lake similar to some modern rift lakes. In the Loperot-1 well, the section with the
highest source potential lies within the Lokhone Shale Member (up to 17% total organic carbon (TOC), average 2.4% TOC from well-log
calculation). The other potential source interval is the deeper Loperot Shale Member, which is highly mature to post-mature (R0 ¼ 1:1%;
average 1.2% TOC from well-log calculation). The poorer quality of the lower shale interval while partly due to maturity, is thought to be
largely a result of the basin evolution. The Loperot Shale Member was restricted to the Lokichar Basin, while the Lokhone Shale Member
was deposited during a time when displacement on the main boundary fault system was greater, and adjacent basins had been established.
Consequently, lacustrine conditions appear to have extended into adjacent basins, thus allowing the accumulation of relatively higher
concentrations of algal material in sediment-starved parts of the basin.
q 2003 Elsevier Ltd. All rights reserved.
Keywords: Northern Kenya Rift; Lokichar Basin; Lacustrine source rock; RockEval; Palynofacies
1. Introduction
Hints that significant quantities of hydrocarbons can be
generated in the East African Rift System (EARS) have
come from several sources over the years. Oil seeps and the
presence of organic-rich lacustrine shales in an onshore well
at Lake Albert (western branch of EARS) were perhaps the
first evidence (Harris, Pallister, & Brown, 1956; Schull,
1988). Subsequently oil seeps and natural tar balls have been
described from Lake Tanganyika (Simoneit, Aboul-Kassim,
& Tiercelin, 2000; Tiercelin et al., 1993), and the organic-
rich Poi Shales have been identified in the Miocene
fluvio-lacustrine Ngorora Formation of central Kenya Rift
(Morley, 1999c; Renaut, Ego, Tiercelin, Le Turdu, & Owen,
1999; see Fig. 1 in companion paper). Source rocks have
also been encountered in the Lokichar Basin, northern
Kenya Rift, where they can be seen at outcrop, and have
been sampled in shallow and deep exploration wells, and
can also traced on seismic reflection profiles. A general
description of the Lokichar Basin in terms of structure,
sedimentary infill, quality of reservoir, and source rocks has
been given in Morley et al. (1999) and in the companion
paper to this work. The aim of this paper is to provide more
details on the geochemistry of the source rocks, the evidence
for their depositional setting, and to discuss the link between
basin structure and source-rock quality. Two sets of shale
samples from the Loperot-1 well, cleaned cuttings and
sidewall cores, have been used in this work.
0264-8172/$ - see front matter q 2003 Elsevier Ltd. All rights reserved.
doi:10.1016/j.marpetgeo.2003.11.008
Marine and Petroleum Geology 21 (2004) 63–78
www.elsevier.com/locate/marpetgeo
* Corresponding author. Tel.: þ47-55583390/3520; fax: þ47-
55589416/9417.
E-mail address: [email protected] (M.R. Talbot).

Fig. 1. (A) Location map of the N–S-oriented string of Palaeocene–Miocene basins in the northern Kenya Rift: Lokichar, North Kerio, North Lokichar and
Lothidok (modified from Hung (1996)). The Loperot-1 well is located a few km north of the TVK-12 seismic line. The black star indicates the location of shale
outcrops. (B) Schematic 3D view of geological cross-sections illustrating the main structural and stratigraphic elements of the Lokichar, North Lokichar and
Lothidok basins, and correlation with the Loperot-1 well (projected). The top Oligocene time line cuts across the volcanic rocks filling the Lothidok Basin.
Based on outcrop, seismic reflection (TVK-2, -12 and -13 lines; see box A) and well data.
M.R. Talbot et al. / Marine and Petroleum Geology 21 (2004) 63–7864
2. Source rocks in the Lokichar Basin
Hydrocarbon exploration interest in the Lokichar Basin
(Fig. 1(A); see also Figs. 2(B) and 5(A) in companion paper)
was first sparked by gravity data, which revealed a large,
negative Bouger anomaly with a typical half-graben
geometry (Morley et al., 1992). Subsequent reconnaissance
seismic reflection data demonstrated the presence of a deep
half-graben and tilted fault blocks (Morley et al., 1992,
1999). The presence of a section some 6–7 km thick
indicated that any source rocks located in the lower half of
the basin fill section were likely to be mature, assuming
normal or elevated crustal temperatures. Consequently, a
key subsequent step in exploration was to establish the
presence of source rocks in the basin. Typically, where rift
sections outcrop they tend to be representative of
flexural margins, which are sand-prone areas (Lambiase &
Bosworth, 1995). Major episodes of fine-grained lacustrine
deposition, where present, tend to be located closer to the
boundary fault, in areas of maximum subsidence, and
remain buried unless the basin is subsequently subjected to
significant inversion. Consequently, considerable optimism
was generated when a 100-m thick black, organic-rich shale
(now called the Lokhone Shale Member) was found as
discontinuous outcrops close to the Lokhone Horst at lat.
02823.0050N; long. 35855.8500E (Fig. 1(A); see also
Fig. 5(A) in companion paper).
Further definition of the Lokhone Shale Member was
made using a water-well rig to drill a series of shallow wells
(maximum depth about 100 m), along selected seismic lines
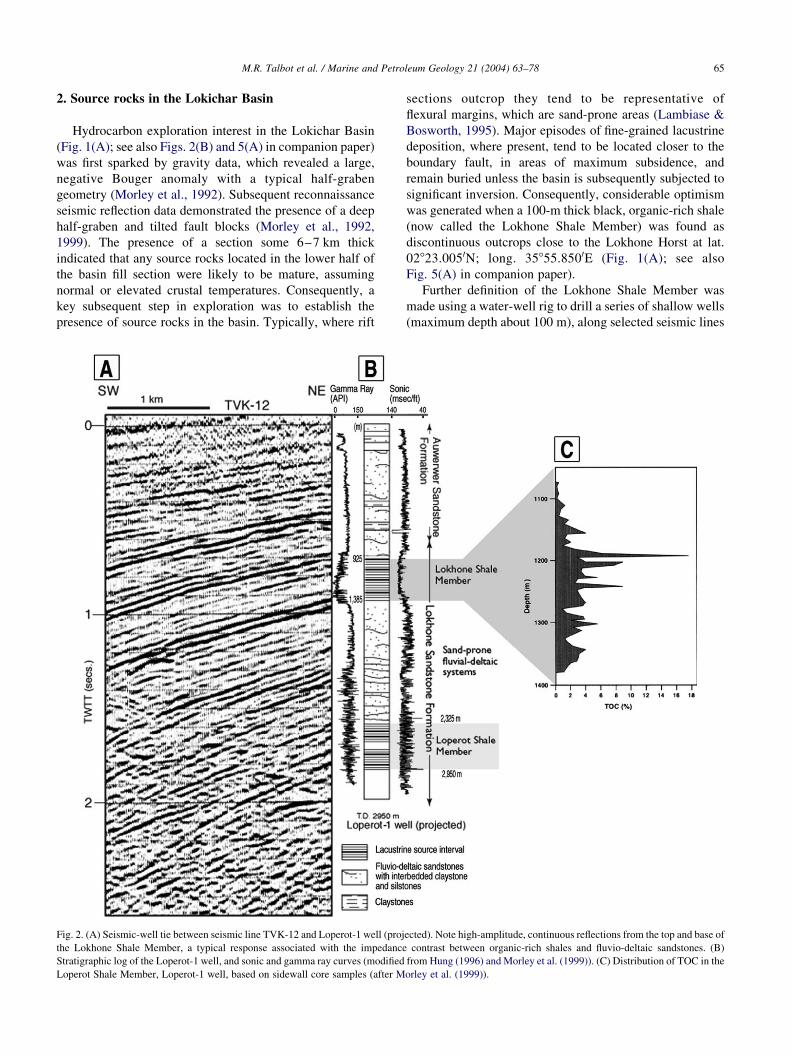
Fig. 2. (A) Seismic-well tie between seismic line TVK-12 and Loperot-1 well (projected). Note high-amplitude, continuous reflections from the top and base of
the Lokhone Shale Member, a typical response associated with the impedance contrast between organic-rich shales and fluvio-deltaic sandstones. (B)
Stratigraphic log of the Loperot-1 well, and sonic and gamma ray curves (modified from Hung (1996) and Morley et al. (1999)). (C) Distribution of TOC in the
Loperot Shale Member, Loperot-1 well, based on sidewall core samples (after Morley et al. (1999)).
M.R. Talbot et al. / Marine and Petroleum Geology 21 (2004) 63–78 65
between the strike-projection of the shale outcrops
(Fig. 1(A)). This drilling program established that the
shale interval is at least 100 m thick, thermally immature
ðR0 ¼ 0:32–0:37%Þ; with average total organic carbon
(TOC) content for cuttings samples ranging between 0.05
and 8.6%. Selected pieces of shale were as rich as 11%
(Morley et al., 1999). Following a standard continental rift,
half-graben sedimentation model (Katz, 1995; Lambiase &
Bosworth, 1995), it was anticipated that the source rocks
would thicken considerably towards the basin centre, and
that their source quality would be maintained or improve in
the same direction.
The Loperot-1 exploration well (Figs. 1 and 2(A) and
(B)) was a very important test of the assumed source
potential of the basin. The well lay about 7 km closer to the
basin centre than the water wells and penetrated the
Lokhone Shale Member between 925 and 1385 m. Signifi-
cant basinward thickening of the shale interval, from about
100 to 460 m, occurs over the 7 km, confirming the
predictions based upon a half-graben depositional model.
Well logs clearly record the presence of this thick shale
interval. For example, the predominantly high gamma ray,
low resistivity and SP readings are indicative of a
consistently shale-prone section (Fig. 2(B)). Within this
section, the most organic-rich zone, defined by the TOC
content of shale samples from sidewall cores (1–17% TOC,
average 2.4% TOC; Hung, 1996; Morley et al., 1999), lies
between 1100 and 1385 m (Morley et al., 1999; Fig. 2(C)).
Correlation of the Loperot-1 well with seismic reflection
data demonstrates that high-amplitude, continuous to
shingled reflections characterize the top and bottom of the
Lokhone Shale Member, which internally displays continu-
ous low amplitude events (Fig. 2(A) and (B)). Thus, the
lacustrine facies can be extrapolated with some confidence
into the deeper part of the basin (Figs. 3 and 4).
In other rift basins it has been demonstrated that organic-
rich lacustrine sequences tend to produce such distinctive
reflection packages due to their internal homogeneity and a
marked reduction in seismic velocity passing from adjacent
sand-prone units into the shale (Liro & Pardus, 1990).
Vitrinite reflectance values for the Loperot-1 well are
0.6–0.65% for the depth interval 1050–1390 m, indicating
a rapid transition to maturity from the outcrops to the well.
The main depocentre lies a further 6–16 km west of the
Loperot-1 well; seismic data indicate that the Loperot Shale
Member here reaches thicknesses in excess of 1 km (Fig. 4).
The Loperot-1 well yielded a surprise when it encoun-
tered a second, deeper potential source interval called the
Loperot Shale Member, of questionable Eocene to Oligo-
cene age (Morley et al., 1999; Fig. 1(B)). The Loperot Shale
Member is found between 2325 and 2950 m (T.D.), and in
comparison with the Lokhone Shale Member is a much less
discrete and less obvious shale package on the well logs
(Fig. 2(B)). The gamma ray and sonic logs are very ragged
(Fig. 2(B)), and suggest that silt- and sandstones occur
interbedded within the shale. The most organic-rich interval
lies between 2410 and 2600 m, with TOC values of between
0.2 and 3.3%. Burial has rendered the section highly mature
to post-mature for oil (R0 ¼ 1:1%; depth 2410–2600 m;
Morley et al., 1999; Fig. 4).
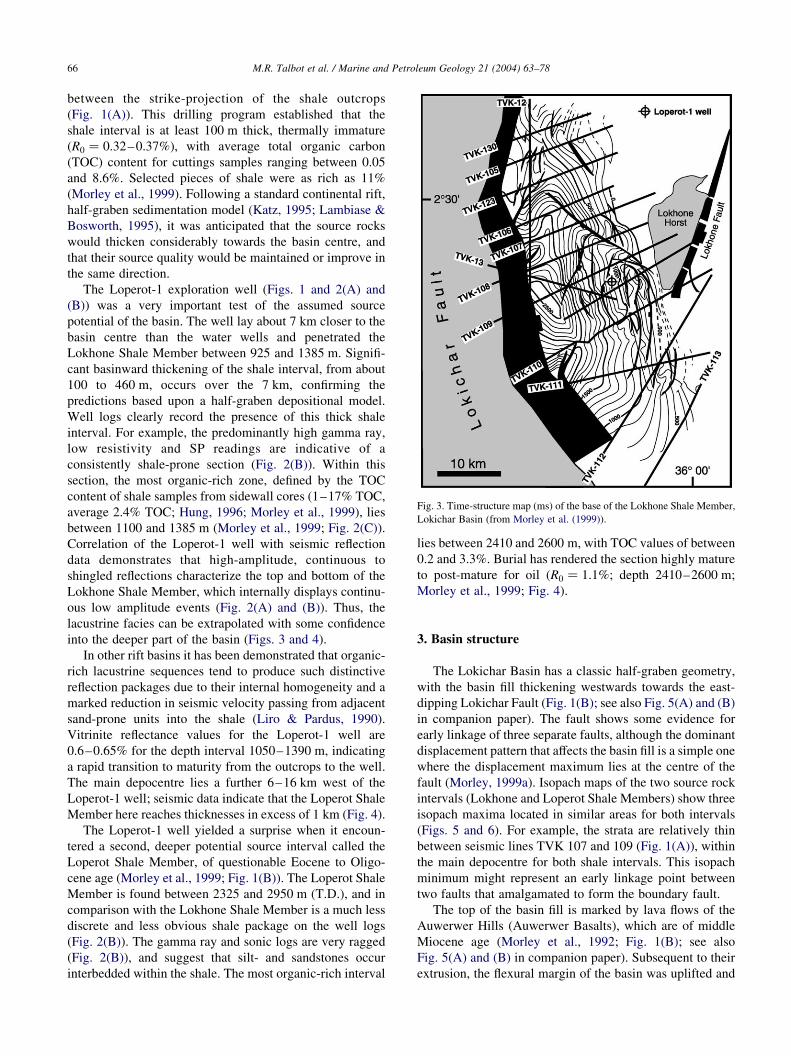
3. Basin structure
The Lokichar Basin has a classic half-graben geometry,
with the basin fill thickening westwards towards the east-
dipping Lokichar Fault (Fig. 1(B); see also Fig. 5(A) and (B)
in companion paper). The fault shows some evidence for
early linkage of three separate faults, although the dominant
displacement pattern that affects the basin fill is a simple one
where the displacement maximum lies at the centre of the
fault (Morley, 1999a). Isopach maps of the two source rock
intervals (Lokhone and Loperot Shale Members) show three
isopach maxima located in similar areas for both intervals
(Figs. 5 and 6). For example, the strata are relatively thin
between seismic lines TVK 107 and 109 (Fig. 1(A)), within
the main depocentre for both shale intervals. This isopach
minimum might represent an early linkage point between
two faults that amalgamated to form the boundary fault.
The top of the basin fill is marked by lava flows of the
Auwerwer Hills (Auwerwer Basalts), which are of middle
Miocene age (Morley et al., 1992; Fig. 1(B); see also
Fig. 5(A) and (B) in companion paper). Subsequent to their
extrusion, the flexural margin of the basin was uplifted and
Fig. 3. Time-structure map (ms) of the base of the Lokhone Shale Member,
Lokichar Basin (from Morley et al. (1999)).
M.R. Talbot et al. / Marine and Petroleum Geology 21 (2004) 63–7866

Fig. 4. (A, B) Isopach maps for the Loperot and Lokhone Shale Members, based on extrapolation of seismic reflections bounding the units from the Loperot-1
well, creating time-structure maps of the horizons, depth converting the maps and deriving isopach maps from the time-structure maps. R0 contours are based
on the Loperot-1 well data, extrapolated to time-structure maps. (C) Burial history plots for the Loperot-1 well, and pseudo-well locations on seismic lines
using the depth to mapped horizons. See Fig. 1(A) for seismic lines location.
M.R. Talbot et al. / Marine and Petroleum Geology 21 (2004) 63–78 67

eroded. This erosional event might be due to footwall uplift
in response to late Miocene–Pliocene motion on the
Lokhone Fault (which bounds the North Kerio Basin on
the eastern side of the Lokhone Horst; Fig. 1(A)). The
amount of uplift can be estimated from extrapolation of
seismic horizons, and suggests about 650 m of erosion.
Maturity data from the Loperot-1 well also indicate that
erosion has occurred. Assuming the normal vitrinite
reflectance value at the Earth’s surface is 0.2% (Dow,
1977), and considering a geothermal gradient value of
4.2 8C/100 m in this area, extrapolation of the subsurface
vitrinite reflectance values to the 0.2% value indicates about
600 m of uplift has occurred.
4. The Lokichar black shales
Cleaned cuttings from three shale intervals in the
Loperot-1 well were sampled at depths of 925–1385 m
(corresponding to the Lokhone Shale Member), 1770–
1818, and 2325–2950 m (Loperot Shale Member) at the
National Oil Corporation of Kenya laboratory, Nairobi, in
December 1998. These three units are informally named the
‘Lower’, ‘Intermediate’ and ‘Upper’ Black Shale Intervals,
Fig. 5. Regional isopach map (grey shaded area) for the Lokhone Shale
Member in the Lokichar Basin (contours in km), illustrating the structural
configuration of the west Turkana area during the late Oligocene–early
Miocene. Contours in the North Kerio Basin show estimated thickness of
Palaeogene–middle Miocene section in km. The extent of the Lokhone
Shale Member was limited to the north by an extensive region of
Oligocene–early Miocene volcanics, and the termination of the Lokichar
Fault at an inferred convergent overlapping transfer zone, with the
boundary fault to the Lothidok Basin. To the north-east, the Lokhone Shale
Member probably extended into the North Kerio Basin.
Fig. 6. Isopach map (grey shaded area, contours in km) for the Loperot
Shale Member. The Loperot Shale Member is restricted to the Lokichar
Basin. Changes in isopach thickness within the basin and the hanging wall
splays from the Lokichar Fault suggest the fault linkage and segmentation
pattern influenced the subsidence pattern during Loperot Shale Member
deposition. Areas of unshaded contours show estimated thickness of
Palaeogene–middle Miocene section in km.
M.R. Talbot et al. / Marine and Petroleum Geology 21 (2004) 63–7868

respectively (Fig. 6(A)). In addition, green, dark grey and
black shales were sampled in the Lokichar Basin near
Lokhone (lat. 02823.0050N; long. 35855.8500E; Fig. 1(A)).
TOC values from the well cuttings and field samples were
obtained using RockEval pyrolysis at the Institut Francais
du Petrole. Data are summarised in Table 1. Palynofacies
studies were performed at the Laboratory of Micropaleon-
tology, UMR 6538 ‘Domaines Oceaniques’ in Brest.
4.1. Organic matter content and hydrocarbon source
potential
TOC values for the exposed shales near Lokhone are
uniformly low (,1%), in agreement with the values cited
by Morley et al. (1999). Values obtained on our samples
(cuttings) of the Lokhone Shale Member from the Loperot-1
well range from 0.1 to 7.15% TOC. However, values of up
to 17% are cited for selected samples from sidewall cores in
the well (Morley et al., 1999; Fig. 2(C)). High TOC contents
(.1%) are largely confined to the depth interval between
1130 and 1385 m (Lokhone Shale Member), and a thin
interval with 2% average TOC just above 2500 m (within
the Loperot Shale Member; Fig. 7(A)). Hydrogen Indices
(HI) vary from ,90 to 611. A few relatively high HI values
(.300) were obtained from samples with very low TOC
content (,0.2%). As HI determinations from rocks with
such low organic matter (OM) contents are known to be
unreliable (Peters, 1986), these results were rejected. Shales
with HI suggesting moderate to good oil source potential
(.300) all occur in the high TOC section of the Loperot-1
well (between 1130 and 1385 m; Lokhone Shale Member;
Fig. 7(B)). This is confirmed by source rock quality as
measured by the petroleum potential, S2: Many samples
from the OM-rich section have S2 . 5 and several exceed
S2 ¼ 10 mg HC gm21 rock, indicating good to very good
source quality (Peters, 1986).
More detailed insight into the HC potential is provided
by plotting TOC versus S2 (Langford & Blanc-Valleron,
1990). Fig. 7(D) shows that the OM-rich samples define one
highly correlated ðr ¼ 0:99Þ linear population, while a
second group is defined by samples with very low S2 and
low to moderate TOC. The slope of each line represents the
mean HI of the two groups and in the case of the HC-rich
shales indicates that the pyrolizable OM is today still highly
oil-prone with a mean HI of 670 (this mean is higher than
any of the measured HI values because it defines the
character of the pyrolizable fraction. Individual HI values
are influenced by the presence of dead carbon with no
generation potential). The most OM-rich horizons within
this group represent high-quality oil source rocks, and as the
section as a whole is of the order of 300 m thick (Fig. 7(A)),
this interval clearly represents a potentially major source of
hydrocarbons within the Lokichar Basin. The second OM
population has a very low HI (mean ca. 90), with
insignificant oil source potential.
A further parameter of significance to potential
hydrocarbon production is the maturity. One measure of
source-rock maturity is provided by the RockEval Tmax
(Peters, 1986; Tissot & Welte, 1984). The main shale
section has a Tmax of 438–452 8C (Table 1; Fig. 7(C)) and
the lower, HC-poor shales a Tmax mainly in the range of
463–478 8C, with one measurement of 523 8C (Table 1;
Fig. 7(C)), suggesting the presence of reworked or highly
degraded OM. Both sets of Tmax are in generally good
agreement with vitrinite reflectances ðR0Þ of 0.6–0.65
between 1050 and 1390 m, and 1.1 between 2410 and
2600 m (Shell Exploration and Production Kenya B.V.,
unpublished report). The maturity of the OM-rich shales is
relatively high in relation to their present burial depth
(1.0–1.4 km), suggesting either a recent period of uplift or
above-average heat flow in the region, or a combination of
both. The latter is certainly a possibility, given the magma-
rich rift setting (see below) and a modern geothermal
Table 1
RockEval data for shale samples (cleaned cuttings) from the Loperot-1 well
sampled at the National Oil Corporation of Kenya laboratory, Nairobi (see
text and Fig. 7 for further details)
Depth (m) TOC (wt%) S1 S2 S3 Tmax HI OI
1062 0.04 0 0.13 0.18 531 321 438
1074 0.17 0 0.11 0.24 438 63 143
1086 0.73 0.01 0.97 0.49 444 134 68
1098 0.51 0 0.57 0.16 446 111 32
1104 0.84 0.01 1.52 0.35 444 181 41
1128 1.22 0.02 3.76 0.27 447 308 22
1140 1.2 0.01 3.37 0.34 446 281 28
1152 2.3 0.02 9.42 0.54 449 409 23
1164 5.21 0.18 31.65 0.7 445 607 13
1170 7.15 0.41 43.54 0.73 444 609 10
1188 4.38 0.18 20.73 0.71 443 473 16
1206 1.81 0.04 6.01 0.61 448 332 34
1224 3.42 0.2 16.39 0.14 444 479 4
1236 2.35 0.11 8.68 0.37 446 369 16
1242 3.51 0.12 15.19 0.73 446 433 21
1254 1.3 0.03 2.54 0.67 444 195 51
1266 2.78 0.1 13.67 0.72 451 492 26
1278 3.32 0.22 20.3 0.63 447 611 19
1290 1.26 0.11 3.3 0.89 443 261 71
1314 1.93 0.11 8.67 0.69 451 448 36
1326 3.5 0.2 20.9 0.75 452 596 21
1338 1.3 0.04 4.25 0.65 448 327 50
1350 0.55 0.02 0.84 1.00 448 153 182
1380 1.21 0.03 3.98 0.6 448 328 50
1770 0.24 0.01 0.49 0.1 451 208 42
1776 0.41 0.02 0.57 1.16 447 139 283
1809 0.6 0.15 0.67 0.31 462 113 52
1818 1.87 0.32 1.7 0.19 463 91 10
2487 2.05 0.38 1.9 0.59 463 93 29
2496 1.38 0.2 1.16 0.42 463 84 31
2499 0.5 0.06 0.32 0.19 465 63 38
2502 0.38 0.02 0.22 0.48 478 59 126
2607 0.33 0.02 0.18 0.22 476 54 67
2613 0.2 0.02 0.1 0.18 465 49 87
2622 0.4 0.02 0.17 0.16 467 43 41
2847 0.35 0.04 0.24 0.13 459 69 37
2856 0.34 0.02 0.55 0.45 523 163 133
2862 0.12 0 0.76 0.02 471 644 14
M.R. Talbot et al. / Marine and Petroleum Geology 21 (2004) 63–78 69

Fig. 7. (A) Total organic carbon content of the ‘Upper’ (Lokhone), ‘Intermediate’, and ‘Lower’ (Loperot) black shale intervals in the Loperot-1 well. Samples
are cleaned cuttings provided by National Oil Corporation of Kenya (see Table 1). (B) Hydrogen Index (HI) versus depth for shales in the Loperot-1 well.
Shales with good oil source potential are confined to the depth interval between 600 and 1100 m (‘Upper’ Lokhone interval). (C) Tmax versus depth in the
Loperot-1 well. (D) Plot of total organic carbon (TOC) versus RockEval S2 for shales from the Loperot-1 well. Note the two very different, but highly
correlated populations, one rich in oil-prone organic matter, the other of no significance as a hydrocarbon source rock. For comparison, similar plots are shown
for core MPU-10 taken from a water depth of 443 m in the southern basin of Lake Tanganyika (Mondeguer, 1991), and core M98-3P from 392 m water depth in
the northern basin of Lake Malawi (Barry, Filippi, Talbot, & Johnson, 2002) (RockEval data for Lakes Malawi and Tanganyika from Talbot et al., in
preparation). (E) Hydrogen Index versus Tmax plot showing RockEval data from the Lokhone Shale Member (solid squares) and Loperot Shale Member (open
squares) in the Loperot-1 well. Curves I–III show the maturation trajectories for, respectively, Types I–III kerogens. Also plotted are corresponding data from
OM in modern African lake sediments (Filippi & Talbot, in press; Talbot & Lærdal, 2000; Talbot et al., in preparation). The field defined by the latter represents
the range of likely precursor compositions for OM that accumulated in the Lokichar palaeolake. Extrapolation to the immature precursors (arrows) suggests
that some of the Lokhone Shales were extremely rich in oil-prone OM at the time of deposition (see text for further discussion). Kerogen trajectories and
vitrinite ðR0Þ contours courtesy of Birger Dahl (personal communication, 2003).
M.R. Talbot et al. / Marine and Petroleum Geology 21 (2004) 63–7870

gradient in the well of 42 8C km21. The oil window is
conventionally regarded as beginning at a Tmax of 430–
435 8C (Peters, 1986; Tissot & Welte, 1984), the shales can
thus be regarded as mature with respect to oil generation, a
Tmax of 438–452 8C suggesting that they are probably
close to their maximum generative capacity (Tissot &
Welte, 1984). Evidence of possible oil generation from the
Loperot shales was provided by traces of oil encountered at
several levels in the Loperot-1 well (Shell Exploration and
Production Kenya B.V., unpublished report), although
geochemical fingerprinting would be required to confirm
the source. The deeper shale section is already close to the
point of transition from oil to wet gas generation (Peters,
1986).
Despite being close to peak generation today, the upper
(Lokhone) shale member still has relatively high HI,
implying that it was probably extremely rich in oil-prone
OM when it entered the oil window (see discussion on
kerogen types below). It is thus probable that significant
volumes of liquid hydrocarbons have already been gener-
ated from this unit. In addition, today’s moderate to high HI
indicates that the unit still has considerable generative
potential. The lower unit lacks significant potential today,
and even when its high maturity is taken into account (see
below), it seems likely that it never had the oil-generation
capacity of the upper shale.
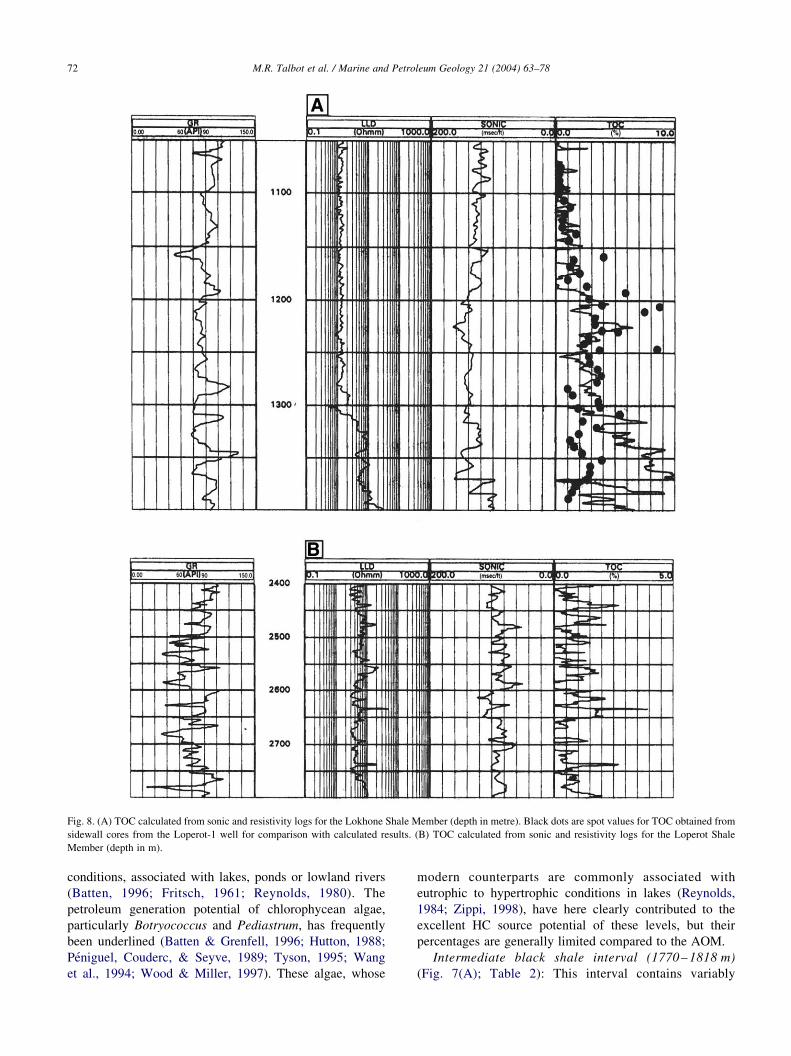
4.2. Use of well logs to calculate TOC content
The response of sonic velocity to OM content and the
resistivity response to the level of maturation can be used to
estimate TOC content of source intervals. The method
proposed by Passey, Creaney, Kulla, Moretti, and Stroud
(1990) was applied to the log data for the Loperot-1 well, to
test the method against the Lokhone Shale Member where
the TOC content has been measured, and to estimate the
TOC content of the Loperot Shale Member which was not
cored (Fig. 8). Gamma ray, sonic and resistivity logs were
digitized and scaled to 100 m/s/ft per two logarithmic
cycles. According to the method of Passey et al. (1990), the
TOC content is proportional to the separation Dlog R
between the sonic and resistivity logs:
Dlog R ¼ log10ðR=RbaselineÞ þ 0:02ðDt 2 DtbaselineÞ
where Rbaseline and Dtbaseline are the values of the fine-grained
non-source rocks chosen after superimposing the two logs:
Dtbaseline ¼ 127 ms=ft; Rbaseline ¼ 1:2 Vm: Then, the TOC
values were calculating using:
TOC ¼ ðDlog RÞ £ 10ð2:29720:1688£LOMÞ
where LOM is the level of maturation.
Based on the available vitrinite reflectance values, LOM
was chosen as 8.5 for the Lokhone Shale Member. The
calculated values were calibrated with the TOC data from
sidewall cores from the Loperot-1 well, and resulted in a
good match. The separation of calculated TOC and sidewall
core data below 1325 m (Fig. 8) is probably due to the poor
quality of the resistivity curve over that interval. The
Loperot Shale Member is a less discrete shale interval than
the Lokhone Shale Member, with more numerous sandy and
silty intervals. The organic-rich interval of the shale lies
between 2410 and 2600 m. It has relatively low TOC
content (0.2–3.3%) estimated from cuttings only, and has a
vitrinite reflectance ðR0Þ of 1.1.
Calculation of the TOC from sonic and resistivity logs
for the Loperot Shale Member was conducted using the
following values: Dtbaseline ¼ 90 ms=ft; Rbaseline ¼ 3 Vm;
LOM ¼ 12. The calculated TOC values shows the high
TOC intervals tend to be narrow bands 10–30 m thick that
spike to values of about 2–3% TOC. Some high TOC
intervals are calculated to be present below 2600 m. The
average log-calculated TOC values are 4.5% for the Loperot
Shale Member and 1.2% for the Lokhone Shale Member.
However, the 4.5% value for the Loperot Shale appears to
be an overestimate due to the problems with the poor quality
logs over the lower interval of the shale (Fig. 8).
Consequently, when log calculated values for the upper
part of the interval are combined with average sidewall core
values for the lower part of the interval, the average TOC for
the shales is 2.4%.
4.3. Palynofacies analysis
Palynofacies analyses were performed on cleaned cut-
tings from the three ‘black shale’ intervals identified in the
Loperot-1 well, in relation to the study of potential source
rocks (Fig. 2(B)). In addition, the Lokhone surface samples
(near the Lokhone Horst at lat. 02823.0050N and long.
35855.8500E; Fig. 1(A)) have also been analysed. Optical
studies were carried out on kerogen separated by standard
palynological techniques and provide the following results:
Upper black shale interval (Lokhone Shale Member:
920–1385 m) (Fig. 7(A); Table 2): the upper part of this
interval (920–1164 m) is characterized by mixed palyno-
facies with abundant palynomacerals (cuticle, woody
fragments), exoskeleton remains, and structureless OM,
associated with spores and pollen. The OM is yellow in
colour and very well preserved. The palynofacies is
consistent with the correspondingly low TOC values
(0.04–0.7%; Fig. 7(A); Table 2). From 1164 to 1385 m,
the organic facies is dominated by amorphous organic
matter (AOM; Table 2), with proportions that follow the
relatively high TOC content (Fig. 7(A)), and are thus
consistent with a good HC source potential. Some
fluctuations in the TOC content at the base of this interval
(1290–1385 m; Fig. 7(A); Table 2) may reflect variations in
the abundance of preserved OM versus the volume of
siliciclastic sediment. The unstructured OM is accompanied
by fungal remains, multicellular algae, Botryococcus spp.
(Fig. 9(A)), Pediastrum spp. (Fig. 9(B)), and some cysts of
Prasinophycean algae (Fig. 9(C)). Pediastrum as well as
Botryococcus are unequivocal indicators of fresh water
M.R. Talbot et al. / Marine and Petroleum Geology 21 (2004) 63–78 71
conditions, associated with lakes, ponds or lowland rivers
(Batten, 1996; Fritsch, 1961; Reynolds, 1980). The
petroleum generation potential of chlorophycean algae,
particularly Botryococcus and Pediastrum, has frequently
been underlined (Batten & Grenfell, 1996; Hutton, 1988;
Peniguel, Couderc, & Seyve, 1989; Tyson, 1995; Wang
et al., 1994; Wood & Miller, 1997). These algae, whose
modern counterparts are commonly associated with
eutrophic to hypertrophic conditions in lakes (Reynolds,
1984; Zippi, 1998), have here clearly contributed to the
excellent HC source potential of these levels, but their
percentages are generally limited compared to the AOM.
Intermediate black shale interval (1770 – 1818 m)
(Fig. 7(A); Table 2): This interval contains variably
Fig. 8. (A) TOC calculated from sonic and resistivity logs for the Lokhone Shale Member (depth in metre). Black dots are spot values for TOC obtained from
sidewall cores from the Loperot-1 well for comparison with calculated results. (B) TOC calculated from sonic and resistivity logs for the Loperot Shale
Member (depth in m).
M.R. Talbot et al. / Marine and Petroleum Geology 21 (2004) 63–7872
degraded, dispersed AOM, with locally abundant pyrite and
associated heavy minerals, and disseminated structured
elements (Fig. 9(E)). Terrestrial microfossils (spores and
pollen) are more abundant than in the overlying interval,
and TOC content is very low.
Lower black shale interval (Loperot Shale Member:
2325–2950 m) (Fig. 7(A); Table 2): Samples from this
lower interval contain abundant AOM (Fig. 9(F)),
although it is less important in volume compared to the
upper black shale interval. The palynofacies are also rich
in fresh water coenobial algae, fungal spores and hyphae,
and few spores and pollens (Fig. 9(G) and (H)). The
dominance of Pediastrum and Botryococcus, together
with abundant AOM in the palynomorph assemblages at
2418 m, is an indication of eutrophication. These algae
can have contributed to the generation of hydrocarbons,
but the OM in this interval is at a higher level of
maturity, probably corresponding to a stage of gas
generation (Fig. 9(H)). This observation is clearly
corroborated by the RockEval data (Fig. 7(E)).
Outcrop samples. The surface samples collected at
Lokhone (Fig. 1(A)) belong to the upper Lokhone Shale
Member. They contain degraded AOM with few structured
elements. One sample has a palynofacies dominated by
small spores and organic fragments of uniform size,
suggesting sorting during transport and deposition. The
OM appears to be slightly degraded.
4.4. Kerogen types
A mean HI of 670 for the OM-rich shales suggests a Type
I/II composition for the productive kerogen (Cornford,
1990). Their TOC versus S2 character compares well with
phytoplankton-dominated OM assemblages accumulating
in some large modern rift lakes such as Lakes Tanganyika
and Malawi (Fig. 7(D)), suggesting the existence of a
similar water body in the Lokichar Basin at the time of
source rock accumulation. Palynofacies analysis reveals
relatively abundant remains of the green algae Pediastrum
and Botryococcus, both of which are prominent components
of the phytoplankton flora in many of the modern African
rift lakes (Hecky & Kling, 1987), and are relatively common
in sediments that accumulated during Pleistocene–Holo-
cene dilute phases in some East African lakes such as Lakes
Bogoria and Victoria (Grall, 2000; Talbot, 1988; Talbot &
Lærdal, 2000; Tiercelin, Perinet, Le Fournier, Bieda, &
Robert, 1982; Tiercelin & Vincens, 1987; see Fig. 1 in
companion paper). Further insights into the probable nature
of the original OM can be obtained by plotting HI against
Tmax and then extrapolating along the probable maturation
trend back to the precursor OM (Fig. 7(E)). As a baseline for
the likely starting material we have used late Pleistocene to
recent OM in sediments from modern African lakes (Filippi
& Talbot, in press; Talbot & Lærdal, 2000; Talbot, Lærdal,
Jensen, & Filippi, submitted; Fig. 7(C)), which probably
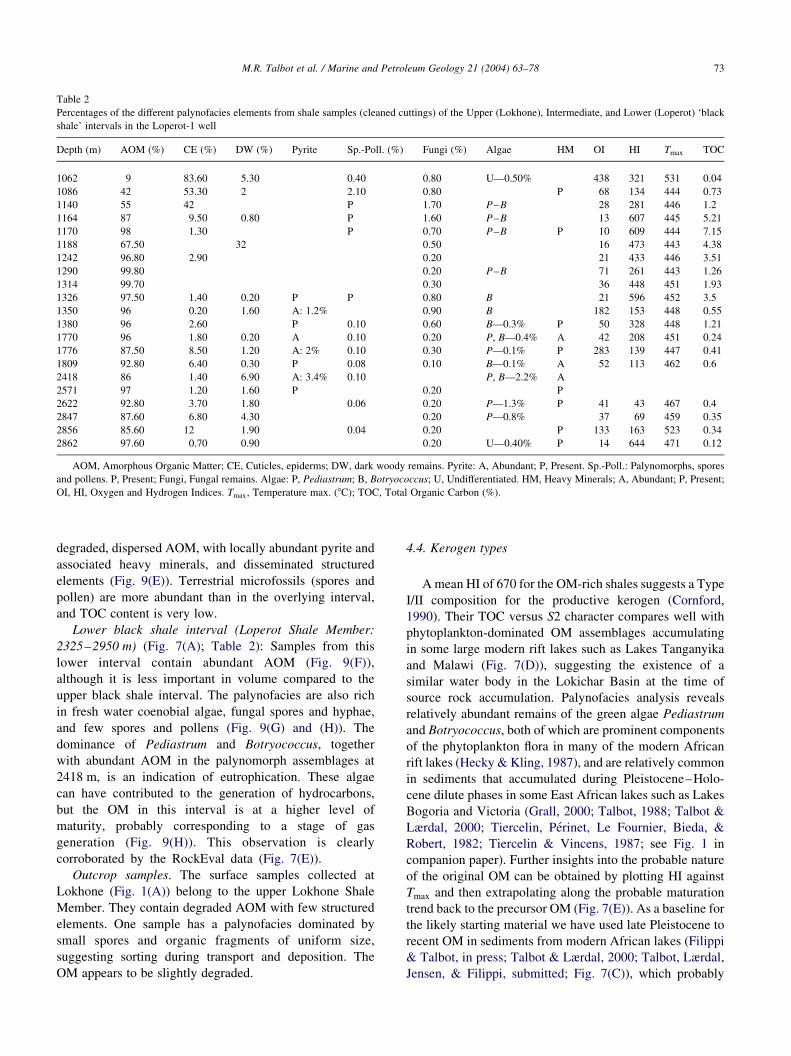
Table 2
Percentages of the different palynofacies elements from shale samples (cleaned cuttings) of the Upper (Lokhone), Intermediate, and Lower (Loperot) ‘black
shale’ intervals in the Loperot-1 well
Depth (m) AOM (%) CE (%) DW (%) Pyrite Sp.-Poll. (%) Fungi (%) Algae HM OI HI Tmax TOC
1062 9 83.60 5.30 0.40 0.80 U—0.50% 438 321 531 0.04
1086 42 53.30 2 2.10 0.80 P 68 134 444 0.73
1140 55 42 P 1.70 P–B 28 281 446 1.2
1164 87 9.50 0.80 P 1.60 P–B 13 607 445 5.21
1170 98 1.30 P 0.70 P–B P 10 609 444 7.15
1188 67.50 32 0.50 16 473 443 4.38
1242 96.80 2.90 0.20 21 433 446 3.51
1290 99.80 0.20 P–B 71 261 443 1.26
1314 99.70 0.30 36 448 451 1.93
1326 97.50 1.40 0.20 P P 0.80 B 21 596 452 3.5
1350 96 0.20 1.60 A: 1.2% 0.90 B 182 153 448 0.55
1380 96 2.60 P 0.10 0.60 B—0.3% P 50 328 448 1.21
1770 96 1.80 0.20 A 0.10 0.20 P, B—0.4% A 42 208 451 0.24
1776 87.50 8.50 1.20 A: 2% 0.10 0.30 P—0.1% P 283 139 447 0.41
1809 92.80 6.40 0.30 P 0.08 0.10 B—0.1% A 52 113 462 0.6
2418 86 1.40 6.90 A: 3.4% 0.10 P, B—2.2% A
2571 97 1.20 1.60 P 0.20 P
2622 92.80 3.70 1.80 0.06 0.20 P—1.3% P 41 43 467 0.4
2847 87.60 6.80 4.30 0.20 P—0.8% 37 69 459 0.35
2856 85.60 12 1.90 0.04 0.20 P 133 163 523 0.34
2862 97.60 0.70 0.90 0.20 U—0.40% P 14 644 471 0.12
AOM, Amorphous Organic Matter; CE, Cuticles, epiderms; DW, dark woody remains. Pyrite: A, Abundant; P, Present. Sp.-Poll.: Palynomorphs, spores
and pollens. P, Present; Fungi, Fungal remains. Algae: P, Pediastrum; B, Botryococcus; U, Undifferentiated. HM, Heavy Minerals; A, Abundant; P, Present;
OI, HI, Oxygen and Hydrogen Indices. Tmax; Temperature max. (8C); TOC, Total Organic Carbon (%).
M.R. Talbot et al. / Marine and Petroleum Geology 21 (2004) 63–78 73

M.R. Talbot et al. / Marine and Petroleum Geology 21 (2004) 63–7874

provide close analogues to the sediments that accumulated
in the Lokichar palaeolake (see preceding discussion). This
baseline suggests that OM in much of the upper shale unit
had HI values that were over 600 and, at some levels, in
excess of 800 and was thus closer to a pure Type I kerogen
(Fig. 7(D)). The relatively high maturity of the deeper shales
precludes precise identification of their OM type from the
pyrolysis data alone, but the palynofacies analyses indicate
the presence of relatively abundant cuticle and woody
material in these rocks, suggesting a Type III kerogen, a
conclusion that is supported by the HI versus Tmax plot (Fig.
7(E)). Poor source potential in these intervals is thus
probably due to a dominance of highly degraded OM.
4.5. Basin temperature
The temperature at 2950 m, at the bottom of the Loperot-
1 well, was 149 8C (corrected), which using a surface
temperature of 25 8C, yields an average geothermal gradient
of 4.2 8C/100 m. Vitrinite reflectance values for the well are
as follows: 1050 m, R0% 0.6; 1110 m, R0% 0.64; 1390 m,
R0% 0.65; 2500 m, R0% 1.1, and suggest that about 650 m
of strata have subsequently been removed (see above). Heat
flow values from the Kenya Rift are highly variable,
generally ranging between 40 and 110 mW/m2, with
geothermal gradients between 2.5 and 6.6 8C/100 m
(Wheildon, Morgan, Williamson, Evans, & Swanberg,
1994). The Loperot-1 well indicates that the Lokichar
Basin today lies in the middle range of the data, however,
during the active rifting and volcanic phase, it is quite likely
that heat flow, and thus temperatures, were higher.
4.6. Generating potential of the basin
The high geothermal gradient and vitrinite reflectance
data gathered from the Loperot-1 well indicate the
following approximate depths of maturity for the basin:
1100 m early mature (0.5–0.8% R0); 2100 m mid-late
mature (0.8–1.2% R0); 2800 m overmature (.1.2% R0).
Using structure maps, derived from seismic data, of the
Loperot and Lokhone Shale Members, the volume of
source rock for the two intervals, at the different maturity
levels has been calculated. The results are as follows:
Loperot Shale Member, early mature 246 106 acre-ft; mid-
late mature 135.3 106 acre-ft; post-mature 38.7 106 acre-ft;
Lokhone Shale Member, early mature 13 106 acre-ft, mid-
late mature 46 106 acre-ft, post-mature 197 106 acre-ft.
Using an average value of S2 ¼ 5 mg HC gm21; and a
kinetic model based on Tissot and Espitalie (1975), the
potential generating capacity of the Lokhone Shale
Member (for the areas above if they were fully mature)
is estimated at 10.5 billion barrels. Given that about 40%
of the shale volume is at mid to post mature levels this
suggests the Lokhone Shale Member could have generated
about 4 billion barrels of oil.
5. Consequences of regional structure on source
rock-trap relationships
The presence of source rocks in the Lokichar Basin is
encouraging for exploration in Northern Kenya, however, it
is well established that in rifts thick, high-quality source
rocks can be restricted to a single half-graben basin. So what
do the Lokichar source rocks indicate about regional
prospectivity?
Despite the differences in maturity, the Lokichar Basin
source rocks have clear similarities with OM-rich sediments
that have accumulated during the Holocene in the deep,
offshore waters of Lakes Tanganyika and Malawi
(Fig. 7(D)). In both the latter examples, accumulation has
occurred below the chemocline in permanently anoxic
waters and it is likely that similar conditions prevailed
during deposition of at least the oil-prone population of
Lokichar samples. The OM-poor population with no
hydrocarbon potential (Fig. 7(D)) also has its analogues in
modern rift lakes and is typical of areas subject to fluvial
influence where highly degraded OM enters the lake
(Talbot, in preparation). In addition, the palynofacies
suggests a freshwater environment, conditions that are
also compatible with a lake basin similar to the modern,
hydrologically open giant rift lakes. Consequently, a strong
structural control on source-rock distribution in the
Lokichar Basin is implied, where displacement on the
boundary fault caused subsidence rates to outpace sediment
supply. The resulting accommodation space coupled with a
favourably humid climate (rainfall perhaps five times higher
than today) (Roche, 2002; Vincens, pers. comm.) enabled
the development of prolonged periods of deep anoxic
lacustrine conditions.
Fig. 9. Palynofacies elements from shale samples (cleaned cuttings) of the ‘black shale’ intervals in the Loperot-1 well. (A) Botryococcus brauni; size
69 £ 50 mm2, 1170 m, Loperot-1 well. (B) Pediastrum spp.; coenobium left 67 mm in diameter; right 33 mm in diameter, 1164 m, Loperot-1 well. (C)
Phycoma stage of Prasinophycean algae; Diameter 28 mm. Remark: Fossil Prasinophyceae are rarely associated with freshwater environments. Their presence
here could indicate a lagoonal/brackish environment, 1164 m, Loperot-1 well. (D) Palynofacies rich in AOM and containing also some fungal spores, cuticle
and membrane tissues; magnification approximately 200 £ , 1242 m, Loperot-1 well. (E) Palynofacies dominated by fluffy AOM and rich in framboidal pyrite.
Magnification approximately 200 £ . (F) Palynofacies dominated by grey particulate amorphous matter, with rare fungal remains and heavy minerals;
magnification approximately 200 £ , 2571 m, Loperot-1 well. (G) Palynofacies including brown woody remains, cuticle and other membranous tissues, AOM
and heavy minerals; magnification approximately 200 £ , 1776 m, Loperot-1 well. (H) Pediastrum spp.; coenobium left 75 mm in diameter. Compare with
photograph B for organic matter maturity. The brown colour indicates higher maturity than in the Upper (Lokhone) black shale interval in the well, 2622 m,
Loperot-1 well.
R
M.R. Talbot et al. / Marine and Petroleum Geology 21 (2004) 63–78 75

Despite the presence of two shale members separated by
fluvio-deltaic sediments close to the flexural margin of the
Loperot-1 well, it is likely that closer to the basin centre
these two shales merge into a thicker, vertically more
continuous sequence (Fig. 1(B)). The Loperot Shale
Member is not seen at outcrop, and is interpreted to onlap
the flexural margin west of the Lokhone Horst. Conse-
quently, the Loperot Shale Member was restricted to the
Lokichar Basin. The Loperot Shale Member lies deep in the
section, and formed at a relatively early stage in the basin
history, hence the early stage of fault linkage and
propagation is reflected in the limited distribution of the
Loperot Shale Member (Morley & Wescott, 1999—Chapter
13, Fig. 4). The early linkage of three faults is also reflected
in the presence of three isopach maxima near the
boundary fault, each coincident with splays in the Lokichar
Fault (Fig. 4).
The Lokhone Shale Member thins from about 460 m in
the Loperot-1 well to 100 m at outcrop near the Lokhone
Horst. The presence of source rocks so close to the (eroded)
flexural margin suggests that at least during one depositional
phase, presumably during a high stand of the Lokichar Lake,
anoxic lacustrine conditions extended eastwards into the
neighbouring North Kerio Basin (Fig. 5). This is encoura-
ging for extending hydrocarbon plays beyond the Lokichar
Basin. The northwards extent of the Lokhone Shale Member
is more problematic. During the Oligocene–lower Miocene,
the basin north of the Lokichar Basin, called the Lothidok
Basin, deepened eastwards (Morley et al., 1999; Fig. 1(A)).
The uplifted and eroded hanging wall of this basin, now
exposed in the Lothidok Hills (Figs. 1(A) and 5) reveals an
Oligocene–middle Miocene section dominated by volcanic
flows, pyroclastic and volcaniclastic rocks (Boschetto,
Brown, & McDougall, 1992). Consequently, the Lokhone
source rock interval passes northwards into a volcanic-
dominated sequence across a conjugate convergent transfer
zone, into the neighbouring Lothidok Basin. A major
volcanic centre lay at the northern margin of the Lothidok
Basin (Figs. 1(A) and 5). The final infilling phase of the
Lokichar Basin is marked by the presence of volcanic flows,
following the propagation of the volcanic centres to the
south, into the Napedet Hills area (Fig. 1(A)).
Accumulation of lacustrine source-rock precursors in the
Lokichar Basin was terminated by two effects: (1) the
development of volcanic centres just north of the Lokichar
Basin, and (2) a major structural reorganization of the region
in the middle–late Miocene. The southern part of the North
Kerio Basin, the Lokichar Basin and the Lothidok Basin all
became inactive in the middle Miocene. Active extension
switched to the North Lokichar Basin, the northern part of
the North Kerio Basin and the Turkana Basin (Morley et al.,
1999; Fig. 1). Consequently, new depocenters and new areas
of lacustrine sedimentation were established during the late
Miocene–Pliocene. No high-quality source rock intervals
related to these new depocenters have been identified in
outcropping late Miocene–Pliocene deposits in the Napedet
Hills or at Lothagam Hill (Fig. 1(A)). However, such
negative evidence does not eliminate the possibility of good
quality source rocks existing at depth, closer to the basin
depocenter, or offshore beneath Lake Turkana. Indeed the
Lokichar Basin suggests that such source rocks might occur
in the region.
The Lokichar Basin appears to be little affected by
inversion structures, which developed elsewhere in Western
Turkana during the Plio-Pleistocene (Morley, 1999b). This
late inversion occurred after subsidence ceased in the
Lokichar Basin during the middle Miocene. Hence hydro-
carbon generation and migration occurred before inversion.
Since inversion creates new traps and tends to destroy older
traps, the late timing of inversion could potentially have
destroyed older hydrocarbon accumulations and requires
late hydrocarbon generation to fill the inversion structures.
From this perspective, it is fortuitous for the petroleum
potential of the Lokichar Basin that the effects of inversion
are minimal.
6. Conclusions. Implications for exploration
The Lokichar Basin contains lacustrine shales, which
exhibit many of the characteristic features of source rocks
developed in continental rifts. The highest quality source
rock is the Lokhone Shale Member which accumulated in
freshwater, and is a Type I algal-prone source with an
average TOC of 2.4% (based upon well-log calculations and
sidewall cores) and containing intervals with up to 17%
TOC (Hung, 1996; Morley et al., 1999). Towards the
boundary fault, the Lokhone Shale Member probably attains
a maximum thickness of 1 km. The deeper Loperot Shale
Member has only marginal source potential, with an average
TOC of 1.2% from well-log calculation. Only one thin
interval at ca. 2500 m yielded high TOCs of around 2%. The
poorer quality of the lower potential source interval, while
partly due to higher maturity, is thought to be largely a result
of the basin evolution. The Loperot Shale Member was
restricted to the Lokichar Basin. Hence the lake was
relatively small (50-km long by 20-km wide), and the algal
OM subject to dilution by the influx of siliciclastics and
terrestrial plant material, as shown by palynofacies analysis
(Table 2). The Lokhone Shale Member was deposited
during a time when displacement on the boundary fault
system was greater, and adjacent basins had also been
established. Subsidence occurred over a broad area and
exceeded sediment supply, thus favouring the establishment
of a deep, anoxic waterbody, possibly similar to modern
Lakes Tanganyika or Malawi. Palaeoclimatic conditions
characterized by precipitation amounts that may have been
as much as five times higher than today (modern mean
annual precipitation is ca. 200 mm) (Roche, 2002; Vincens,
pers. comm.) also contributed to the development of a large,
deep freshwater body that extended into adjacent half-
graben basins, and was favourable to the development of
M.R. Talbot et al. / Marine and Petroleum Geology 21 (2004) 63–7876

Pediastrum, Botryococcus and other phytoplankton blooms.
The highest concentrations of algal material accumulated in
sediment-starved parts of the basin. Regional structure,
through its control of regional drainage networks, was
probably partly responsible for sediment starvation, but
dense vegetation cover (humid montane forest) in the
watershed, may also have reduced sediment input to the
basin, and thus dilution of the autochthonous OM.
The Lokichar Basin source rocks are important in
demonstrating the potential for some East African Rift
basins to have generated billions of barrels of oil from
geographically restricted, but thick lacustrine shale deposits,
analogous to the older but extremely prolific rift basins of
southern Sudan and Chad (Genik, 1993; Mohamed, Pearson,
Ashcroft, Iliffe, & Whiteman, 1999; Schull, 1988). In such
cases, tectonic control on source-rock distribution is a major
key, but prevailing palaeoclimatic conditions during the
development of the Lokichar Basin also clearly played a key
role in the generation of such an oil potential.
Acknowledgements
This study represents part of a cooperative program
conducted with the National Oil Corporation of Kenya
(NOCK), and funded by the 3D-3G Project supported by Elf
Petroleum Norge AS (grant No. 2231-01 ELF to J.-J.
Tiercelin) as well as grants from SUCRI-2E and UMR
CNRS 6538 ‘Domaines Oceaniques’, European Institute of
Marine Studies, University of Western Brittany. Research
authorization was provided by the Office of the President of
the Republic of Kenya. Special thanks to Institut Francais du
Petrole (IFP) for their help in the RockEval procedure. The
authors express their thanks to NOCK Managing Director
for permission to publish this work, and to Dr F.M. Mbatau,
NOCK Exploration and Production Manager, for scientific,
administrative and logistic support. Two anonymous
reviewers made a number of helpful suggestions, which
helped improve an earlier version of this paper. Special
thanks to B. Coleno for patient assistance with illustrations.
This is publication No. 150 of the International Decade of
East African Lakes (IDEAL) programme.
References
Barry, S., Filippi, M. L., Talbot, M. R., & Johnson, T. C. (2002).
Sedimentology and chronology of Late Pleistocene and Holocene
sediments from northern Lake Malawi. In E. O. Odada, & D. O. Olago
(Eds.), The East African great lakes: Limnology, palaeoclimatology and
biodiversity (pp. 369–391). Dordrecht: Kluwer Academic Publishers.
Batten, D. J. (1996). Colonial chlorococcales. In J. Jansonius, & D. C. Mc
Gregor (Eds.), Palynology: Principles and applications (pp. 191–203).
American Association of Stratigraphic Palynologists Foundation 1,
Chapter 7C.
Batten, D. J., & Grenfell, H. R. (1996). Botryococcus. In J. Jansonius, &
D. C. Mc Gregor (Eds.), Palynology: Principles and applications
(pp. 205–226). American Association of Stratigraphic Palynologists
Foundation 1, Chapter 7D.
Boschetto, H. B., Brown, F. H., & McDougall, I. M. (1992). Stratigraphy of
the Lothidok Range, northern Kenya, and K/Ar ages of its Miocene
primates. Journal of Human Evolution, 22, 47–71.
Cornford, C. (1990). Source rocks and hydrocarbons of the North Sea. In
K. W. Glennie (Ed.), Introduction to the petroleum geology of the North
Sea (pp. 294–361). Oxford: Blackwell.
Dow, W. G. (1977). Kerogen studies and geological interpretation. Journal
of Geochemical Exploration, 7, 77–99.
Filippi, M. L., & Talbot, M. R. (in press) Lake Malawi: The
palaeolimnology of the North Basin over the last 25 kA based upon
the elemental and stable isotopic composition of sedimentary organic
matter. Quaternary Science Reviews.
Fritsch, F. E. (1961) (Vol. 1). The structure and reproduction of the algae,
London: Cambridge University Press, p. 791.
Genik, G. J. (1993). Petroleum geology of Cretaceous–Tertiary rift basins
in Niger, Chad and Central African Republic. AAPG Bulletin, 77,
1405–1434.
Grall, M. (2000). Le lac Bogoria, Rift Central du Kenya: Reconstitution
paleogeographique et interet petrolier d’un bassin de rift a partir d’une
serie sedimentaire Pleistocene superieur-Holocene. DEA Universite de
Bretagne Occidentale, 49.
Harris, N., Pallister, J. W., & Brown, J. M. (1956). Oil in Uganda.
Geological Survey of Uganda, 9, 33.
Hecky, R. E., & Kling, H. J. (1987). Phytoplankton ecology of the great
lakes in the rift valleys of central Africa. Ergebnisse der Limnologie, 25,
197–228.
Hung, L. V (1996). Hydrocarbon generation assessment of Lokichar Basin,
Kenya. MSc Thesis, Universiti Brunei Darussalam, p. 85.
Hutton, A. C. (1988). The lacustrine Condor oil shale sequence. In A. J.
Fleet, K. Kelts, & M. R. Talbot (Eds.), (Vol. 40) (pp. 329–340).
Lacustrine petroleum source rocks, London: Geological Society
Special Publication.
Katz, B. J. (1995). A survey of rift basin source rocks. In J. J. Lambiase
(Ed.), (Vol. 80) (pp. 213–242). Hydrocarbon habitat in rift basins,
London: Geological Society Special Publication.
Lambiase, J. J., & Bosworth, W. (1995). Structural controls on
sedimentation in continental rifts. In J. J. Lambiase (Ed.), (Vol. 80)
(pp. 117–144). Hydrocarbon habitat in rift basins, London: Geological
Society Special Publication.
Langford, F. F., & Blanc-Valleron, M.-M. (1990). Interpreting Rock-Eval
pyrolysis data using graphs of pyrolizable hydrocarbons vs. total
organic carbon. AAPG Bulletin, 74, 799–804.
Liro, L. M., & Pardus, Y. C. (1990). Seismic facies analysis of fluvial-
deltaic lacustrine systems-Upper Fort Union Formation (Paleocene),
Wind River Basin, Wyoming. In B. J. Katz (Ed.), Lacustrine basin
exploration-case studies and modern analogues (pp. 225–242). AAPG
Memoir 50.
Mohamed, A. Y., Pearson, M. J., Ashcroft, W. A., Iliffe, J. E., & Whiteman,
A. J. (1999). Modeling petroleum generation in the southern Muglad rift
basin, Sudan. AAPG Bulletin, 83, 1943–1964.
Mondeguer, A (1991). Bassins sedimentaires en contexte extensif et
decrochant: L’exemple du ‘Complexe des fosses sud-Tanganyika, Rift
Est-africain’. Morphostructures et sedimentation. These Universite de
Bretagne Occidentale, p. 273.
Morley, C. K. (1999a). Marked along-strike variations in dip of normal
faults—the Lokichar fault, N. Kenya Rift: A possible cause for
metamorphic core complexes. Journal of Structural Geology, 21,
479–492.
Morley, C. K. (1999b). Tectonic inversion in East African rifts. In C. K.
Morley (Ed.), Geoscience of rift systems-evolution of East Africa (Vol.
44) (pp. 193–210). AAPG Studies in Geology.
Morley, C. K. (1999c). Comparison of hydrocarbon prospectivity in
rift systems. In C. K. Morley (Ed.), Geoscience of rift systems-
evolution of East Africa (Vol. 44) (pp. 233–242). AAPG Studies in
Geology.
M.R. Talbot et al. / Marine and Petroleum Geology 21 (2004) 63–78 77

Morley, C. K., & Wescott, W. A. (1999). Sedimentary environments and
geometry of sedimentary bodies determined from subsurface studies
in East Africa. In C. K. Morley (Ed.), Geoscience of rift systems-
evolution of East Africa (Vol. 44) (pp. 211–231). AAPG Studies in
Geology.
Morley, C. K., Wescott, W. A., Stone, D. M., Harper, R. M., Wigger, S. T.,
& Karanja, F. M. (1992). Tectonic evolution of the northern Kenyan
Rift. Journal of the Geological Society, London, 149, 333–348.
Morley, C. K., Wescott, W. A., Stone, D. M., Harper, R. M., Wigger, S. T.,
Karanja, F. M., & Day, R. A. (1999). Geology and geophysics of the
western Turkana basins. In C. K. Morley (Ed.), Geoscience of rift
systems-evolution of East Africa (Vol. 44) (pp. 19–54). AAPG Studies
in Geology.
Passey, Q. R., Creaney, S., Kulla, J. B., Moretti, F. J., & Stroud, J. D.
(1990). A practical model for organic richness from porosity and
resistivity logs. AAPG Bulletin, 74, 1777–1794.
Peniguel, G., Couderc, R., & Seyve, C. (1989). Les microalgues actuelles et
fossiles. Interet stratigraphique et petrolier. Bulletin des Centres de
Recherches Exploration-Production Elf Aquitaine, 13, 455–482.
Peters, K. E. (1986). Guidelines for evaluating petroleum source rocks
using programmed pyrolysis. AAPG Bulletin, 70, 318–329.
Renaut, R. W., Ego, J., Tiercelin, J.-J., Le Turdu, C., & Owen, B. (1999).
Saline, alkaline palaeolakes of the Tugen Hills-Kerio Valley region,
Kenya Rift Valley. In P. Andrews, & P. Banham (Eds.), Late cenozoic
environments and hominid evolution: A tribute to bill bishop (pp.
41–58). London: Geological Society.
Reynolds, C. S. (1980). Phytoplankton assemblages and their periodicity in
stratifying lake systems. Holartic Ecology, 3, 61–159.
Reynolds, C. S. (1984). The ecology of freshwater phytoplankton,
Cambridge: Cambridge University Press, p. 384.
Roche, H. (2002). Paleoenvironnement des Hominides Mio-Plio-Pleisto-
cenes en Afrique Centrale et Orientale. Colloque ECLIPSE (Envir-
onnement et Climat du Passe: Histoire et Evolution), Paris, October
21–22, 2002.
Schull, T. J. (1988). Rift basins of interior Sudan: Petroleum exploration
and discovery. AAPG Bulletin, 72, 1128–1162.
Simoneit, B. R. T., Aboul-Kassim, T. A. T., & Tiercelin, J.-J. (2000).
Hydrothermal petroleum from lacustrine sedimentary organic matter in
the East African Rift. Applied Geochemistry, 15, 355–368.
Talbot, M. R. (1988). The origins of lacustrine oil source rocks: Evidence
from the lakes of tropical Africa. In A. J. Fleet, K. Kelts, & M. R. Talbot
(Eds.), (Vol. 40) (pp. 29–43). Lacustrine petroleum source rocks,
London: Geological Society Special Publication.
Talbot, M. R., & Lærdal, T. (2000). The Late Pleistocene–Holocene
palaeolimnology of Lake Victoria, East Africa, based upon elemental
and isotopic analyses of sedimentary organic matter. Journal of
Paleolimnology, 23, 141–164.
Talbot, M. R., Lærdal, T., Jensen, N. -B., & Filippi, M. -L. The geochemical
signature of major transgressions in giant lakes. Geochemical et
Cosmochimica Acta, submitted.
Talbot, M. R., Tiercelin, J.-J., Filippi, M.L., Jensen, N.B., Lærdal, T., &
Øvstedal, B. (in preparation). Sedimentary organic matter in the rift
lakes of East Africa: Sources, Accumulation and Palaeo environmental
Significance.
Tiercelin, J.-J., Perinet, G., Le Fournier, J., Bieda, S., & Robert, P. (1982).
Lacs du rift est-africain, exemples de transition eaux douces-eaux
salees: Le lac Bogoria, rift Gregory, Kenya. Memoire Societe
geologique de France, 64, 217–230.
Tiercelin, J.-J., Pflumio, C., Castrec, M., Boulegue, J., Gente, P., Rolet, J.,
Coussement, C., Stetter, K. O., Huber, R., Buku, S., & Mifundu, W.
(1993). Hydrothermal vents in Lake Tanganyika, East African Rift
System. Geology, 21, 499–502.
Tiercelin, J.-J., & Vincens, A. (1987). Le demi-graben de Baringo-Bogoria,
Rift Gregory, Kenya. 30000 ans d’histoire hydrologique et sedimen-
taire. Bulletin des Centres de Recherches Exploration-Production Elf
Aquitaine, 11, 249–540.
Tissot, B., & Espitalie, J. (1975). L’evolution thermique de la matiere
organique des sediments: Applications d’une simulation mathematique.
Revue de l’Institut Francais du Petrole, 5(IFT-75023), 743–777.
Tissot, B. P., & Welte, D. H. (1984). Petroleum formation and occurrence,
Berlin: Springer, p. 699.
Tyson, R. V. (1995). Sedimentary organic matter. Organic facies and
palynofacies, London: Chapman & Hall, p. 615.
Wang, K.-F., Zhang, Y.-L., Wu, G.-X., Li, Y.-Y., He, C., & Zhang, H.-S.
(1994). Study on the thermal simulation for generating oil by
Pediastrum. Journal of Thonghi University, 22(2), 184–191.
Wheildon, J., Morgan, P., Williamson, K. H., Evans, T. R., & Swanberg,
C. A. (1994). Heat flow in the Kenya Rift zone. Tectonophysics, 236,
131–149.
Wood, G., & Miller, M. (1997). Stratigraphic, paleoecologic and petroleum
generating significance of Chlorophyta (chlorococcalean algae) in the
Cretaceous of Western Africa and South America. Africa Geoscience
Review, 4, 499–510.
Zippi, P. A. (1998). Freshwater algae from the Mattagami Formation
(Albian), Ontario: Paleoecology, botanical affinities, and systematic
taxonomy. Micropaleontology, 44, 1–78.
M.R. Talbot et al. / Marine and Petroleum Geology 21 (2004) 63–7878