hydraulic performance of improved irrigation system
TRANSCRIPT

296
Journal of Engineering Sciences
Assiut University
Faculty of Engineering
Vol. 47
No. 3
May 2019
PP. 296–308
* Corresponding author.
E-mail address: [email protected]
HYDRAULIC PERFORMANCE OF IMPROVED IRRIGATION SYSTEM
Hassan I. Mohamed 1, Wael Elham
2, Mostafa Samir
3, Mahmoud Sabry
4
1, 2, 3 Civil Eng. Department, Assiut University
4Ministry of Water Resources and Irrigation
Received 26 December 2018; Accepted 21 January 2019
ABSTRACT
Irrigation canals network in Egypt for all levels suffer from water deficit and un-equitable
distribution of irrigation water among beneficiaries. So, its modernization became omnipresent to
overcome the problem of water shortage by the end of canals. One of the improvement sectors of
irrigation canals network is replacing an earthen mesqa by upraised lines or buried pipes. The
hydraulic performance of the improved irrigation system is explored using a case study canal, where
buried pipes system is applied as improved mesqa system. The case study is for the Hadaya canal
which is one of the distributary canals that located in Assiut governorate. This canal services 19
mesqas with different lengths and area served. The hydraulic performance of mesqas is examined
through different scenarios of operation of the mesqa pumping station and area served. Three scenarios
of mesqa valves operation are considered .The first scenario is when all valves are operated at the
same time all over the week. The second is when one valve operates for two days per week and the
third is when all valves operate for one day. Also, three scenarios are considered for pump operation
14, 16 and 18 hours per day. Moreover, effect of different scenarios of mesqa operation on sudden
transition of flow in pipes due to pump shut-down is studied. EPANET software was used for the
hydraulic analysis. It was found that operating the pump 14 hours per day fulfill the minimum monthly
cost. Also, operating the outlet valves according to scenario no. (3) gives the least operating cost. The
maximum velocity in the pipeline is less than 1.2 m/s for all operating scenarios. Besides, effects of
mesqas off-takes on the flow in distributary canal are studied.
Keywords: improved mesqa, surface irrigation, distributary canal.
1. Introduction
The old land which is irrigated by surface irrigation is estimated as 79% of all agricultural
areas in Egypt. So, it is very important to improve the irrigation system in this area by
increasing the irrigation efficiency. Egypt began the improvements of tertiary canals (mesqas)
at the nineteen’s of the last century. The improvements process includes changing rotational
supply to continuous supply, upstream flow control to downstream flow control, Depeweg and
Bekeit [1]. There are three alternatives for old mesqa replenishment, the first is pipeline mesqa,
the second is open channel raised mesqa and the third one is improved mesqa.

297
Et al., Hydraulic performance of improved irrigation system
Depeweg and Bekeit [1] assessed the three alternatives on the basis of adequacy,
reliability, equity and efficiency. They showed that the pipeline and the improved mesqa
are compatible and they are recommended above the raised mesqa. They indicated that
differences in field ditch discharges of 30% to 40% may occur between the first and last
valve (or turn-out), even if all valves/ turn-outs have the same opening. Long pipeline
mesqas have large difference in working head between the head and end valves, resulting
in an unequal water distribution. Using buried pipes mesqa can save agricultural land in the
range from 2.74% to 2.067% according to Saad Eddin et al. [14]. Radwan [12] mentioned
that the average annual water saving from improved on-farm irrigation projects is about
4.67 billion cubic meters.
Radwan et al. [8] developed a program for design and calculating the total cost of the
improved pipe irrigation system using variable control parameters which can be changed
by the user. They detected the effect of design velocity on each of the cost items and the
contribution of each item’s cost on the total system cost. It was found that the contribution
of pipeline cost, pumping station and civil work’s cost, pump set cost, and fill cost on the
total cost is 47%, 29%, 14%, and 10% respectively.
Radwan et al. [9] mentioned that the main two parameters that control choosing the
suitable design criteria for IIP (improved irrigation project) are the unit stream size, and the
total pipeline length. It was concluded that for short pipeline lengths less than 600 m, there is
no limitation in choosing the suitable design criteria but for long pipeline lengths more than
600 m and for a specific unit stream size, the farmer has the option either design for fixed
rotation and minimum cost or design for free operation with little increase in the total cost.
Radwan [11] discussed the required operational conditions to achieve equity water
distribution between hydrants in case of varied land levels. He determined critical down
word slope for achieving exactly equal water distribution regardless of the distance
between opened hydrants. Also, he determined the maximum distance between opened
hydrants for random land slopes to achieve specified difference in the discharge.
According to Radwan [10], basic design for mesqa capacity is to allow for 100% rice
cropping in the area served with a peak daily consumptive use for rice of 13.3mm.
Assuming percolation losses of 1.00 mm/day, the total water requirement is increase by
10% for surface runoff. However the criteria in Upper Egypt are different.
Hydraulic models can be used to simulate the flow depth and discharge in irrigation
canal network over space and time and thereby can help in understanding the hydraulic
behavior of such system, Kumar et al. [4]. Many researchers studied one-dimensional free
surface flow with a spatially varied discharge, among them are Moghazy et al. [6],
Zerihum [16]. Misra [5] developed a mathematical model for the analysis of spatially
varied flow in an irrigation canal. It was observed that the actual depth and discharge in the
canal is significantly different from the design ones. Shahrokhnia and Javan [15] evaluated
the influence of changes in the canal roughness on offtakes discharge using HEC-RAS
modeling software. They indicated that these changes could be could be considered as an
important factor in better water distribution of irrigation canals.
All the previous studies are based on mesqa pipeline with stand tank, however, nowadays
the stand tank is eliminated to reduce the cost through using direct pumps (El-Fetyany [3]).
Also, the design standards considered that the land will be cropped with rice, however, the
crops consumptive use vary from location to location and from season to season. The mesqa

298
JES, Assiut University, Faculty of Engineering, Vol. 47, No. 3, May 2019, pp. 296–308
pipeline is assumed to operate 16 hours/day and the nominal unit stream size is taken as 30
l/s although the irrigation area can vary from turnout to turnout. Besides, spatially
distribution of the mesqas offtakes on the flow in distributary canal is studied.
2. Materials and methods
Al Hadaya Canal is one of the distribution canals that located in Assiut governorate and
irrigates the cropped areas of three villages named Al Hadaya, Burgh and Elwan. Al
Hadaya canal is located at latitude 27 and longitude 32 and the agricultural land of it is at
50 meters above mean sea level. The length of the canal is about 4.000 kilometers and its
intake located at km 8.000 at left bank for the Arab Almadabegh canal. Canal cropped area
is 812.81 Feddan and is branched from it 19 mesqas on both sides as shown in Figure (1)
and Fig. (2) show cross-sections at Km 1.0 and 2.7, respectively, along the canal. The new
mesqa intake without stand pipe is shown in Fig. (3) and Fig. (4) shows the mesqa outlet
using Alfalfa valves. Table (1) shows the cropping pattern of Al Hadaya canal through the
winter and summer seasons. The meteorological data of the region is shown in table (2) .
Fig. 1. Mesqa no 1.
Fig. 2. Cross sections of Al Hadaya canal at km 1.00 and 2.700 respectively.
Table 1.
Cropping pattern for Al Hadaya canal
Crop % of area season Date of plant Date of harvest
Wheat 55 winter 01/11-15/11 30/04-15/05
Bean 20 winter 01/10-15/10 15/03-01/04

299
Et al., Hydraulic performance of improved irrigation system
Table 1. (Cont.)
Crop % of area season Date of plant Date of harvest
Clover 15 winter 01/10-15/10 20/05-10/06
Onion 10 winter 15/11-01/12 01/05-15/05
Yellow corn 65 summer 15/05-01/06 30/09-15/10
sorghum 35 summer 15/05-01/06 30/09-15/10
Table 2.
Meteorological data of the region
Month Max. temp.
( oc )
Min. temp.
( oc )
Avg. tem.
( oc )
% RH
max
% RH
min
wind
speed
(km/h)
No. of
sunny
hours / day
JAN 18 13 15.5 47 32 11.40 10.00
FEB 22.5 14.5 18.5 45 37 12.75 11.00
MAR 25 14 19.5 48 20 15.25 12.00
APR 29 18 23.5 42 17 14.20 13.00
MAY 32 14 23 41 19 14.75 13.00
JUN 36 28 32 45 32 13.75 14.00
JUL 37 30 33.5 41 21 12.20 14.00
AUG 34.5 28 31.25 44 29 11.00 13.00
SEP 29 20.5 24.75 44 29 11.75 12.00
Oct. 29 22 25.5 45 30 11.60 11.50
Nov. 27 17 22 46 32 9.25 11.00
Dec. 22.5 14 18.25 47 35 10.60 10.00
Fig. 3. The new mesqa intake without stand tank.
Fig. 4. Mesqa outlets through Alfalfa valves.

300
JES, Assiut University, Faculty of Engineering, Vol. 47, No. 3, May 2019, pp. 296–308
EPANET Software is used that can performs extended period simulation of hydraulic
and water quality behavior within pressurized pipe networks. A network consists of pipes,
nodes (pipe junctions), pumps, valves and storage tanks can be simulated (Rossman [13],
Mohamed and Abozeid [7]). The software simulates the behavior of hydraulics elements
(head, discharge, velocity and pump electric power) in different operating cases when
operating the pipeline with direct pumping system and steady flow during the daily
operation period of the canal which is changed three times, i.e. 14, 16 and 18 hours in a
rotational water supply system. Table (3) shows the used pump characteristics.
Table 3.
The pump characteristics.
Head (m) Q (l/sec.)
13.00 38.89
12.00 44.44
10.60 50.00
8.40 55.55
5.60 61.11
Schematic diagram for the pipe mesqa (number1) is shown in Figure (5) and Table (4)
shows (the length of the different pipes segments and its diameter. The pipes material used
in mesqas are UPVC pipes and Hazen-Williams equation is used in the analysis with a
roughness coefficient of 150.
Fig. 5. Pipe mesqa number 1.
Table 4.
Lengths and diameters of pipe mesqa number 1.
Diameter (mm) Length(m) Node Part
250 76 10 - 11 1
250 84 11 - 12 2
250 158 12 - 13 3
250 135 13 - 14 4
250 71 14 - 15 5
200 85 15 - 16 6
200 41 16 - 17 7
3. Results and discussions
3.1. Crop consumptive use estimation
The reference evapotranspiration ETo was estimated, using available meteorological
data at Manfaloot local weather station as shown in Table 2. Six different methods are used
to calculate it. Fig. 6 shows the reference evapotranspiration at different months calculated
using Balney – Criddle, Thornthwaite, Jensen-Haise, FAO- Blaney-Criddle (temperature
method), Penman- Monteith, and Hargreaves- Samani method, respectively. It is clear the
agreement between the different methods except Jensen-Haise method.

301
Et al., Hydraulic performance of improved irrigation system
Fig. 6. Monthly variation of reference evapotranspiration.
4. Mesqa discharge computation
The water is lifted to meskas in rotation and at specific hours during on-days, and the
water is conveyed from pipe meskas to earthen marrwas through valve outlets. In this
study, it is assumed that the area served by a mesqa is cultivated by the same ratio of
cultivated crops in the area served by distributary canal. The mesqas and outlets discharge
are computed using approach introduced by El-Enany et al. [2] as follows:
𝑊𝐶 = ∑ (𝐸𝑇𝑜 𝐾𝑐𝑖𝐴𝑐𝑖/1000) × 4200/86400𝑁𝑐𝑖 (1)
where WC is the water consumptive needed for the area served by a distributary canal
during a month (m3/sec.), Nc is the number of cultivated crops in the area served by a
distributary canal according to cropping pattern, ETo is the monthly average
evapotranspiration for the area served by a distributary canal (mm/day) , Kci is monthly
average crop coefficient, and Aci is the area cultivated by a crop i (feddan).
𝑄𝑑 = 𝑊𝐶 ×𝑁1
𝑁2× (
24
𝑇𝑒−𝑇𝑠) × (1 + 𝐿𝑅)/𝜂 (2)
Where Qd is the discharge of distributary canal during hours of irrigation (m3/sec.), Te is
the assumed day hour at which irrigation ends, Ts is the assumed day hour at which
irrigation starts, LR is the leaching requirement, which is a ratio of water consumptive use
(%), and 𝜂 is the irrigation efficiency for distributary canal, where conveyance and on-farm
efficiencies are included (= 0.71).
𝑄𝑚 =𝑊𝐶
𝐴𝑇×
𝑁1
𝑁2× (
24
𝑇𝑒−𝑇𝑠) × (1 + 𝐿𝑅)/𝜂𝑚 (3)
Where Qm is the discharge of mesqa during hours of irrigation (m3/sec/fed), AT is the
total area served by distributary canal (feddan), N1 is the rotation length (days), N2 is the
number of on days (days), Te is the assumed day hour at which irrigation ends, Ts is the
assumed day hour at which irrigation starts, LR is the leaching requirement, which is a ratio
of water consumptive use (%), and 𝜂m is the irrigation efficiency for mesqas.
According to the crop pattern, rotation period for canal and operation times for mesqas,
the discharge of distributary canal and mesqa can be estimated from equations 1-3. Discharge
of a mesqa no.(1) during hours of irrigation (m3/ sec/fe), (m
3/sec), at 14,16 and 18 hours
when η = 0.71 , ηm = 1 ( at pipeline ) , LR= 0.05, N1,N2 = 14,7 days are shown in Table (5).

302
JES, Assiut University, Faculty of Engineering, Vol. 47, No. 3, May 2019, pp. 296–308
Table 5.
Areas and discharges of different valves for pipe mesqa number 1.
Discharge (L/sec.) Area
(fedd.) Km valve At 18-hours
44 L/sec.
At 16-hours
47 L/sec.
At 14-hours
54 L/sec.
4.89 5.22 6.00 3.75 0.076 1
14.34 15.32 17.60 11.00 0.160 2
3.91 4.18 4.80 3.00 0.318 3
5.21 5.57 6.40 4.00 0.453 4
5.21 5.57 6.40 4.00 0.524 5
5.21 5.57 6.40 4.00 0.609 6
5.21 5.57 6.40 4.00 0.650 7
Three operation scenarios of mesqa outlets are considered. In scenario (1), all valves are
working during daily operation hours. The valves feed all the cropped area at the same
time and the discharge of mesqa is distributed to all valves according to served area. In the
second scenario, the discharge of the mesqa is distributed to all valves such that every
irrigate the served area in one day. In the third scenario, each valve will irrigate the served
area in two consecutive days. Table (6) show the schedule of all valves of mesqa no. (1)
for the three scenarios of operation for 14 hours of operation per day.
Table 6.
Operation schedule for mesqa no (1) at 14 hours daily pump operation.
Case Day Valve V1 V2 V3 V4 V5 V6 V7
Km 0.076 0.160 0.318 0.453 0.524 0.609 0.650
Cas
e1
Sat-Fri Disch
L/sec 6.00 17.60 4.80 6.40 6.40 6.40 6.40
Cas
e2
Sat
Dis
char
ge
(L/S
ec)
off 12.20 off off off off 44.80
Sun off 12.20 off off off 44.80 off
Mon off 12.20 off off 44.80 off off
Tue off 12.20 off 44.80 off off off
Wed off 12.20 33.60 off off off off
Thur 42.00 12.20 off off off off off
Fri off 50.00 off off off off off
Cas
e3
Sat
Dis
char
ge
(L/S
ec)
off off off off 22.40 22.40 22.40
Sun off off off off 22.40 22.40 22.40
Mon off 61.60 off off off off off
Tue off 61.60 off off off off off
Wed 21.00 off 16.80 22.40 off off off
Thur 21.00 off 16.80 22.40 off off off
Fri off off off off off off off
5. Flow through mesqa pipe no. (1)
Fig. (7) shows the maximum discharge in mesqa no.1 for the three scenarios of valves
operation at periods of irrigation 14, 16 and 18 hours, respectively. It can be shown from
this figure that the discharge decreases by increasing the pump operation hours except for

303
Et al., Hydraulic performance of improved irrigation system
scenario 2 where the discharge increases by in increasing the pump operation hours. In
general, scenario1 gives the minimum discharge for the three pump operation condition.
Fig. 7. Maximum discharge flow in mesqa no.1 for the three scenarios of operation at period of
irrigation 14, 16 and 18 hours.
Fig. (8) shows the minimum discharge in the pipe line mesqa for the three scenarios of
outlets operation at periods of irrigation 14, 16 and 18 hours. It is noticeable from this
figure that the smaller discharge in the pipe line at scenarios no.1.
Fig. 8. Minimum discharge flow in mesqa no.1 for the three scenarios of operation at period of
irrigation 14, 16 and 18 hours.
Figures (9) and (10) show the maximum and minmum velocity respectively, in pipeline
mesqa for different scenarios of operation. It can be seen from Fig. (9) that the maximum
velocity in the pipe line less than 1.5 m/sec and higher than 0.9 m/sec for all operation
scenarios and the maximum velocity decreases by increasing the pump operation hours. As
shown from the Fig. (10), the minimum velocity for scenario no.1 is less than 0.20 m/sec,
however this small velocity may be occurring in last reach of the pipeline.
Fig. 9. Maximum velocity in mesqa no. (1) for different operation scenarios.
304
JES, Assiut University, Faculty of Engineering, Vol. 47, No. 3, May 2019, pp. 296–308
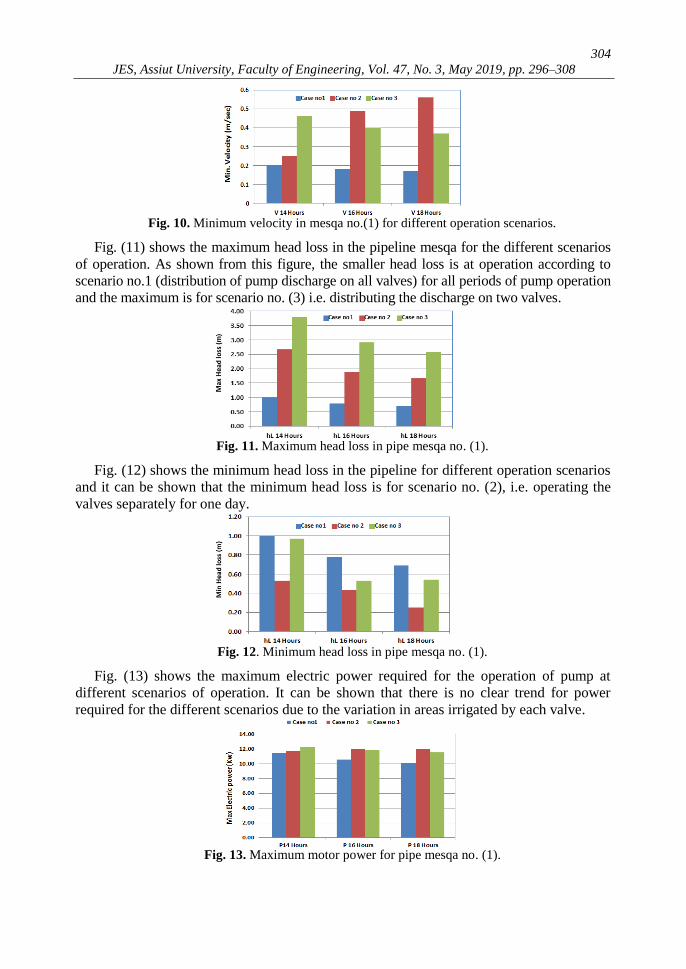
Fig. 10. Minimum velocity in mesqa no.(1) for different operation scenarios.
Fig. (11) shows the maximum head loss in the pipeline mesqa for the different scenarios
of operation. As shown from this figure, the smaller head loss is at operation according to
scenario no.1 (distribution of pump discharge on all valves) for all periods of pump operation
and the maximum is for scenario no. (3) i.e. distributing the discharge on two valves.
Fig. 11. Maximum head loss in pipe mesqa no. (1).
Fig. (12) shows the minimum head loss in the pipeline for different operation scenarios
and it can be shown that the minimum head loss is for scenario no. (2), i.e. operating the
valves separately for one day.
Fig. 12. Minimum head loss in pipe mesqa no. (1).
Fig. (13) shows the maximum electric power required for the operation of pump at
different scenarios of operation. It can be shown that there is no clear trend for power
required for the different scenarios due to the variation in areas irrigated by each valve.
Fig. 13. Maximum motor power for pipe mesqa no. (1).

305
Et al., Hydraulic performance of improved irrigation system
Fig. (14) shows the minimum electric power required for the operation. It can be shown
from this figure that case no. 2, i.e. operating one outlet daily gives the minimum power
for all hours of operation. In comparison between Fig,(13) and Fig.(14),there is no high
difference between the maximum and minimum power.
Fig. 14. Minimum motor power for pipe mesqa no. (1).
Fig. (15) shows the pump energy cost for different scenarios. It can be depicted from
this figure that the minimum energy cost at 14 hours operation and for mesqa outlets
scheduling according to scenario no. (3).
Fig. 15. Monthly cost of energy for pipe mesqa no.(1).
Figures (16) and (17) show the variation in maximum and minimum pressure heads
along mesqa (1) pipeline respectively, due to the sudden shut down of the pump, for the
different studied cases (case 1, 2 and 3). Firstly, there is no a big difference in the
maximum pressure between the three studied cases. Secondly, the figures reveal that case 1
(all valves are working) is the best one, because the average minimum pressure equals -4
m H2O, while case 2 (one separate valve operate in one day) has a minimum pressure of -5
m H2O. Case 3 ( 2 valve operate in one day) is the worst case, because the pipeline
completely has a negative pressure of – 10 m H2O, which may lead to column separation
or the possibility of intrusion and contamination of the system.
Fig. 16. Maximum pressure heads along the pipeline due to the sudden shutdown of pump for
the different studied cases.

306
JES, Assiut University, Faculty of Engineering, Vol. 47, No. 3, May 2019, pp. 296–308
Fig. 17. Minimum pressure heads along the pipeline due to the sudden shutdown of pump for the
different studied cases.
6. Flow in distributary canal
Irrigation canals are designed such that the flow is constant along the canal, however,
the actual flow is spatially varied flow. Fig. (18) shows the variation of water depth in
distributary canal for constant and spatially varied flow respectively. As shown from that
figure, considering the flow is constant in the canal results in smaller water depth along the
canal compared with varied flow.
Fig. 18. Variation of water depth in distributary canal at constant and varied discharge along the
canal for 14 hours mesqa operation.
Fig. (19) shows the water depth along the distributary canal for the three scenarios of
mesqa pumps operation, i.e. at 14, 16 and 18 hours respectively. It is noticeable from that
figure the water depth increases by decreasing the hours of pump operation.
Fig 19. Water depth in distributary canal for different scenarios of mesqa pumps operation.
7. Conclusions
In the current study, hydraulic performance of pipe mesqa during operation is studied.
Three scenarios for operation of mesqa outlets are suggested with three alternatives for the
daily pump operation i.e., 14, 16 and 18 hours, respectively. In the first scenario, it is
suggested the all pipe outlets operated daily and its discharge is proportional to the area

307
Et al., Hydraulic performance of improved irrigation system
served. In the second scenario, it is assumed that each outlet operates once a week.
However, in the third one, the outlets are assumed to be operated twice a week. Many
parameters are assessed among of them the maximum and minimum discharge flow in pipe
line, the maximum and minimum velocity, maximum and minimum head loss, pump
electric power and energy cost. It was found from this study, that operating the pump 14
hours per day fulfills the minimum monthly cost. Also, operating the outlet valves
according to scenario no. (3), gives the least operating cost. The maximum velocity in the
pipeline is less than 1.2 m/s for all operating scenarios. It was found from this study that
case 3 gives the maximum negative pressure due to pump suddenly shut-down. Moreover,
it was found that considering the discharge as a constant along the distributary canal under-
predict the water depth along the channel.
REFERENCES
[1] Depeweg, H. and Bekheit, K. H. (1997). “Evaluation of proposed mesqa improvements”,
Irrigation and drainage systems, 11, pp. 299-323.
[2] El-Enany, M. A.; el-Alfy, K. S.; Sobeih, M. F.; Armanious, S. D., and Gergis, E. S. (2004).
“Modification of the improved irrigation system in the old lands in Egypt”, 29 (1).
[3] El-Fetyany, M. A. S. (2017). “Reduction of mesqa improvement costs”, Water Science, 31,
pp. 151-163.
[4] Kumar, P.; Mishra, A.; Raghuwanshi, N. S.; and Singh, R. (2002).”Application of unsteady flow
hydraulic-model to a large and complex irrigation system”, Agricult. Water Manag., 54, pp. 49-66.
[5] Misra, R. (1996). “Spatially varied steady flow in irrigation canals”, Agricult. Water Manag.,
30, pp. 217-235.
[6] Moghazy, H. M.; Saleh, O. K.; and Abd El Azim, N. F. (2014). “Hydraulic analysis of El
Mahmoudia canal”, Water and Society II, 178, pp. 41-52.
[7] Mohamed, H. I., and Abozeid, G. (2011). “Dynamic simulation of pressure head and
chlorine concentration in the city of Asyut water supply network in abnormal operation
conditions”, Arab. J. Sci. Eng., 36, pp. 173-184.
[8] Radwan, H. G., Zaghloul, A. S. and Ibrahim, K. A. (2011a). “Analysis of optimal velocity
for improved irrigation design in Egypt”, Canadian Jour. on Environ. Construct. And Civil
Eng., 2 (5), pp. 94-102.
[9] Radwan, H. G., Zaghloul, A. S. and Ibrahim, K. A. (2011b). “Practical design of improved
irrigation projects in Egypt under specific constraints”, Canadian Jour. on Environ.
Construct. And Civil Eng., 2 (5), pp. 103-110.
[10] Radwan, H. G. (2013). “Sensitivity analysis of head loss equations on the design of improved
irrigation on-farm system in Egypt”, Int. Jour. of Advan. in Research& Technology, 2 (1).
[11] Radwan, H. G., (2016). “Fairness water distribution at on-farm irrigation development
projects in Egypt: Case of variable land levels”, Int. Water Technology Jour., 6 (2), pp. 144-
157.
[12] Radwan, H. G. (2017). “Water saving from improved on-farm irrigation project in Egypt”,
Int. Jour. Of Scientific & Eng. Research, 8 (8), pp. 871-883.
[13] Rossman L. A. (2000) “Computer models/ EPANET”, In: Mays L. W. (ed.) Water
distribution systems handbook. McGraw-Hill, New York.
[14] Saad Eddin, M. R.; El-Ansary, M. Y.; Awaad, M. A. and Mohamed, A. S. H. (2016).
“Evaluation of integrated surface irrigation management in the old lands”, J. Soil Sci. and
Agri. Eng., Mansoura Univ., 7 (7), pp. 509-515.
[15] Shahrokhnia, M. A. andjavan, M. (2007). “Influence of roughness changes on offtaking
discharge in irrigation canals”, Water Resour. Manage. 21, pp. 635-647.
[16] Zerihum, Y. T., (2015). “Numerical simulation of flow in open channels with bottom in take
racks”, Water Utility Journal, 11, pp. 49-61.

308
JES, Assiut University, Faculty of Engineering, Vol. 47, No. 3, May 2019, pp. 296–308
الاداء الهيدروليكي لنظام الري المطور
الملخص العربى
تعاني شبكة الترع في جمهورية مصر العربية علي جميع مستوياتها من نقص المياة و التوزيع غير العادل لمياة
الري بين المنتفعين . ولذلك اصبح تطوير الري مطلبا ملحا للتغلب علي مشكلة نقص المياة في نهايات الترع.
الري باستبدال المساقي الترابية العادية ويقوم قطاع تطوير الري احد قطاعات وزارة الموارد المائية و
بمساقي مواسير مدفونة او مساقي مبطنة مرفوعة . ويتم دراسة الاداء الهيدروليكي لنظام الري المطور باستخدام
احد ترع التوزيع حيث يتم تطبيق الدراسة علي نظام المواسير المدفونة . ويتم تطبيق الدراسة علي ترعة الهدايا
مسقي بمياة الري و 19التوزيع التي تقع ضمن زمام الري بمحافظة اسيوط .وتقوم بتغذية عدد وهي احد ترع
المساقي لها اطوال وزمامات مختلفة . ويتم دراسة الاداء الهيدروليكي لمسقي المواسير المطورة من خلال
. مع الاخذ في الاعتبار سيناريوهات مختلفة لتشغيل وحدة الرفع وسيناريوهات مختلفة لتشغيل مسقي المواسير
دراسة ثلاثة حالات تشغيل للمسقي من خلال تشغيل محابس الري علي المسقي . السيناريو الأول هو عندما يتم
تشغيل جميع الصمامات في نفس الوقت طوال الأسبوع . والثاني هو عندما يعمل صمام واحد لمدة يومين في
مات ليوم واحد. أيضا ، يتم النظر في ثلاثة سيناريوهات لتشغيل الأسبوع والثالث هو عندما تعمل جميع الصما
ساعة في اليوم . علاوة على ذلك ، يتم دراسة تأثير السيناريوهات المختلفة 18و 16و 14وحدة الرفع لمدة
مج لتشغيل وحدة الرفع على الانتقال المفاجئ للتدفق في المواسير بسبب إغلاق وحدة الرفع . تم استخدام برنا
EPANET ساعة في اليوم يحقق الحد الأدنى من التكلفة 14للتحليل الهيدروليكي. وجد أن تشغيل المضخة
( يعطي أقل تكلفة تشغيل . الحد 3الشهرية . ايضا ، تشغيل صمامات المخرج وفقا لسيناريو التشغيل رقم )
ريوهات التشغيل. إلى جانب ذلك ، يتم متر / ثانية لجميع سينا 1.2الأقصى للسرعة في خط المواسير هو أقل من
دراسة تأثيرات تشغيل ماخذ المساقي علي السريان في ترعة التوزيع.