hydraulic analysis of urban drainage systems with
TRANSCRIPT
Diego Fernando Paredes Méndez. Hydraulic Analysis of Urban Drainage Systems with Conventional Solutions and Sustainable Technologies: Case Study in Quito, Ecuador. Journal of Water Management Modeling 26:C440. https://doi.org/10.14796/JWMM.C440 © CHI 2017. www.chijournal.org ISSN 2292-6062.
1
Hydraulic Analysis of Urban Drainage Systems with Conventional Solutions and Sustainable Technologies: Case
Study in Quito, Ecuador
Diego Fernando Paredes MéndezMetropolitan Drinking Water and Sanitation Company of Quito (Empresa Pública Metropolitana de Agua Potable y Saneamiento, EPMAPS) and
Universidad Central del Ecuador, Quito, Ecuador.
Abstract
Urban drainage systems are essential infrastructure for any community. If water and sanitation companies do not have effective
management practices this vital infrastructure not only provides a diminished level of service, but also requires that enormous
expenditure be made to prevent a serious impact on human society. Conventional solutions have been implemented in Quito,
Ecuador to address the adverse impacts of pluvial floods. These solutions are not optimal from technical, social or environmental
aspects. The hydraulic performance of the sewer system in a pilot basin was analysed and compared in three different scenarios.
First, using the configuration of the drainage network prior the year 2011; second, using the current configuration, which has
structural measures that were built in 2012 to relieve excessive pluvial flows; and third, using an urban drainage model in which
some sustainable technologies were implemented instead of the conventional methods. To make the assessment, the neces-
sary data was collected, analysed and processed. Subsequently 1D and 2D models were used. Several hydraulic parameters were
evaluated within the three scenarios: flood volume, surface runoff, pipe flows, flood water depths and velocities. The results of this
research show the effectiveness of sustainable drainage system techniques (SUDS): flood volume was reduced by 60% with con-
ventional measures, while SUDS decreased flood volume by 75%. Surface runoff decreased around 90%, and as a consequence of
this, pipe flows diminished in some sewers by up to 50%. Finally, flooding areas have been reduced significantly. Thus sustainable
technologies are more effective than conventional structures.
1 Introduction
1.1 BackgroundUrban drainage systems (UDS) are necessary to preserve and promote public health and welfare, for flood protection, to reduce water pollution, and to improve economic development in any region. Urbanization constantly modifies land use within a city, leading to several effects on the hydrologic cycle such as decreasing infiltration and concentration times, and increasing flood peak and runoff. Moreover, population growth, variation in precipitation patterns, deterioration of the sewer infrastructure, and blockage and sedimentation are factors that lead to failures in UDS. Consequently urban flooding occurs, which is one of the most severe and dangerous effects of a disaster on human society, causing not only huge economic damage and property destruction but also, and the most sensitive issue, loss of human lives (Stein 2001). Urban drainage is essential infrastructure for any community, and its rehabilitation represents a huge cost to local governments (Water Environment Federation 2009).
Sewer systems, like all engineering works, do not last for-ever. They deteriorate with time and so require maintenance and repair during their service life. Nevertheless, in many regions of the world, the rehabilitation of these structures is frequently neg-lected, or is done only after catastrophic failure happens.
1.2 Problem IdentificationIn Quito, Ecuador urban drainage management has focused on building huge underground tunnels beneath existing sewer pipes to convey excess rainwater, and consequently to avoid floods. This rehabilitation strategy corresponds to a traditional structural measure, which takes into account only the quantity of flows. This solution cannot be optimal because although it transfers the volume of water from one point to another, it does not consider water quality and amenity.
Thus the alternative approach to conventional stormwater management, known as sustainable drainage systems (SUDS) in the United Kingdom, best management practices (BMPs) in the United States, or water sensitive design in Australia (Vojinović and
2
Abbot 2012), has been used to minimize the effects of urban de-velopment on the quantity and quality of stormwater runoff and to enhance the social and environmental amenity of the urban landscape.
A number of SUDS structures exist in order to control, manage, and reduce the adverse impacts due to stormwater runoff. Such structures are mainly surface detention basins, reten-tion basins, infiltration basins, and subsurface detention systems (Nicklow et al. 2004).
BMPs can be structural and non-structural (Field et al. 2006). Nonstructural technologies are basically source controls and prevent the pollution of surface runoff in three main ways: by applying mainly regulatory ordinances to control land develop-ment and the generation of pollutants; by using adequate main-tenance activities on impervious and pervious areas; and through institutional and educational practices. Consequently the direct benefits of reducing stormwater pollution are the decrement in size and the reduction in costs of structural BMPs. Structural BMPs or low impact development (LID) practices are used to reduce and attenuate runoff volumes and pollutants. The most commonly used BMPs and LIDS are ponds, wetlands, vegetative biofilters, infiltration practices, and sand and organic filters (Field et al. 2006).
Among the main functions of SUDS are: to reduce and attenuate surface runoff volumes; to simulate the flow of runoff similar to natural processes; to replace structural measures with natural elements; to prevent flooding, pollution, and erosion; to reduce the consumption of both drinking water and energy through wastewater treatment plants, aquifer storage and recov-ery; and to improve landscape aesthetics and biodiversity (Minis-terio de Obras Públicas 2013).
1.3 ObjectiveThe purpose of this study is to analyse and compare hydraulic performance between conventional rehabilitation measures and sustainable technologies in a pilot basin of the sewer system in Quito, Ecuador. To achieve this objective, three scenarios were devised: first, with the configuration of the system prior to 2011 (i.e. the original sewer network); second, with the current config-uration of the sewer network, which includes structural measures that were built in 2012 to relieve excessive rainwater flows; and third, a scenario with several sustainable technologies that were implemented in an urban drainage model.
To assess the three alternatives the necessary data was collected, analysed and processed. Subsequently a 1D pipe flow model was run for several scenarios using Infoworks CS. To simu-late the overland flow from manholes when the capacity of the sewer pipes is exceeded a 2D model was used. Several hydraulic parameters were evaluated within these scenarios, such as flood volume, surface runoff, pipe flows, and flood water depths and velocities.
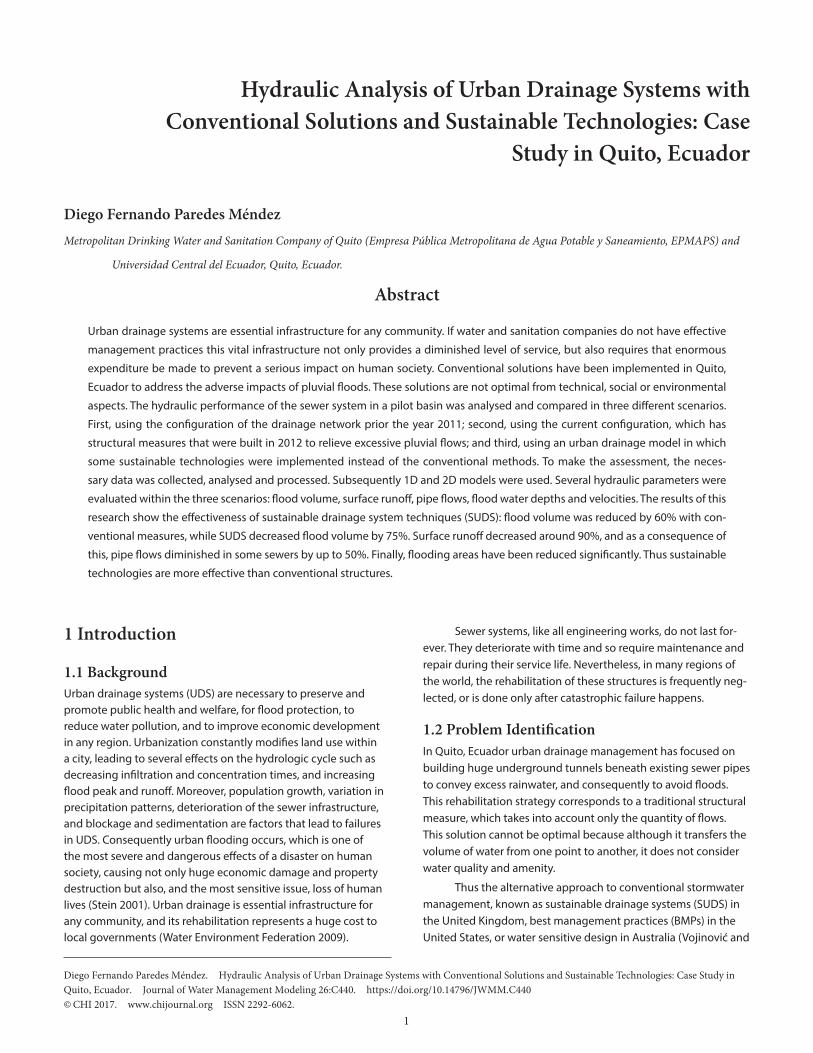
2 Study AreaThe hydraulic assessment was tested on a case study of the urban drainage network in Quito, Ecuador. The total area of the Metro-politan District of Quito (DMQ) is approximately 4230 km2 (Figure 1a). The drainage system of DMQ is a combined gravity system. The urban zone of the area is divided into four major catchments (220 km2; Figure 1a): Colegio, Iñaquito Batán, Anglo French, and Machángara. The pilot study area is a basin named Caicedo, situated in the northwest of Quito (Figure 1c), and it is part of one of the four catchments of El Batán (Figure 1b), with an area of 55 km2. The Caicedo basin has an area of 2.5 km2; 40% of it is a natural zone. This natural grassland area belongs to the Andean region. The majority of this area is covered by sandy loam and volcanic ash soils, with a high infiltration rate, low surface runoff and steep slopes. The remaining 60% is urban, mainly a residen-tial area with approximately 11 000 inhabitants, and an average imperviousness of 70%.
Figure 1 (a, top) DMQ with four urban catchments; (b, centre) Batán catchment; (c, bottom) Caicedo pilot basin.
3
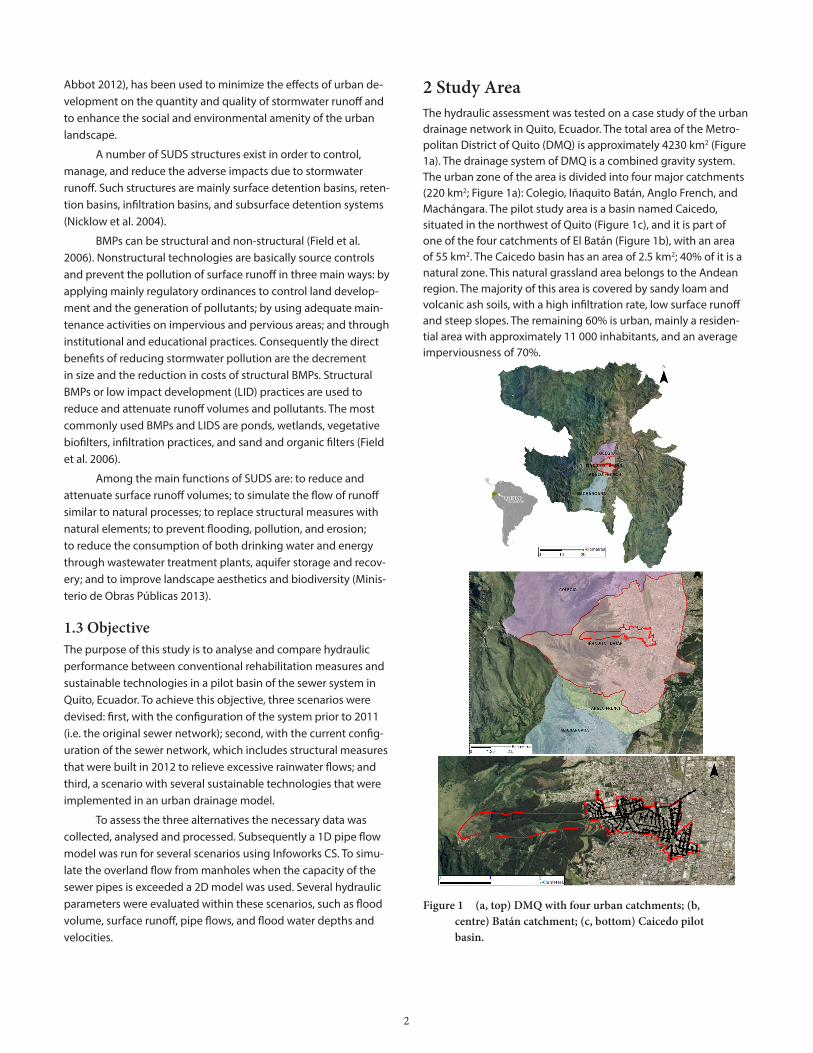
2.1 JustificationThis study basin was selected because in February 2011 a con-siderable debris flow (landslide) occurred in the natural zone of the Caicedo basin due to heavy rainfall events during January and February 2011. Some of the rainfall events recorded in these months were >55 mm in <40 min. As a result, the infiltration cap-acity of the natural zone was exceeded. Surface runoff rose sig-nificantly, causing a huge landslide. Subsequently, large amounts of solid material went into the sewer conduits, leading to the collapse of the sewer system. Approximately 40% of the urban area of the Caicedo basin was inundated. The consequences of this sewer failure had huge social, economic and environmental impacts on the lower part of the urban area (Figure 2).
Figure 2 Collapse of the sewer system.
To address this sanitary emergency, three kinds of struc-tural measures were introduced by the Metropolitan Drinking Water and Sanitation Company of Quito (Empresa Pública Metro-politana de Agua Potable y Saneamiento, EPMAPS). This public utility company is responsible for providing drinking water and sanitation services to Quito, and EPMAPS controls the design, operation and maintenance of potable water and sewer systems in Quito.
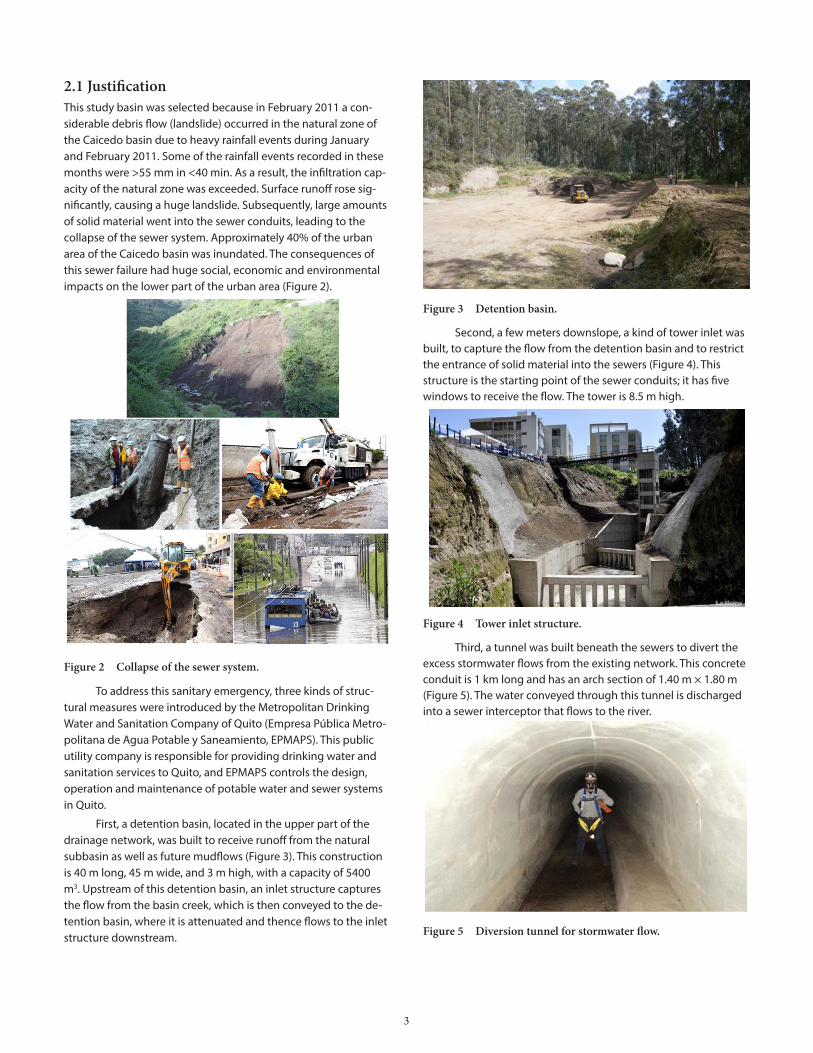
First, a detention basin, located in the upper part of the drainage network, was built to receive runoff from the natural subbasin as well as future mudflows (Figure 3). This construction is 40 m long, 45 m wide, and 3 m high, with a capacity of 5400 m3. Upstream of this detention basin, an inlet structure captures the flow from the basin creek, which is then conveyed to the de-tention basin, where it is attenuated and thence flows to the inlet structure downstream.
Figure 3 Detention basin.
Second, a few meters downslope, a kind of tower inlet was built, to capture the flow from the detention basin and to restrict the entrance of solid material into the sewers (Figure 4). This structure is the starting point of the sewer conduits; it has five windows to receive the flow. The tower is 8.5 m high.
Figure 4 Tower inlet structure.
Third, a tunnel was built beneath the sewers to divert the excess stormwater flows from the existing network. This concrete conduit is 1 km long and has an arch section of 1.40 m × 1.80 m (Figure 5). The water conveyed through this tunnel is discharged into a sewer interceptor that flows to the river.
Figure 5 Diversion tunnel for stormwater flow.
4
Figure 6 shows the main conduit of the Caicedo basin without the secondary pipes, and it illustrates the location of the three mitigation structures that were constructed in 2012. This study basin drains from east to west; it has two discharge points, one from the main conduit and another from the diversion tunnel which routes the excessive flows from the main conduit through one combined sewer overflow (CSO).
Figure 6 Location of the mitigation structures.
The Caicedo basin had a long history of flooding prior to this event, due mainly to increased urban development that has been reducing permeable surface areas, thus increasing runoff peaks and volumes, and decreasing concentration times.
3 MethodologyThe main steps developed to achieve the objective of this re-search, stated above, are outlined in the flowchart in Figure 7.
Data Acquisition, analysis and processing
UD model development
State the Problem
Analysis Results
Calibration, validation. Hydraulic Model 1D
Simulation different scenarios
Model 2D
Figure 7 Flow chart of the main methodology.
The data to be acquired are threefold: temporal, terrain and spatial data.
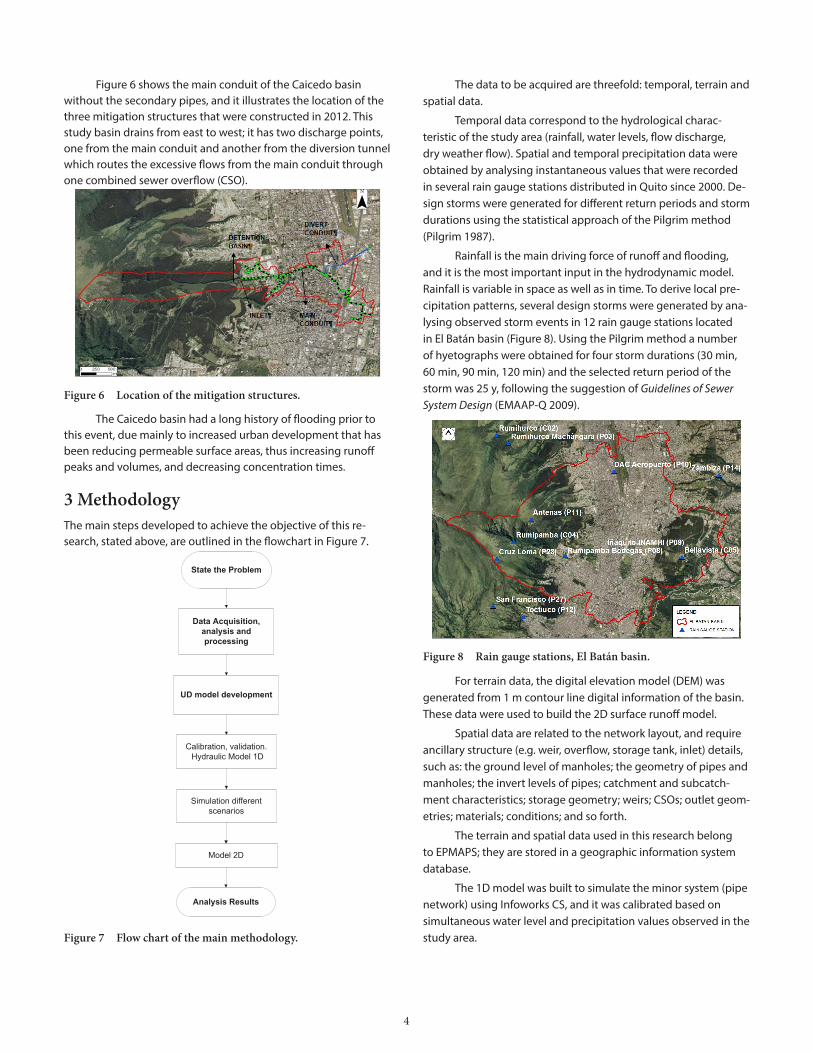
Temporal data correspond to the hydrological charac-teristic of the study area (rainfall, water levels, flow discharge, dry weather flow). Spatial and temporal precipitation data were obtained by analysing instantaneous values that were recorded in several rain gauge stations distributed in Quito since 2000. De-sign storms were generated for different return periods and storm durations using the statistical approach of the Pilgrim method (Pilgrim 1987).
Rainfall is the main driving force of runoff and flooding, and it is the most important input in the hydrodynamic model. Rainfall is variable in space as well as in time. To derive local pre-cipitation patterns, several design storms were generated by ana-lysing observed storm events in 12 rain gauge stations located in El Batán basin (Figure 8). Using the Pilgrim method a number of hyetographs were obtained for four storm durations (30 min, 60 min, 90 min, 120 min) and the selected return period of the storm was 25 y, following the suggestion of Guidelines of Sewer System Design (EMAAP-Q 2009).
Figure 8 Rain gauge stations, El Batán basin.
For terrain data, the digital elevation model (DEM) was generated from 1 m contour line digital information of the basin. These data were used to build the 2D surface runoff model.
Spatial data are related to the network layout, and require ancillary structure (e.g. weir, overflow, storage tank, inlet) details, such as: the ground level of manholes; the geometry of pipes and manholes; the invert levels of pipes; catchment and subcatch-ment characteristics; storage geometry; weirs; CSOs; outlet geom-etries; materials; conditions; and so forth.
The terrain and spatial data used in this research belong to EPMAPS; they are stored in a geographic information system database.
The 1D model was built to simulate the minor system (pipe network) using Infoworks CS, and it was calibrated based on simultaneous water level and precipitation values observed in the study area.
5
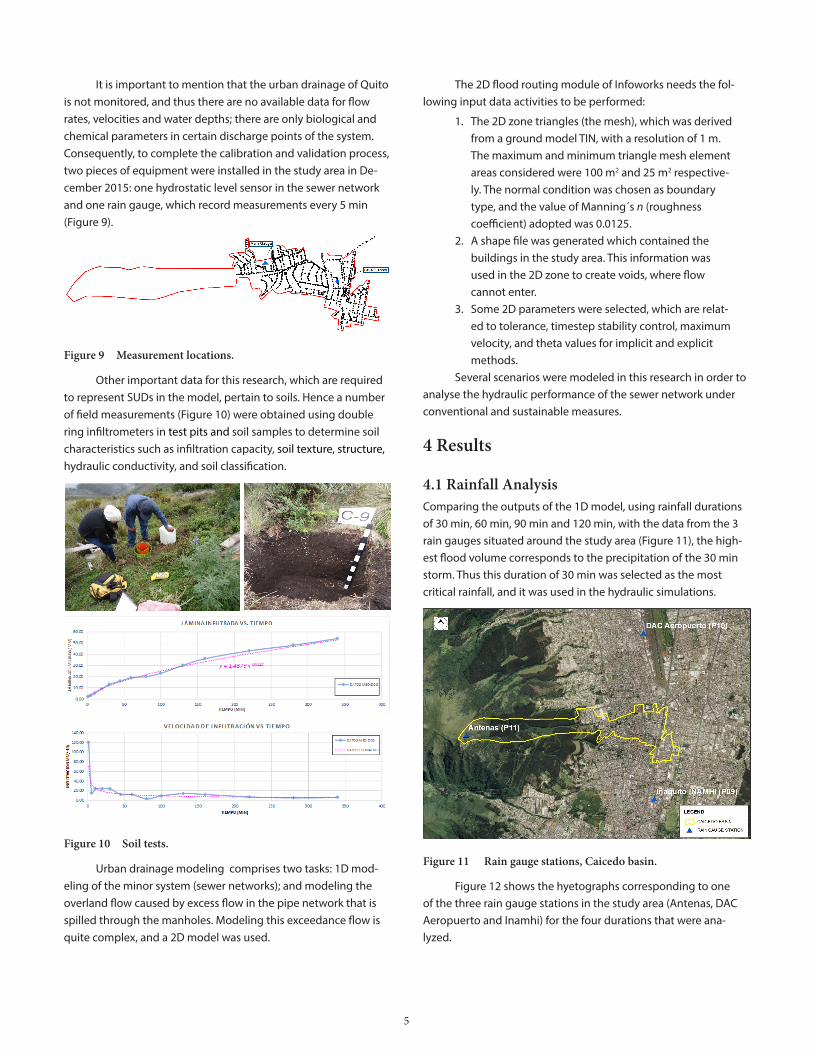
It is important to mention that the urban drainage of Quito is not monitored, and thus there are no available data for flow rates, velocities and water depths; there are only biological and chemical parameters in certain discharge points of the system. Consequently, to complete the calibration and validation process, two pieces of equipment were installed in the study area in De-cember 2015: one hydrostatic level sensor in the sewer network and one rain gauge, which record measurements every 5 min (Figure 9).
Figure 9 Measurement locations.
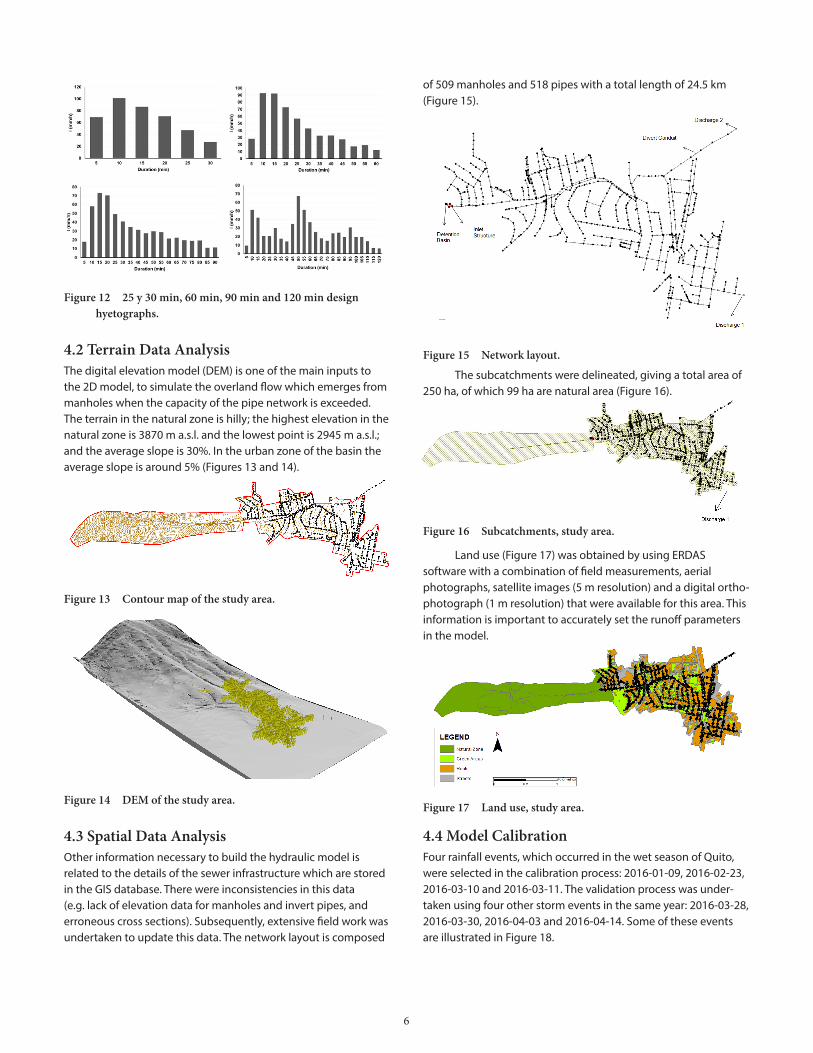
Other important data for this research, which are required to represent SUDs in the model, pertain to soils. Hence a number of field measurements (Figure 10) were obtained using double ring infiltrometers in test pits and soil samples to determine soil characteristics such as infiltration capacity, soil texture, structure, hydraulic conductivity, and soil classification.
Figure 10 Soil tests.
Urban drainage modeling comprises two tasks: 1D mod-eling of the minor system (sewer networks); and modeling the overland flow caused by excess flow in the pipe network that is spilled through the manholes. Modeling this exceedance flow is quite complex, and a 2D model was used.
The 2D flood routing module of Infoworks needs the fol-lowing input data activities to be performed:
1. The 2D zone triangles (the mesh), which was derived from a ground model TIN, with a resolution of 1 m. The maximum and minimum triangle mesh element areas considered were 100 m2 and 25 m2 respective-ly. The normal condition was chosen as boundary type, and the value of Manning´s n (roughness coefficient) adopted was 0.0125.
2. A shape file was generated which contained the buildings in the study area. This information was used in the 2D zone to create voids, where flow cannot enter.
3. Some 2D parameters were selected, which are relat-ed to tolerance, timestep stability control, maximum velocity, and theta values for implicit and explicit methods.
Several scenarios were modeled in this research in order to analyse the hydraulic performance of the sewer network under conventional and sustainable measures.
4 Results
4.1 Rainfall AnalysisComparing the outputs of the 1D model, using rainfall durations of 30 min, 60 min, 90 min and 120 min, with the data from the 3 rain gauges situated around the study area (Figure 11), the high-est flood volume corresponds to the precipitation of the 30 min storm. Thus this duration of 30 min was selected as the most critical rainfall, and it was used in the hydraulic simulations.
Figure 11 Rain gauge stations, Caicedo basin.
Figure 12 shows the hyetographs corresponding to one of the three rain gauge stations in the study area (Antenas, DAC Aeropuerto and Inamhi) for the four durations that were ana-lyzed.
6
Figure 12 25 y 30 min, 60 min, 90 min and 120 min design hyetographs.
4.2 Terrain Data AnalysisThe digital elevation model (DEM) is one of the main inputs to the 2D model, to simulate the overland flow which emerges from manholes when the capacity of the pipe network is exceeded. The terrain in the natural zone is hilly; the highest elevation in the natural zone is 3870 m a.s.l. and the lowest point is 2945 m a.s.l.; and the average slope is 30%. In the urban zone of the basin the average slope is around 5% (Figures 13 and 14).
Figure 13 Contour map of the study area.
Figure 14 DEM of the study area.
4.3 Spatial Data AnalysisOther information necessary to build the hydraulic model is related to the details of the sewer infrastructure which are stored in the GIS database. There were inconsistencies in this data (e.g. lack of elevation data for manholes and invert pipes, and erroneous cross sections). Subsequently, extensive field work was undertaken to update this data. The network layout is composed
of 509 manholes and 518 pipes with a total length of 24.5 km (Figure 15).
Figure 15 Network layout.
The subcatchments were delineated, giving a total area of 250 ha, of which 99 ha are natural area (Figure 16).
Figure 16 Subcatchments, study area.
Land use (Figure 17) was obtained by using ERDAS software with a combination of field measurements, aerial photographs, satellite images (5 m resolution) and a digital ortho-photograph (1 m resolution) that were available for this area. This information is important to accurately set the runoff parameters in the model.
Figure 17 Land use, study area.
4.4 Model CalibrationFour rainfall events, which occurred in the wet season of Quito, were selected in the calibration process: 2016-01-09, 2016-02-23, 2016-03-10 and 2016-03-11. The validation process was under-taken using four other storm events in the same year: 2016-03-28, 2016-03-30, 2016-04-03 and 2016-04-14. Some of these events are illustrated in Figure 18.
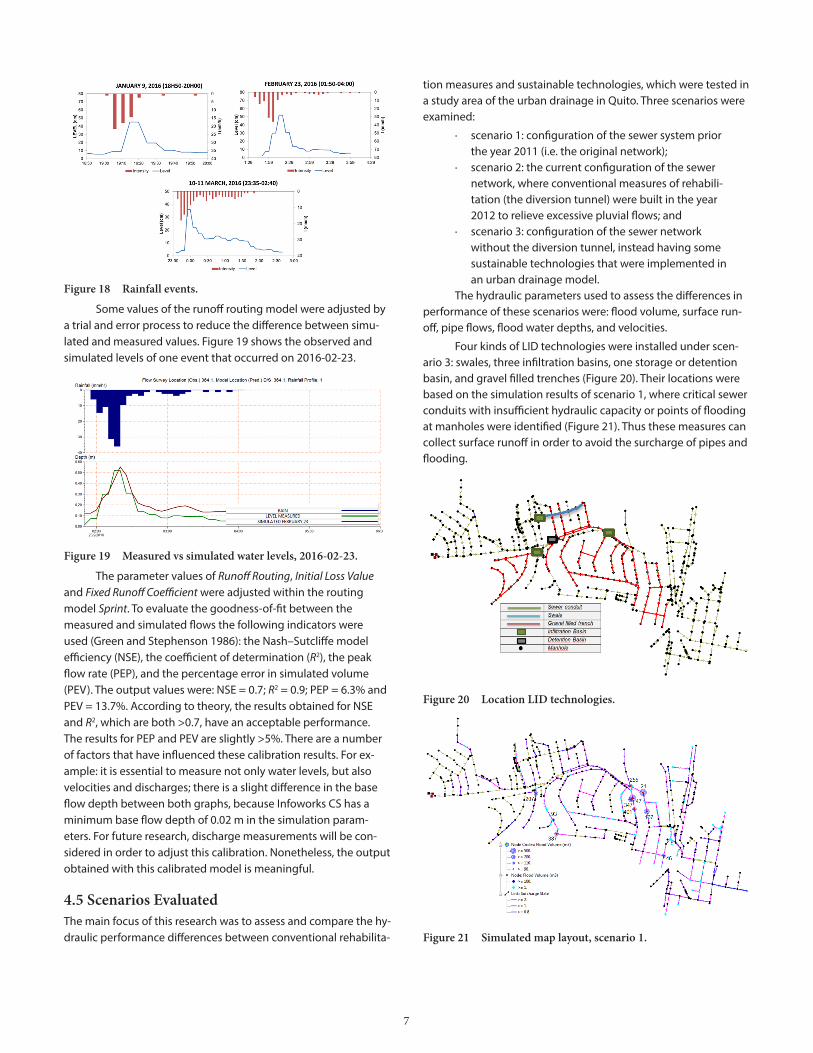
7
Figure 18 Rainfall events.
Some values of the runoff routing model were adjusted by a trial and error process to reduce the difference between simu-lated and measured values. Figure 19 shows the observed and simulated levels of one event that occurred on 2016-02-23.
Figure 19 Measured vs simulated water levels, 2016-02-23.
The parameter values of Runoff Routing, Initial Loss Value and Fixed Runoff Coefficient were adjusted within the routing model Sprint. To evaluate the goodness-of-fit between the measured and simulated flows the following indicators were used (Green and Stephenson 1986): the Nash–Sutcliffe model efficiency (NSE), the coefficient of determination (R2), the peak flow rate (PEP), and the percentage error in simulated volume (PEV). The output values were: NSE = 0.7; R2 = 0.9; PEP = 6.3% and PEV = 13.7%. According to theory, the results obtained for NSE and R2, which are both >0.7, have an acceptable performance. The results for PEP and PEV are slightly >5%. There are a number of factors that have influenced these calibration results. For ex-ample: it is essential to measure not only water levels, but also velocities and discharges; there is a slight difference in the base flow depth between both graphs, because Infoworks CS has a minimum base flow depth of 0.02 m in the simulation param-eters. For future research, discharge measurements will be con-sidered in order to adjust this calibration. Nonetheless, the output obtained with this calibrated model is meaningful.
4.5 Scenarios EvaluatedThe main focus of this research was to assess and compare the hy-draulic performance differences between conventional rehabilita-
tion measures and sustainable technologies, which were tested in a study area of the urban drainage in Quito. Three scenarios were examined:
· scenario 1: configuration of the sewer system prior the year 2011 (i.e. the original network);
· scenario 2: the current configuration of the sewer network, where conventional measures of rehabili-tation (the diversion tunnel) were built in the year 2012 to relieve excessive pluvial flows; and
· scenario 3: configuration of the sewer network without the diversion tunnel, instead having some sustainable technologies that were implemented in an urban drainage model.
The hydraulic parameters used to assess the differences in performance of these scenarios were: flood volume, surface run-off, pipe flows, flood water depths, and velocities.
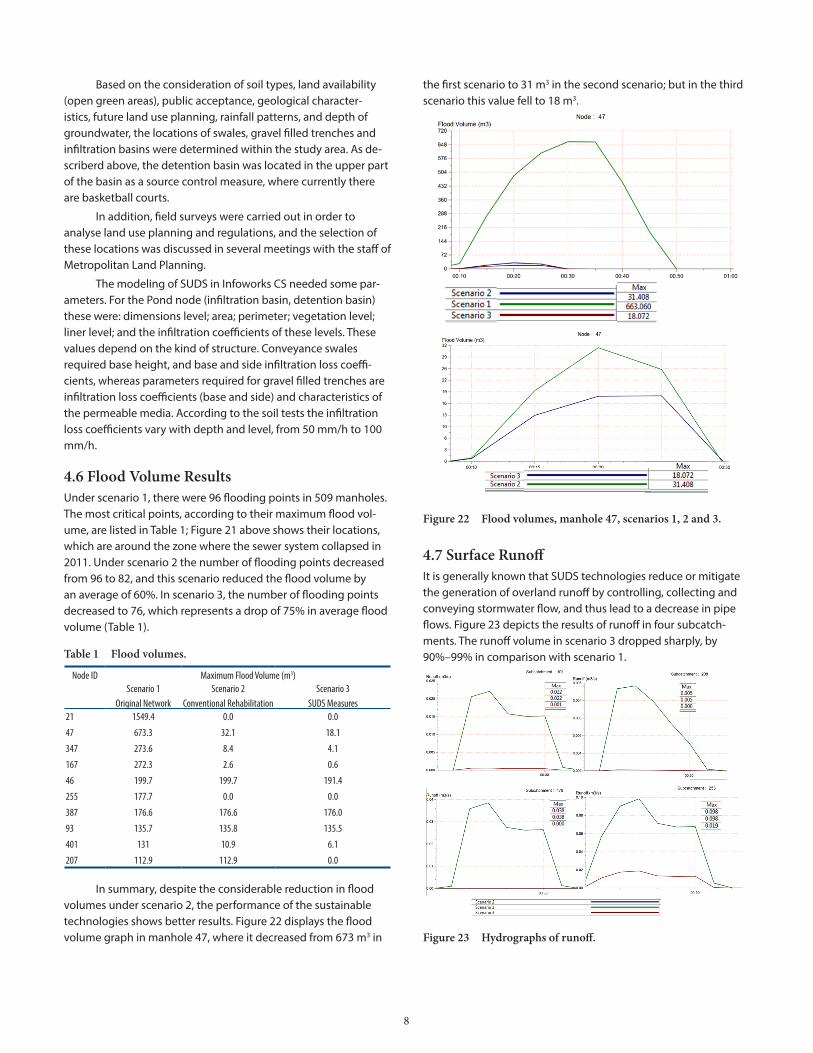
Four kinds of LID technologies were installed under scen-ario 3: swales, three infiltration basins, one storage or detention basin, and gravel filled trenches (Figure 20). Their locations were based on the simulation results of scenario 1, where critical sewer conduits with insufficient hydraulic capacity or points of flooding at manholes were identified (Figure 21). Thus these measures can collect surface runoff in order to avoid the surcharge of pipes and flooding.
Figure 20 Location LID technologies.
Figure 21 Simulated map layout, scenario 1.
8
Based on the consideration of soil types, land availability (open green areas), public acceptance, geological character-istics, future land use planning, rainfall patterns, and depth of groundwater, the locations of swales, gravel filled trenches and infiltration basins were determined within the study area. As de-scriberd above, the detention basin was located in the upper part of the basin as a source control measure, where currently there are basketball courts.
In addition, field surveys were carried out in order to analyse land use planning and regulations, and the selection of these locations was discussed in several meetings with the staff of Metropolitan Land Planning.
The modeling of SUDS in Infoworks CS needed some par-ameters. For the Pond node (infiltration basin, detention basin) these were: dimensions level; area; perimeter; vegetation level; liner level; and the infiltration coefficients of these levels. These values depend on the kind of structure. Conveyance swales required base height, and base and side infiltration loss coeffi-cients, whereas parameters required for gravel filled trenches are infiltration loss coefficients (base and side) and characteristics of the permeable media. According to the soil tests the infiltration loss coefficients vary with depth and level, from 50 mm/h to 100 mm/h.
4.6 Flood Volume ResultsUnder scenario 1, there were 96 flooding points in 509 manholes. The most critical points, according to their maximum flood vol-ume, are listed in Table 1; Figure 21 above shows their locations, which are around the zone where the sewer system collapsed in 2011. Under scenario 2 the number of flooding points decreased from 96 to 82, and this scenario reduced the flood volume by an average of 60%. In scenario 3, the number of flooding points decreased to 76, which represents a drop of 75% in average flood volume (Table 1).
Table 1 Flood volumes.
Node ID Maximum Flood Volume (m3)Scenario 1
Original NetworkScenario 2
Conventional RehabilitationScenario 3
SUDS Measures21 1549.4 0.0 0.0
47 673.3 32.1 18.1
347 273.6 8.4 4.1
167 272.3 2.6 0.6
46 199.7 199.7 191.4
255 177.7 0.0 0.0
387 176.6 176.6 176.0
93 135.7 135.8 135.5
401 131 10.9 6.1
207 112.9 112.9 0.0
In summary, despite the considerable reduction in flood volumes under scenario 2, the performance of the sustainable technologies shows better results. Figure 22 displays the flood volume graph in manhole 47, where it decreased from 673 m3 in
the first scenario to 31 m3 in the second scenario; but in the third scenario this value fell to 18 m3.
Figure 22 Flood volumes, manhole 47, scenarios 1, 2 and 3.
4.7 Surface RunoffIt is generally known that SUDS technologies reduce or mitigate the generation of overland runoff by controlling, collecting and conveying stormwater flow, and thus lead to a decrease in pipe flows. Figure 23 depicts the results of runoff in four subcatch-ments. The runoff volume in scenario 3 dropped sharply, by 90%–99% in comparison with scenario 1.
Figure 23 Hydrographs of runoff.
9
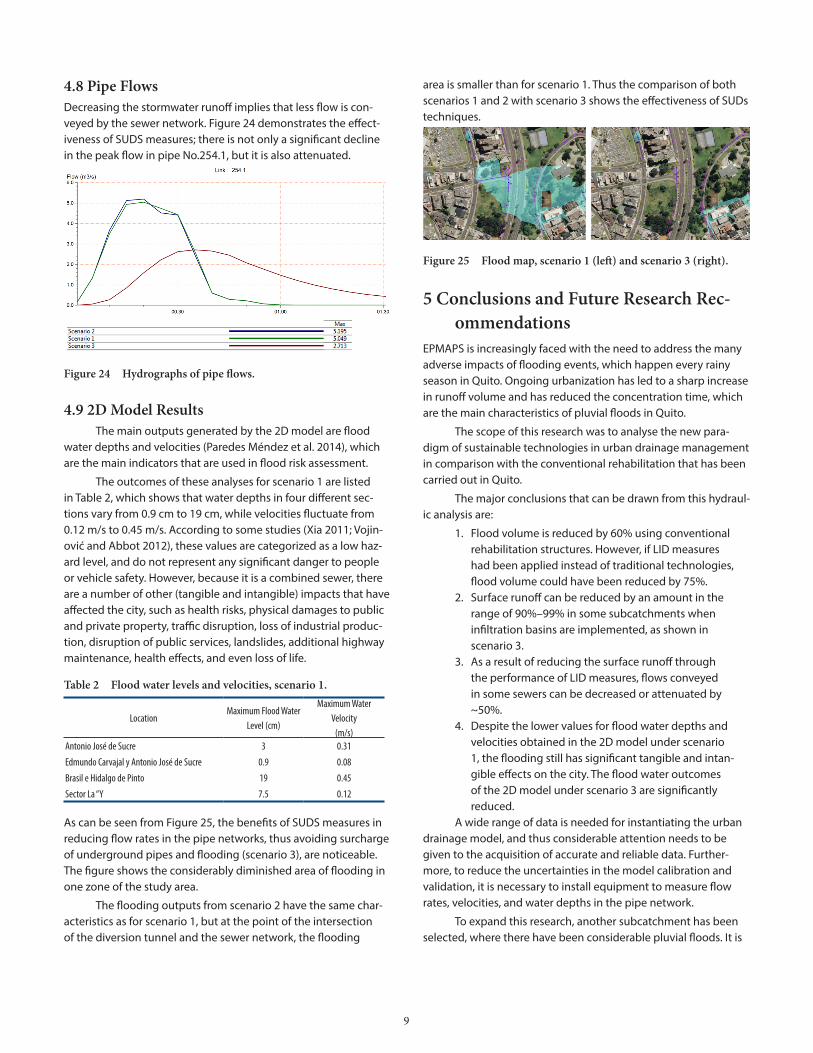
4.8 Pipe FlowsDecreasing the stormwater runoff implies that less flow is con-veyed by the sewer network. Figure 24 demonstrates the effect-iveness of SUDS measures; there is not only a significant decline in the peak flow in pipe No.254.1, but it is also attenuated.
Figure 24 Hydrographs of pipe flows.
4.9 2D Model ResultsThe main outputs generated by the 2D model are flood
water depths and velocities (Paredes Méndez et al. 2014), which are the main indicators that are used in flood risk assessment.
The outcomes of these analyses for scenario 1 are listed in Table 2, which shows that water depths in four different sec-tions vary from 0.9 cm to 19 cm, while velocities fluctuate from 0.12 m/s to 0.45 m/s. According to some studies (Xia 2011; Vojin-ović and Abbot 2012), these values are categorized as a low haz-ard level, and do not represent any significant danger to people or vehicle safety. However, because it is a combined sewer, there are a number of other (tangible and intangible) impacts that have affected the city, such as health risks, physical damages to public and private property, traffic disruption, loss of industrial produc-tion, disruption of public services, landslides, additional highway maintenance, health effects, and even loss of life.
Table 2 Flood water levels and velocities, scenario 1.
LocationMaximum Flood Water
Level (cm)
Maximum Water Velocity
(m/s)Antonio José de Sucre 3 0.31
Edmundo Carvajal y Antonio José de Sucre 0.9 0.08
Brasil e Hidalgo de Pinto 19 0.45
Sector La “Y 7.5 0.12
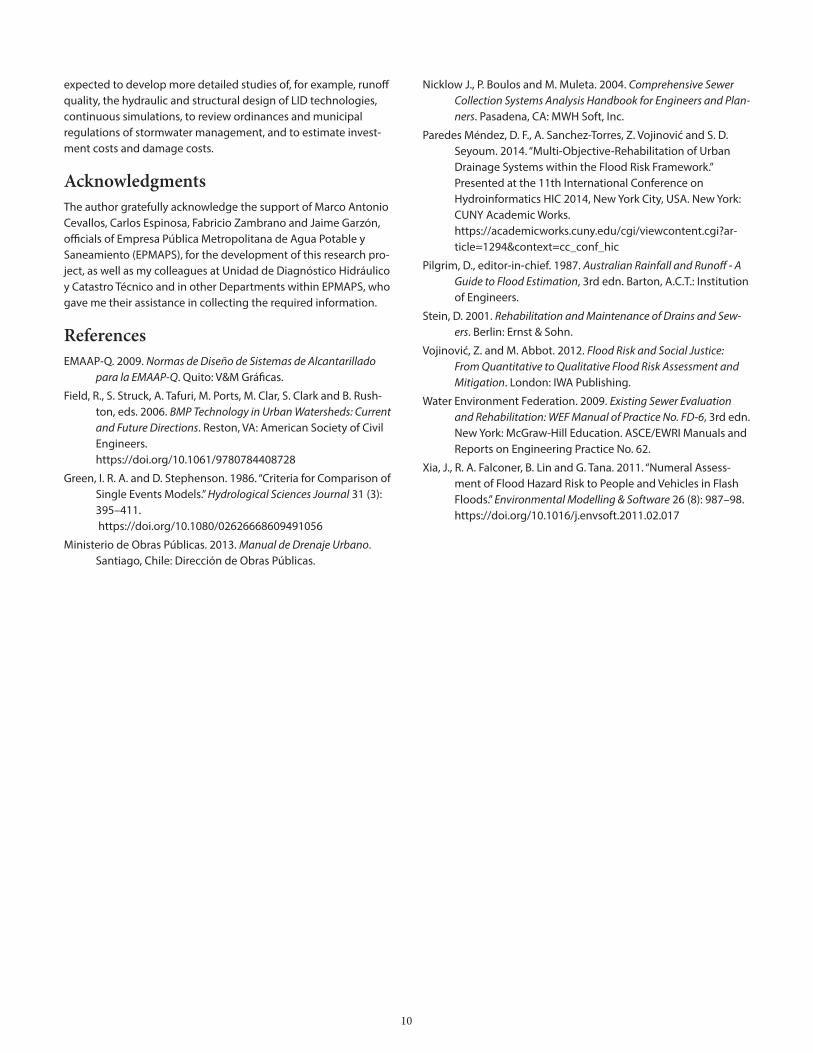
As can be seen from Figure 25, the benefits of SUDS measures in reducing flow rates in the pipe networks, thus avoiding surcharge of underground pipes and flooding (scenario 3), are noticeable. The figure shows the considerably diminished area of flooding in one zone of the study area.
The flooding outputs from scenario 2 have the same char-acteristics as for scenario 1, but at the point of the intersection of the diversion tunnel and the sewer network, the flooding
area is smaller than for scenario 1. Thus the comparison of both scenarios 1 and 2 with scenario 3 shows the effectiveness of SUDs techniques.
Figure 25 Flood map, scenario 1 (left) and scenario 3 (right).
5 Conclusions and Future Research Rec-ommendations
EPMAPS is increasingly faced with the need to address the many adverse impacts of flooding events, which happen every rainy season in Quito. Ongoing urbanization has led to a sharp increase in runoff volume and has reduced the concentration time, which are the main characteristics of pluvial floods in Quito.
The scope of this research was to analyse the new para-digm of sustainable technologies in urban drainage management in comparison with the conventional rehabilitation that has been carried out in Quito.
The major conclusions that can be drawn from this hydraul-ic analysis are:
1. Flood volume is reduced by 60% using conventional rehabilitation structures. However, if LID measures had been applied instead of traditional technologies, flood volume could have been reduced by 75%.
2. Surface runoff can be reduced by an amount in the range of 90%–99% in some subcatchments when infiltration basins are implemented, as shown in scenario 3.
3. As a result of reducing the surface runoff through the performance of LID measures, flows conveyed in some sewers can be decreased or attenuated by ~50%.
4. Despite the lower values for flood water depths and velocities obtained in the 2D model under scenario 1, the flooding still has significant tangible and intan-gible effects on the city. The flood water outcomes of the 2D model under scenario 3 are significantly reduced.
A wide range of data is needed for instantiating the urban drainage model, and thus considerable attention needs to be given to the acquisition of accurate and reliable data. Further-more, to reduce the uncertainties in the model calibration and validation, it is necessary to install equipment to measure flow rates, velocities, and water depths in the pipe network.
To expand this research, another subcatchment has been selected, where there have been considerable pluvial floods. It is
10
expected to develop more detailed studies of, for example, runoff quality, the hydraulic and structural design of LID technologies, continuous simulations, to review ordinances and municipal regulations of stormwater management, and to estimate invest-ment costs and damage costs.
AcknowledgmentsThe author gratefully acknowledge the support of Marco Antonio Cevallos, Carlos Espinosa, Fabricio Zambrano and Jaime Garzón, officials of Empresa Pública Metropolitana de Agua Potable y Saneamiento (EPMAPS), for the development of this research pro-ject, as well as my colleagues at Unidad de Diagnóstico Hidráulico y Catastro Técnico and in other Departments within EPMAPS, who gave me their assistance in collecting the required information.
ReferencesEMAAP-Q. 2009. Normas de Diseño de Sistemas de Alcantarillado
para la EMAAP-Q. Quito: V&M Gráficas.
Field, R., S. Struck, A. Tafuri, M. Ports, M. Clar, S. Clark and B. Rush-ton, eds. 2006. BMP Technology in Urban Watersheds: Current and Future Directions. Reston, VA: American Society of Civil Engineers. https://doi.org/10.1061/9780784408728
Green, I. R. A. and D. Stephenson. 1986. “Criteria for Comparison of Single Events Models.” Hydrological Sciences Journal 31 (3): 395–411. https://doi.org/10.1080/02626668609491056
Ministerio de Obras Públicas. 2013. Manual de Drenaje Urbano. Santiago, Chile: Dirección de Obras Públicas.
Nicklow J., P. Boulos and M. Muleta. 2004. Comprehensive Sewer Collection Systems Analysis Handbook for Engineers and Plan-ners. Pasadena, CA: MWH Soft, Inc.
Paredes Méndez, D. F., A. Sanchez-Torres, Z. Vojinović and S. D. Seyoum. 2014. “Multi-Objective-Rehabilitation of Urban Drainage Systems within the Flood Risk Framework.” Presented at the 11th International Conference on Hydroinformatics HIC 2014, New York City, USA. New York: CUNY Academic Works. https://academicworks.cuny.edu/cgi/viewcontent.cgi?ar-ticle=1294&context=cc_conf_hic
Pilgrim, D., editor-in-chief. 1987. Australian Rainfall and Runoff - A Guide to Flood Estimation, 3rd edn. Barton, A.C.T.: Institution of Engineers.
Stein, D. 2001. Rehabilitation and Maintenance of Drains and Sew-ers. Berlin: Ernst & Sohn.
Vojinović, Z. and M. Abbot. 2012. Flood Risk and Social Justice: From Quantitative to Qualitative Flood Risk Assessment and Mitigation. London: IWA Publishing.
Water Environment Federation. 2009. Existing Sewer Evaluation and Rehabilitation: WEF Manual of Practice No. FD-6, 3rd edn. New York: McGraw-Hill Education. ASCE/EWRI Manuals and Reports on Engineering Practice No. 62.
Xia, J., R. A. Falconer, B. Lin and G. Tana. 2011. “Numeral Assess-ment of Flood Hazard Risk to People and Vehicles in Flash Floods.” Environmental Modelling & Software 26 (8): 987–98. https://doi.org/10.1016/j.envsoft.2011.02.017