hybrid wet/dry cooling for power plants (presentation) · pdf filehybrid wet/dry cooling for...
TRANSCRIPT

Hybrid Wet/Dry Cooling for Power Plants
Hybrid Wet/Dry Cooling for Power Plants
Chuck KutscherAaron Buys
Chris GladdenNREL
NREL/PR-550-40026Presented at the 2006 Parabolic Trou
Parabolic Trough Technology WorkshopFebruary 14, 2006
gh Technology Workshop held on February 14-16, 2006, in Incline Village, Nevada.
NREL/PR-550-40026Presented at the 2006 Parabolic Trough Technology Workshop held on February 14-16, 2006, in Incline Village, Nevada.

Disclaimer and Government License
This work has been authored by Midwest Research Institute (MRI) under Contract No. DE-AC36-99GO10337 with the U.S. Department of Energy (the “DOE”). The United States Government (the “Government”) retains and the publisher, by accepting the work for publication, acknowledges that the Government retains a non-exclusive, paid-up, irrevocable, worldwide license to publish or reproduce the published form of this work, or allow others to do so, for Government purposes.
Neither MRI, the DOE, the Government, nor any other agency thereof, nor any of their employees, makes any warranty, express or implied, or assumes any liability or responsibility for the accuracy, completeness, or usefulness of any information, apparatus, product, or process disclosed, or represents that its use would not infringe any privately owned rights. Reference herein to any specific commercial product, process, or service by trade name, trademark, manufacturer, or otherwise does not constitute or imply its endorsement, recommendation, or favoring by the Government or any agency thereof. The views and opinions of the authors and/or presenters expressed herein do not necessarily state or reflect those of MRI, the DOE, the Government, or any agency thereof.

OutlineOutline• Overview of cooling options• Analysis of evaporative enhancement of
air-cooled geothermal power plants• Field measurements at geothermal plant• Preliminary analysis of trough plant• Improvements to air-cooled condensers

Water-Saving OptionsWater-Saving OptionsApproach Pros Cons
ACC + WCC in Series - ACC can handle desuperheating load
- Cost of dual equipment- Condensate temp. very
limited ACC + WCC in Parallel - Simple design
- Improves approach to dry bulb
- Condensate temp. limited by dry bulb
ACC w/ Evap Media - Can achieve good approach to wet bulb on inlet air
- Cost of media- Pressure drop lowers
flow rate and LMTDACC w/ Spray Nozzles - Simple, low cost of
nozzles- Low pressure drop
- Overspray and water waste
- Cost of water treatment or mist eliminator
- Nozzle maintenance- Potential damage to
finned tubesDeluge of ACC - Highest enhancement - Water treatment or
protective coating needed

RelevanceRelevance• Air-cooled geothermal plants especially susceptible to
high ambient temperature
• Plant power decreases ~1% of rated power for every1ºF rise in condenser temperature
• Output of air-cooled plant can drop > 50% in summer, when electricity is highly valued
Unit 200 Performance Data
-
500
1,000
1,500
2,000
2,500
3,000
40 45 50 55 60 65 70 75 80 85Ambient Temperature °F (@weather station)
Net
Out
put -
kW

Spreadsheet Model of Evaporative Enhancements
to Existing Air-Cooled Plants
Spreadsheet Model of Evaporative Enhancements
to Existing Air-Cooled Plants

System 1 - Spray CoolingSystem 1 - Spray Cooling
• Low cost, low air pressure drop• High water pressure• Over-spray and carryover or cost of mist
eliminator• Nozzle clogging

System 2 - Munters CoolingSystem 2 - Munters Cooling
• High efficiency, minimum carryover• High air pressure drop (reduces air flow
rate and decreases LMTD)• High cost
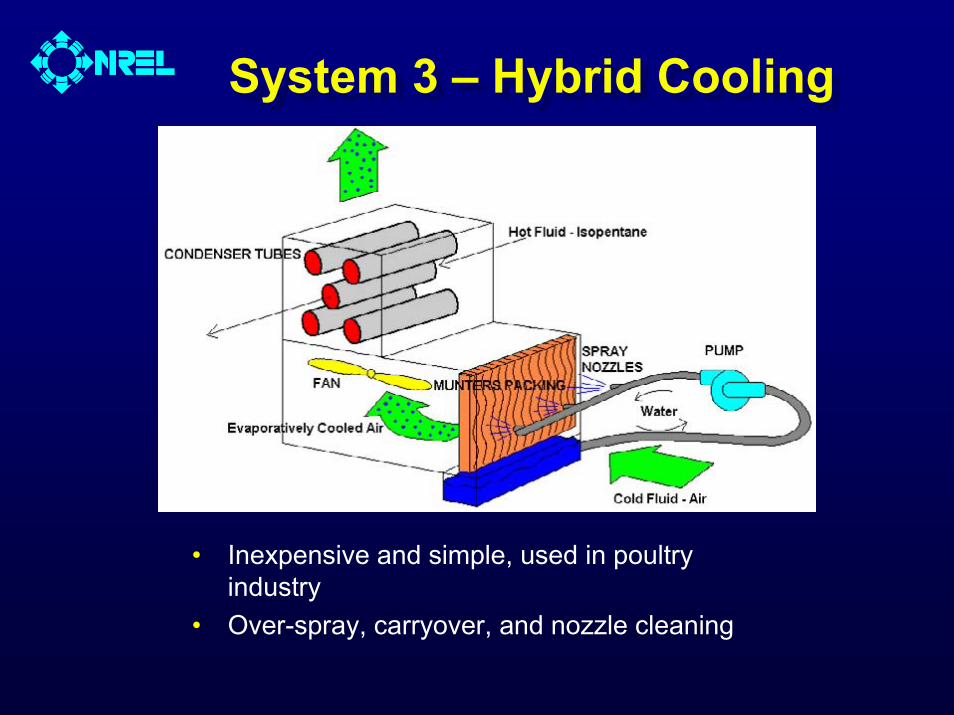
System 3 – Hybrid CoolingSystem 3 – Hybrid Cooling
• Inexpensive and simple, used in poultry industry
• Over-spray, carryover, and nozzle cleaning

System 4 – Deluge CoolingSystem 4 – Deluge Cooling
• Excellent performance• Danger of scaling and deposition without
pure water


Example Analysis:Net Power ProducedExample Analysis:
Net Power Produced
Total Kilowatt-hours Produced
500,000
600,000
700,000
800,000
900,000
Kilo
wat
t-hou
rs
No EnhancementSpray CoolingMunters CoolingDeluge CoolingHybrid Cooling
Jan Feb Mar Apr May Jun Jul Aug Sep Oct Nov Dec

Example Cost ResultsExample Cost Results
5.2
6.4
7.67.2
8.5
9.9
5.7
7.2
8.7
3.54.2
4.9
0.0
1.0
2.0
3.0
4.0
5.0
6.0
7.0
8.0
9.0
10.0C
ents
/kW
h
System 1 - SprayCooling
System 2 -Munters Cooling
System 3 -Hybrid Cooling
System 4 -Deluge Cooling
Incremental Cost of Added ElectricityDiscount Rate = 10%, Plant Life = 25 years
$0/kgal$0.5/kgal$1/kgal
Note: Value of electricity will be affected by time-of-day ratesand capacity payments.
Note: Value of electricity will be affected by time-of-day ratesand capacity payments.

Geothermal Analysis Conclusions
Geothermal Analysis Conclusions
• Deluge most attractive if scaling/corrosion issues can be addressed
• Systems 1 to 3 obtain ~40 kWh/kgal of water; deluge can produce an average of ~60 kWh/kgal
• Results very sensitive to water costs, electric rate structure, installation costs

Coated Fin Test ResultsCoated Fin Test Results
OMP-coated fin unaffected by salt spray
Plain fin pitted

Measurements at MammothMeasurements at Mammoth

Measurements at MammothBinary-Cycle Geothermal Power Plant
Measurements at MammothBinary-Cycle Geothermal Power Plant
Munters system
Hybrid spray/Munters system

Mammoth Measurement Results: 2001
Mammoth Measurement Results: 2001
• Field instrumentation: Type T thermocouples, optical dew point (chilled mirror) hygrometer, handheld anemometer
• Munters had 79% saturation efficiency;hybrid was 50%
• Flow rate with Munters dropped 22-28%
• Munters increased net power 62% (800 kW to 1,300 kW) at 78ºF ambient

Munters Performance at Mammoth
Munters Performance at Mammoth
Unit 200 Performance Data
-
500
1,000
1,500
2,000
2,500
3,000
40 45 50 55 60 65 70 75 80 85Ambient Temperature °F (@weather station)
Net
Out
put -
kW
after Munters
before Munters

Mammoth MeasurementResults: 2002
Mammoth MeasurementResults: 2002
• Munters system modified, brine used for cooling water. Munters efficiency dropped from 79% to 66%

Geothermal ConclusionsGeothermal Conclusions
• All operators of air-cooled plants interested in evaporativeenhancement
• Costs at existing plants are site-specific and negotiable; $0.50 to $2.00 per thousand gallons
• Reclaimed water becoming more widely available
• Two-Phase Engineering showed successful use of nozzles with brine
• Can reduce average cost of electricity by about 0.3 ¢/kWh, depending on cost of water
• Capacity payments can be as high as 30 ¢/kWh and lower average cost of electricity by 2–3 ¢/kWh


Parabolic Trough PlantPreliminary Analysis
Parabolic Trough PlantPreliminary Analysis
UW EES ModelPower Out and Ht. Rejection
vs. CondenserPressure and Field Flowrate
UW EES ModelPower Out and Ht. Rejection
vs. CondenserPressure and Field Flowrate
NREL Hour-by-hourEES Model
Of Condenser Types andEvap Cooling
NREL Hour-by-hourEES Model
Of Condenser Types andEvap Cooling
NREL Excel ModelOf Costs
NREL Excel ModelOf Costs
ExcelergyField Flowrate vs.
TMY2 Radiation
ExcelergyField Flowrate vs.
TMY2 Radiation

Cases ExaminedCases Examined• Air-Cooled• Water-Cooled• Air-Cooled with Spray Enhancement

General AssumptionsGeneral Assumptions• 30 MWe SEGS plant, Daggett weather• $0.18/kWh electricity (€0.15/kWh)• Water at $1.95/kgal ($515/m3, €430/m3)• 15% interest rate• 30-year life

Water-Cooled PlantWater-Cooled Plant• Shell-and-tube condenser + cooling tower• Twb = 68°F (20°C)• Approach = 10°F (5.6°C)• Range = 20°F (11.1°C)• Pinch = 5°F (2.8°C)• U = 400 Btu/h-ft2-°F (2270 W/m2-°C)

Air-Cooled PlantAir-Cooled Plant• Finned tube condenser• Tdb = 104°F (40°C)• ITD = 40°F (22°C)• Pinch = 5°F (2.8°C)• U = 150 Btu/h-ft2-°F (850 W/m2-°C)

Evaporative Pre-CoolingEvaporative Pre-Cooling• 300 psig spray nozzles• 70% evaporation efficiency• 80% saturation efficiency• Munters DRIFdek mist eliminator

Net Electricity Produced Per Year for Different Condenser Types
0
10000
20000
30000
40000
50000
60000
70000
80000
90000
100000
Water Cooled Air Cooled Evaporatively Pre-Cooled
Year
ly E
lect
ricity
Pro
duce
d [M
We-
hr]

0
2000
4000
6000
8000
10000
12000
0 1 2 3 4 5 6 7 8 9 10 11 12 13Month Number
Ele
ctric
ity P
rodu
ced
[MW
e-hr
]
Water CooledEvaporatively Pre-cooledAir Cooled

Effect of Purchase Price of Electricity on Yearly Revenue(Water Cost = $2/kgal)
-4.0%
-2.0%
0.0%
2.0%
4.0%
6.0%
0.00 0.04 0.08 0.12 0.16 0.20 0.24
Price of Electricity [$/kWh]
Perc
ent I
ncre
ase
in Y
early
Rev
enue
(C
ompa
red
to A
ir-C
oole
d)
Water CooledEvaporatively Pre-cooled

Effect of Water Price on Yearly Revenue(Electricity Price = $0.18/kWh)
0.0%
1.0%
2.0%
3.0%
4.0%
5.0%
6.0%
0.00 1.00 2.00 3.00 4.00 5.00 6.00 7.00
Price of Water [$/1000 gallons]
Perc
ent I
ncre
ase
in Y
early
Rev
enue
Water CooledEvaporatively Pre-cooled

Water Use for Different Condenser Types
0
10
20
30
40
50
60
70
80
90
Water Cooled Evaporatively Pre-cooled
Mill
ions
of G
allo
ns o
f Wat
er P
er Y
ear

Next StepsNext Steps
• Evaluate potential for water restrictions• Develop full plant EES model• Improve cost estimation• Analyze parallel wet-dry system

Brief Review of NREL R&Don Advanced Fins for
Air-Cooled Condensers
Brief Review of NREL R&Don Advanced Fins for
Air-Cooled Condensers

McElroy Enhanced FinsMcElroy Enhanced Fins

Test SectionTest Section

Heat Transfer vs. Hydraulic Power
Different Fin Types (Staggered Array)
14.00
16.00
18.00
20.00
22.00
24.00
26.00
28.00
30.00
0.00 20.00 40.00 60.00 80.00 100.00 120.00 140.00 160.00 180.00 200.00
Hydraulic Power / Bare Tube Area (kW SL / m^2)
Hea
t Tra
nsfe
r / T
ube
Are
a (k
W/m
^2)
Plain Fin Staggered Perforated Fin Staggered Perforated Fin 2 Staggered

Tabbed Fin ConceptTabbed Fin Concept
Tabbed Plate FinTabbed Plate Fin Tabbed Plate Fin Heat ExchangerTabbed Plate Fin Heat Exchanger

Individual FinsIndividual Fins
GEA fins w/spacersGEA fins w/spacers NREL tabbed circular finNREL tabbed circular fin

Detailed CFD Model Isometric Views:Heat Flux and Total Pressure
Detailed CFD Model Isometric Views:Heat Flux and Total Pressure
Surface Heat FluxSurface Heat Flux Total PressureTotal Pressure


Recent Tabbed Fin CFD Results
Recent Tabbed Fin CFD Results
Heat Transfer Vs. Hydraulic Power (Sea Level)
0
5
10
15
20
25
30
0 25 50 75 100 125Hydraulic Power (Watts)
Hea
t Tra
nsfe
r (kW
)
v2.2 v2.3v2.4 v2.5v2.6 v2.7Plain Plain/RibbedX-fin (Approximated)