hurricane carlos · carlos weakened to a tropical storm around 0000 utc 15 june while located about...
TRANSCRIPT

NATIONAL HURRICANE CENTER TROPICAL CYCLONE REPORT
HURRICANE CARLOS (EP032015) 10-17 June 2015
John L. Beven II and Christopher W. Landsea National Hurricane Center
27 October 2015
LARGE VERSUS SMALL CARLOS: 89 GHZ MICROWAVE IMAGERY AT 1851 UTC 10 JUNE (LEFT IMAGE) AND AT 0840 UTC
16 JUNE (RIGHT IMAGE) (IMAGES PROVIDED BY THE NAVAL RESEARCH LABORATORY)
Carlos was a tiny category 1 hurricane (on the Saffir-Simpson Hurricane Wind Scale)
that weakened rapidly before striking Mexico as a 45-kt tropical storm.

Hurricane Carlos 2
Hurricane Carlos 10-17 JUNE 2015
SYNOPTIC HISTORY A prominent eastward moving Kelvin wave crossed the Pacific Ocean in early June, interacting with a few westward-moving African easterly waves to spin up a large cyclonic gyre with a substantial amount of disorganized deep convection a few hundred miles south of southeastern Mexico on 8-9 June. On 10 June, the convection became more organized around a well-defined center and a tropical depression is estimated to have formed around 1800 UTC on that date, about 250 n mi south-southwest of Puerto Escondido, Mexico. The system initially had a large circulation with deep convection extending about 300 n mi in diameter (left cover figure). The “best track” chart of the tropical cyclone’s path is given in Fig. 1, with the wind and pressure histories shown in Figs. 2 and 3, respectively. The best track positions and intensities are listed in Table 11.
The tropical cyclone moved toward the west-northwest to the south of a deep-layer subtropical ridge, while upper-level northeasterly winds associated with the subtropical ridge helped to impart about 15 kt of 850-200 mb vertical wind shear. Under the influence of this moderate shear, warm sea surface temperatures, and a moist, unstable atmosphere, the system gradually intensified from 10-12 June. It reached tropical storm intensity around 1200 UTC 11 June, while located about 200 n mi south of Acapulco, Mexico. From 12-14 June, a mid-level trough over the Gulf of Mexico weakened the ridge and associated steering flow, which caused Carlos to meander just offshore of southern Mexico. After pausing in development on 12 June at an intensity of 50 kt, Carlos quickly intensified, becoming a hurricane around 1200 UTC 13 June while it developed an eye. At that time, it was located about 125 n mi south of Acapulco.
A mid to upper-level ridge redeveloped north of Carlos on 14 June, helping to advect the hurricane on a track toward the west-northwest to northwest during the following couple of days, parallel to the southern coast of Mexico. On late 14 and early 15 June, the convective structure of Carlos deteriorated, perhaps due to upwelled cool water induced by the meandering motion of the tropical cyclone. Carlos weakened to a tropical storm around 0000 UTC 15 June while located about 65 n mi west-southwest of Acapulco. Carlos again began moving toward the west-northwest by late on 14 June and the system reintensified to a hurricane around 1800 UTC 15 June, when the center was located about 75 n mi southwest of Lazaro Cardenas, Mexico. Carlos attained a peak intensity at 80 kt around 1800 UTC 16 June, while centered about 90 n mi south of Manzanillo, Mexico (Figure 4). During this period of intensification, the hurricane’s size diminished appreciably, with a radius of maximum wind of about 5 n mi and tropical-storm-force
1 A digital record of the complete best track, including wind radii, can be found on line at ftp://ftp.nhc.noaa.gov/atcf. Data for the current year’s storms are located in the btk directory, while previous years’ data are located in the archive directory.

Hurricane Carlos 3
winds extending out only 30-40 n mi from the center (right cover figure). It is very unusual for a tropical cyclone with a large precursor disturbance to become so small.
Only 6 h after the cyclone attained peak intensity, Carlos’ surface center was dramatically separated from the deep convection and its mid- to upper-level circulation (Figure 4). Carlos rapidly decayed on 17 June before making landfall in Mexico, weakening from 80 kt at 1800 UTC 16 June to 45 kt at 0900 17 June, apparently due to the entrainment of dry and stable air into the inner core. After landfall, the decaying vortex accelerated northwestward just inland of the southwestern coast of Mexico on 17 and early 18 June. Carlos lost its deep convection around 1800 UTC 17 June, becoming a remnant low at that time. After 0000 UTC 18 June, the remnant low dissipated in the vicinity of the Islas Marias, Mexico.
METEOROLOGICAL STATISTICS Observations in Carlos (Figs. 2 and 3) include subjective satellite-based Dvorak technique intensity estimates from the Tropical Analysis and Forecast Branch (TAFB) and the Satellite Analysis Branch (SAB), and objective Advanced Dvorak Technique (ADT) estimates from the Cooperative Institute for Meteorological Satellite Studies/University of Wisconsin-Madison. Observations also include flight-level, stepped frequency microwave radiometer (SFMR), and dropwindsonde observations from two flights of the 53rd Weather Reconnaissance Squadron of the U. S. Air Force Reserve Command (AFRC) on 15-16 June. Data and imagery from NOAA polar-orbiting satellites including the Advanced Microwave Sounding Unit (AMSU), the NASA Global Precipitation Mission (GPM), the European Space Agency’s Advanced Scatterometer (ASCAT), and Defense Meteorological Satellite Program (DMSP) satellites, among others, were also useful in constructing the best track of Carlos. Radar imagery from the Acapulco radar of Comisión Nacional del Agua (CONAGUA - the national meteorological service of Mexico) were useful in determining the position and convective structure of Carlos on 12-13 June.
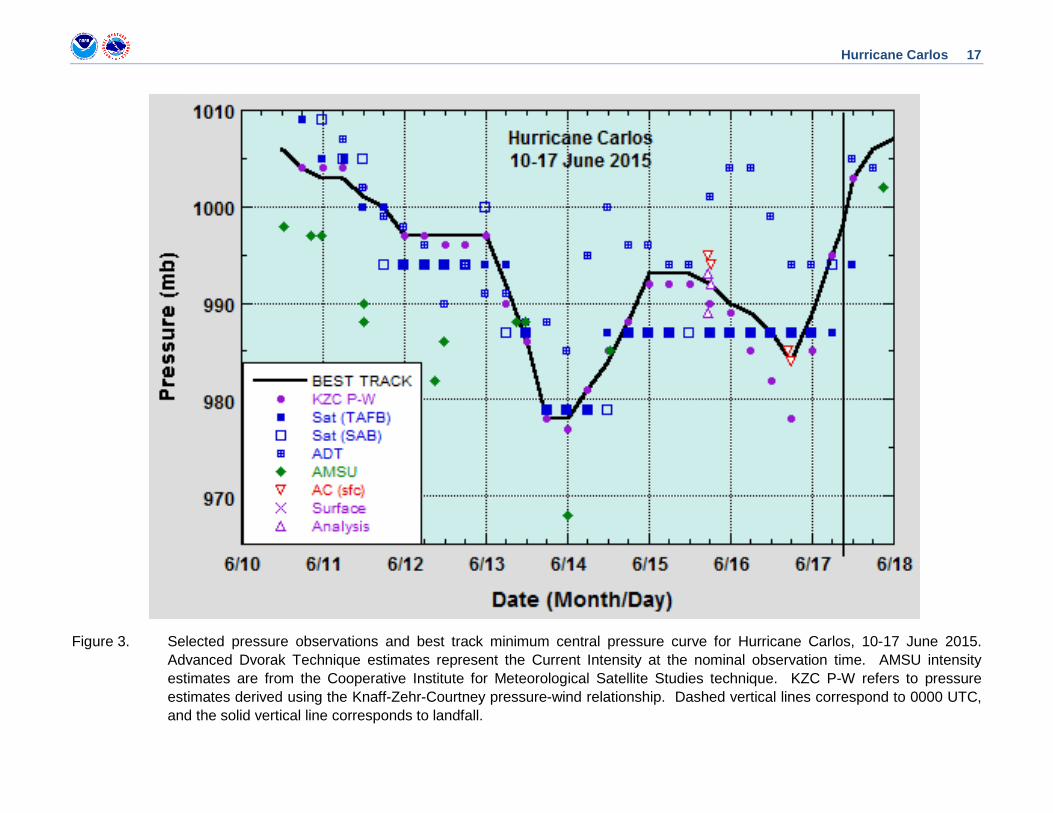
Winds and Pressure Carlos’ estimated peak intensity of 80 kt at 1800 UTC 16 June is based on the AFRC aircraft observations of 90-kt 700 mb flight-level winds and 81-kt SFMR surface winds. The lowest central pressure is estimated to be 978 mb at 1800 UTC 13 June and 0000 UTC 14 June, based upon the Knaff-Zehr-Courtney pressure-wind relationship applied to the analyzed intensity. The central pressure at the time of the peak intensity (984 mb) was not as low, likely because of the very small size of Carlos’ inner core.
Carlos’ landfall in Mexico occurred around 0900 UTC 17 June, near Tenacatita. The intensity at landfall is estimated to be 45 kt, but is quite uncertain due to the rapid weakening that occurred just before landfall.
Peak wind observations from Mexico were the following: 27-kt sustained winds with a 37-kt gust at 1048Z 14 June at Acapulco (MMAA), a 37-kt gust at 1415 UTC 14 June at Isla Roqueta, a 24-kt sustained wind at 1130 UTC, and a 65-kt gust at 1140 UTC at Chamelucuixmala on 17 June. It is likely that other locations along the southern coast of Mexico experienced tropical

Hurricane Carlos 4
storm conditions. Despite the very close approach of Carlos to Mexico as a hurricane, sustained hurricane-force winds likely did not reach the coast because of the very small wind field.
No ships reported any winds of tropical storm force or stronger in association with Carlos.
Storm Surge There are no reports of significant storm surge associated with Carlos.
Rainfall and Flooding Carlos caused locally heavy rains over portions of southern and western Mexico (Table 2 and Figure 5) from 11-19 June. The heaviest amounts were in the state of Oaxaca, where Union Hildago reported 11.97 inches and Chicapa reported 10.83 inches. These rains likely caused fresh water flooding. It should be noted that heavy rains occurred in other portions of Mexico during this period, some of which were associated with Tropical Storm Bill in the Gulf of Mexico.
Tornadoes There were no reports of tornadoes associated with Carlos.
CASUALTY AND DAMAGE STATISTICS The news agency EFE reported that one person died after being seriously injured by a falling metal structure in Guadalajara, Mexico. While this death was reported as being due to Carlos, an examination of the circumstances suggests it was instead caused by a severe local storm not associated with the hurricane. Therefore, it will not be included as a death due to Carlos.
La Jornada, a Mexico City newspaper, reported that high surf generated by Carlos damaged a few dozen boats and sank several boats in Acapulco, while strong winds knocked down trees and billboards. According to the news site MiMorelia.com, large waves and heavy rain caused at least 5 million pesos (US $326,000) in damage to coastal structures near Lazaro Cardenas.
FORECAST AND WARNING CRITIQUE
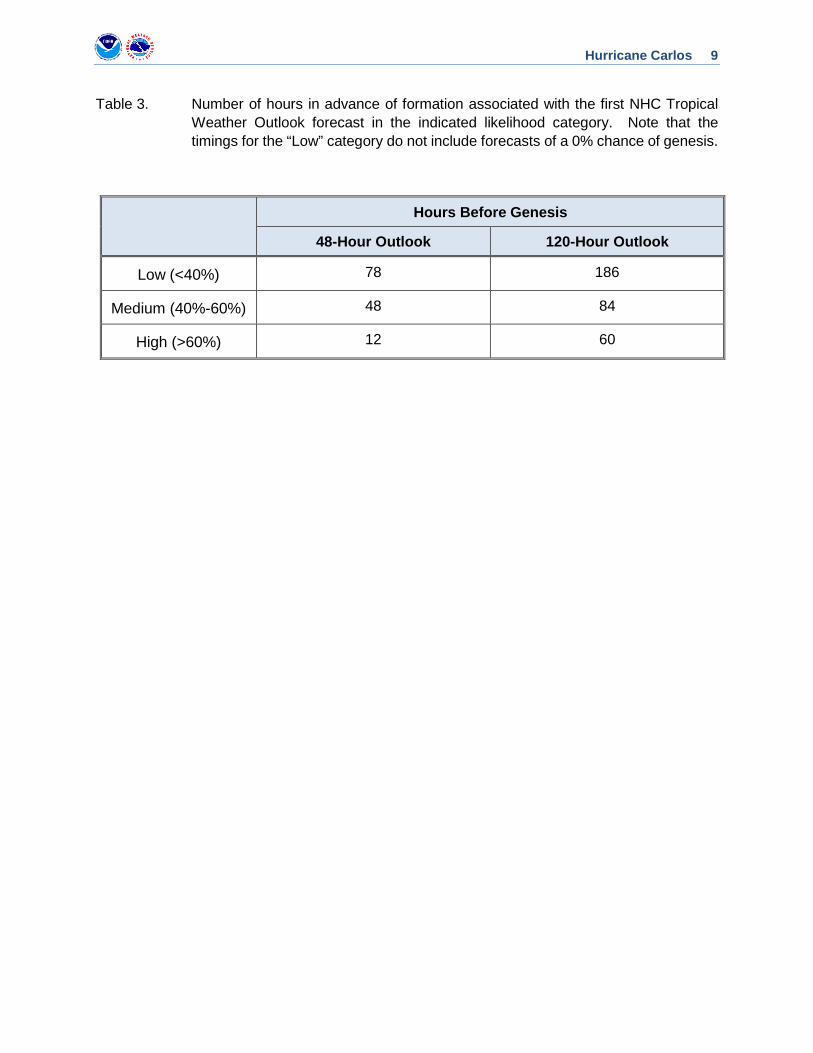
The genesis of Carlos was well predicted. Table 3 indicates the number of hours in advance of formation associated with the first NHC Tropical Weather Outlook forecast in the indicated likelihood category. In the 120 h Outlook, the precursor disturbance was first mentioned over seven days before formation, with the forecast reaching a high (>60%) likelihood two and half days in advance. Similarly, in the 48 h Outlook, the precursor disturbance was included more

Hurricane Carlos 5
than three days ahead of formation, with the predictions reaching the high category 12 h before genesis.
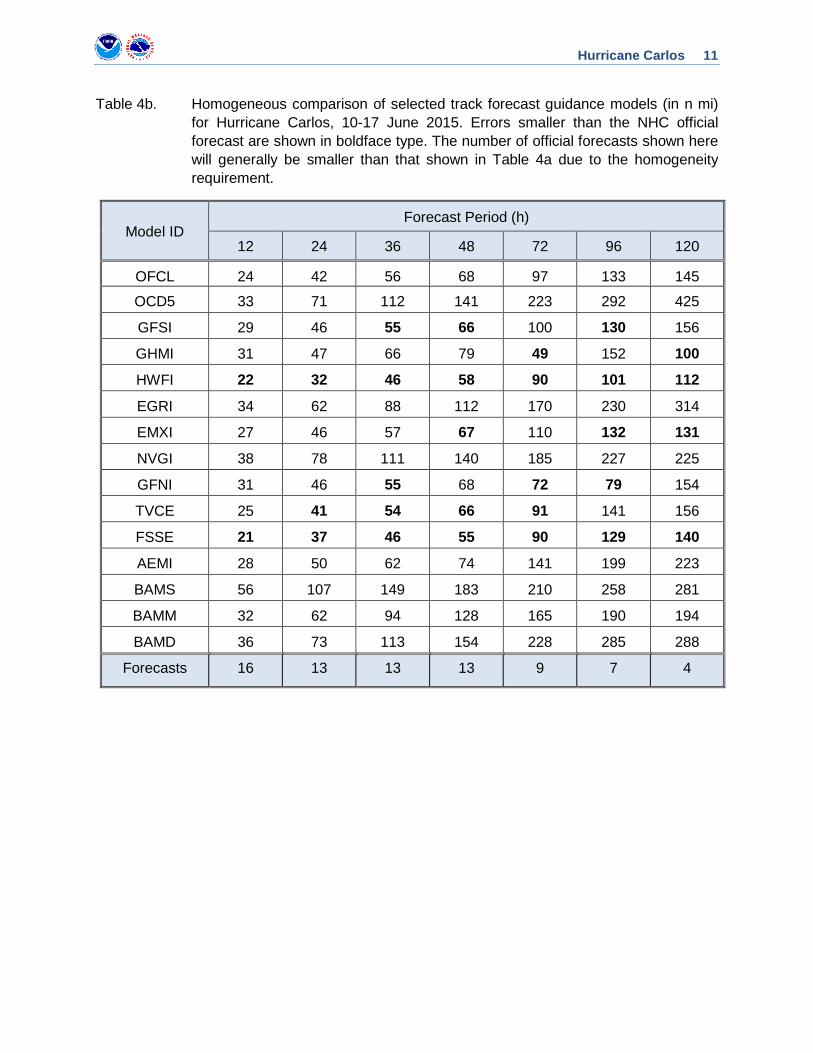
A verification of NHC official (OFCL) track forecasts for Carlos is given in Table 4a. Official forecast track errors were about the same as the mean official errors for the previous 5-yr period for the 12-36 h forecasts and lower than the mean for the 48-120 h predictions. A homogeneous comparison of the official track errors with selected guidance models is given in Table 4b. The best-performing model overall was the regional Hurricane Weather Research and Forecast model (HWFI), as it outperformed OFCL at all time periods and had the lowest errors of all models at 24 and 36 h.
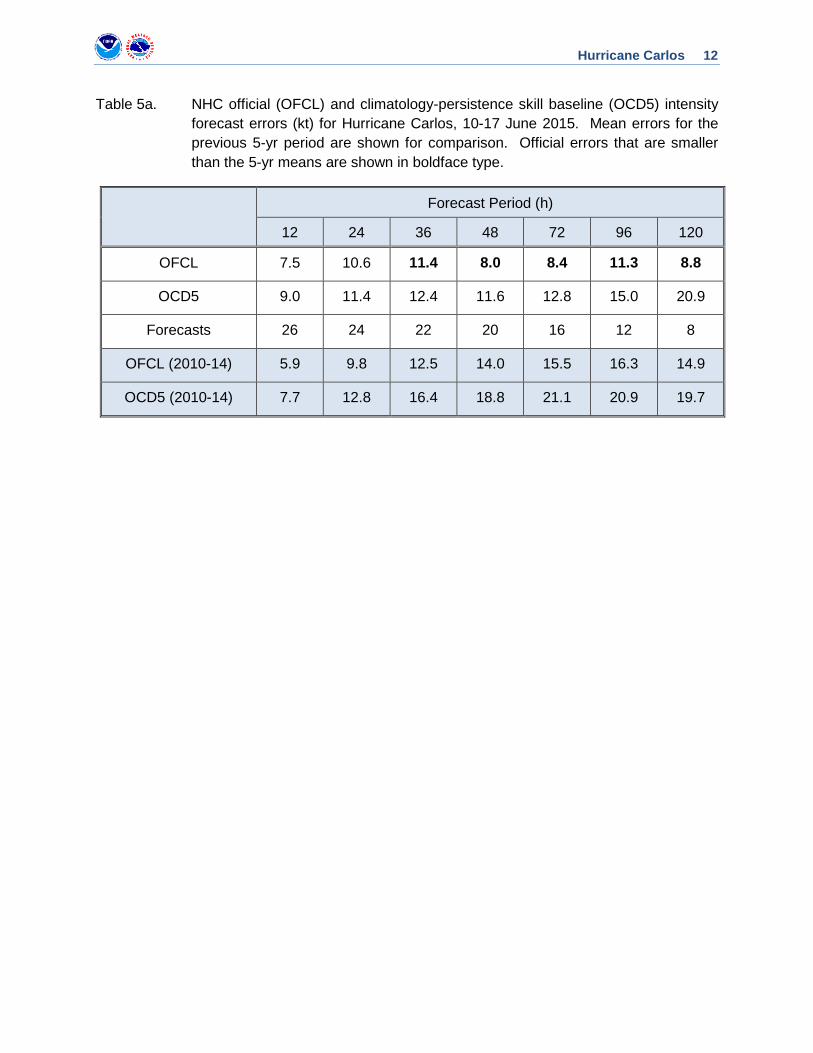
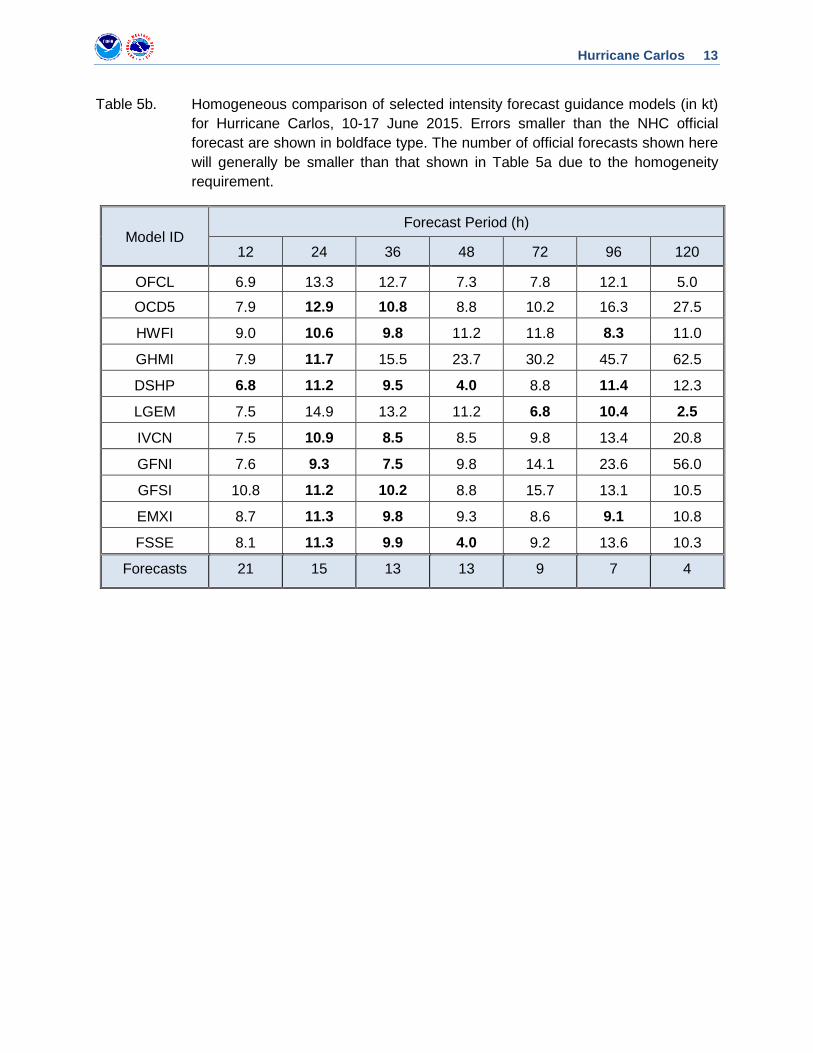
A verification of NHC official intensity forecasts for Carlos is given in Table 5a. Official forecast intensity errors were greater than the mean official errors for the previous 5-yr period at 12 and 24 h and less than the mean for 36-120 h. A homogeneous comparison of the official intensity errors with selected guidance models is given in Table 5b. Several models did as well as or better than OFCL at 12-36 h. From 48-120 h, the best performing models generally were the statistical Decay-Statistical Hurricane Intensity Prediction System (DSHP) and Logistic Growth Equation (LGEM) models. It is of note that the Geophysical Fluid Dynamics Laboratory (GHMI) intensity model had very large errors especially at long lead times, due to a substantial low bias (underforecast).
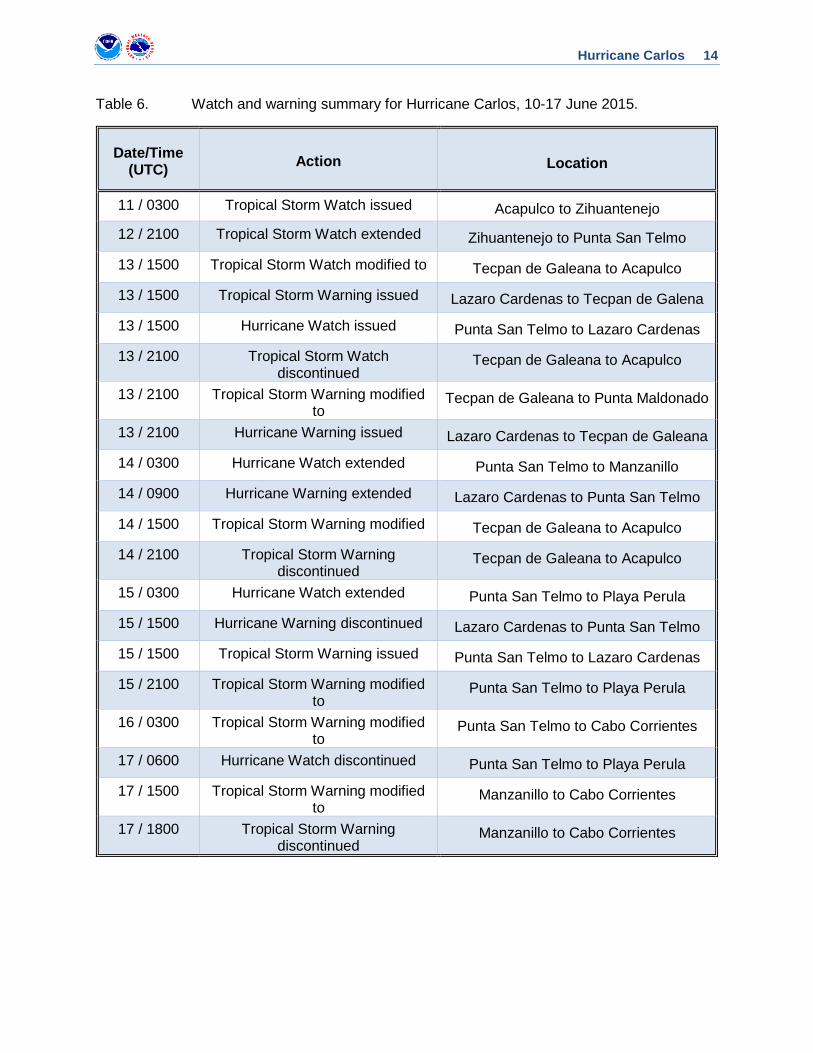
Watches and warnings associated with Carlos are given in Table 6.
Hurricane Carlos 6
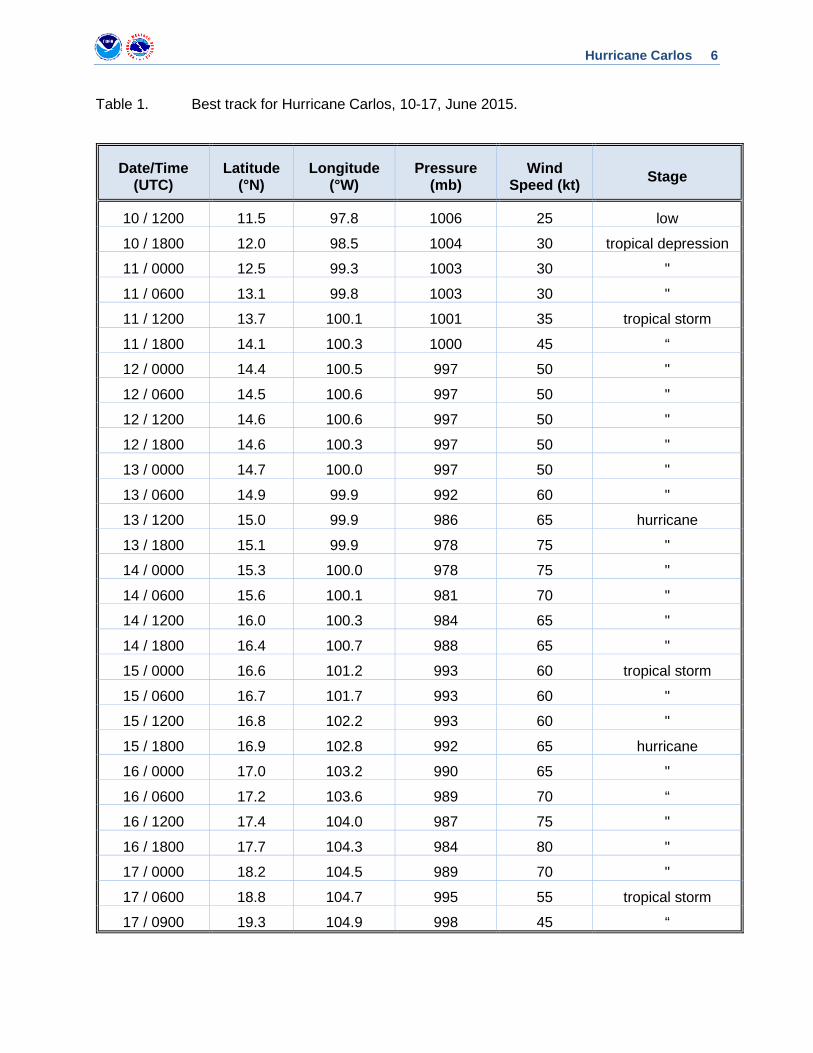
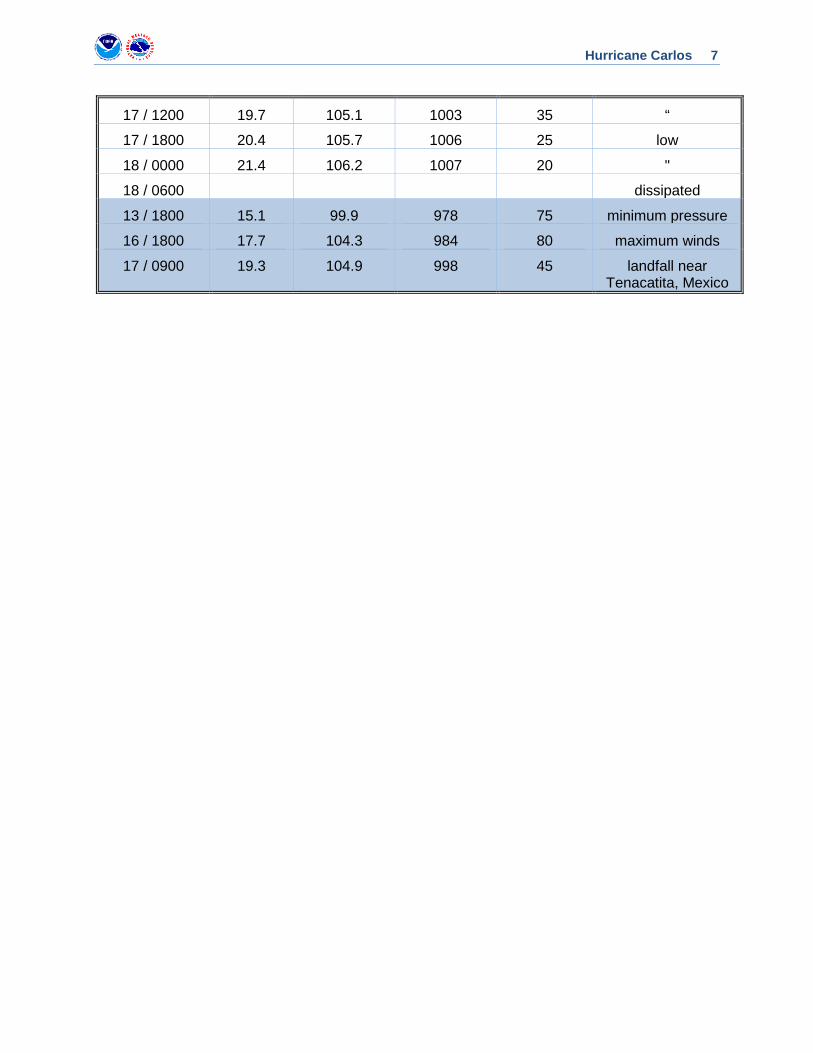
Table 1. Best track for Hurricane Carlos, 10-17, June 2015.
Date/Time (UTC)
Latitude (°N)
Longitude (°W)
Pressure (mb)
Wind Speed (kt) Stage
10 / 1200 11.5 97.8 1006 25 low
10 / 1800 12.0 98.5 1004 30 tropical depression
11 / 0000 12.5 99.3 1003 30 "
11 / 0600 13.1 99.8 1003 30 "
11 / 1200 13.7 100.1 1001 35 tropical storm
11 / 1800 14.1 100.3 1000 45 “
12 / 0000 14.4 100.5 997 50 "
12 / 0600 14.5 100.6 997 50 "
12 / 1200 14.6 100.6 997 50 "
12 / 1800 14.6 100.3 997 50 "
13 / 0000 14.7 100.0 997 50 "
13 / 0600 14.9 99.9 992 60 "
13 / 1200 15.0 99.9 986 65 hurricane
13 / 1800 15.1 99.9 978 75 "
14 / 0000 15.3 100.0 978 75 "
14 / 0600 15.6 100.1 981 70 "
14 / 1200 16.0 100.3 984 65 "
14 / 1800 16.4 100.7 988 65 "
15 / 0000 16.6 101.2 993 60 tropical storm
15 / 0600 16.7 101.7 993 60 "
15 / 1200 16.8 102.2 993 60 "
15 / 1800 16.9 102.8 992 65 hurricane
16 / 0000 17.0 103.2 990 65 "
16 / 0600 17.2 103.6 989 70 “
16 / 1200 17.4 104.0 987 75 "
16 / 1800 17.7 104.3 984 80 "
17 / 0000 18.2 104.5 989 70 "
17 / 0600 18.8 104.7 995 55 tropical storm
17 / 0900 19.3 104.9 998 45 “
Hurricane Carlos 7
17 / 1200 19.7 105.1 1003 35 “
17 / 1800 20.4 105.7 1006 25 low
18 / 0000 21.4 106.2 1007 20 "
18 / 0600 dissipated
13 / 1800 15.1 99.9 978 75 minimum pressure
16 / 1800 17.7 104.3 984 80 maximum winds
17 / 0900 19.3 104.9 998 45 landfall near Tenacatita, Mexico

Hurricane Carlos 8
Table 2. Selected accumulated rainfall data for the period 11-19 June 2015 for the areas of Mexico affected by Hurricane Carlos.
Location
Minimum Sea Level Pressure
Maximum Surface Wind Speed
Storm surge (ft)c
Storm tide (ft)d
Estimated Inundation
(ft)e
Total rain (in) Date/
time (UTC)
Press. (mb)
Date/ time
(UTC)a
Sustained (kt)b
Gust (kt)
State of Colima Callejones 7.25 Cerro de Ortega 4.67
State of Guerrero Acapulco 4.77 Petacalco 7.54 Zihuatanejo 4.81
State of Jalisco Cuale 9.94 San Marcos 4.49
State of Nayarit Chapalagana 5.16 El Campomo 6.38
State of Oaxaca Chicapa 10.83 Dique Pescaditos 7.10 Huatulco 4.54 Juchitan 8.96 Km. 51 + 740 8.03 Ostuta 6.31 Salina Cruz 7.39 Temazcal 4.89 Union Hildago 11.97
Hurricane Carlos 9
Table 3. Number of hours in advance of formation associated with the first NHC Tropical Weather Outlook forecast in the indicated likelihood category. Note that the timings for the “Low” category do not include forecasts of a 0% chance of genesis.
Hours Before Genesis
48-Hour Outlook 120-Hour Outlook
Low (<40%) 78 186
Medium (40%-60%) 48 84
High (>60%) 12 60

Hurricane Carlos 10
Table 4a. NHC official (OFCL) and climatology-persistence skill baseline (OCD5) track forecast errors (n mi) for Hurricane Carlos, 10-17 June 2015. Mean errors for the previous 5-yr period are shown for comparison. Official errors that are smaller than the 5-yr means are shown in boldface type.
Forecast Period (h)
12 24 36 48 72 96 120
OFCL 25 37 48 56 84 108 139
OCD5 34 68 107 140 197 277 426
Forecasts 26 24 22 20 16 12 8
OFCL (2010-14) 23 36 47 59 89 124 160
OCD5 (2010-14) 37 74 116 160 246 331 427
Hurricane Carlos 11
Table 4b. Homogeneous comparison of selected track forecast guidance models (in n mi) for Hurricane Carlos, 10-17 June 2015. Errors smaller than the NHC official forecast are shown in boldface type. The number of official forecasts shown here will generally be smaller than that shown in Table 4a due to the homogeneity requirement.
Model ID Forecast Period (h)
12 24 36 48 72 96 120
OFCL 24 42 56 68 97 133 145
OCD5 33 71 112 141 223 292 425
GFSI 29 46 55 66 100 130 156
GHMI 31 47 66 79 49 152 100
HWFI 22 32 46 58 90 101 112
EGRI 34 62 88 112 170 230 314
EMXI 27 46 57 67 110 132 131
NVGI 38 78 111 140 185 227 225
GFNI 31 46 55 68 72 79 154
TVCE 25 41 54 66 91 141 156
FSSE 21 37 46 55 90 129 140
AEMI 28 50 62 74 141 199 223
BAMS 56 107 149 183 210 258 281
BAMM 32 62 94 128 165 190 194
BAMD 36 73 113 154 228 285 288
Forecasts 16 13 13 13 9 7 4
Hurricane Carlos 12
Table 5a. NHC official (OFCL) and climatology-persistence skill baseline (OCD5) intensity forecast errors (kt) for Hurricane Carlos, 10-17 June 2015. Mean errors for the previous 5-yr period are shown for comparison. Official errors that are smaller than the 5-yr means are shown in boldface type.
Forecast Period (h)
12 24 36 48 72 96 120
OFCL 7.5 10.6 11.4 8.0 8.4 11.3 8.8
OCD5 9.0 11.4 12.4 11.6 12.8 15.0 20.9
Forecasts 26 24 22 20 16 12 8
OFCL (2010-14) 5.9 9.8 12.5 14.0 15.5 16.3 14.9
OCD5 (2010-14) 7.7 12.8 16.4 18.8 21.1 20.9 19.7
Hurricane Carlos 13
Table 5b. Homogeneous comparison of selected intensity forecast guidance models (in kt) for Hurricane Carlos, 10-17 June 2015. Errors smaller than the NHC official forecast are shown in boldface type. The number of official forecasts shown here will generally be smaller than that shown in Table 5a due to the homogeneity requirement.
Model ID Forecast Period (h)
12 24 36 48 72 96 120
OFCL 6.9 13.3 12.7 7.3 7.8 12.1 5.0
OCD5 7.9 12.9 10.8 8.8 10.2 16.3 27.5
HWFI 9.0 10.6 9.8 11.2 11.8 8.3 11.0
GHMI 7.9 11.7 15.5 23.7 30.2 45.7 62.5
DSHP 6.8 11.2 9.5 4.0 8.8 11.4 12.3
LGEM 7.5 14.9 13.2 11.2 6.8 10.4 2.5
IVCN 7.5 10.9 8.5 8.5 9.8 13.4 20.8
GFNI 7.6 9.3 7.5 9.8 14.1 23.6 56.0
GFSI 10.8 11.2 10.2 8.8 15.7 13.1 10.5
EMXI 8.7 11.3 9.8 9.3 8.6 9.1 10.8
FSSE 8.1 11.3 9.9 4.0 9.2 13.6 10.3
Forecasts 21 15 13 13 9 7 4
Hurricane Carlos 14
Table 6. Watch and warning summary for Hurricane Carlos, 10-17 June 2015.
Date/Time (UTC) Action Location
11 / 0300 Tropical Storm Watch issued Acapulco to Zihuantenejo
12 / 2100 Tropical Storm Watch extended Zihuantenejo to Punta San Telmo
13 / 1500 Tropical Storm Watch modified to Tecpan de Galeana to Acapulco
13 / 1500 Tropical Storm Warning issued Lazaro Cardenas to Tecpan de Galena
13 / 1500 Hurricane Watch issued Punta San Telmo to Lazaro Cardenas
13 / 2100 Tropical Storm Watch discontinued
Tecpan de Galeana to Acapulco
13 / 2100 Tropical Storm Warning modified to
Tecpan de Galeana to Punta Maldonado
13 / 2100 Hurricane Warning issued Lazaro Cardenas to Tecpan de Galeana
14 / 0300 Hurricane Watch extended Punta San Telmo to Manzanillo
14 / 0900 Hurricane Warning extended Lazaro Cardenas to Punta San Telmo
14 / 1500 Tropical Storm Warning modified Tecpan de Galeana to Acapulco
14 / 2100 Tropical Storm Warning discontinued
Tecpan de Galeana to Acapulco
15 / 0300 Hurricane Watch extended Punta San Telmo to Playa Perula
15 / 1500 Hurricane Warning discontinued Lazaro Cardenas to Punta San Telmo
15 / 1500 Tropical Storm Warning issued Punta San Telmo to Lazaro Cardenas
15 / 2100 Tropical Storm Warning modified to
Punta San Telmo to Playa Perula
16 / 0300 Tropical Storm Warning modified to
Punta San Telmo to Cabo Corrientes
17 / 0600 Hurricane Watch discontinued Punta San Telmo to Playa Perula
17 / 1500 Tropical Storm Warning modified to
Manzanillo to Cabo Corrientes
17 / 1800 Tropical Storm Warning discontinued
Manzanillo to Cabo Corrientes

Hurricane Carlos 15
Figure 1. Best track positions for Hurricane Carlos, 10-17 June 2015.

Hurricane Carlos 16
Figure 2. Selected wind observations and best track maximum sustained surface wind speed curve for Hurricane Carlos, 10-17 June 2015. Aircraft observations have been adjusted for elevation using 90%, 80%, and 80% adjustment factors for observations from 700 mb, 850 mb, and 1500 ft, respectively. Dropwindsonde observations include actual 10 m winds (sfc), as well as surface estimates derived from the mean wind over the lowest 150 m of the wind sounding (LLM). Advanced Dvorak Technique estimates represent the Current Intensity at the nominal observation time. AMSU intensity estimates are from the Cooperative Institute for Meteorological Satellite Studies technique. Dashed vertical lines correspond to 0000 UTC, and the solid vertical line corresponds to landfall.
Hurricane Carlos 17
Figure 3. Selected pressure observations and best track minimum central pressure curve for Hurricane Carlos, 10-17 June 2015. Advanced Dvorak Technique estimates represent the Current Intensity at the nominal observation time. AMSU intensity estimates are from the Cooperative Institute for Meteorological Satellite Studies technique. KZC P-W refers to pressure estimates derived using the Knaff-Zehr-Courtney pressure-wind relationship. Dashed vertical lines correspond to 0000 UTC, and the solid vertical line corresponds to landfall.
Hurricane Carlos 18
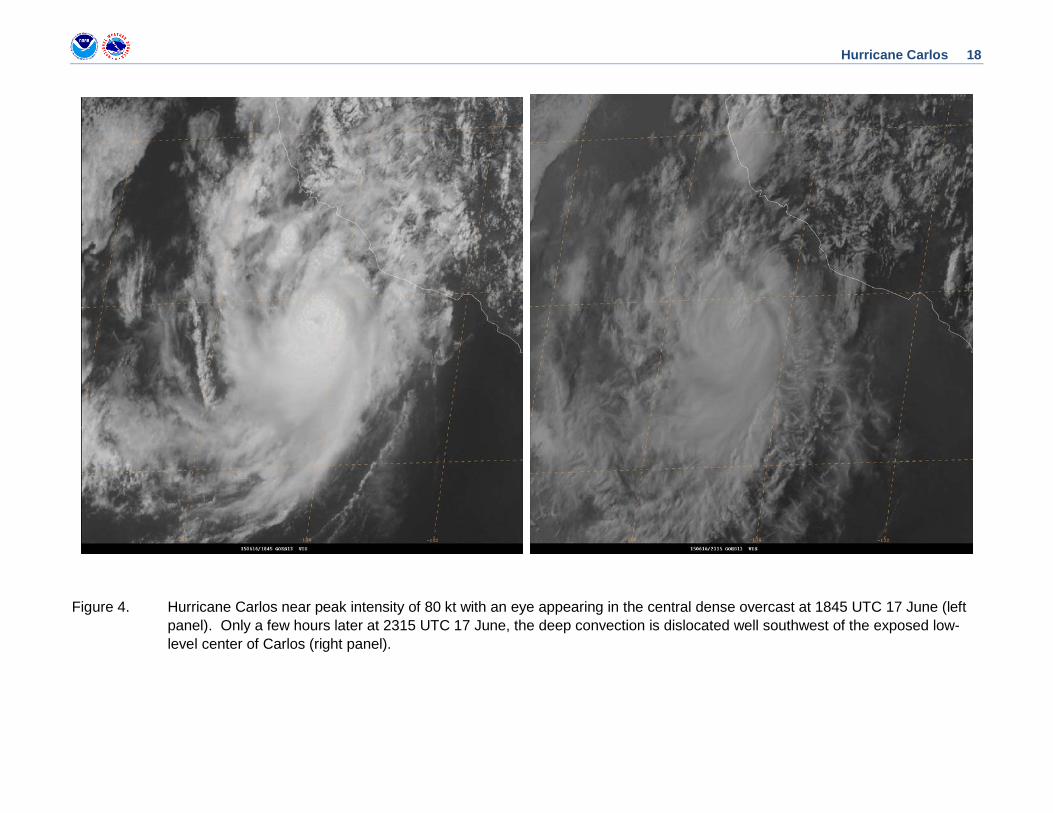
Figure 4. Hurricane Carlos near peak intensity of 80 kt with an eye appearing in the central dense overcast at 1845 UTC 17 June (left panel). Only a few hours later at 2315 UTC 17 June, the deep convection is dislocated well southwest of the exposed low-level center of Carlos (right panel).

Hurricane Carlos 19
Figure 5. Total rainfall (mm) from 11-19 June 2015 for the areas of Mexico affected by Hurricane Carlos. Image courtesy of CONAGUA.