human‐induced rainfall reduction in drought‐prone northern
TRANSCRIPT
1. IntroductionDrylands account for nearly 40% of the global land area and are host to more than one-third of the world's population, most of whom live in poverty (Safriel et al., 2005). Central Asia, one of the largest dryland regions in the Northern Hemisphere, is characterized by scarce precipitation and high evaporation (Saf-riel et al., 2005; Schiemann et al., 2008). The economies of northern Central Asian (NCA) rely heavily on agriculture and are particularly affected by changes in the local hydrological cycle (Schierhorn et al., 2020; Varis, 2014; Wang et al., 2020). This semiarid/arid region has experienced increasingly serious water short-ages and related conflicts in recent decades (Chen et al., 2019; Lioubimtseva & Henebry, 2009). A compre-hensive understanding of the water cycle changes in this drought-prone region is critical for the agriculture, ecosystems, and economies therein.
Summer represents the rainy season in NCA and is also the vegetation growing season (Gessner et al., 2013; Schiemann et al., 2008). Since the 1950s, rapid warming and drying trends have been observed over this region in summer (Chen et al., 2018; Jiang et al., 2020; Peng et al., 2019), coincident with observations of increased evaporation and decreased soil moisture (Li et al., 2017; Mueller & Zhang, 2016). These chang-es have accelerated the occurrence of disastrous droughts, degrading vegetation and leading to crop loss (Jiang et al., 2017; Li et al., 2017; Schierhorn et al., 2020). Whereas the global mean warming trend and
Abstract The reduction of summer rainfall since the 1950s has resulted in severe drought and the degradation of vegetation over northern Central Asia (NCA). However, whether the decline trend of summer rainfall is anthropogenic or natural remains unknown. Here, we show evidences that the drying trend is dominated by anthropogenic change of the subtropical westerly jet (SWJ; referring exclusively to the active center located over Central Asia). Using 10 global climate models participating in the Detection and Attribution Model Intercomparison Project (DAMIP) under different forcings, we find that the observed changes in the SWJ are attributable to the combined contributions of greenhouse gases and anthropogenic aerosols. Enhanced emissions of greenhouse gases favor an equatorial shift of the SWJ, while increased Asian pollution and reduced European aerosol emissions weaken the SWJ. Both of these factors strengthen the descending motion and decrease the precipitation over NCA.
Plain Language Summary The northern Central Asia (NCA) is facing a crisis of water resources shortage. And the reduction of summer rainfall since the 1950s has resulted in severe drought and the degradation of vegetation over there. Understanding why precipitation changes in this drought-prone region is of vital importance for the agriculture, ecosystems and economies therein. Based on 10 state-of-art climate coupled models forced by natural (including solar activity and volcanic aerosols) and/or external forcings (including greenhouse gases and anthropogenic aerosols), we show evidence that the drying trend is dominated by anthropogenic change of the atmospheric circulation evinced in the southward shift and weakening of the subtropical westerly jet (SWJ). Enhanced emissions of greenhouse gases favor an equatorial shift of the SWJ, while increased Asian pollution and reduced European aerosol emissions weaken the SWJ. Our results highlight the impacts of human activities on the fragile Central Asian ecosystem, not only directly, e.g., the construction of dams, diversion of waterways and wasting of water, but also indirectly by influencing the local hydrological cycle.
JIANG AND ZHOU
© 2021. The Authors.This is an open access article under the terms of the Creative Commons Attribution-NonCommercial License, which permits use, distribution and reproduction in any medium, provided the original work is properly cited and is not used for commercial purposes.
Human-Induced Rainfall Reduction in Drought-Prone Northern Central AsiaJie Jiang1,2 and Tianjun Zhou1,2,3
1State Key Laboratory of Numerical Modeling for Atmospheric Sciences and Geophysical Fluid Dynamics, Institute of Atmospheric Physics, Chinese Academy of Sciences, Beijing, China, 2College of Earth and Planetary Sciences, University of the Chinese Academy of Sciences, Beijing, China, 3CAS Center for Excellence in Tibetan Plateau Earth Sciences, Chinese Academy of Sciences, Beijing, China
Key Points:• Northern Central Asia is facing a
reduction of summer rainfall since the 1950s
• The drying trend is dominated by the southward shift and weakening of the subtropical westerly jet
• The observed changes in the westerly jet can be attributed to the combined contributions of greenhouse gases and anthropogenic aerosols
Supporting Information:Supporting Information may be found in the online version of this article.
Correspondence to:T. Zhou,[email protected]
Citation:Jiang, J., & Zhou, T. (2021). Human-induced rainfall reduction in drought-prone northern Central Asia. Geophysical Research Letters, 48, e2020GL092156. https://doi.org/10.1029/2020GL092156
Received 16 DEC 2020Accepted 8 MAR 2021
10.1029/2020GL092156RESEARCH LETTER
1 of 9
Geophysical Research Letters
the corresponding decrease in soil moisture have been attributed to anthropogenic activities (Mueller & Zhang, 2016; Peng et al., 2019), few effort has been devoted to the understanding of regional changes in precipitation over NCA.
The subtropical westerly jet (SWJ) is one of the important circulation systems in Eurasia, and one of its active centers is located over Central Asia in summer (Schiemann et al., 2008). Abundant water vapor from the North Atlantic and northern Europe is transported to NCA along westerlies (Jiang et al., 2020). Changes in the position and strength of the SWJ can affect Central Asian precipitation in summer (Wei et al., 2017; Zhao et al., 2018). A southward shift of the SWJ can result in wetter conditions south of 50 N, while a strengthened SWJ favors more precipitation over NCA (Zhao et al., 2018). On the global scale, an increase in greenhouse gases amplifies the warming in the tropical upper troposphere and further strengthens the midlatitude jets in both hemispheres (Rotstayn et al., 2013, 2014). The direct radiative effect of CO2 shifts the SWJ poleward by enhancing the land-sea thermal contrast, while the related sea surface warming pattern allows the SWJ to shift equatorward in boreal summer (Shaw & Voigt, 2015; Zhou et al., 2019). Furthermore, enhanced emissions of anthropogenic aerosols can facilitate the equa-torward shift of the Hadley cell and SWJ in the Northern Hemisphere (Grise & Davis, 2020; Rotstayn et al., 2014). However, how anthropogenic activities affect the regional characteristics of the SWJ, e.g., the active center over Central Asia, remains unclear, which further raises a new question of whether the summertime drying trend of northern Central Asian precipitation can be attributed to human-induced changes in the SWJ.
In this study, we investigate the impacts of anthropogenic activities on the changes in the SWJ (referring exclusively to the active center located over Central Asia in the subsequent analysis) and NCA precipitation using multimodel simulations from the Detection and Attribution Model Intercomparison Project (DAMIP) (Gillett et al., 2016). As a component of Phase 6 of the Coupled Model Intercomparison Project (CMIP6), DAMIP was designed to estimate the contributions of anthropogenic and natural forcings to observed global and regional climate changes (Gillett et al., 2016). Improved climate models, additional modeling groups, and updated climate forcings are expected to yield simulations with increased reliability (Eyring et al., 2016). In addition, the extension of DAMIP experiments relative to CMIP5 enhances our understand-ing of early twenty-first century climate changes and improves the signal-to-noise ratio for detection and attribution (Gillett et al., 2016). Here, we reveal the combined contributions of greenhouse gases and an-thropogenic aerosols to changes in the strength and location of the SWJ to explain the summertime drying trend observed across NCA since the 1950s. This information is crucial to the public and policymakers for climate change adaptation and mitigation activities.
2. Data and MethodsMultiple observational data sets are compared to minimize uncertainties in the observations. Three sets of monthly gauge-based precipitation data sets with a spatial resolution of 0.5 0.5 for the period of 1958–2014 are used: (1) the full data reanalysis product constructed by the Global Precipitation Climatol-ogy Center (GPCC V2018; Schneider et al., 2014), (2) the precipitation data set provided by the Climatic Research Unit (CRU V4.03; Harris et al., 2014), and (3) the precipitation data set compiled by the Universi-ty of Delaware (U. of Delaware V4.01; Willmott & Matsuura, 2000). We adopt the ensemble mean of these three data sets (herein, Obs-ens) to reduce the uncertainties. And the results of individual data sets are also shown. In addition, three other data sets are used for comparison: (1) the Asian Precipitation Highly Resolved Observational Data Integration Toward Evaluation of Water Resources (APHRODITE) precipi-tation product with a spatial resolution of 0.5 0.5 for the period of 1958–2007, which was constructed to satisfy the needs of reliable and high-resolution precipitation data sets in Asia (Yatagai et al., 2012); (2) Hadley Center Global Climate Extremes Index 3 (HadEX3), the gridded global land in situ-based data set of temperature and precipitation extremes developed through the coordination of the joint World Meteoro-logical Organization (WMO) CCI/WCRP/JCOMM Expert Team on Climate Change Detection and Indices (ETCCDI) comprising monthly precipitation data with a spatial resolution of 1.25 1.875 for the period of 1958–2014 (Dunn et al., 2020); and (3) station observations provided by the U.S. National Snow and Ice Data Center (NSIDC) for the period of 1958–2001. As we focus on long-term precipitation trends, only
JIANG AND ZHOU
10.1029/2020GL092156
2 of 9
Geophysical Research Letters
stations and grids with records covering at least 90% of the study period are selected.
Monthly reanalysis data taken from the 55 years modern Japanese Reanal-ysis (JRA-55; Harada et al., 2016) with a spatial resolution of 1.25 1.25 spanning 1958–2014 are used to reveal the physical processes related to the observed drying trend. JRA-55 can reasonably reproduce the hydro-logical characteristics over Central Asia and performs better than other long-term reanalysis data sets (Jiang et al., 2019).
For detection and attribution, a total of 208 simulations, including 52 historical, 52 hist-nat, 52 hist-GHG, and 52 hist-aer experiments, from 10 CMIP6 models are used in this study (Table S1). The historical simu-lations are forced by both natural (including solar activity and volcanic aerosols) and external forcings (including greenhouse gases and anthro-pogenic aerosols). The hist-nat, hist-GHG, and hist-aer simulations are the same as the historical simulations but forced by natural variability, well-mixed greenhouse gases, or anthropogenic aerosols only, respective-ly. All the model data are regridded onto a common 2 2 grid before calculating the ensemble mean.
To understand the physical processes related to the drying trend over NCA, we conduct a moisture budget analysis (Chou & Lan, 2012; Seager et al., 2010; see supplementary Text S1 for details). In addition, a quasige-ostrophic pressure vertical velocity equation is applied to reveal the main influencing factors of the change in the vertical velocity (see Supplemen-tary Text S2 for details).
The significance of the long-term trends is tested by the Mann-Ken-dall nonparametric method (Mondal et al., 2012). Student's t test is used to test the significance of correlation coefficients and regression coefficients.
3. Results3.1. Observed Drying Trend and Related Physical Processes
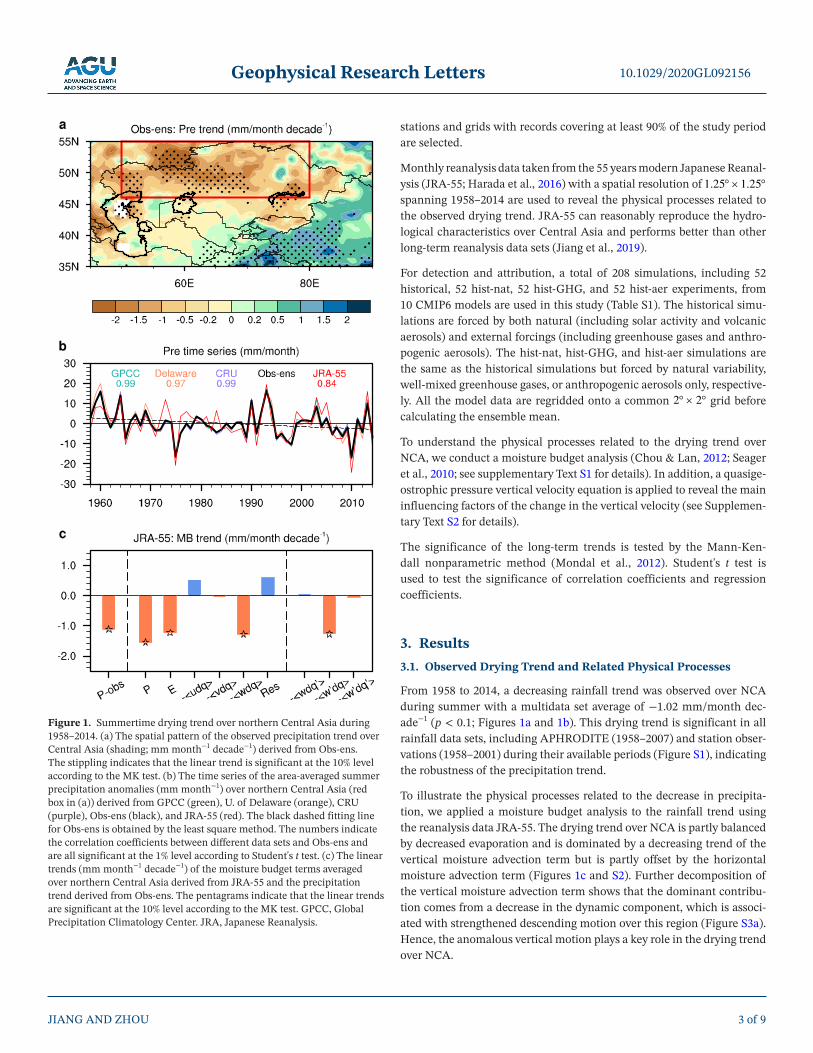
From 1958 to 2014, a decreasing rainfall trend was observed over NCA during summer with a multidata set average of −1.02 mm/month dec-ade−1 (p < 0.1; Figures 1a and 1b). This drying trend is significant in all rainfall data sets, including APHRODITE (1958–2007) and station obser-vations (1958–2001) during their available periods (Figure S1), indicating the robustness of the precipitation trend.
To illustrate the physical processes related to the decrease in precipita-tion, we applied a moisture budget analysis to the rainfall trend using the reanalysis data JRA-55. The drying trend over NCA is partly balanced by decreased evaporation and is dominated by a decreasing trend of the vertical moisture advection term but is partly offset by the horizontal moisture advection term (Figures 1c and S2). Further decomposition of the vertical moisture advection term shows that the dominant contribu-tion comes from a decrease in the dynamic component, which is associ-ated with strengthened descending motion over this region (Figure S3a). Hence, the anomalous vertical motion plays a key role in the drying trend over NCA.
JIANG AND ZHOU
10.1029/2020GL092156
3 of 9
Figure 1. Summertime drying trend over northern Central Asia during 1958–2014. (a) The spatial pattern of the observed precipitation trend over Central Asia (shading; mm month−1 decade−1) derived from Obs-ens. The stippling indicates that the linear trend is significant at the 10% level according to the MK test. (b) The time series of the area-averaged summer precipitation anomalies (mm month−1) over northern Central Asia (red box in (a)) derived from GPCC (green), U. of Delaware (orange), CRU (purple), Obs-ens (black), and JRA-55 (red). The black dashed fitting line for Obs-ens is obtained by the least square method. The numbers indicate the correlation coefficients between different data sets and Obs-ens and are all significant at the 1% level according to Student's t test. (c) The linear trends (mm month−1 decade−1) of the moisture budget terms averaged over northern Central Asia derived from JRA-55 and the precipitation trend derived from Obs-ens. The pentagrams indicate that the linear trends are significant at the 10% level according to the MK test. GPCC, Global Precipitation Climatology Center. JRA, Japanese Reanalysis.
Geophysical Research Letters
To reveal the main factors affecting the anomalous vertical motion over NCA, we diagnosed the quasigeo-strophic pressure vertical velocity equation. We found that the strengthened descending motion is mainly attributable to anomalous relative vorticity advection by the basic zonal flow (B2) and mean temperature advection by an anomalous meridional wind (C4) (Figure S3b). The climatological mean over NCA is dom-inated by westerlies, and during the study period, NCA was located on the eastern side of an anomalous anticyclonic circulation (Figure S3c). Anomalous negative vorticity advection by mean westerlies favors de-scending motion over NCA. In addition, northerlies along the eastern flank of this anomalous anticyclonic circulation can result in cold advection originating from high latitudes and an anomalous descending flow over NCA (Figure S3d). The strengthened descending motion is associated with changes in the horizontal circulation. In the subsequent analysis, we will discuss the relationship among changes in the SWJ, anom-alous vertical motion and the drying trend over NCA.
3.2. Relationship Between the SWJ and Central Asian Precipitation
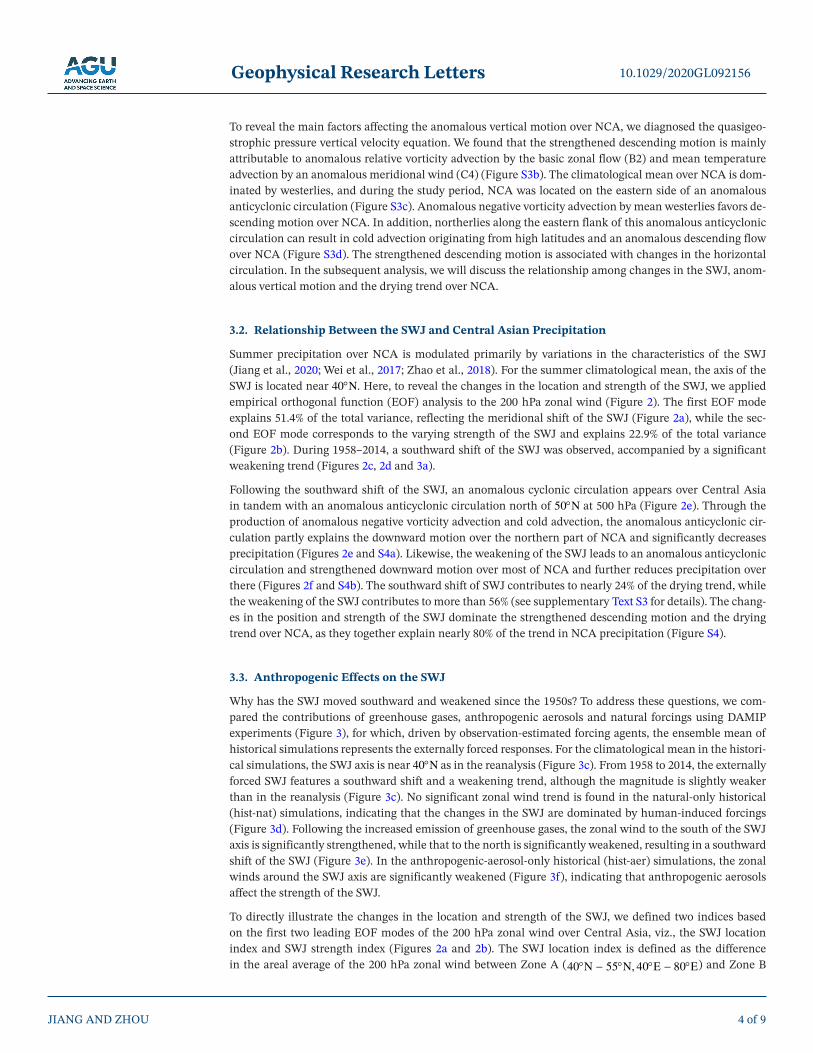
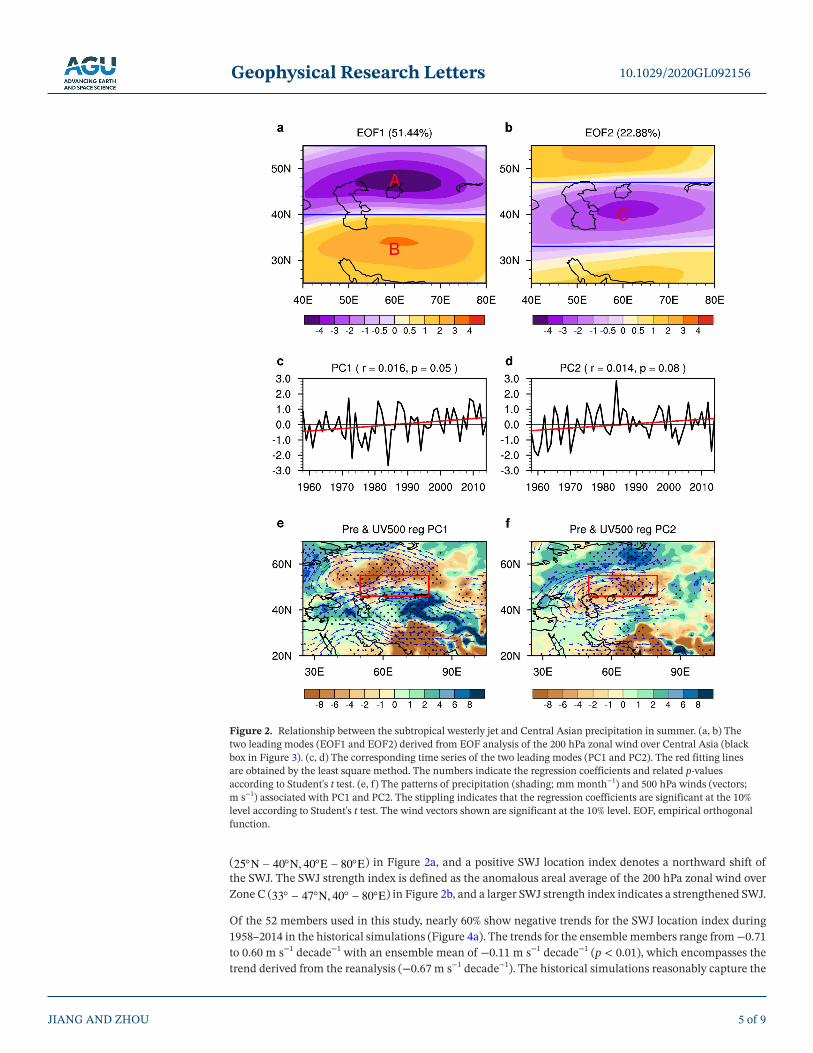
Summer precipitation over NCA is modulated primarily by variations in the characteristics of the SWJ (Jiang et al., 2020; Wei et al., 2017; Zhao et al., 2018). For the summer climatological mean, the axis of the SWJ is located near 40 N. Here, to reveal the changes in the location and strength of the SWJ, we applied empirical orthogonal function (EOF) analysis to the 200 hPa zonal wind (Figure 2). The first EOF mode explains 51.4% of the total variance, reflecting the meridional shift of the SWJ (Figure 2a), while the sec-ond EOF mode corresponds to the varying strength of the SWJ and explains 22.9% of the total variance (Figure 2b). During 1958–2014, a southward shift of the SWJ was observed, accompanied by a significant weakening trend (Figures 2c, 2d and 3a).
Following the southward shift of the SWJ, an anomalous cyclonic circulation appears over Central Asia in tandem with an anomalous anticyclonic circulation north of 50 N at 500 hPa (Figure 2e). Through the production of anomalous negative vorticity advection and cold advection, the anomalous anticyclonic cir-culation partly explains the downward motion over the northern part of NCA and significantly decreases precipitation (Figures 2e and S4a). Likewise, the weakening of the SWJ leads to an anomalous anticyclonic circulation and strengthened downward motion over most of NCA and further reduces precipitation over there (Figures 2f and S4b). The southward shift of SWJ contributes to nearly 24% of the drying trend, while the weakening of the SWJ contributes to more than 56% (see supplementary Text S3 for details). The chang-es in the position and strength of the SWJ dominate the strengthened descending motion and the drying trend over NCA, as they together explain nearly 80% of the trend in NCA precipitation (Figure S4).
3.3. Anthropogenic Effects on the SWJ
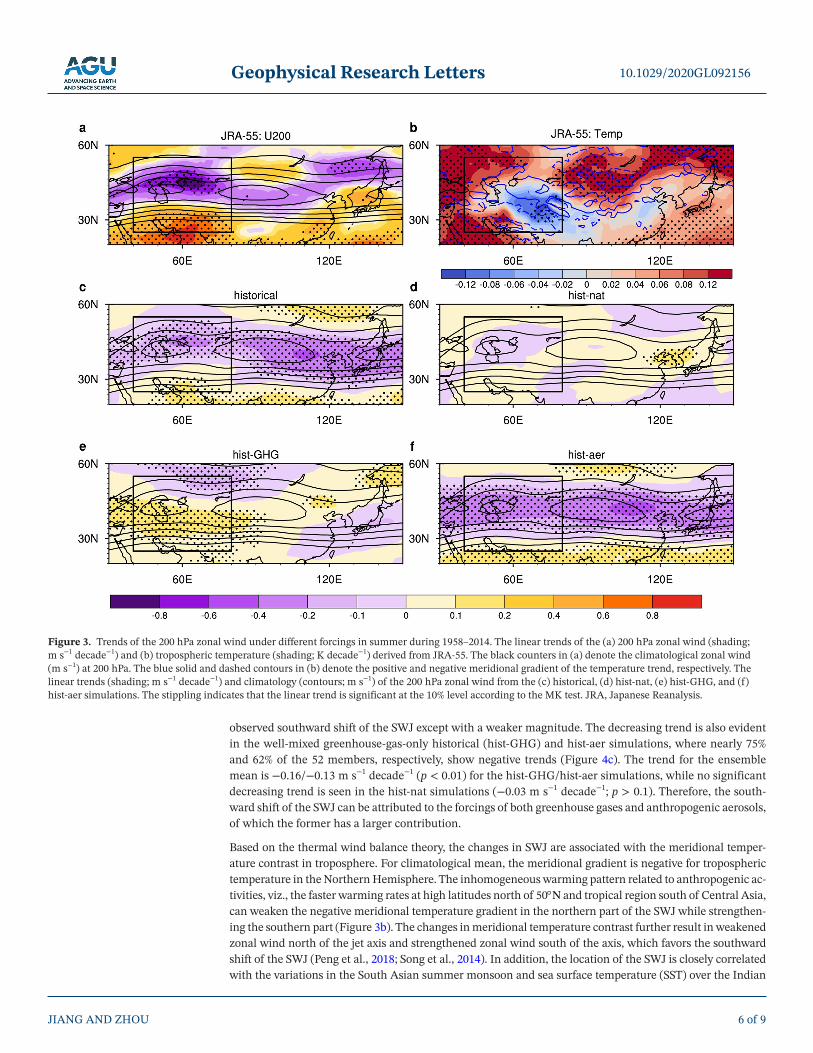
Why has the SWJ moved southward and weakened since the 1950s? To address these questions, we com-pared the contributions of greenhouse gases, anthropogenic aerosols and natural forcings using DAMIP experiments (Figure 3), for which, driven by observation-estimated forcing agents, the ensemble mean of historical simulations represents the externally forced responses. For the climatological mean in the histori-cal simulations, the SWJ axis is near 40 N as in the reanalysis (Figure 3c). From 1958 to 2014, the externally forced SWJ features a southward shift and a weakening trend, although the magnitude is slightly weaker than in the reanalysis (Figure 3c). No significant zonal wind trend is found in the natural-only historical (hist-nat) simulations, indicating that the changes in the SWJ are dominated by human-induced forcings (Figure 3d). Following the increased emission of greenhouse gases, the zonal wind to the south of the SWJ axis is significantly strengthened, while that to the north is significantly weakened, resulting in a southward shift of the SWJ (Figure 3e). In the anthropogenic-aerosol-only historical (hist-aer) simulations, the zonal winds around the SWJ axis are significantly weakened (Figure 3f), indicating that anthropogenic aerosols affect the strength of the SWJ.
To directly illustrate the changes in the location and strength of the SWJ, we defined two indices based on the first two leading EOF modes of the 200 hPa zonal wind over Central Asia, viz., the SWJ location index and SWJ strength index (Figures 2a and 2b). The SWJ location index is defined as the difference in the areal average of the 200 hPa zonal wind between Zone A ( 40 N 55 N, 40 E 80 E) and Zone B
JIANG AND ZHOU
10.1029/2020GL092156
4 of 9
Geophysical Research Letters
( 25 N 40 N, 40 E 80 E) in Figure 2a, and a positive SWJ location index denotes a northward shift of the SWJ. The SWJ strength index is defined as the anomalous areal average of the 200 hPa zonal wind over Zone C ( 33 47 N, 40 80 E) in Figure 2b, and a larger SWJ strength index indicates a strengthened SWJ.
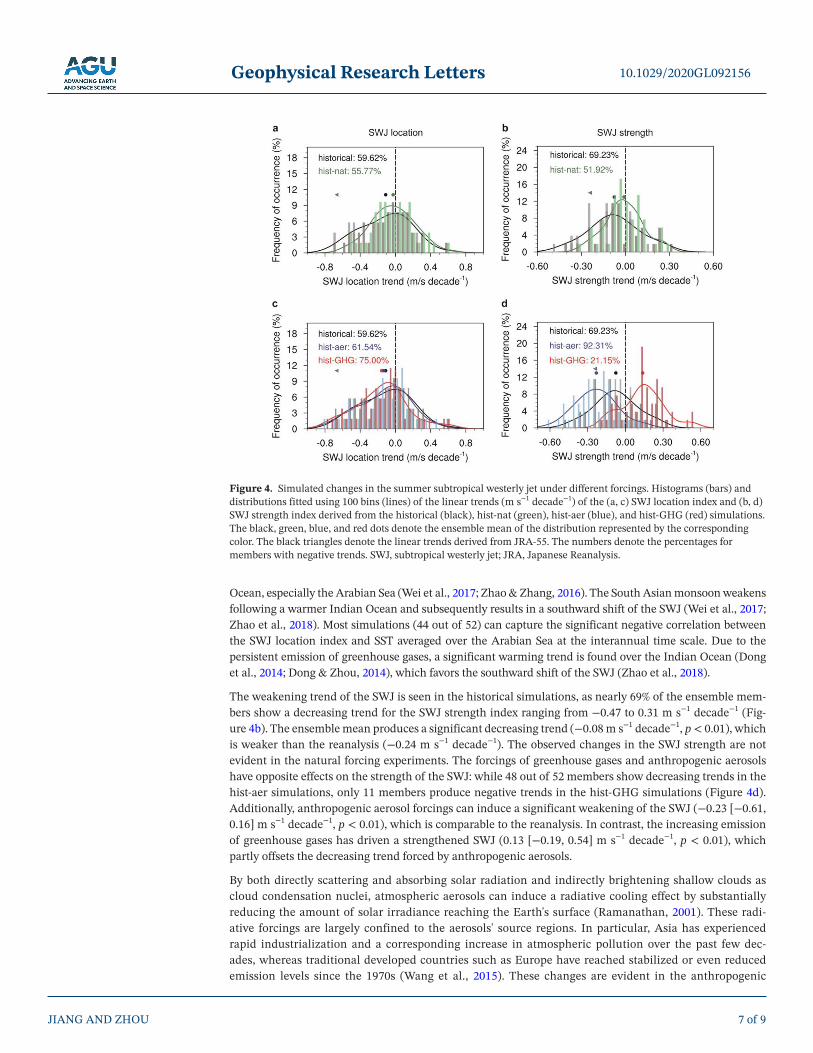
Of the 52 members used in this study, nearly 60% show negative trends for the SWJ location index during 1958–2014 in the historical simulations (Figure 4a). The trends for the ensemble members range from −0.71 to 0.60 m s−1 decade−1 with an ensemble mean of −0.11 m s−1 decade−1 (p < 0.01), which encompasses the trend derived from the reanalysis (−0.67 m s−1 decade−1). The historical simulations reasonably capture the
JIANG AND ZHOU
10.1029/2020GL092156
5 of 9
Figure 2. Relationship between the subtropical westerly jet and Central Asian precipitation in summer. (a, b) The two leading modes (EOF1 and EOF2) derived from EOF analysis of the 200 hPa zonal wind over Central Asia (black box in Figure 3). (c, d) The corresponding time series of the two leading modes (PC1 and PC2). The red fitting lines are obtained by the least square method. The numbers indicate the regression coefficients and related p-values according to Student's t test. (e, f) The patterns of precipitation (shading; mm month−1) and 500 hPa winds (vectors; m s−1) associated with PC1 and PC2. The stippling indicates that the regression coefficients are significant at the 10% level according to Student's t test. The wind vectors shown are significant at the 10% level. EOF, empirical orthogonal function.
Geophysical Research Letters
observed southward shift of the SWJ except with a weaker magnitude. The decreasing trend is also evident in the well-mixed greenhouse-gas-only historical (hist-GHG) and hist-aer simulations, where nearly 75% and 62% of the 52 members, respectively, show negative trends (Figure 4c). The trend for the ensemble mean is −0.16/−0.13 m s−1 decade−1 (p < 0.01) for the hist-GHG/hist-aer simulations, while no significant decreasing trend is seen in the hist-nat simulations (−0.03 m s−1 decade−1; p > 0.1). Therefore, the south-ward shift of the SWJ can be attributed to the forcings of both greenhouse gases and anthropogenic aerosols, of which the former has a larger contribution.
Based on the thermal wind balance theory, the changes in SWJ are associated with the meridional temper-ature contrast in troposphere. For climatological mean, the meridional gradient is negative for tropospheric temperature in the Northern Hemisphere. The inhomogeneous warming pattern related to anthropogenic ac-tivities, viz., the faster warming rates at high latitudes north of 50N and tropical region south of Central Asia, can weaken the negative meridional temperature gradient in the northern part of the SWJ while strengthen-ing the southern part (Figure 3b). The changes in meridional temperature contrast further result in weakened zonal wind north of the jet axis and strengthened zonal wind south of the axis, which favors the southward shift of the SWJ (Peng et al., 2018; Song et al., 2014). In addition, the location of the SWJ is closely correlated with the variations in the South Asian summer monsoon and sea surface temperature (SST) over the Indian
JIANG AND ZHOU
10.1029/2020GL092156
6 of 9
Figure 3. Trends of the 200 hPa zonal wind under different forcings in summer during 1958–2014. The linear trends of the (a) 200 hPa zonal wind (shading; m s−1 decade−1) and (b) tropospheric temperature (shading; K decade−1) derived from JRA-55. The black counters in (a) denote the climatological zonal wind (m s−1) at 200 hPa. The blue solid and dashed contours in (b) denote the positive and negative meridional gradient of the temperature trend, respectively. The linear trends (shading; m s−1 decade−1) and climatology (contours; m s−1) of the 200 hPa zonal wind from the (c) historical, (d) hist-nat, (e) hist-GHG, and (f) hist-aer simulations. The stippling indicates that the linear trend is significant at the 10% level according to the MK test. JRA, Japanese Reanalysis.
Geophysical Research Letters
Ocean, especially the Arabian Sea (Wei et al., 2017; Zhao & Zhang, 2016). The South Asian monsoon weakens following a warmer Indian Ocean and subsequently results in a southward shift of the SWJ (Wei et al., 2017; Zhao et al., 2018). Most simulations (44 out of 52) can capture the significant negative correlation between the SWJ location index and SST averaged over the Arabian Sea at the interannual time scale. Due to the persistent emission of greenhouse gases, a significant warming trend is found over the Indian Ocean (Dong et al., 2014; Dong & Zhou, 2014), which favors the southward shift of the SWJ (Zhao et al., 2018).
The weakening trend of the SWJ is seen in the historical simulations, as nearly 69% of the ensemble mem-bers show a decreasing trend for the SWJ strength index ranging from −0.47 to 0.31 m s−1 decade−1 (Fig-ure 4b). The ensemble mean produces a significant decreasing trend (−0.08 m s−1 decade−1, p < 0.01), which is weaker than the reanalysis (−0.24 m s−1 decade−1). The observed changes in the SWJ strength are not evident in the natural forcing experiments. The forcings of greenhouse gases and anthropogenic aerosols have opposite effects on the strength of the SWJ: while 48 out of 52 members show decreasing trends in the hist-aer simulations, only 11 members produce negative trends in the hist-GHG simulations (Figure 4d). Additionally, anthropogenic aerosol forcings can induce a significant weakening of the SWJ (−0.23 [−0.61, 0.16] m s−1 decade−1, p < 0.01), which is comparable to the reanalysis. In contrast, the increasing emission of greenhouse gases has driven a strengthened SWJ (0.13 [−0.19, 0.54] m s−1 decade−1, p < 0.01), which partly offsets the decreasing trend forced by anthropogenic aerosols.
By both directly scattering and absorbing solar radiation and indirectly brightening shallow clouds as cloud condensation nuclei, atmospheric aerosols can induce a radiative cooling effect by substantially reducing the amount of solar irradiance reaching the Earth's surface (Ramanathan, 2001). These radi-ative forcings are largely confined to the aerosols' source regions. In particular, Asia has experienced rapid industrialization and a corresponding increase in atmospheric pollution over the past few dec-ades, whereas traditional developed countries such as Europe have reached stabilized or even reduced emission levels since the 1970s (Wang et al., 2015). These changes are evident in the anthropogenic
JIANG AND ZHOU
10.1029/2020GL092156
7 of 9
Figure 4. Simulated changes in the summer subtropical westerly jet under different forcings. Histograms (bars) and distributions fitted using 100 bins (lines) of the linear trends (m s−1 decade−1) of the (a, c) SWJ location index and (b, d) SWJ strength index derived from the historical (black), hist-nat (green), hist-aer (blue), and hist-GHG (red) simulations. The black, green, blue, and red dots denote the ensemble mean of the distribution represented by the corresponding color. The black triangles denote the linear trends derived from JRA-55. The numbers denote the percentages for members with negative trends. SWJ, subtropical westerly jet; JRA, Japanese Reanalysis.
Geophysical Research Letters
aerosol burden (Figure S5a) and related radiative forcings (Figures S5b and S5c), which further lead to significant warming in Europe and cooling in East and South Asia (Figures S5d and S5e). The changes in tropospheric temperature over Eurasia induce weakened negative meridional temperature gradient along the jet axis (Figure S5f), thereby resulting in a weakening trend of the SWJ based on the thermal wind balance theory.
4. SummaryThe northern Central Asia is facing a challenge of water resources shortage. The construction of dams, diver-sion of waterways and wasting of water have been condemned (Micklin, 2007; Pala, 2005; Stone, 2008, 2012; Varis, 2014). For example, the rapid desiccation and salinization of the Aral Sea is associated with the di-version of water from the Syr Darya and Amu Darya (Pala, 2005; Stone, 2008). Here, we present evidence that water resources shortage is also related to a significant summertime drying trend spanning the past half-century over NCA. The decreasing rainfall trend is associated with the southward shift and weakening of the SWJ over Central Asia. Based on climate modeling experiments, we demonstrate that the enhanced emission of greenhouse gases can contribute to an equatorial shift of the SWJ, while increased Asian pol-lution and reduced European aerosol emissions can result in a weakened jet, both favor the descending motion and drying trend over NCA. Overall, our results have highlighted that human-induced emissions of greenhouse gases and aerosols in other regions of the world have significant impacts on NCA by modulat-ing the key atmospheric circulation and local hydrological cycle.
Conflict of InterestsThe authors declare no competing financial interests.
Data Availability StatementThe gridded observational precipitation data sets are available at https://climatedataguide.ucar.edu/cli-mate-data/precipitation-data-sets-overview-comparison-table. HadEX3 is available at https://www.me-toffice.gov.uk/hadobs/hadex3/. Station observations are provided by the NSIDC (https://nsidc.org/data/G02174). JRA-55 data are obtained from the Japanese Meteorological Agency and are available at https://jra.kishou.go.jp. CMIP6 simulations are openly available at https://esgf-node.llnl.gov/projects/cmip6/. All relevant code used in this work is available, upon request, from the corresponding author Tianjun Zhou.
ReferencesChen, X., Wang, S., Hu, Z., Zhou, Q., & Hu, Q. (2018). Spatiotemporal characteristics of seasonal precipitation and their relationships with
ENSO in Central Asia during 1901–2013. Journal of Geographical Sciences, 28(9), 1341–1368. https://doi.org/10.1007/s11442-018-1529-2Chen, Y., Li, Z., Fang, G., & Bian, W. (2019). Water and ecological security at the heart of China's silk road economic belt. In Challenges to-
ward ecological sustainability in China (pp. 281–306). Springer International Publishing. https://doi.org/10.1007/978-3-030-03484-9_12Chou, C., & Lan, C.-W. (2012). Changes in the annual range of precipitation under global warming. Journal of Climate, 25(1), 222–235.
https://doi.org/10.1175/JCLI-D-11-00097.1Dong, L., & Zhou, T. (2014). The indian ocean sea surface temperature warming simulated by CMIP5 models during the twentieth cen-
tury: Competing forcing roles of GHGs and anthropogenic aerosols. Journal of Climate, 27(9), 3348–3362. https://doi.org/10.1175/JCLI-D-13-00396.1
Dong, L., Zhou, T., & Wu, B. (2014). Indian Ocean warming during 1958-2004 simulated by a climate system model and its mechanism. Climate Dynamics, 42(1–2), 203–217. https://doi.org/10.1007/s00382-013-1722-z
Dunn, R. J. H., Alexander, L. V., Donat, M. G., Zhang, X., Bador, M., Herold, N., et al. (2020). Development of an updated global land in situ-based data set of temperature and precipitation extremes: HadEX3. Journal of Geophysical Research: Atmospheres, 125, e2019JD032263. https://doi.org/10.1029/2019JD032263
Eyring, V., Bony, S., Meehl, G. A., Senior, C. A., Stevens, B., Stouffer, R. J., & Taylor, K. E. (2016). Overview of the Coupled Model Inter-comparison Project Phase 6 (CMIP6) experimental design and organization. Geoscientific Model Development, 9(5), 1937–1958. https://doi.org/10.5194/gmd-9-1937-2016
Gessner, U., Naeimi, V., Klein, I., Kuenzer, C., Klein, D., & Dech, S. (2013). The relationship between precipitation anomalies and satel-lite-derived vegetation activity in Central Asia. Global and Planetary Change, 110, 74–87. https://doi.org/10.1016/j.gloplacha.2012.09.007
Gillett, N. P., Shiogama, H., Funke, B., Hegerl, G., Knutti, R., Matthes, K., et al. (2016). The detection and attribution model intercom-parison project (DAMIP v1.0) contribution to CMIP6. Geoscientific Model Development, 9(10), 3685–3697. https://doi.org/10.5194/gmd-9-3685-2016
Grise, K. M., & Davis, S. M. (2020). Hadley cell expansion in CMIP6 models. Atmospheric Chemistry and Physics, 20(9), 5249–5268. https://doi.org/10.5194/acp-20-5249-2020
JIANG AND ZHOU
10.1029/2020GL092156
8 of 9
AcknowledgmentsThis work is supported by Chinese Academy of Sciences under Grant No. XDA20060102 and National Natural Science Foundation of China under Grant No. 41988101.
Geophysical Research Letters
Harada, Y., Kamahori, H., Kobayashi, C., Endo, H., Kobayashi, S., Ota, Y., et al. (2016). The JRA-55 Reanalysis: Representation of at-mospheric circulation and climate variability. Journal of the Meteorological Society of Japan, 94(3), 269–302. https://doi.org/10.2151/jmsj.2016-015
Harris, I., Jones, P. D., Osborn, T. J., & Lister, D. H. (2014). Updated high-resolution grids of monthly climatic observations—The CRU TS3.10 Dataset. International Journal of Climatology, 34(3), 623–642. https://doi.org/10.5676/DWD_GPCC/FD_M_V7_100
Jiang, J., Zhou, T., Wang, H., Qian, Y., Noone, D., & Man, W. (2020). Tracking moisture sources of precipitation over Central Asia: A study based on the water-source-tagging method. Journal of Climate, 33(23), 10339–10355. https://doi.org/10.1175/JCLI-D-20-0169.1
Jiang, J., Zhou, T., & Zhang, W. (2019). Evaluation of satellite and reanalysis precipitable water vapor data sets against radiosonde observa-tions in Central Asia. Earth and Space Science, 6(7), 1129–1148. https://doi.org/10.1029/2019EA000654
Jiang, L., Guli Jiapaer, G., Bao, A., Guo, H., & Ndayisaba, F. (2017). Vegetation dynamics and responses to climate change and human activities in Central Asia. The Science of the Total Environment, 599–600, 967–980. https://doi.org/10.1016/j.scitotenv.2017.05.012
Li, Z., Chen, Y., Fang, G., & Li, Y. (2017). Multivariate assessment and attribution of droughts in Central Asia. Scientific Reports, 7(1), 1–12. https://doi.org/10.1038/s41598-017-01473-1
Lioubimtseva, E., & Henebry, G. M. (2009). Climate and environmental change in arid Central Asia: Impacts, vulnerability, and adapta-tions. Journal of Arid Environments, 73(11), 963–977. https://doi.org/10.1016/j.jaridenv.2009.04.022
Micklin, P. (2007). The Aral Sea Disaster. Annual Review of Earth and Planetary Sciences, 35(1), 47–72. https://doi.org/10.1146/annurev.earth.35.031306.140120
Mondal, A., Kundu, S., & Mukhopadhyay, A. (2012). Rainfall trend analysis by Mann-Kendall test: A case study of north-eastern part of Cuttack district, Orissa. International Journal of Geology, Earth and Environmental Sciences, 2(1), 70–78.
Mueller, B., & Zhang, X. (2016). Causes of drying trends in northern hemispheric land areas in reconstructed soil moisture data. Climatic Change, 134(1–2), 255–267. https://doi.org/10.1007/s10584-015-1499-7
Pala, C. (2005). Environmental restoration: To save a vanishing sea. Science, 307(5712), 1032–1034. https://doi.org/10.1126/science.307.5712.1032
Peng, D., Zhou, T., Zhang, L., & Wu, B. (2018). Human contribution to the increasing summer precipitation in Central Asia from 1961 to 2013. Journal of Climate, 31(19), 8005–8021. https://doi.org/10.1175/JCLI-D-17-0843.1
Peng, D., Zhou, T., Zhang, L., & Zou, L. (2019). Detecting human influence on the temperature changes in Central Asia. Climate Dynamis, 53(7–8), 4553–4568. https://doi.org/10.1007/s00382-019-04804-2
Ramanathan, V. (2001). Aerosols, climate, and the hydrological cycle. Science, 294(5549), 2119–2124. https://doi.org/10.1126/science.1064034
Rotstayn, L. D., Collier, M. A., Jeffrey, S. J., Kidston, J., Syktus, J. I., & Wong, K. K. (2013). Anthropogenic effects on the subtropical jet in the Southern Hemisphere: Aerosols versus long-lived greenhouse gases. Environmental Research Letters, 8(1), 014030. https://doi.org/10.1088/1748-9326/8/1/014030
Rotstayn, L. D., Plymin, E. L., Collier, M. A., Boucher, O., Dufresne, J.-L., Luo, J.-J., et al. (2014). Declining aerosols in CMIP5 projections: Effects on atmospheric temperature structure and midlatitude jets. Journal of Climate, 27(18), 6960–6977. https://doi.org/10.1175/JCLI-D-14-00258.1
Safriel, U., Adeel, Z., Niemeijer, D., Puigdefabregas, J., White, R., Lal, R., et al. (2005). Dryland systems. In R. Hassan, R. Scholes, & N. Ash (Eds.), Ecosystems and human well-being: Current state and trends (pp. 623–662). Washington, DC: Island Press.
Schiemann, R., Lüthi, D., Vidale, P. L., & Schär, C. (2008). The precipitation climate of Central Asia-intercomparison of observational and numerical data sources in a remote semiarid region. International Journal of Climatology, 28(3), 295–314. https://doi.org/10.1002/joc.1532
Schierhorn, F., Hofmann, M., Adrian, I., Bobojonov, I., & Müller, D. (2020). Spatially varying impacts of climate change on wheat and barley yields in Kazakhstan. Journal of Arid Environments, 178, 104164. https://doi.org/10.1016/j.jaridenv.2020.104164
Schneider, U., Becker, A., Finger, P., Meyer-Christoffer, A., Ziese, M., & Rudolf, B. (2014). GPCC's new land surface precipitation clima-tology based on quality-controlled in situ data and its role in quantifying the global water cycle. Theoretical and Applied Climatology, 115(1–2), 15–40. https://doi.org/10.1007/s00704-013-0860-x
Seager, R., Naik, N., & Vecchi, G. A. (2010). Thermodynamic and dynamic mechanisms for large-scale changes in the hydrological cycle in response to global warming. Journal of Climate, 23(17), 4651–4668. https://doi.org/10.1175/2010JCLI3655.1
Shaw, T. A., & Voigt, A. (2015). Tug of war on summertime circulation between radiative forcing and sea surface warming. Nature Geosci-ence, 8(7), 560–566. https://doi.org/10.1038/ngeo2449
Song, F., Zhou, T., & Qian, Y. (2014). Responses of East Asian summer monsoon to natural and anthropogenic forcings in the 17 latest CMIP5 models. Geophysical Research Letters, 41, 596–603. https://doi.org/10.1002/2013GL058705
Stone, R. (2008). Engineering: A new great lake—Or dead sea?. Science, 320(5879), 1002–1005. https://doi.org/10.1126/science.320.5879.1002Stone, R. (2012). For China and Kazakhstan, no meeting of the minds on water. Science, 337(6093), 405–407. https://doi.org/10.1126/
science.337.6093.405Varis, O. (2014). Resources: Curb vast water use in central Asia. Nature, 514(7520), 27–29. https://doi.org/10.1038/514027aWang, X., Chen, Y., Li, Z., Fang, G., & Wang, Y. (2020). Development and utilization of water resources and assessment of water security in
Central Asia. Agricultural Water Management, 240, 106297. https://doi.org/10.1016/j.agwat.2020.106297Wang, Y., Jiang, J. H., & Su, H. (2015). Atmospheric responses to the redistribution of anthropogenic aerosols. Journal of Geophysical
Research: Atmospheres, 120(18), 9625–9641. https://doi.org/10.1002/2015JD023665Wei, W., Zhang, R., Wen, M., & Yang, S. (2017). Relationship between the Asian westerly jet stream and summer rainfall over central Asia
and North China: Roles of the Indian Monsoon and the South Asian high. Journal of Climate, 30(2), 537–552. https://doi.org/10.1175/JCLI-D-15-0814.1
Willmott, C., & Matsuura, K. (2000). Terrestrial air temperature and precipitation: Monthly and annual climatologies. Retrieved from http://climate.geog.udel.edu/∼climate/html_pages/Global2_Clim/README.global2_clim.html
Yatagai, A., Kamiguchi, K., Arakawa, O., Hamada, A., Yasutomi, N., & Kitoh, A. (2012). Aphrodite: Constructing a long-term daily gridded precipitation dataset for asia based on a dense network of rain gauges. Bulletin of the American Meteorological Society, 93(9), 1401–1415. https://doi.org/10.1175/BAMS-D-11-00122.1
Zhao, Y., Yu, X., Yao, J., & Dong, X. (2018). Evaluation of the subtropical westerly jet and its effects on the projected summer rainfall over central Asia using multi-CMIP5 models. International Journal of Climatology, 38, e1176–e1189. https://doi.org/10.1002/joc.5443
Zhao, Y., & Zhang, H. (2016). Impacts of SST Warming in tropical Indian Ocean on CMIP5 model-projected summer rainfall changes over Central Asia. Climate Dynamics, 46(9–10), 3223–3238. https://doi.org/10.1007/s00382-015-2765-0
Zhou, W., Xie, S.-P., & Yang, D. (2019). Enhanced equatorial warming causes deep-tropical contraction and subtropical monsoon shift. Nature Climate Change, 9(11), 834–839. https://doi.org/10.1038/s41558-019-0603-9
JIANG AND ZHOU
10.1029/2020GL092156
9 of 9