human evolutionary biology - facultad de …€¦ · · 2012-05-03robert j. meier and jennifer a....
TRANSCRIPT
HUMAN EVOLUTIONARYBIOLOGY
Edited by
MICHAEL P. MUEHLENBEINIndiana University, Bloomington

CAMBRIDGE UNIVERSITY PRESS
Cambridge, New York, Melbourne, Madrid, Cape Town, Singapore,
Sao Paulo, Delhi, Dubai, Tokyo
Cambridge University Press
The Edinburgh Building, Cambridge CB2 8RU, UK
Published in the United States of America by Cambridge University Press, New York
www.cambridge.org
Information on this title: www.cambridge.org/9780521879484
# Cambridge University Press 2010
This publication is in copyright. Subject to statutory exception
and to the provisions of relevant collective licensing agreements,
no reproduction of any part may take place without
the written permission of Cambridge University Press.
First published 2010
Printed in the United Kingdom at the University Press, Cambridge
A catalogue record for this publication is available from the British Library
Library of Congress Cataloguing in Publication data
ISBN 978-0-521-87948-4 Hardback
ISBN 978-0-521-70510-3 Paperback
Cambridge University Press has no responsibility for the persistence
or accuracy of URLs for external or third-party internet websites
referred to in this publication, and does not guarantee that any
content on such websites is, or will remain, accurate or appropriate.
Contents
List of contributors page vii
Preface xi
Part I Theory and Methods 1
1 Evolutionary Theory 3
Douglas J. Futuyma
2 The Study of Human Adaptation 17
A. Roberto Frisancho
3 History of the Study of Human Biology 29
Michael A. Little
4 Genetics in Human Biology 48
Robert J. Meier and Jennifer A. Raff
5 Demography 74
James Holland Jones
6 History, Methods, and General
Applications of Anthropometry
in Human Biology 92
Noel Cameron and Laura L. Jones
7 Energy Expenditure and Body
Composition: History, Methods,
and Inter-relationships 113
Peter S. W. Davies and Alexia J. Murphy
8 Evolutionary Endocrinology 127
Richard G. Bribiescas and
Michael P. Muehlenbein
9 Ethical Considerations for Human
Biology Research 144
Trudy R. Turner
With commentary by Michael P. Muehlenbein
Commentary: a Primer on Human Subjects
Applications and Informed Consents 150
Michael P. Muehlenbein
Part II Phenotypic and Genotypic Variation 155
10 Body Size and Shape: Climatic and Nutritional
Influences on Human Body Morphology 157
William R. Leonard and Peter T. Katzmarzyk
11 Human Adaptation to High Altitude 170
Tom D. Brutsaert
12 Skin Coloration 192
Nina G. Jablonski
13 Classic Markers of Human Variation 214
Robert J. Meier
14 DNA Markers of Human Variation 238
Michael E. Steiper
15 Ten Facts about Human Variation 265
Jonathan Marks
16 The Evolution and Endocrinology
of Human Behavior: a Focus on
Sex Differences and Reproduction 277
Peter B. Gray
Part III Reproduction 293
17 Human Mate Choice 295
David P. Schmitt
18 Mate Choice, the Major
Histocompatibility Complex,
and Offspring Viability 309
Claus Wedekind and Guillaume Evanno
19 Why Women Differ in Ovarian Function:
Genetic Polymorphism, Developmental
Conditions, and Adult Lifestyle 322
Grazyna Jasienska
20 Pregnancy and Lactation 338
Ivy L. Pike and Lauren A. Milligan
21 Male Reproduction: Physiology,
Behavior, and Ecology 351
Michael P. Muehlenbein and
Richard G. Bribiescas
Part IV Growth and Development 377
22 Evolution of Human Growth 379
Barry Bogin
v
23 Variation in Human Growth Patterns due to
Environmental Factors 396
Stanley J. Ulijaszek
24 Evolutionary Biology of Hormonal Responses
to Social Challenges in the Human Child 405
Mark V. Flinn
25 Human Biology, Energetics,
and the Human Brain 425
Benjamin C. Campbell
26 Embodied Capital and Extra-somatic Wealth
in Human Evolution and Human History 439
Jane B. Lancaster and Hillard S. Kaplan
Part V Health and Disease 457
27 Evolutionary Medicine, Immunity,
and Infectious Disease 459
Michael P. Muehlenbein
28 Complex Chronic Diseases
in Evolutionary Perspective 491
S. Boyd Eaton
29 Evolutionary Medicine and the Causes
of Chronic Disease 502
Paul W. Ewald
30 Beyond Feast–Famine: Brain Evolution,
Human Life History, and the Metabolic
Syndrome 518
Christopher W. Kuzawa
31 Human Longevity and Senescence 528
Douglas E. Crews and James A. Stewart
32 Evolutionary Psychiatry: Mental
Disorders and Behavioral Evolution 551
Brant Wenegrat
33 Industrial Pollutants and
Human Evolution 566
Lawrence M. Schell
34 Acculturation and Health 581
Thomas W. McDade and Colleen H. Nyberg
Index 603
vi Contents
13 Classic Markers of Human VariationRobert J. Meier
INTRODUCTION
The door to the study of genetically based variation in
humans cracked open at the beginning of the twentieth
century with the discovery by Landsteiner (1901) of
ABO blood group substances whose Mendelian mode
of inheritance was later established by Bernstein
(1924). Needless to say, an early trickling of discoveries
has led to a flood over the past century of new and
important revelations concerning the nature and sig-
nificance of human genetic variation. This chapter will
cover approximately three-fourths of that history as it
unfolded via the discovery and elucidation of a host of
markers. A helpful review of genetic markers known as
of the early 1970s and their role in the study of human
evolution can be found in Crawford (1973). Another
recent review of classic markers and their contribution
toward understanding North American Native genetic
variation appeared in O’Rourke (2006). Two current
textbooks that provide substantial coverage of trad-
itional markers, along with DNA markers and other
topics relevant to human biological variation, are
Mielke, et al. (2006) and Molnar (2006).
Over the years markers have come to mean fairly
consistently defined hereditary units. An early refer-
ence to the use of the term is found in Race and Sanger
(1962) who discuss markers, in their case human blood
groups, as characters that help to locate genes on
chromosomes. This was, of course, early in any
attempts to construct physical gene maps. Sometime
later, genetic markers were associated with specific
polymorphic loci that defined particular segments of
chromosomes (Cavalli-Sforza et al., 1994). In essence,
genetic markers today signify genes or other identifi-
able segments of DNA whose inheritance can be con-
sistently documented and mapped.
For purposes of this chapter, classical markers will
refer to those historically researched phenotypically
observable variants that for the most part preceded
DNAmethodologies that presently deal with nucleotide
sequences in various representations, such as mito-
chondrial DNA (mtDNA), variable number tandem
repeats (VNTRs), single nucleotide polymorphisms
(SNPs), and microsatellite polymorphisms. In short,
these are DNA markers. Hence, the time frame for
reviewing markers will encompass anthropological
field and laboratory studies carried out beginning at
turn of the twentieth century roughly through
the1980s. This end point is just prior to the widespread
use of polymerase chain reaction (PCR) and the
developing application of DNA markers to population
studies. As a timetable guide, Roychoudhury and Nei
(1988) were referred to for selecting markers from
those that had been identified by the date of that pub-
lication. The major categories of human markers will
include: blood group polymorphisms, serum protein
and enzyme variants, and an open-ended set of
markers that are of microevolutionary and anthropo-
logical interest. Polymorphism is used here to signify
two or more alleles at a given locus each exceeding 1%
frequency.
Tables follow that list these traditional markers.
It should be noted that marker identification
pertains to an earlier time period and may not conform
to presently known markers and their allele or haplo-
type (a combination of alleles at multiple linked
loci) labels. However, chromosome locations for the
markers are current and were extracted from the
National Center for Biotechnology Information (NCBI)
website.
Some sampling of the total number of classical
markers was done so as to not overwhelm the chapter.
The selection process was based on how much infor-
mation was available for the marker, how widely it was
studied across human populations, and how informa-
tive the marker was in bringing out important
points pertaining to human variation. Several classic
works are available for anyone interested in a more
complete and in depth compilation of markers. These
include; Race and Sanger (1962), Buettner-Janusch
(1966), Giblett (1969), Mourant et al., (1976), Harris
(1980), Mourant (1983). Tills et al., (1983), Livingstone
(1985), Roychoudhury and Nei (1988), and Cavalli-
Sforza et al. (1994).
Human Evolutionary Biology, ed. Michael P. Muehlenbein. Published by Cambridge University Press.# Cambridge University Press 2010.
214
The organization for describing classical markers
centers on five main topics: basics of marker identifi-
cation and their expressed phenotypic physiological
function, historical application of markers in classify-
ing human populations and races, application of
markers to population studies and microevolutionary
processes, markers and their relationships with dis-
eases, and contemporary use and future prospects for
classic markers.
IDENTIFYING RED BLOOD CELL MARKERS
An early method for detecting variants of hereditary
expression, beyond that of parental selection and
crossing as devised by Mendel, were serological reac-
tions. Discovery of blood group markers arose through
unintended consequences of transfusions, involving
donor–recipient mismatches that led to adverse clin-
ical outcomes for patients. Working off these unfortu-
nate medical mishaps, Landsteiner’s discovery in 1900
of the ABO system was based on laboratory tests of a
person’s blood cells against serum from a different
person. Particular combinations of cells and sera pro-
duced visible agglutination reactions between red
blood cell surface antigens and corresponding bivalent
antibodies found in the serum. Following extensive
cross matches of this sort, Landsteiner was able to
identify persons who had either A or B antigens,
both A and B, or neither. The success of his work partly
depended on the fact that the ABO system has natur-
ally occurring antibodies that form shortly after birth.
This then, was the launch into a succession of subse-
quent discoveries of both improved medical proced-
ures requiring blood transfusion, and in identifying
additional blood group marker systems.
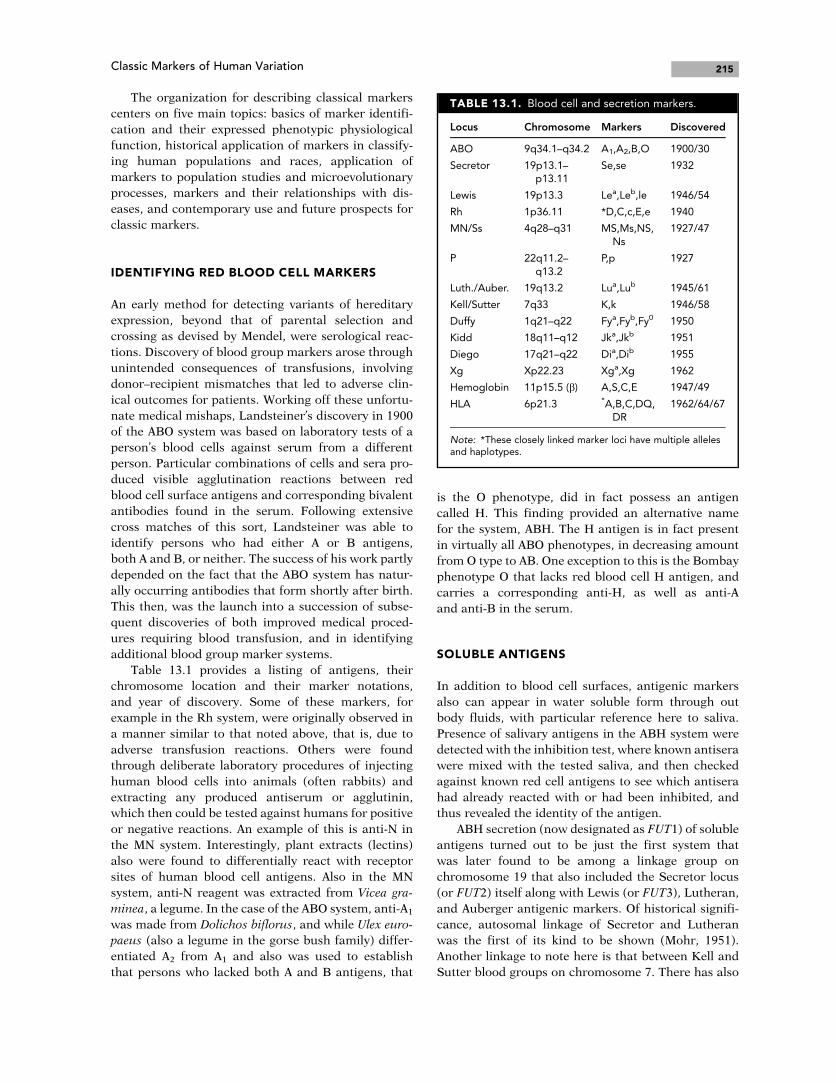
Table 13.1 provides a listing of antigens, their
chromosome location and their marker notations,
and year of discovery. Some of these markers, for
example in the Rh system, were originally observed in
a manner similar to that noted above, that is, due to
adverse transfusion reactions. Others were found
through deliberate laboratory procedures of injecting
human blood cells into animals (often rabbits) and
extracting any produced antiserum or agglutinin,
which then could be tested against humans for positive
or negative reactions. An example of this is anti-N in
the MN system. Interestingly, plant extracts (lectins)
also were found to differentially react with receptor
sites of human blood cell antigens. Also in the MN
system, anti-N reagent was extracted from Vicea gra-
minea, a legume. In the case of the ABO system, anti-A1
was made from Dolichos biflorus, and while Ulex euro-
paeus (also a legume in the gorse bush family) differ-
entiated A2 from A1 and also was used to establish
that persons who lacked both A and B antigens, that
is the O phenotype, did in fact possess an antigen
called H. This finding provided an alternative name
for the system, ABH. The H antigen is in fact present
in virtually all ABO phenotypes, in decreasing amount
from O type to AB. One exception to this is the Bombay
phenotype O that lacks red blood cell H antigen, and
carries a corresponding anti-H, as well as anti-A
and anti-B in the serum.
SOLUBLE ANTIGENS
In addition to blood cell surfaces, antigenic markers
also can appear in water soluble form through out
body fluids, with particular reference here to saliva.
Presence of salivary antigens in the ABH system were
detected with the inhibition test, where known antisera
were mixed with the tested saliva, and then checked
against known red cell antigens to see which antisera
had already reacted with or had been inhibited, and
thus revealed the identity of the antigen.
ABH secretion (now designated as FUT1) of soluble
antigens turned out to be just the first system that
was later found to be among a linkage group on
chromosome 19 that also included the Secretor locus
(or FUT2) itself along with Lewis (or FUT3), Lutheran,
and Auberger antigenic markers. Of historical signifi-
cance, autosomal linkage of Secretor and Lutheran
was the first of its kind to be shown (Mohr, 1951).
Another linkage to note here is that between Kell and
Sutter blood groups on chromosome 7. There has also
TABLE 13.1. Blood cell and secretion markers.
Locus Chromosome Markers Discovered
ABO 9q34.1–q34.2 A1,A2,B,O 1900/30
Secretor 19p13.1–p13.11
Se,se 1932
Lewis 19p13.3 Lea,Leb,le 1946/54
Rh 1p36.11 *D,C,c,E,e 1940
MN/Ss 4q28–q31 MS,Ms,NS,Ns
1927/47
P 22q11.2–q13.2
P,p 1927
Luth./Auber. 19q13.2 Lua,Lub 1945/61
Kell/Sutter 7q33 K,k 1946/58
Duffy 1q21–q22 Fya,Fyb,Fy0 1950
Kidd 18q11–q12 Jka,Jkb 1951
Diego 17q21–q22 Dia,Dib 1955
Xg Xp22.23 Xga,Xg 1962
Hemoglobin 11p15.5 (b) A,S,C,E 1947/49
HLA 6p21.3 *A,B,C,DQ,DR
1962/64/67
Note: *These closely linked marker loci have multiple allelesand haplotypes.
215Classic Markers of Human Variation
been evidence that Kell is linked with the PTC trait,
a marker to be discussed later. Linkage detail on
Kell/Sutter and the secretor loci noted above was
incomplete or not known at the time of major marker
compilations, such as Roychoudhury and Nei (1988).
Linkage between MN and Ss was known, and allele
combinations of these two systems, which undergo
little recombination, should probably be treated as
haplotypes. At the molecular level of the red blood cell
membrane, it is now established that the M and N
antigens are bound to glycophorin A (GPA) while the
S and s antigens are carried by glycophorin B (GPB).
The final red blood antigen system to mention here is
Xg, obviously so-named because it is located on the
X chromosome. It was discovered through conven-
tional serological methods in 1962. That year marks
the end of the initial period of discovery of red blood
cell polymorphisms, at least those that figured most
prominently in anthropological field studies.
Modes of inheritance for red blood cell and secretor groups can
be codominant (as in the MN group), dominant-recessive (as in
the Rhesus group for the D antigen), a combination (as in the
ABO group), or sex-linked (as in the Xg group). For some groups,
detection of heterozygote phenotypes depends upon the specifi-
city of the serological reagents. Molecular methods now make
many of the earlier dominant-recessive designations obsolete or
incomplete.
For a reasonably up-to-date compilation of red blood
cell markers, dealing with those covered here and
many more as well, the reader is referred to The Blood
Group Antigen FactsBook (Reid and Lomas-Francis,
1997), wherein you will find descriptions and displays
of the molecular basis of the markers along with add-
itional categories of information befitting a complete
reference source.
HEMOGLOBINS
Mode of inheritance: Two autosomal loci, segregating multiple
codominant alleles, but depending upon which of the pleiotropic
phenotypic expressions are considered, there can also be domin-
ant and recessive conditions.
Table 13.1 also lists hemoglobins, which make up
about 85% of the protein structure of red blood cells.
Considering their early and continuing significance in
microevolutionary studies, they could command a sep-
arate table. Electrophoresis was used in identifying
hemoglobin variants. A primary function of hemo-
globin is to bind oxygen molecules while blood has
infused the lungs and transport this oxygen throughout
the circulatory system where it is then released during
metabolic activity. A very large number of hemoglobin
variants have been found (Livingstone, 1985) but this
review will focus on major variants found at the
b-chain locus on chromosome 11. This locus is of par-
ticular interest here due to its maintaining elevated
marker frequencies in human groups that are at
increased risk for contracting endemic malaria, a topic
that will be covered later on.
HLA SYSTEMS
Mode of inheritance: Multiple autosomal loci andmultiple codo-
minant linkage groups or haplotypes.
Finally, Table 13.1 contains the HLA systems. Human
leukocyte antigen (HLA) haplotypes are found on white
blood cells and expressed at several closely linked loci
on chromosome 6. In a broader context, HLA pertains
to the major histocompatibility complex (MHC) as
found throughout vertebrates. The MHC is of funda-
mental importance in defining an individual’s
immunological identity and consequently establishing
a defense system against potential pathogens. The five
HLA loci as listed in Table 13.1 contained markers for
tracing human population relationships and for inves-
tigating associations with diseases. Three of these
(HLA-A, -B, and -C) are tested through serological reac-
tions, while the remaining two (HLA-DQ and -DR) are
investigated through cytotoxic methods. Specific HLA
haplotypes will be discussed later in the context of
disease associations.
SERUM PROTEINS
The plasma or fluid portion of blood contains a large
number of kinds of proteins, most of which were found
to be polymorphic as well as variable among different
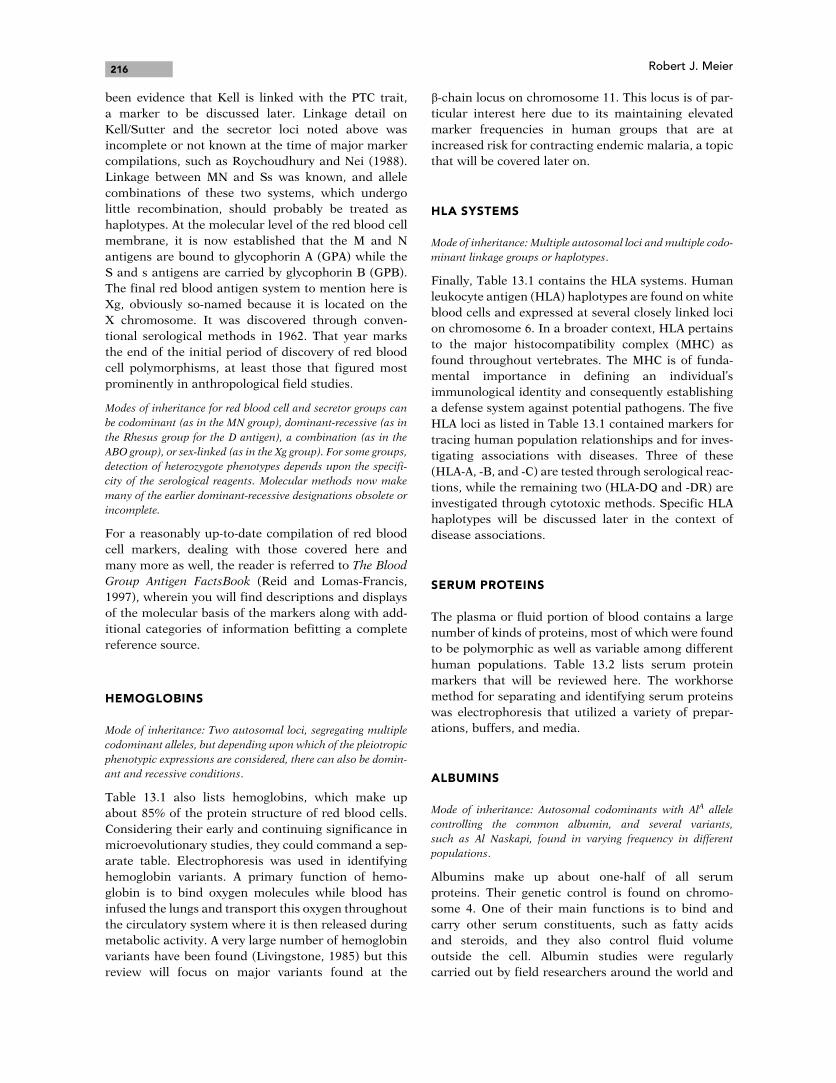
human populations. Table 13.2 lists serum protein
markers that will be reviewed here. The workhorse
method for separating and identifying serum proteins
was electrophoresis that utilized a variety of prepar-
ations, buffers, and media.
ALBUMINS
Mode of inheritance: Autosomal codominants with AlA allele
controlling the common albumin, and several variants,
such as Al Naskapi, found in varying frequency in different
populations.
Albumins make up about one-half of all serum
proteins. Their genetic control is found on chromo-
some 4. One of their main functions is to bind and
carry other serum constituents, such as fatty acids
and steroids, and they also control fluid volume
outside the cell. Albumin studies were regularly
carried out by field researchers around the world and
216 Robert J. Meier
several variants were discovered. One of the first of
these was Al Naskapi that was found in an Indian
group in Quebec (Melartin and Blumberg, 1966). Al
Naskapi was subsequently observed in other
Canadian and US North American Indian samples,
for example among the Dogrib Indians (Szathmary
et al., 1983).
GROUP SPECIFIC COMPONENT (GC)
Mode of inheritance: Two common autosomal codominant
alleles.
Group specific component (Gc) is also found on
chromosome 4 in close linkage with albumin. Its dis-
covery was made by Hirschfeld (1959). Gc is well-
understood to be a vitamin-D binding protein, with
two common alleles, Gc1 and Gc2. From this function
it might be expected there could be some interplay
between Gc variants and the role of vitamin-D in blood
cell formation, particularly in people subject to becom-
ing anemic and in areas of reduced sunlight where
human groups are at higher risk of rickets. With
respect to the latter prediction, Gc2 was thought to be
more efficient in transporting vitamin D, and did show
a higher frequency in some northern populations, but
with major exceptions, notably the Saami of Norway
and Sweden (Roychoudhury and Nei, 1988).
IMMUNOGLOBULINS (GM AND INV)
Mode of inheritance: Multiple autosomal dominant/recessive
and codominant alleles and linkage groups.
Immunoglobulins serve as the body’s defense system
by forming antibodies against foreign intruders
such as bacteria and viruses. By the 1960s two types
of globulins were identified, namely, Gm (IgG of the
heavy chain of the antibody molecule) and Inv
(IgK/Km of the light chain). Gm is located on chromo-
some 14, while Inv is mapped to chromosome 2.
Marker variants and haplotypes segregating at these
two loci were observed to differ by human population
and region, probably as the immune responses were
adaptively tailored to specific pathogenic threats.
So while there are coding genes underlying Gm and
Inv, their expression is mediated by environmental
circumstances. Schanfield (1980) conducted a study
of the anthropological usefulness of genetic markers
in differentiating regional and continental populations
and concluded that Gm haplotypes, along with HLA
haplotypes and the Duffy blood group, were the leaders
in carrying out this task when compared against a
bank of red blood cell, serum protein and enzyme
markers. Two essential components of usefulness were
defined in terms of uniqueness of the marker and
degree of polymorphism, and on both measures, Gm
scored highly.
HAPTOGLOBINS
Mode of inheritance: Autosomal codominant alleles, Hp1, Hp2.
Haptoglobins (Hp) bind free hemoglobin (Hb) that is
released from destroyed red blood cells. The Hp-Hb
complex both prevents loss of hemoglobin from the
body through excretion, and also apparently plays a
role in reducing the risk of bacterial growth by hemo-
globin (Eaton et al., 1982). Smithies (1955) was
the first to demonstrate polymorphic variation in hap-
toglobins by using starch gel electrophoresis. Hapto-
globin has since been mapped to the short arm of
chromosome 16. As with other serum proteins, hapto-
globin variants could be under selective forces that
maintain polymorphic frequencies depending on envir-
onmental stressors. For example, Hp1, which has a
higher hemoglobin-binding capacity than Hp2, gener-
ally reaches its highest frequency in tropically located
African and Amazonian populations who face a high
parasitic load and corresponding increased risk
for anemia.
TABLE 13.2. Serum protein, enzyme, and othermarkers.
Protein Chromosome Marker
Albumin 4q11–q13 AlA,Al Naskapi andothers
Gc 4q12–q13 Gc1,Gc2
Gm (IgG) 14.q32.33 Haplotypes
Inv (IgK) 2p12 Inv1,Inv2
Haptoglobin 16q22.1 Hp1,Hp2
Transferrin 3q22.1 TfC,TfB,TfD
Enzyme Chromosome Marker
Carbonicanhydrase
8q13–q22.1 CA II (B),CA II (C)
G6PD Xq28 G6PD deficient
HEXA (Tay–Sachs) 15q23–q24 HEXA deficient
Lactase 2q21 Lactase persistent,deficient
PAH (PKU) 12q24.1 PAH deficient
Red cell acidphosphatase
2p25 Pa,Pb,Pc
Trait/condition Chromosome Marker label
Cerumen(ear wax)
16q12.1 Wet type, dry type
Cystic fibrosis(CF)
7q31.2 Affected
PTC tasting 7q34 Taster, nontaster
217Classic Markers of Human Variation
TRANSFERRIN
Mode of inheritance: Three autosomal codominant variants, TfC
is common, and TFB and Tf D are rare.
Transferrin, as its name implies, is iron-binding pro-
tein that carries iron from the intestine and elsewhere,
and delivers it to active tissues and dividing cells. As
was the case for haptoglobins, Smithies (1958) dis-
covered the polymorphic status of the transferrin
locus, now mapped to chromosome 3. Could selection
be maintaining the polymorphism? Transferrin vari-
ants might be implicated in persons or groups chronic-
ally stressed by iron-deficiency anemia or who are at
high risk for red blood cell destruction. Also, transfer-
rin may be involved with removing harmful allergens
present in serum. While these are bases from which
selection could operate, there was no clear evidence
that this has been the case.
ENZYMES
Human variation in enzymes formed a vital area of
research for anthropology/human biology, leading to
field studies among non-Western populations in the
1960s. The most obvious interest, and of most clinical
significance, were enzyme deficiencies commonly
known as inborn errors of metabolism. Several trad-
itional biochemical markers were identified, Table 13.2
lists a selected sample. A brief introduction to these is
provided here, that will be followed later by a descrip-
tion of how these markers varied among different
populations, and some discussion of possible bases
for the variation. As in the case of serum proteins,
electrophoresis was the then appropriate method of
investigating enzyme variants in the 1960s. When first
established as hereditary markers, enzymes were pro-
moted as prime examples of the “one gene-one protein”
notion that had to be modified after subsequent dis-
coveries, as with the G6PD locus that has numerous
variants all due to mutations of one structural gene.
CARBONIC ANHYDRASE
Mode of inheritance: Two linked loci on chromosome 8, CA I
and CA II, each segregating dominant alleles, along with mul-
tiple recessive variants. Current status is that there now are at
least 12 carbonic anhydrase loci, some linked and others on
several different chromosomes.
Second only to hemoglobin, carbonic anhydrase forms
a large portion of red blood cell protein. Its major
function is to release carbon dioxide in the lungs in
conjunction with the respiratory cycle. Carbonic anhy-
drases also play a role in bone resorption and
calcification, and in maintaining an acid-base balance.
Early population studies did not reveal very much
variation except in Australia, with regard to CA I, and
Africa, in terms of CA II, which showed polymorph-
isms (Roychoudhury and Nei, 1988). Given the many
more recent discoveries of loci controlling the carbonic
anhydrases, there is the potential of finding addition-
ally interesting population variants.
GLUCOSE-6-PHOSPHATE DEHYDROGENASE
(G6PD) DEFICIENCY
Mode of inheritance: Multiple codominant X-linked alleles.
Glucose-6-phosphate dehydrogenase (G6PD) is per-
haps the most recognizable enzyme in anthropological
study when it appears in one of several variants that
result in reduced enzyme production or a deficiency.
Its deficiency has received a high level of attention due
to its interaction with malarial sensitivity and resist-
ance, and hence, demonstrated increased frequencies
in groups residing in endemic malarial regions. This
topic will be discussed later. The normal functioning
G6PD enzyme plays an important catalytic role in
maintaining red blood cell membrane integrity. The
enzyme is found throughout most of the body includ-
ing skin and saliva. Its genetic control is located on the
long arm of the X-chromosome.
HEXOSAMINIDASE A (HEXA) DEFICIENCY
Mode of inheritance: Multiple codominant autosomal alleles.
Hexosaminidase A (HEXA) is example where an
enzyme deficiency can have profound effects. The
mutated HEXA gene causes a lethal condition known
as Tay–Sachs disease. Persons having the classical form
of Tay–Sachs disease experience developmental retard-
ation and neurological degeneration in early infancy
and in most cases die before reaching their third birth-
day. A normal functioning HEXA gene, located on
chromosome 15, produces an enzyme that catalyzes
the degradation of excess ganglioside (a constituent
of cell membranes), whereas the mutated variant
allows for the build up of ganglioside in neurons that
causes the neurodegenerative disorder. Given the
dire outcome for children with Tay–Sachs, it was sur-
prising that the condition showed such ahigh frequency
in Ashkenazi Jews of Eastern Europe. Homozygote
recessives did not survive childhood so the variant
marker would be expected to exist at a very low fre-
quency. Initial thinking proposed that random drift
had by chance elevated the mutant HEXA enzyme in
the comparatively small and separated Jewish commu-
nities (Fraikor, 1977). Later, heterozygote advantage
218 Robert J. Meier
was invoked as a possible contributing explanation
(Chakravarti and Chakraborty, 1978; Marks, 1995).
It was argued that overcrowded urban ghettos posed
severe risks for infectious diseases, for example,
tuberculosis, but heterozygotes were somehow pro-
tected. A similar argument will be noted later
with respect to cystic fibrosis. In a more recent report,
the pendulum has swung back to explaining elevated
HEXA gene frequencies as due to drift in the form of
founder effect within a population experiencing rapid
census growth (Frisch et al., 2004).
LACTASE DEFICIENCY
Mode of inheritance: Autosomal alleles with lactase persistence
dominant over lactase deficiency.
Yet another example of an enzyme deficiency, but with
comparatively low adverse consequences, involves lac-
tase, a digestive enzyme of the milk sugar lactose. The
lactase locus has been mapped to chromosome 2.
Nearly all human babies produce sufficient amounts
of this enzyme throughout their growing years, and
then undergo a decline of enzyme output into matur-
ity. Milk, and unfermented derived milk products,
causes these adults to experience unpleasant digestive
symptoms, including bloating and diarrhea. Yet adults
in some parts of the world continue to produce higher
amounts of lactase, and hence have none of the afore-
mentioned symptoms. Population studies showed a
strong association between cultures that had a long
tradition of dairy farming and a persistence of lactase
into adulthood. A genetic analysis based on family
studies demonstrated that lactase deficiency was
inherited as an autosomal recessive, meaning that het-
erozygotes and homozygotes possessing the dominant
marker were lactose tolerant (Sahi, 1974). This was a
classic example of a biocultural interaction. It also
illustrated how environmentally dependent gene
expression was, or that genetic predisposition required
suitable conditions to become of significance to the
organism.
PHENYLALANINE HYDROXLASE (PAH)
DEFICIENCY
Mode of inheritance: Autosomal alleles, with PKU recessive.
Phenylalanine hydroxlase (PAH) is a catalytic enzyme
that participates in the conversion of phenylalanine
to tyrosine. A deficiency of PAH is an inborn error
of metabolism that can lead to varying degrees of
impaired mental functioning, and other pleiotropic
effects, known as phenylketonuria (PKU). The mutated
allele is located on chromosome 12. Phenylketonuria is
readily diagnosable and is routinely tested for as part
of newborn screening, and is preventable through care-
ful and consistent dietary management following a
phenylalanine-free regimen at least through childhood.
Like lactase deficiency noted above, PKU is another
case of environmentally dependent or culturally medi-
ated expression.
OTHER MARKERS
This section concludes with a description of variable
human conditions or traits that were included occa-
sionally in population studies (see Table 13.2). Of inter-
est, investigations of phenylthiocarbamide (PTC)
polymorphism were even extended to nonhuman pri-
mates. Methods of study were quite different ranging
from visual and tactile examination for cerumen
(ear wax) types, initially a host of clinical diagnosis
and laboratory tests for cystic fibrosis that now include
genetic analysis, and serial dilution or simple test
paper strips for the PTC-tasting trait. They also show
a range of consequences for the individual from being
rather benign for cerumen types, to profoundly
affecting the well-being of cystic fibrosis patients.
CERUMEN (EAR WAX) TYPES
Mode of inheritance: Allele for wet, sticky ear wax is autosomal
dominant; dry ear wax is recessive.
Cerumen markers are expressed as wet (sticky, brown)
and dry types (flakey, light colored) that are controlled
by a locus on chromosome 16. There is human popula-
tion distribution variability in these types along with
implications of selection acting on ear wax type relative
to climatic variables. The dry type is most often found
in northern Asian populations, while the wet type
is found in tropically located Asians, as well as in
Africans and Europeans. Whatever adaptive signifi-
cance there is for ear wax type polymorphism is yet to
be determined.
CYSTIC FIBROSIS
Mode of inheritance: Multiple autosomal alleles, with CF
recessive.
Cystic fibrosis (CF) is a debilitating condition that dis-
rupts normal pancreatic, intestinal and respiratory
functioning. After some intensive genetic research,
the CF gene was mapped to chromosome 7 in 1985.
Since affected individuals prior to more recent therap-
ies were at high mortality risk as children and had
reduced fertility as adults, it was puzzling why the
219Classic Markers of Human Variation
condition had reached a high frequency in some
European populations. A possible answer may be
found in an association between the CF locus and risk
for tuberculosis, paralleling heterozygote advantage
explanations given for Tay–Sachs disease, and also
for sickle cell anemia which will be discussed more
fully later in the context of balancing selection and
diseases.
PTC TASTING
Mode of inheritance: Taster allele is autosomal dominant; non-
taster is recessive; variable expressivity in phenotypes.
The ability to taste the compound phenylthiocarba-
mide (PTC) is controlled by a major gene mapped to
chromosome 7, with another locus likely involved as
well. For an up-to-date confirmation of PTC chromo-
some mapping see Drayna et al. (2003) and for a com-
plete historical review of this trait see Wooding (2006).
Although a rigid bimodal distribution of tasters and
nontasters is not observed, especially with applying
the serial dilution procedure, there is a certain ease in
collecting results, apparently so readily accessible that
chimpanzees and rhesus monkeys became suitable
subjects (Eaton and Gavan, 1965). Roychoudhury and
Nei (1988) list nearly 80 human studies that had
carried out PTC testing that virtually covered the
world. Gene frequencies were highly variable both
within and between continental samples, with no dis-
cernible patterns. There has been a suggestion of an
interaction between dietary practices and thyroid func-
tion (Molnar, 2006). PTC, as a synthetic compound,
serves as a proxy for a carbon-nitrogen-sulfur radical
found in certain plant foods, particularly those of the
cabbage family, that tasters perceive as bitter, and
hence, to be avoided. This could be a protective behav-
ior in that cabbage and its relatives may block the
uptake of iodine, thereby reducing thyroid function,
and resulting in depressed metabolism that in turn
affected childhood growth and adult fertility. Con-
versely, nontasters have been shown to be more sus-
ceptible to developing nodular goiters, presumably due
to a reaction of the thyroid gland to depressed amounts
of iodine in the diet. Additional testing of the role
selection and adaptation play in maintaining the PTC
polymorphism seems warranted.
In concluding this section on basic marker identifi-
cation, it should be pointed out that not all population
studies utilized all of the markers described, or for that
matter, had necessarily restricted their research to
those that appear above. On the first point, research
projects added markers as they were discovered and
found to be anthropologically useful. As noted earlier,
usefulness of markers was well investigated in
Schanfield and Fudenberg (1978) and Schanfield
(1980), that dealt with the Gm and HLA systems and
accompanying extensive tables of marker frequencies
for world populations. Schanfield (1980) also notes a
general problem in that certain markers could not be
studied routinely because their reagents were not read-
ily available, with particular reference to the HLA
system.
Now that a set of classic markers has been intro-
duced, the next section will offer a discussion of how
these markers were applied in various contexts, the
first being that of describing human biological diver-
sity, including its most contentious application, that of
classifying human races.
BLOOD GROUP MARKERS FOR CLASSIFYING
HUMAN POPULATIONS
There is a long and tortuous history surrounding
unsuccessful attempts to sort human populations into
stable, mutually exclusive categories called races.
Rather than extensively review that history here, the
reader is referred to these works for that information
(Montagu, 1964; Marks, 1995; Brace, 2005; Molnar,
2006). It is important, however, to trace the use of
blood group markers as these became available to
those choosing to carry out race classification. That
story, as already mentioned, began with the discovery
by Landsteiner in 1900 of the ABO blood group. A little
more that a decade later, the ABO group was being
studied by Ludwik Hirschfeld by conducting sero-
logical tests on thousands of persons, soldiers and
civilians, from throughout Europe and even some
from China, Japan, and Africa (Mourant, 1983). His
results laid the groundwork for all subsequent studies
showing serological distinctions across human popula-
tions, that is, the establishment of racial divisions.
The premise applied was quite straightforward.
First, accepting that the ABO blood group markers
were inherited (which Hirschfeld helped to show),
then frequencies of ABO blood group types (and later
calculated gene frequencies) would indicate the
degree of relationship between populations, the more
similar they were the more closely they were related to
each other, and vice versa. From there it was a matter
of drawing lines between blocks of populations, a step
that undoubtedly was greatly aided by geography and
continental boundaries, and taken by Hirschfeld
and his wife (Hirschfeld and Hirschfeld, 1919) in
their defining of three ABO racial types, European,
Asio-African and Intermediate (Marks, 1995). This
was followed by other attempts at serological race
classification (Ottenberg, 1925; Snyder, 1930; Wiener,
1948), but the effort that might have had a high poten-
tial for impacting anthropological thinking on races
220 Robert J. Meier
was that of Boyd. In his book, Genetics and the Races of
Man: an Introduction to Modern Physical Anthropology
(1950), Boyd set forth in highly explicit terms why he
considered blood group markers to be more scientific-
ally sound for racial classification than that any of
the heretofore used methods utilizing morphological
characters, including anthropometry.
When Boyd’s work was published, blood group fre-
quencies were available in large samples for the ABO,
Rh, and MN systems. In addition, Boyd added PTC
tasting and secretor status to his set of markers.
His genetically defined races largely matched earlier
classifications, particularly that of Wiener (1948).
Not surprising then, Boyd’s genetic races conformed
closely with geography, a point that he seems to regard
as confirmation of what he expected to find regarding
human population descent histories and their patterns
of separation and migration. His claims for the advan-
tages of the genetic method over earlier classifications
are that it is more simply done, completely objective,
and that gene frequencies do not have the genetic
uncertainty that is hidden in phenotypic traits, and
gene frequencies provide quantitative rather than
qualitative measures of population differences along
with an assessment of admixture (Boyd, 1950).
It should be noted that the erroneous claim of selective
neutrality for blood group genes initially was accepted
by Boyd (1950), except for maternal–fetal incompati-
bility in the Rh system, who then later abandoned it
(Boyd, 1963a).
In this same year, Boyd (1963b) touted what he
judged to be major accomplishments of the genetic
method. He concluded that genetic methods had con-
tributed to physical anthropology by: (a) confirming an
Indian origin of Gypsies; (b) providing a quantitative
assessment of white admixture in American Blacks; (c)
establishing that Lapps were a distinctive European
race; and (d) showing that Papuans of the New Guinea
region were native to the South Pacific and had not
migrated from Africa. With regard to one of these pre-
sumed feats there is recent caution expressed against
the use of markers, sometimes single alleles, for calcu-
lating degree of admixture (O’Rourke, 2000).
By the time of Boyd’s 1950 classification of sero-
logical races, it had already been reported (Boas, 1912;
Shapiro and Hulse, 1940; Lasker, 1946) that head and
body measurements were subject to modification in
children of migrants who accommodated to new envir-
onmental conditions. Hence, this important finding
would severely question the presumed stability of
those variables, such as the cephalic index, that had
been so heavily relied upon by race classifiers. How-
ever, by the end of the 1960s, race classification itself
was on the wane, and genetic markers were not able
to sustain efforts that sought to arbitrarily apportion
human variation into discrete categories.
What helped to replace racial classification were
attempts to discern the nature of human population
relationships in terms of cultural historical and micro-
evolutionary processes. An even more basic task was to
be able to accurately analyze whatever biological dif-
ferences existed between groups without any need to
classify them. A study from Boyd’s time period that
illustrates this kind of endeavor was done by Sanghvi
(1953). He included five endogamous Indian castes in
an analysis of anthropometric versus genetic markers
to discern their relationships. His list of markers, cer-
tainly short by subsequent standards, only consisted
of ABO, MN and Rh blood group phenotypes, taste
reactions to PTC, and red-color-blindness. He con-
cluded that either the genetic or morphological method
could be more useful in reflecting biological relation-
ships in certain cases, but more likely they will comple-
ment each other, and hence, both should be applied
using many more measurements and markers than he
did. We will see in the next section that this recommen-
dation is indeed heeded within a decade with the
launching of a number of major research projects.
Physical anthropology apparently was not so con-
vinced of Boyd’s approach not because it applied
genetic markers, but because they were used to classify
races. Two principal textbooks of roughly that time
period perhaps best reflect the state of affairs.
Montagu (1960) and Buettner-Janusch (1966) both
are replete in their coverage of genetic markers, com-
plete with tables of gene frequencies and allele distri-
bution maps for the world. Beyond that they provided
clear background information on the modes of inherit-
ance and methods for identifying blood groups and
serum proteins, and most importantly, what was then
known about the selective basis of certain systems,
such as the association of blood groups and diseases
and the anthropological significance of hemoglobin
variants at the sickle cell locus. Race classification
utilizing genetic markers was seen as relatively unim-
portant and unproductive, in comparison with the
study of selection and other microevolutionary pro-
cesses that occurred within local populations. On a
larger scale, research interest shifted to investigating
how and when gene pools across and between contin-
ents came to differ from one another, again through
microevolutionary processes. This state of affairs
undoubtedly reflected the paradigm change that
Washburn (1951) had proposed a decade or so earlier
that the “new Physical Anthropology” should empha-
size an understanding of function and process as
opposed to an earlier focus on technique and descrip-
tion as a direct goal.
In opposition to race classification, a mid-twentieth
century alternative was to view patterns of genetic
variation expressed in terms of clinal distributions.
Gene frequency clines joined the already recognized
221Classic Markers of Human Variation
gradients in human morphological variation with
respect to body size and shape (Allen’s and Bergmann’s
Rules), and skin pigmentation (Gloger’s Rule). These
so-called “ecogeographic” rules generally explained
clinal variation in morphology as due to adaptive
responses of populations residing in gradients of tem-
perature, solar radiation, and other environmental
conditions that occurred in latitudinal changes. It was
reasoned that gene frequency clines, or genoclines,
might also be the result of natural selection gradients,
such as levels of disease stress, but could as well be
explained by actions of gene flow, migration, and
human mobility and settlement patterns. For here, a
classic example of a genocline will be presented
followed by a more recent application of genocline
based on Australian data that had been collected
decades earlier (Birdsell, 1993).
A textbook example of a genocline is the distribu-
tion of the B allele of the ABO system as its frequency
was mapped from eastern Asia to the British Isles.
Although it was not known why, the B allele had its
maximum frequency in Asia at around 25% but then
declined to less than 5% in much of Western Europe
(Mourant, 1954). A likely explanation for the B-allele
cline rested in historical migrations and invasions of
peoples from Asia westward over the past couple of
millennia. To be sure, the B-allele cline was not exactly
a smooth and steady transition across Eurasia. There
were gaps in the big picture, and very likely if B-allele
frequencies were filled in, a more detailed map com-
posed of many local-level populations would show
some breaks or even reversals of the general geo-
graphic trend. It is to be expected that there were
historical episodes involving small founder groups that
became isolated over sufficient amounts of time for
genetic differentiation to have occurred. Lastly, gene
flow and human population movements were not
exclusively in a westerly direction.
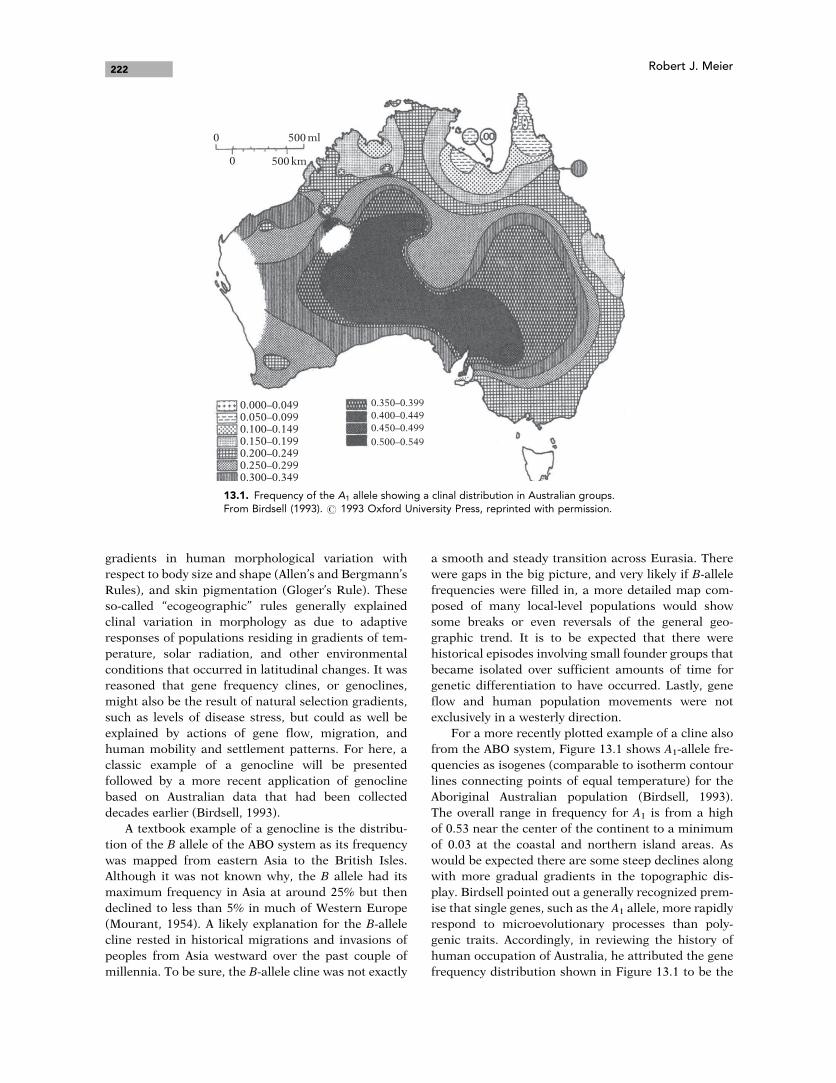
For a more recently plotted example of a cline also
from the ABO system, Figure 13.1 shows A1-allele fre-
quencies as isogenes (comparable to isotherm contour
lines connecting points of equal temperature) for the
Aboriginal Australian population (Birdsell, 1993).
The overall range in frequency for A1 is from a high
of 0.53 near the center of the continent to a minimum
of 0.03 at the coastal and northern island areas. As
would be expected there are some steep declines along
with more gradual gradients in the topographic dis-
play. Birdsell pointed out a generally recognized prem-
ise that single genes, such as the A1 allele, more rapidly
respond to microevolutionary processes than poly-
genic traits. Accordingly, in reviewing the history of
human occupation of Australia, he attributed the gene
frequency distribution shown in Figure 13.1 to be the
0
0
500 ml
500 km
0.000–0.0490.050–0.0990.100–0.1490.150–0.199
0.350–0.399
0.400–0.449
0.450–0.499
0.500–0.5490.200–0.2490.250–0.2990.300–0.349
13.1. Frequency of the A1 allele showing a clinal distribution in Australian groups.From Birdsell (1993). # 1993 Oxford University Press, reprinted with permission.
222 Robert J. Meier
product of settlement of small founding groups (that is,
founder effect), successive major migration waves, and
importantly, a population structure of local bands
within a larger tribal population.
Clinal distributions of classic markers, such as
those for the B and A1 alleles just described, clearly
demonstrated that race classification could not begin
to capture the complexities and details of human
population relationships and historical connections.
In pursuit of that goal, the discussion now turns to
population studies that set out to reconstruct history
through an understanding of microevolution.
APPLICATION OF MARKERS TO POPULATION
STUDIES AND MICROEVOLUTIONARY
PROCESSES
Dynamic population study took precedence over static
race labeling with the launching of a number of
important human biology field research projects. One
such effort was the Harvard Solomon Islands Project
that was conceived by Albert Damon in the early 1960s
(Friedlaender, 1987). This project served as a model of
design for many more similar projects that were under-
taken in roughly this time period. The Solomon Islands
Project applied a multidisciplinary approach in which
all four subfields of anthropology were represented,
along with specialties from the biomedical sciences.
It was reasoned that if population processes were
to be adequately understood, it would be necessary to
examine essential aspects of human behavior and deci-
sion-making. This meant that culture interacted with
human biology, and in recognition of this connection a
biocultural or biobehavioral approach was established.
A clear illustration is to be found in population genetic
measures of migration or gene flow, and even in selec-
tion and random drift. The strength of these processes
very much depended upon human behavior and deci-
sion-making, such as cultural expressions in settlement
patterns, mate choice and marriage customs, and cul-
turally derived medical systems for diagnosis and
treatment.
A major task within the sphere of population genet-
ics in the Solomon Islands Project was to map bio-
logical variation among several groups on different
islands with an aim to portray relationships of these
groups in terms of microevolutionary processes, espe-
cially those pertaining to selection, random drift, and
migration (Rhoads and Friedlaender, 1987). Among
the markers included in that study were numerous
blood polymorphisms, namely; eight red blood cell
antigen systems, haptoglobins, transferrins, and
Gm and Inv systems. Calculated allele frequencies
from these markers were used in a distance analysis
and other multivariate procedures that rendered
comparative findings for the Solomon Islands as well
as with additional samples that had been obtained
earlier fromBougainville (Friedlaender, 1975), and also
samples from a broader Pacific Island context. The
upshot of this aspect of the study that involved markers
was a complex and not easily discernible pattern of
genetic variation, but it seemed to indicate at each level
from local groups to that of Pacific region and even
beyond, that biological heterogeneity and variability
extended deep into history and could not be explained
simply by random drift of small, isolated groups.
Another aspect of the Solomon Islands Project,
which also was carried out in many other research
efforts in that time period including the earlier
Bougainville study, was to incorporate genetic markers
with multiple measures of distance as a test of corres-
pondence between these measures for potentially real-
izing the same or similar outcomes of population
relationships. In this regard, the Solomon Islands
Project combined the distance measures of geography,
language, anthropometry, odontometrics, dermato-
glyphics, as well as the set of genetic markers noted
earlier. One of the more enlightening results showed
that genetic markers, along with anthropometrics
and odontometrics, less closely corresponded with
language and geography than did dermatoglyphic
variation (Friedlaender, 1987).
Other studies have yielded varying results in these
distance correspondence analyses. A brief review of
this matter can be found in Meier (1980), who noted
that incongruence between distance measures could be
due to such factors as sample size and composition,
number and kinds of markers used, and level at which
the analysis is done, from local villages to large regions.
For this discussion of genetic markers, it is perhaps
best summarized with the appreciation that Mendelian
traits could well be subjected to short-term and rela-
tively rapid change in frequency via random drift and
founder effect (particularly in small, semi-isolated
groupings), but also undergo successive generational
change due to selection processes. And hence, there is a
great need to understand the nature and makeup of the
sample upon which the marker frequencies are based,
and to fully characterize samples even though most
often there was little way to control sample makeup
while conducting field studies. In the end, there
remains considerable theoretical uncertainty whether
the degree and rate of change in frequencies of
markers are expected to correspond well with the other
distance measures, such as anthropometric or lan-
guage change. On this matter, Lewontin remarks in
his Foreword to Friedlaender (1975) that linguistic dis-
tance at that time was too simply measured. However,
Lewontin praised Friedlaender’s work for its strong
emphasis upon the historical perspective, that is, in
reconstructing the action of evolution over time.
223Classic Markers of Human Variation
Several population studies in the late 1960s and
into the 1970s paralleled portions of the Bougainville
and Solomon Islands Project design, particularly for
their application of the multidisciplinary, biocultural,
and historical approaches. One set of such studies can
be grouped under the International Biological Pro-
gramme (IBP) Human Adaptability Projects. For a
brief background, the IBP was composed of seven
sections that directed a global effort toward measuring
and understanding ecological productivity and its
interaction with human welfare. One of these sections
was that of Human Adaptability (HA) which got under-
way in the mid 1960s. Relevant to this discussion,
methods for collecting specimens, such as blood from
which markers could be determined, were presented in
the IBP HA Handbook that first appeared in 1965
(Weiner and Lourie, 1969). This guide did not specify
which markers were to be studied but rather set forth
specifics of proven field methods for securing, storing,
and transporting specimens so that they could be com-
parably analyzed, very often in a distantly located
laboratory. A common problem was hemolysis during
extended periods of travel, rupturing the red blood
cell membrane and spilling out constituents that would
have been used for serological testing. The IBP
Handbook also detailed procedures for carrying out
field testing of some markers, for example screening
methods for G6PD and determining PTC taster status.
A major concern that needed to be addressed was
that of reliability of the serological results even when
the specimens reached their destinations presumably
intact. This matter had received some attention at
the time.
Osborne (1958) had reported some major discrep-
ancies for blood group testing when done at three well-
established laboratories. Handling problems may have
been an issue in another study documenting testing
discrepancies (Livingstone et al., 1960). The least
stable systems involved subtyping of A in the ABO
system, and in the Duffy and P markers. Thus, it was
imperative that blood specimens at the very least be
handled with the utmost care to avoid degradation
problems. One study that did a careful analysis of such
problems was Neel et al. (1964) in which they had
carried out field testing on blood specimens collected
from the Xavante of Brazil, and then later retested
them in their laboratory in Ann Arbor, Michigan.
According to their full disclosure, discrepancies
seemed to relate to different testing and laboratory
conditions, and it was these problem areas that the
IBP Handbook had hoped to rectify.
Under US IBP/HA auspices, multidisciplinary field
studies that included a survey of genetic markers
were carried out among human groups residing in
Alaska (Inupiat Eskimos), Peru (Quechua), and Brazil
(Yanomama and Makiritare), with the last cited having
the greatest emphasis on applying classic markers to
population genetics questions (Neel and Ward, 1972).
These along with a selection of additional field studies
appear in Table 13.3.
Particular mention should be made here of a four-
volume series published under the topic of
Anthropological Genetics (Crawford and Workman,
1973; Mielke and Crawford, 1980; Crawford and
Mielke, 1982; Crawford, 1984). (A fifth volume in this
series-Crawford, 2007, presented an updating of the
earlier volumes by focusing upon molecular genetics.)
These works in general illustrated how useful classical
markers were in population study, for example of
the Black Caribs of Central America (Crawford, 1984).
This volume contained several differently authored
chapters devoted to marker description and frequency
distributions and then went on to explore critical
topics that employed these data in such matters as
admixture estimates, fertility differentials (in the case
of the sickle cell locus), and population structure.
TABLE 13.3. Selected population studies employingclassical markers.
Study area/population Year begun Reference
Wales Post-WWII Harper andSunderland(1986)
Australia 1952 Birdsell (1993)
Canada/BlackfeetIndians
1952 Chown and Lewis(1953)
Brazil/Xavante 1962 Neel et al. (1964)
South Africa/San,Herero, and others
1963 Jenkins et al. (1978)
Easter Island* 1964 Etcheverry (1967);Meier (1969)
Peruvian Andes/Quechua
1965 Baker and Little(1976)
India/Gavdas 1966 Malhotra (1978)
Japan/Ainu 1966 Omoto (1978)
Bougainville 1966 Friedlaender (1975)
Solomon Islands 1966 Friedlaender (1987)
Alaska/Eskimos(Inupiat)*
1967 Jamison et al.(1978)
Southwestern UnitedStates/Papago
1967 Niswander et al.(1970)
Saharan Africa/Ideles 1968 Lefevre-Witier andVerges (1978)
Mexico/Tlaxcaltecan 1969 Crawford et al.(1974)
Central America/BlackCaribs (Garifuna)
1975 Crawford (1984)
Canada/Dogrib Indians 1979 Szathmary (1983)
Note: *Due to problems, complete serological testing couldnot be done on the Easter Island and Inupiat blood specimens.WWII, World War II.
224 Robert J. Meier
It was these kinds of studies done on regionally
demarked human groups for which genetic, biological,
and cultural information could be combined that offer
sharp insight to microevolutionary processes and
population dynamics.
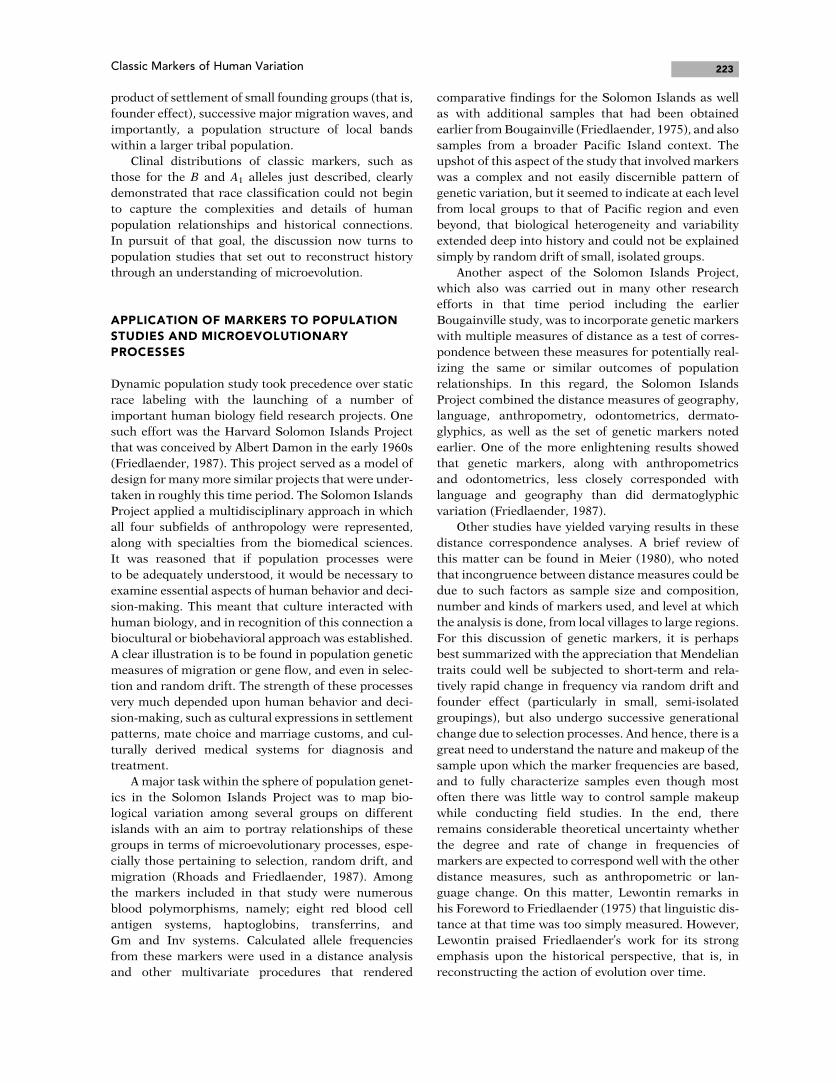
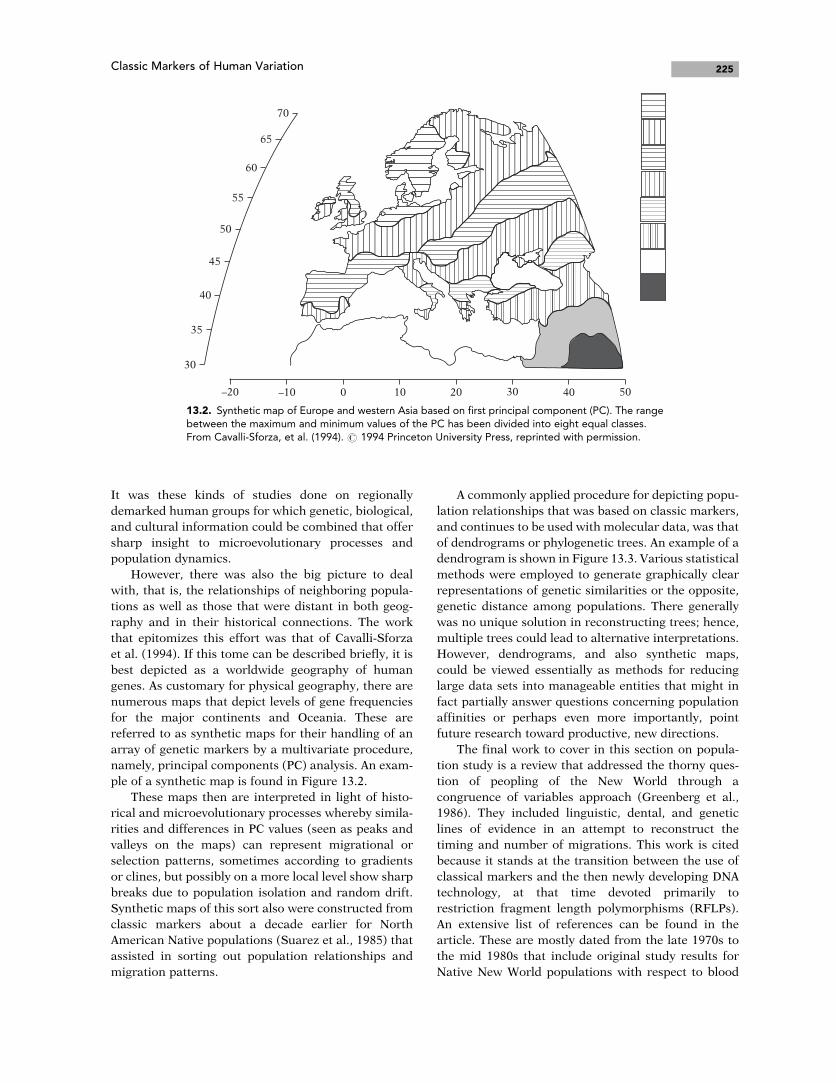
However, there was also the big picture to deal
with, that is, the relationships of neighboring popula-
tions as well as those that were distant in both geog-
raphy and in their historical connections. The work
that epitomizes this effort was that of Cavalli-Sforza
et al. (1994). If this tome can be described briefly, it is
best depicted as a worldwide geography of human
genes. As customary for physical geography, there are
numerous maps that depict levels of gene frequencies
for the major continents and Oceania. These are
referred to as synthetic maps for their handling of an
array of genetic markers by a multivariate procedure,
namely, principal components (PC) analysis. An exam-
ple of a synthetic map is found in Figure 13.2.
These maps then are interpreted in light of histo-
rical and microevolutionary processes whereby simila-
rities and differences in PC values (seen as peaks and
valleys on the maps) can represent migrational or
selection patterns, sometimes according to gradients
or clines, but possibly on a more local level show sharp
breaks due to population isolation and random drift.
Synthetic maps of this sort also were constructed from
classic markers about a decade earlier for North
American Native populations (Suarez et al., 1985) that
assisted in sorting out population relationships and
migration patterns.
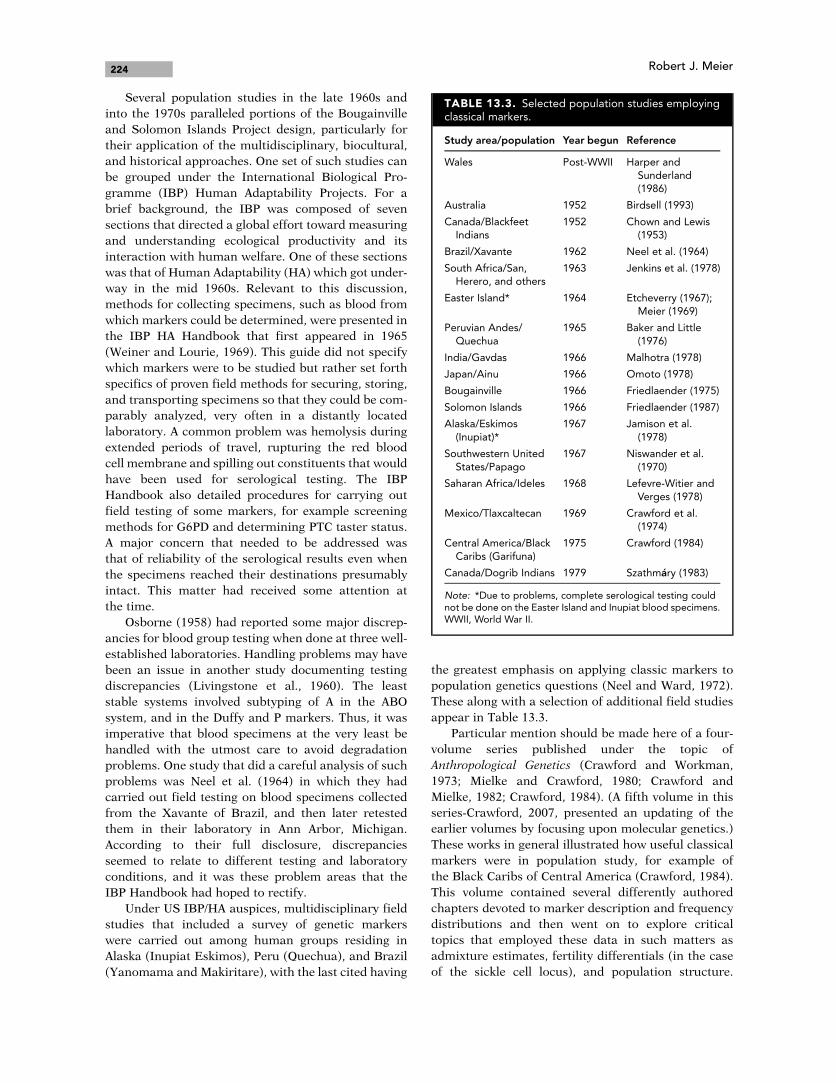
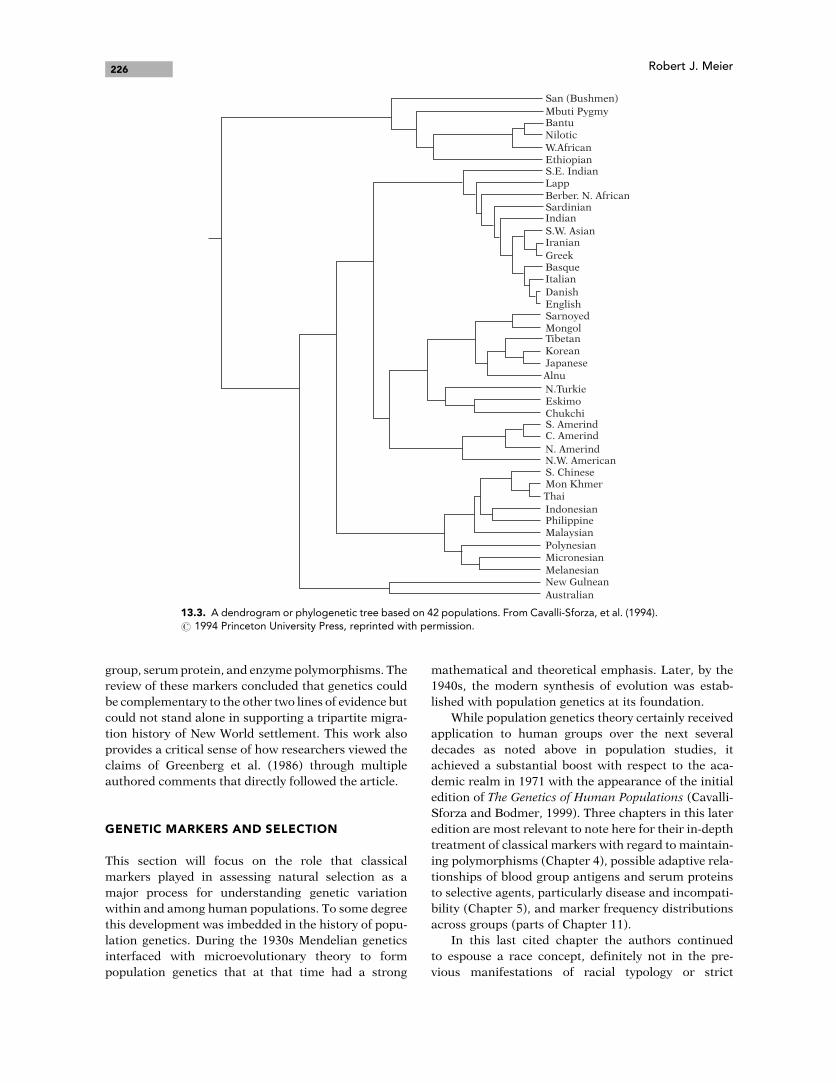
A commonly applied procedure for depicting popu-
lation relationships that was based on classic markers,
and continues to be used with molecular data, was that
of dendrograms or phylogenetic trees. An example of a
dendrogram is shown in Figure 13.3. Various statistical
methods were employed to generate graphically clear
representations of genetic similarities or the opposite,
genetic distance among populations. There generally
was no unique solution in reconstructing trees; hence,
multiple trees could lead to alternative interpretations.
However, dendrograms, and also synthetic maps,
could be viewed essentially as methods for reducing
large data sets into manageable entities that might in
fact partially answer questions concerning population
affinities or perhaps even more importantly, point
future research toward productive, new directions.
The final work to cover in this section on popula-
tion study is a review that addressed the thorny ques-
tion of peopling of the New World through a
congruence of variables approach (Greenberg et al.,
1986). They included linguistic, dental, and genetic
lines of evidence in an attempt to reconstruct the
timing and number of migrations. This work is cited
because it stands at the transition between the use of
classical markers and the then newly developing DNA
technology, at that time devoted primarily to
restriction fragment length polymorphisms (RFLPs).
An extensive list of references can be found in the
article. These are mostly dated from the late 1970s to
the mid 1980s that include original study results for
Native New World populations with respect to blood
70
65
60
55
50
45
40
35
30
–20 –10 0 10 20 30 40 50
13.2. Synthetic map of Europe and western Asia based on first principal component (PC). The rangebetween the maximum and minimum values of the PC has been divided into eight equal classes.From Cavalli-Sforza, et al. (1994).# 1994 Princeton University Press, reprinted with permission.
225Classic Markers of Human Variation
group, serumprotein, and enzyme polymorphisms. The
review of these markers concluded that genetics could
be complementary to the other two lines of evidence but
could not stand alone in supporting a tripartite migra-
tion history of New World settlement. This work also
provides a critical sense of how researchers viewed the
claims of Greenberg et al. (1986) through multiple
authored comments that directly followed the article.
GENETIC MARKERS AND SELECTION
This section will focus on the role that classical
markers played in assessing natural selection as a
major process for understanding genetic variation
within and among human populations. To some degree
this development was imbedded in the history of popu-
lation genetics. During the 1930s Mendelian genetics
interfaced with microevolutionary theory to form
population genetics that at that time had a strong
mathematical and theoretical emphasis. Later, by the
1940s, the modern synthesis of evolution was estab-
lished with population genetics at its foundation.
While population genetics theory certainly received
application to human groups over the next several
decades as noted above in population studies, it
achieved a substantial boost with respect to the aca-
demic realm in 1971 with the appearance of the initial
edition of The Genetics of Human Populations (Cavalli-
Sforza and Bodmer, 1999). Three chapters in this later
edition are most relevant to note here for their in-depth
treatment of classical markers with regard to maintain-
ing polymorphisms (Chapter 4), possible adaptive rela-
tionships of blood group antigens and serum proteins
to selective agents, particularly disease and incompati-
bility (Chapter 5), and marker frequency distributions
across groups (parts of Chapter 11).
In this last cited chapter the authors continued
to espouse a race concept, definitely not in the pre-
vious manifestations of racial typology or strict
San (Bushmen)
Mbuti PygmyBantuNilotic
W.AfricanEthiopianS.E. IndianLapp
Berber. N. AfricanSardinianIndian
S.W. AsianIranian
GreekBasqueItalian
DanishEnglishSarnoyedMongolTibetanKoreanJapanese
Alnu
N.TurkieEskimoChukchiS. Amerind
N. Amerind
C. Amerind
N.W. AmericanS. ChineseMon KhmerThai
IndonesianPhilippineMalaysian
Polynesian
Melanesian
Micronesian
New Gulnean
Australian
13.3. A dendrogram or phylogenetic tree based on 42 populations. From Cavalli-Sforza, et al. (1994).# 1994 Princeton University Press, reprinted with permission.
226 Robert J. Meier
classification, but rather as an acknowledgement of
biological differences and similarities they assumed
to be based on race. It appears that their use of race
is simply a matter of convenience for defining popula-
tion units of study, which is to this day a vexing prob-
lem for anyone carrying out population studies. Who
belongs within the sample and how will comparable
study groups be defined? Island populations and semi-
isolated villages offer fairly clearly demarked boundar-
ies, and this may in fact underlie part of the attraction
for the geographic selection in the field studies noted
above.
In the manner in which Cavalli-Sforza and Bodmer
(1999) had used race, it might have been more appro-
priate to have used a concept proposed by Montagu
(1964), the “genogroup,” which essentially defined
population differences on the basis of gene frequen-
cies. Then again, Montagu seemed to favor “ethnic
group” as a substitute for race, which has gained
fairly wide application. However, “ancestry” appears
to be replacing all of these terms at the present
time in the context of DNA markers. Aside from con-
structing tree diagrams to show partial conformity
with prior race classifications, Cavalli-Sforza and
Bodmer (1999) more importantly demonstrated how
microevolutionary processes drove the course of popu-
lation change. Their text, then, established a formal
educational treatment from which to pursue interests
in human population genetics. Needless to say, the
genes upon which most of the principles rested were
classical markers. And it is a consideration of these
markers with respect to selection that is covered next.
ABO MARKERS AND DISEASE ASSOCIATIONS
As broader world surveys of the ABO blood-group dis-
tributions became available, it also became apparent
that gene frequencies varied both within highly
polymorphic loci as well as considerably across popu-
lations to a degree that could not be attributed to
newly arising mutation nor to random drift or to gene
flow, at least above local population levels. This, of
course, pointed to selection as the active force in
both changing and in maintaining gene frequency
levels. There was ongoing debate as to whether ABO
polymorphisms were in a stable state or transient
and hence subject to eventual loss of alleles. The argu-
ments for stability rested on the presence of the
ABO blood group system in nonhuman primates –
antigens analogous to A and B are present in Rhesus
macaques (Duggleby, 1978), and the relatively narrow
range of ABO gene frequencies within certain human
groups. These lines of evidence indicated that ABO
polymorphisms had a long history by virtue of their
existence in nonhuman primates, and then varying
historical and environmental conditions for selection
to operate on led to variation across different human
groups. This section will cover the use of markers
in trying to understand the nature of ABO polymorph-
isms with regard to selection.
The earliest work to implicate selection in the ABO
distribution was faulty for its lack of statistical rigor.
It simply amounted to collecting data showing associ-
ations between particular ABO blood types and a set of
diseases, often using hospital patient records as the
sampling source. However, flaws in the early research
were in not having adequate control groups or
unbiased samples that would allow any deviation from
normal expectations to be properly ascertained. Once
these study defects were corrected, many significant
associations remained with respect to noninfectious
diseases, but not nearly as clear as the results for infec-
tious diseases, and these will be discussed first.
Armed with these findings, it was important to now
offer possible selective mechanisms that would
account for the blood group and disease associations,
and that then would define directions for further inves-
tigation. Four categories of infectious disease had been
identified as likely candidates for changing gene fre-
quencies through natural selection (Vogel and
Motulsky, 1997). These were: (1) acute infections, such
as small pox, plague and cholera, that periodically
spread as epidemics over large areas; (2) chronic infec-
tions that were highly contagious, such as tuberculosis
and syphilis; (3) intestinal infections that afflicted all
age groups but were likely fatal to infants and younger
children; and (4) malarial infection.
These agents of selection would operate through
differential mortality and fertility, although for some
of them the former would be more likely in that many
people would be stricken with the disease when they
were past their prime reproductive years. In that situ-
ation, selection would not be acting directly on the
reproductive success of the individual, but could have
an impact on broader measures of fitness, e.g., inclu-
sive fitness, due to the loss of support and resources
provided by postreproductive members of the society.
Differential survival in connection with the ABO
blood groups was presumed to be an increased suscep-
tibility or resistance by virtue of certain markers a
person possessed. Accordingly, it was found that indi-
viduals carrying the A antigen were more likely to
contract smallpox (Vogel and Chakravarartti, 1966),
while persons with the O blood type were at higher
risk for cholera (Glass et al., 1985). It was presumed
that these blood types were in fact more susceptible
because of pathogen similarity to their own genetic
makeup. Hence, there was a failure of their immune
system to recognize the foreign invader, likely a bacter-
ium or virus, and consequently did not initiate an
appropriate defense response that then resulted in an
227Classic Markers of Human Variation
increased mortality risk. Highly relevant supporting
evidence for this position came out of India for
its comparatively high frequency of the B allele that
could be explained by that country’s long history of
smallpox and cholera epidemics, that would render
both the A and O markers at a selective disadvantage
(Buchi, 1968). Conversely, over many generations per-
sons carrying the B antigen had a proportionately
higher survival rate that boosted the frequency of this
marker.
Population and biomedical studies of these, and
other blood group and infectious disease associations,
have yielded varying and inconsistent results uphold-
ing the immunological hypothesis to explain ABO dis-
tributions. A troubling matter is that different disease
associations have been found for the same locus, which
raises a question of what the statistical associations
actually demonstrate (Weiss, 1993). It does appear
that selection acting in this manner through infectious
disease probably does explain some of the worldwide
marker frequency distributions. It has been reported
that testing of the immunological hypothesis was dis-
continued sometime after the late 1970s (Vogel and
Motulsky, 1997). Yet, there is at least one area of
research along this line that remains very active.
During the 1950s it was shown that persons with blood
type O were more susceptible to having stomach ulcers
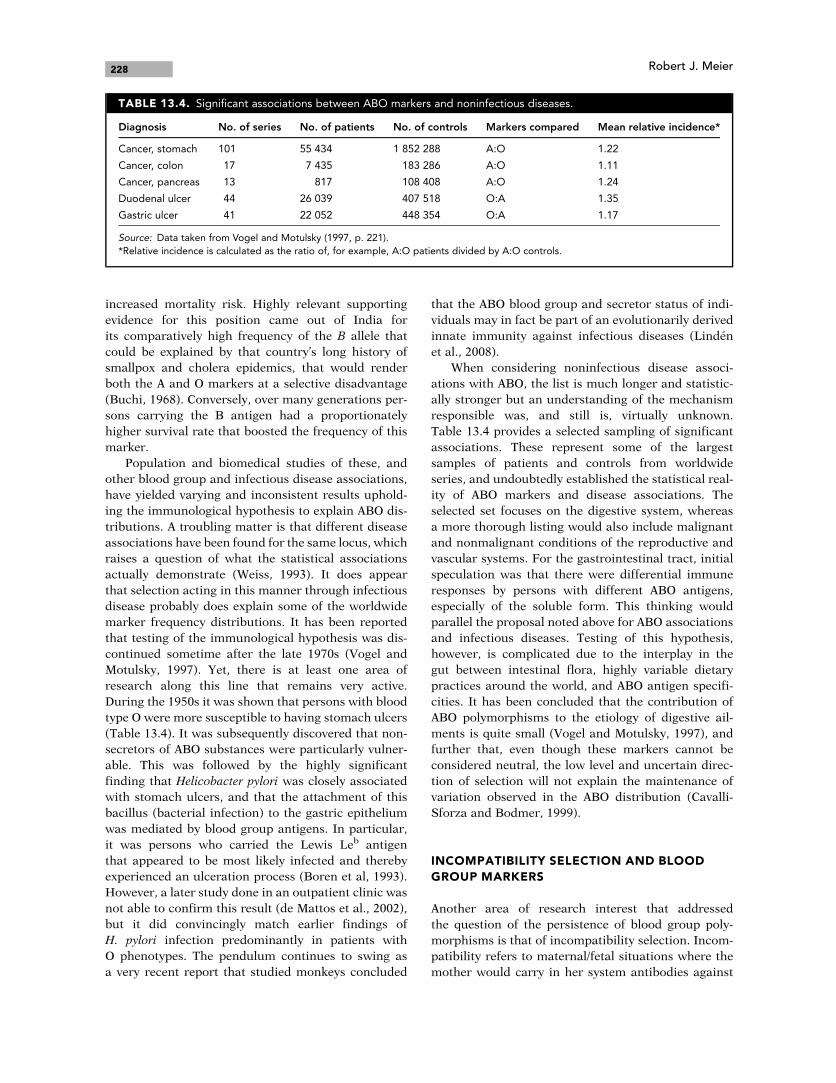
(Table 13.4). It was subsequently discovered that non-
secretors of ABO substances were particularly vulner-
able. This was followed by the highly significant
finding that Helicobacter pylori was closely associated
with stomach ulcers, and that the attachment of this
bacillus (bacterial infection) to the gastric epithelium
was mediated by blood group antigens. In particular,
it was persons who carried the Lewis Leb antigen
that appeared to be most likely infected and thereby
experienced an ulceration process (Boren et al, 1993).
However, a later study done in an outpatient clinic was
not able to confirm this result (de Mattos et al., 2002),
but it did convincingly match earlier findings of
H. pylori infection predominantly in patients with
O phenotypes. The pendulum continues to swing as
a very recent report that studied monkeys concluded
that the ABO blood group and secretor status of indi-
viduals may in fact be part of an evolutionarily derived
innate immunity against infectious diseases (Linden
et al., 2008).
When considering noninfectious disease associ-
ations with ABO, the list is much longer and statistic-
ally stronger but an understanding of the mechanism
responsible was, and still is, virtually unknown.
Table 13.4 provides a selected sampling of significant
associations. These represent some of the largest
samples of patients and controls from worldwide
series, and undoubtedly established the statistical real-
ity of ABO markers and disease associations. The
selected set focuses on the digestive system, whereas
a more thorough listing would also include malignant
and nonmalignant conditions of the reproductive and
vascular systems. For the gastrointestinal tract, initial
speculation was that there were differential immune
responses by persons with different ABO antigens,
especially of the soluble form. This thinking would
parallel the proposal noted above for ABO associations
and infectious diseases. Testing of this hypothesis,
however, is complicated due to the interplay in the
gut between intestinal flora, highly variable dietary
practices around the world, and ABO antigen specifi-
cities. It has been concluded that the contribution of
ABO polymorphisms to the etiology of digestive ail-
ments is quite small (Vogel and Motulsky, 1997), and
further that, even though these markers cannot be
considered neutral, the low level and uncertain direc-
tion of selection will not explain the maintenance of
variation observed in the ABO distribution (Cavalli-
Sforza and Bodmer, 1999).
INCOMPATIBILITY SELECTION AND BLOOD
GROUP MARKERS
Another area of research interest that addressed
the question of the persistence of blood group poly-
morphisms is that of incompatibility selection. Incom-
patibility refers to maternal/fetal situations where the
mother would carry in her system antibodies against
TABLE 13.4. Significant associations between ABO markers and noninfectious diseases.
Diagnosis No. of series No. of patients No. of controls Markers compared Mean relative incidence*
Cancer, stomach 101 55 434 1 852 288 A:O 1.22
Cancer, colon 17 7 435 183 286 A:O 1.11
Cancer, pancreas 13 817 108 408 A:O 1.24
Duodenal ulcer 44 26 039 407 518 O:A 1.35
Gastric ulcer 41 22 052 448 354 O:A 1.17
Source: Data taken from Vogel and Motulsky (1997, p. 221).
*Relative incidence is calculated as the ratio of, for example, A:O patients divided by A:O controls.
228 Robert J. Meier
red blood cell antigens found in her developing fetus.
For example in the ABO system, an O mother would be
incompatible with a fetus having an AO or BO geno-
type. It is predicted under population genetics theory
that ABO heterozygotes would be selected against,
ultimately leading to a loss of genetic variability, unless
there are counter selective forces that favor heterozy-
gote survival. What these forces are for the ABO system
is not yet known but probably do implicate the
mother’s immune system.
In the case of the Rh system, where incompatibility
is prominent in some populations, a somewhat clearer
picture has emerged. This discussion will be centered
on the Dd locus, since it was this marker that directly
caused transfusion problems that then led to the dis-
covery of the system, and later was shown to be a cause
of death of newborns in the situation of an Rh-negative
mother (dd) whose infant was Rh-positive (Dd).
The child of this incompatible Rh combination was at
risk for having erythroblastosis fetalis or hemolytic dis-
ease of the newborn (HDN) due to Rh positive anti-
bodies (the small 7S gamma G type) crossing the
placenta and into the fetus.
Not all Rh-positive children born to Rh-negative
mothers suffered from HDN. The explanation involves
several mitigating circumstances. First of all, Rh anti-
bodies are not naturally occurring, an Rh-negative
mother has to be exposed to Rh antigens in order to
stimulate her system to produce antibodies. This could
have come through an improper blood transfusion, or
much more likely, through carrying an incompatible
fetus. Some of the fetus’ red blood cells can enter the
mother’s system at the time of delivery, and thereby
be present to stimulate her to later form antibodies.
Obviously, an initial fetus is not affected because the
mother has not yet been “immunized” or sensitized
prior to the baby’s birth. Subsequent incompatible con-
ceptions increase the risk for HDN as the mother’s
antibody titer is raised. There appears to be some vari-
ation in women as to how many pregnancies are req-
uired to build antibody strength to the point of causing
HDN. For some time now medical intervention has
protected mothers from having HDN babies through
the administration of a prepared antiserum that des-
troys any fetal blood cells that might have entered the
mother’s circulation during an incompatible pregn-
ancy with the result that she is not sensitized. On rarer
occasions, treatment has been in the form of exchange
transfusions done either on the fetus or newborn. Prior
to medical advancement severe HDN was often fatal,
and obviously a source of much personal grief.
In the scientific realm a different kind of concern
was brought out by the observation that the frequency
of Rh-negative allele d was substantially higher than
expected since all HDN children who were selected
against were heterozygote Dd. This should mean that
by losing D and d alleles equally, over time the rarer of
the two eventually would be lost, and it was clear from
many surveys the d allele was consistently at a lower
frequency. On the other hand, surveys also showed that
not only was the d allele not close to being selected out
or anywhere near to a recurrent mutation rate, it
seemed to be maintained at a much higher frequency
than a simple selection against the heterozygote model
would predict. There had to be circumstances that
were countering selection.
Two of these circumstances were noted above in
that the first-born children of Rh incompatibility are
not affected and that later developing fetus’ may not
necessarily have HDN depending upon the state of
sensitivity or antibody titer of the mother. Added to
these is the segregation outcome of fathers who are
either DD or Dd, and of course the latter have a 50%
probability have contributing a d allele and thus a
compatible Rh-negative child. There is also some evi-
dence that parents who lost a child to HDN tended
to over-compensate their loss by producing more
homozygote dd children, thus increasing the d allele
frequency. There is a final explanation for why the d
allele is elevated beyond model prediction that interest-
ingly involved mothers who had a double incompati-
bility with their fetus’ for both Rh and ABO systems.
Maternal/fetal incompatibility in the ABO system
does result in HDN, but this occurs in a small percent-
age of overall potential circumstances. In another por-
tion of the ABO incompatible cases, say with an
O mother and an A fetus, as the baby’s red blood cells
enter her system they are quickly destroyed by her
normally present anti-A antibody. If the blood cells
also happen to carry the Rh-positive antigen and hence
are Rh incompatible, then the cells are destroyed
before there is time for the mother to build Rh anti-
body. In effect, double incompatibility serves to protect
subsequent fetuses from HDN, and, of course, it would
help to maintain a higher d allele frequency.
HLA AND DISEASE ASSOCIATIONS
From the early 1960s onward there has been increasing
anthropological interest in the application of the HLA
polymorphisms to investigating population relation-
ships and to the study of microevolutionary processes,
particularly selection. The HLA system has turned out
to be highly useful in both regards. Certainly it is the
most polymorphic system, and discovery of new alleles
is still occurring. In Roychoudhury and Nei (1988)
population data were compiled for 5 HLA loci and a
total of 89 alleles. Updating of HLA polymorphisms
can be found at an online website – IMGT/HLA Data-
base –that currently reports nearly 2300 alleles for what
is now known as Class I HLA alleles. Even going back
229Classic Markers of Human Variation
to the late 1980s, allelic variation was high both within
and between sampled regions. For example, the B7
allele ranged from 0.066 to 0.144 in several European
countries, 0.031 to 0.060 in Asian populations, and
an African sample yielded a frequency of 0.115
(Roychoudhury and Nei, 1988). Much of the variation
in HLA polymorphisms can be ascribed to populations
that had undergone random drift and to population
movements and resultant gene flow. With regard to
selection, an early and striking association was found
between B27 allele and ankylosing spondylitis (AS) in a
British study. It is now known that a vast majority of
persons who have AS (which causes inflammation of
the spine and other arthritic symptoms) possess the
B27 marker. However, the marker frequency varies
across ethnic groups, and indeed AS can also occur
even when the B27 marker is absent. Ankylosing spon-
dylitis is part of a group of autoimmune diseases,
where the body’s immune system fails and then makes
antibodies against itself.
The B27 marker, along with numerous other HLA
alleles, probably predispose their hosts to autoimmune
reactions as well as to infectious diseases at times as a
single allele but often in combination with other alleles
in the form of haplotypes. HLA haplotypes provide a
clear example of linkage disequilibrium due to selec-
tion. In one study, haplotype A1 B8 DR3 was present in
nearly all hemophilic patients who showed a rapid
course of developing AIDS after they were inadvert-
ently treated with contaminated blood (Steel et al,
1988). Later research with HLA polymorphisms con-
tinued to find important marker associations with both
susceptibility to and protection against disease, as will
be referenced in the final section of the chapter.
SICKLE CELL LOCUS AND MALARIAL
RESISTANCE
The marker that probably garnered the greatest
amount of attention from anthropologists in the
1960s was a hemoglobin variant, HbS, the sickle cell
allele.HbS is a point mutation that results from a single
nucleotide substitution on the b-chain from the normal
adult hemoglobin structure coded by the HbA allele.
This mutation leads to one amino acid change in the
hemoglobin molecule. There are a number of such
variants classed as hemoglobinapathies, and two of
these, HbC and HbE, will be discussed later.
Persons who are homozygote HbS/HbS episodically
manifest sicklemia or sickle cell anemia due to mul-
tiple cascading effects of crescent-shaped red blood
cells that are prone to hemolysis and also prevent
blood from freely flowing through capillary beds.
In the absence of medical attention, severe attacks are
generally fatal.
Given this unfortunate outcome, it would be pre-
dicted that the HbS marker should decline in frequency
ultimately to the level of a recurrent mutation rate
at the locus. However, in endemic malarial regions
of Africa it was proposed that there were counter-
selection forces that were helping to maintain the HbS
allele frequency in the population when it was com-
bined with the normal HbA allele. Balancing
selection operated against both classes of homozy-
gotes, the HbS/HbS (from sickle cell anemia) and HbA/
HbA (from malaria), and there was selection for the
heterozygote HbA/HbS (protection from malarial
morbidity).
The malarial parasite Plasmodium falciparum,
carried by Anopheles mosquitoes, does not find a hos-
pitable cellular environment in the heterozygote to
complete it normal life cycle. This heterozygote advan-
tage (also called overdominance) meant that both HbA
and HbS alleles were being maintained at the same
time that they were being selected out, a process that
could lead to an equilibrium state, or balanced poly-
morphism. The alleles would be equal to each other in
frequency only if selection against each class of homo-
zygotes was at the same level, which it is not. Selection
is much more severe against HbS/HbS than it is against
HbA/HbA, so an equilibrium gene frequency would
occur with the HbA allele proportionately much higher.
This can be shown through the aid of some basic popu-
lation genetics using the concept of relative fitness.
Relative reproductive fitness (w) is calculated with
respect to specified genotypes HbA/HbA (AA), HbA/HbS
(AS), and HbS/HbS (SS) and their expected frequencies,
if there was Hardy–Weinberg Equilibrium at the hemo-
globin locus. For a quick review, Hardy–Weinberg
Equilibrium of genotypic frequencies depends on there
being random mating at the locus in question and
there being no evolution occurring at this locus.
A further theoretical condition is that the population
being studied be infinitely large. In spite of this last
never-to-be-realized requirement, the Hardy–Weinberg
Equilibrium was regularly found at a number of blood
group loci, but not for the sickle cell locus due mainly
to the action of selection.
Relative fitness for sickle cell-locus genotypes was
calculated by Allison (1956) who derived his data from
a number of African populations. He set the heterozy-
gote fitness at wAS ¼ 1.00 (which would make it rela-
tively the most fit), and found that fitness for one
homozygote was approximately wAA ¼ 0.80 and for
the other it was wSS ¼ 0.20. These values would trans-
late into a 20% reduction in fertility for HbA/HbA
parents and an 80% drop in fertility for HbS/HbS
parents. Again through an application of population
genetics calculations, over time it would be expected
that the frequency of the HbS allele would decrease
until it reached an equilibrium of about 0.20. Since
230 Robert J. Meier
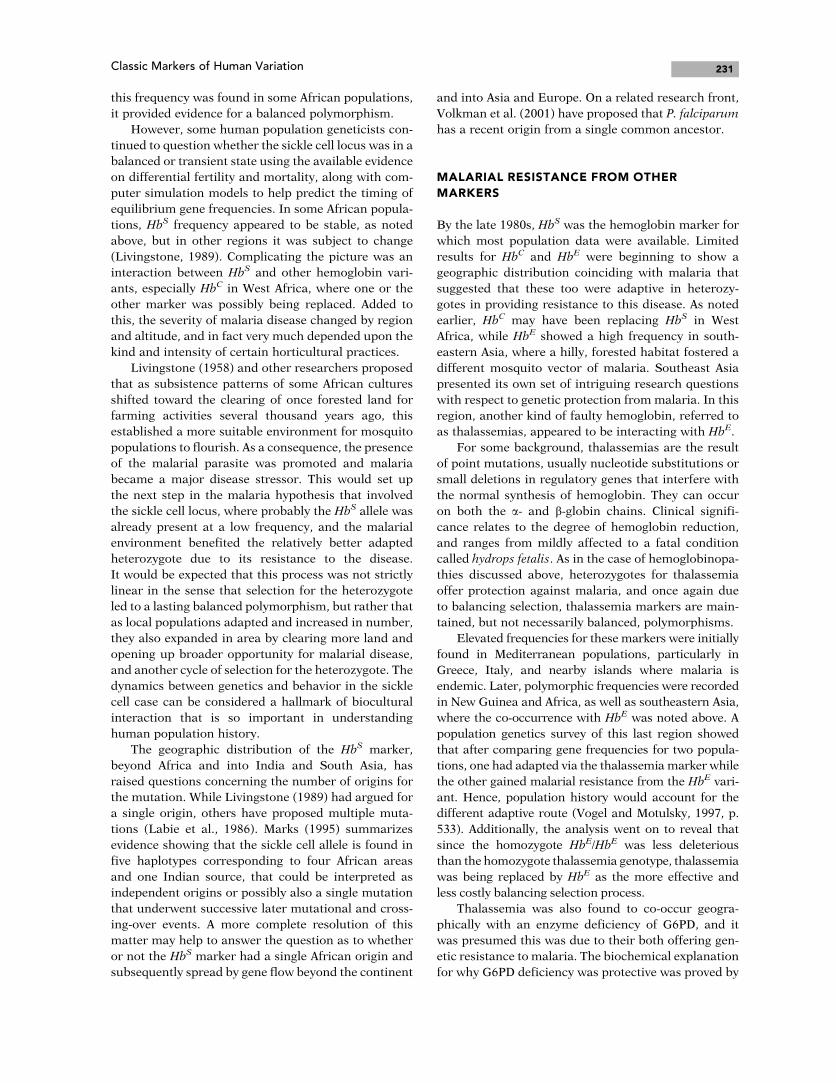
this frequency was found in some African populations,
it provided evidence for a balanced polymorphism.
However, some human population geneticists con-
tinued to question whether the sickle cell locus was in a
balanced or transient state using the available evidence
on differential fertility and mortality, along with com-
puter simulation models to help predict the timing of
equilibrium gene frequencies. In some African popula-
tions, HbS frequency appeared to be stable, as noted
above, but in other regions it was subject to change
(Livingstone, 1989). Complicating the picture was an
interaction between HbS and other hemoglobin vari-
ants, especially HbC in West Africa, where one or the
other marker was possibly being replaced. Added to
this, the severity of malaria disease changed by region
and altitude, and in fact very much depended upon the
kind and intensity of certain horticultural practices.
Livingstone (1958) and other researchers proposed
that as subsistence patterns of some African cultures
shifted toward the clearing of once forested land for
farming activities several thousand years ago, this
established a more suitable environment for mosquito
populations to flourish. As a consequence, the presence
of the malarial parasite was promoted and malaria
became a major disease stressor. This would set up
the next step in the malaria hypothesis that involved
the sickle cell locus, where probably the HbS allele was
already present at a low frequency, and the malarial
environment benefited the relatively better adapted
heterozygote due to its resistance to the disease.
It would be expected that this process was not strictly
linear in the sense that selection for the heterozygote
led to a lasting balanced polymorphism, but rather that
as local populations adapted and increased in number,
they also expanded in area by clearing more land and
opening up broader opportunity for malarial disease,
and another cycle of selection for the heterozygote. The
dynamics between genetics and behavior in the sickle
cell case can be considered a hallmark of biocultural
interaction that is so important in understanding
human population history.
The geographic distribution of the HbS marker,
beyond Africa and into India and South Asia, has
raised questions concerning the number of origins for
the mutation. While Livingstone (1989) had argued for
a single origin, others have proposed multiple muta-
tions (Labie et al., 1986). Marks (1995) summarizes
evidence showing that the sickle cell allele is found in
five haplotypes corresponding to four African areas
and one Indian source, that could be interpreted as
independent origins or possibly also a single mutation
that underwent successive later mutational and cross-
ing-over events. A more complete resolution of this
matter may help to answer the question as to whether
or not the HbS marker had a single African origin and
subsequently spread by gene flow beyond the continent
and into Asia and Europe. On a related research front,
Volkman et al. (2001) have proposed that P. falciparum
has a recent origin from a single common ancestor.
MALARIAL RESISTANCE FROM OTHER
MARKERS
By the late 1980s, HbS was the hemoglobin marker for
which most population data were available. Limited
results for HbC and HbE were beginning to show a
geographic distribution coinciding with malaria that
suggested that these too were adaptive in heterozy-
gotes in providing resistance to this disease. As noted
earlier, HbC may have been replacing HbS in West
Africa, while HbE showed a high frequency in south-
eastern Asia, where a hilly, forested habitat fostered a
different mosquito vector of malaria. Southeast Asia
presented its own set of intriguing research questions
with respect to genetic protection from malaria. In this
region, another kind of faulty hemoglobin, referred to
as thalassemias, appeared to be interacting with HbE.
For some background, thalassemias are the result
of point mutations, usually nucleotide substitutions or
small deletions in regulatory genes that interfere with
the normal synthesis of hemoglobin. They can occur
on both the a- and b-globin chains. Clinical signifi-
cance relates to the degree of hemoglobin reduction,
and ranges from mildly affected to a fatal condition
called hydrops fetalis. As in the case of hemoglobinopa-
thies discussed above, heterozygotes for thalassemia
offer protection against malaria, and once again due
to balancing selection, thalassemia markers are main-
tained, but not necessarily balanced, polymorphisms.
Elevated frequencies for these markers were initially
found in Mediterranean populations, particularly in
Greece, Italy, and nearby islands where malaria is
endemic. Later, polymorphic frequencies were recorded
in New Guinea and Africa, as well as southeastern Asia,
where the co-occurrence with HbE was noted above. A
population genetics survey of this last region showed
that after comparing gene frequencies for two popula-
tions, one had adapted via the thalassemia marker while
the other gained malarial resistance from the HbE vari-
ant. Hence, population history would account for the
different adaptive route (Vogel and Motulsky, 1997, p.
533). Additionally, the analysis went on to reveal that
since the homozygote HbE/HbE was less deleterious
than the homozygote thalassemia genotype, thalassemia
was being replaced by HbE as the more effective and
less costly balancing selection process.
Thalassemia was also found to co-occur geogra-
phically with an enzyme deficiency of G6PD, and it
was presumed this was due to their both offering gen-
etic resistance to malaria. The biochemical explanation
for why G6PD deficiency was protective was proved by
231Classic Markers of Human Variation
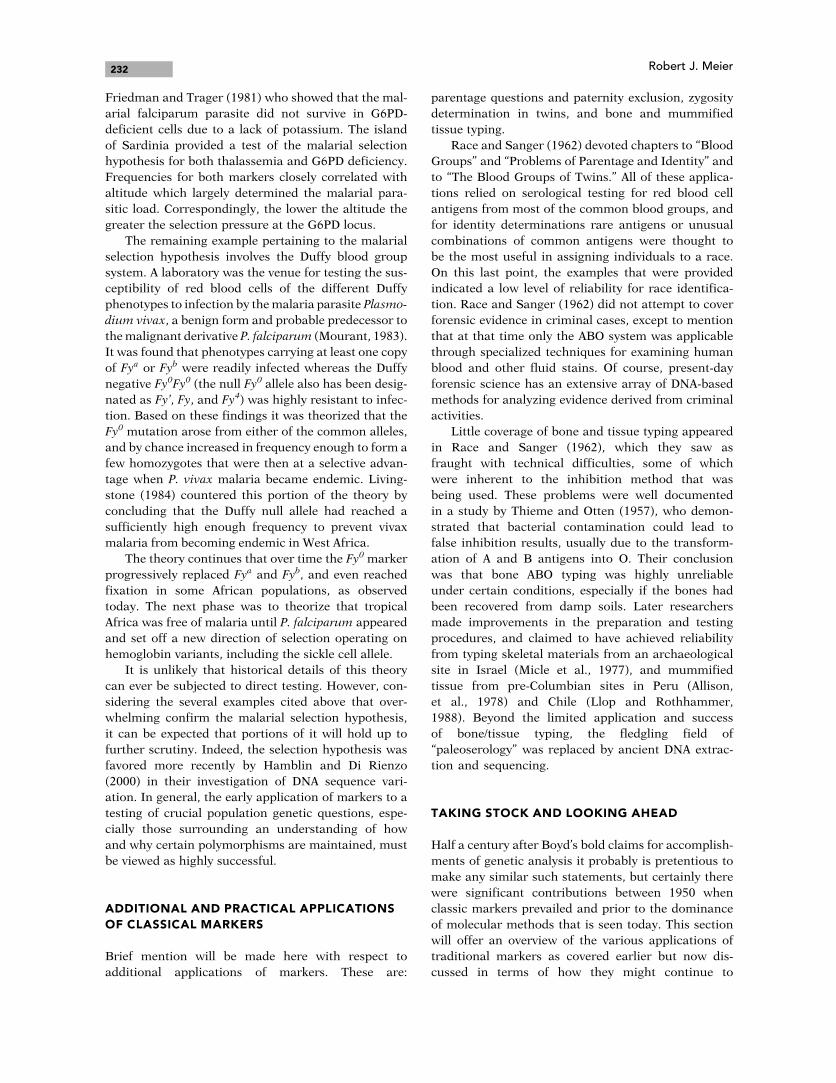
Friedman and Trager (1981) who showed that the mal-
arial falciparum parasite did not survive in G6PD-
deficient cells due to a lack of potassium. The island
of Sardinia provided a test of the malarial selection
hypothesis for both thalassemia and G6PD deficiency.
Frequencies for both markers closely correlated with
altitude which largely determined the malarial para-
sitic load. Correspondingly, the lower the altitude the
greater the selection pressure at the G6PD locus.
The remaining example pertaining to the malarial
selection hypothesis involves the Duffy blood group
system. A laboratory was the venue for testing the sus-
ceptibility of red blood cells of the different Duffy
phenotypes to infection by themalaria parasite Plasmo-
dium vivax, a benign form and probable predecessor to
themalignant derivative P. falciparum (Mourant, 1983).
It was found that phenotypes carrying at least one copy
of Fya or Fyb were readily infected whereas the Duffy
negative Fy0Fy0 (the null Fy0 allele also has been desig-
nated as Fy’, Fy, and Fy4) was highly resistant to infec-
tion. Based on these findings it was theorized that the
Fy0 mutation arose from either of the common alleles,
and by chance increased in frequency enough to form a
few homozygotes that were then at a selective advan-
tage when P. vivax malaria became endemic. Living-
stone (1984) countered this portion of the theory by
concluding that the Duffy null allele had reached a
sufficiently high enough frequency to prevent vivax
malaria from becoming endemic in West Africa.
The theory continues that over time the Fy0 marker
progressively replaced Fya and Fyb, and even reached
fixation in some African populations, as observed
today. The next phase was to theorize that tropical
Africa was free of malaria until P. falciparum appeared
and set off a new direction of selection operating on
hemoglobin variants, including the sickle cell allele.
It is unlikely that historical details of this theory
can ever be subjected to direct testing. However, con-
sidering the several examples cited above that over-
whelming confirm the malarial selection hypothesis,
it can be expected that portions of it will hold up to
further scrutiny. Indeed, the selection hypothesis was
favored more recently by Hamblin and Di Rienzo
(2000) in their investigation of DNA sequence vari-
ation. In general, the early application of markers to a
testing of crucial population genetic questions, espe-
cially those surrounding an understanding of how
and why certain polymorphisms are maintained, must
be viewed as highly successful.
ADDITIONAL AND PRACTICAL APPLICATIONS
OF CLASSICAL MARKERS
Brief mention will be made here with respect to
additional applications of markers. These are:
parentage questions and paternity exclusion, zygosity
determination in twins, and bone and mummified
tissue typing.
Race and Sanger (1962) devoted chapters to “Blood
Groups” and “Problems of Parentage and Identity” and
to “The Blood Groups of Twins.” All of these applica-
tions relied on serological testing for red blood cell
antigens from most of the common blood groups, and
for identity determinations rare antigens or unusual
combinations of common antigens were thought to
be the most useful in assigning individuals to a race.
On this last point, the examples that were provided
indicated a low level of reliability for race identifica-
tion. Race and Sanger (1962) did not attempt to cover
forensic evidence in criminal cases, except to mention
that at that time only the ABO system was applicable
through specialized techniques for examining human
blood and other fluid stains. Of course, present-day
forensic science has an extensive array of DNA-based
methods for analyzing evidence derived from criminal
activities.
Little coverage of bone and tissue typing appeared
in Race and Sanger (1962), which they saw as
fraught with technical difficulties, some of which
were inherent to the inhibition method that was
being used. These problems were well documented
in a study by Thieme and Otten (1957), who demon-
strated that bacterial contamination could lead to
false inhibition results, usually due to the transform-
ation of A and B antigens into O. Their conclusion
was that bone ABO typing was highly unreliable
under certain conditions, especially if the bones had
been recovered from damp soils. Later researchers
made improvements in the preparation and testing
procedures, and claimed to have achieved reliability
from typing skeletal materials from an archaeological
site in Israel (Micle et al., 1977), and mummified
tissue from pre-Columbian sites in Peru (Allison,
et al., 1978) and Chile (Llop and Rothhammer,
1988). Beyond the limited application and success
of bone/tissue typing, the fledgling field of
“paleoserology” was replaced by ancient DNA extrac-
tion and sequencing.
TAKING STOCK AND LOOKING AHEAD
Half a century after Boyd’s bold claims for accomplish-
ments of genetic analysis it probably is pretentious to
make any similar such statements, but certainly there
were significant contributions between 1950 when
classic markers prevailed and prior to the dominance
of molecular methods that is seen today. This section
will offer an overview of the various applications of
traditional markers as covered earlier but now dis-
cussed in terms of how they might continue to
232 Robert J. Meier
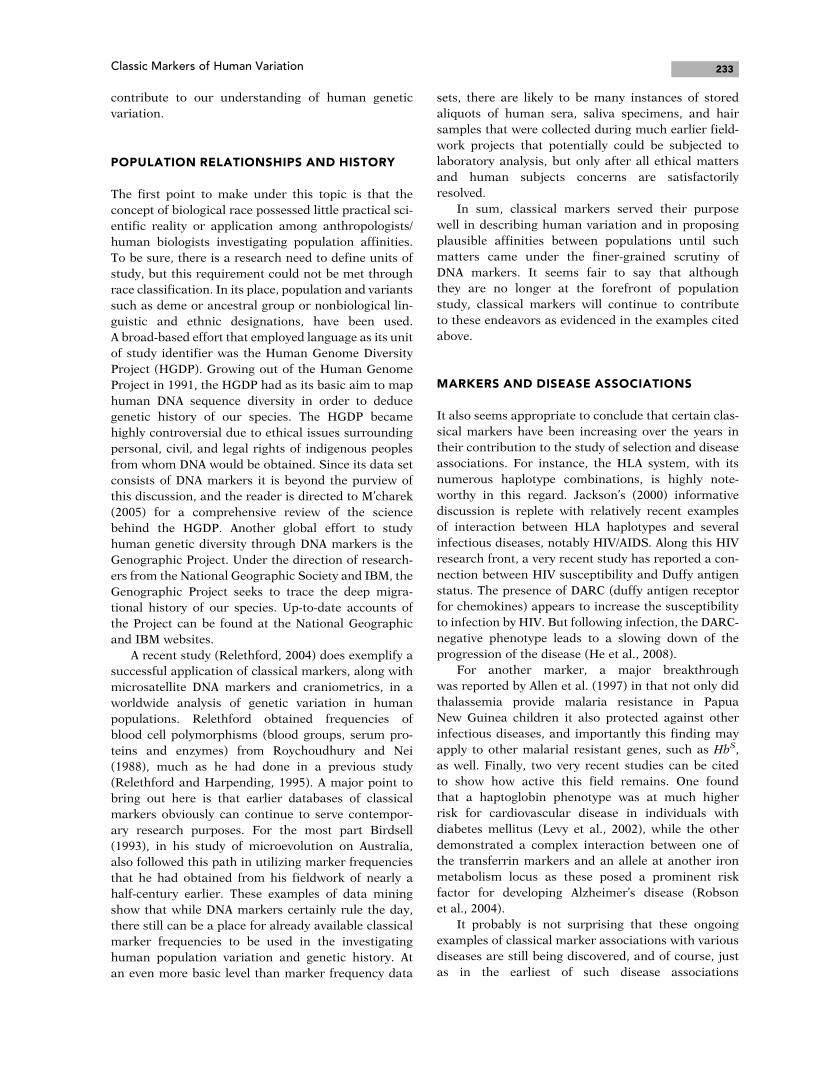
contribute to our understanding of human genetic
variation.
POPULATION RELATIONSHIPS AND HISTORY
The first point to make under this topic is that the
concept of biological race possessed little practical sci-
entific reality or application among anthropologists/
human biologists investigating population affinities.
To be sure, there is a research need to define units of
study, but this requirement could not be met through
race classification. In its place, population and variants
such as deme or ancestral group or nonbiological lin-
guistic and ethnic designations, have been used.
A broad-based effort that employed language as its unit
of study identifier was the Human Genome Diversity
Project (HGDP). Growing out of the Human Genome
Project in 1991, the HGDP had as its basic aim to map
human DNA sequence diversity in order to deduce
genetic history of our species. The HGDP became
highly controversial due to ethical issues surrounding
personal, civil, and legal rights of indigenous peoples
from whom DNA would be obtained. Since its data set
consists of DNA markers it is beyond the purview of
this discussion, and the reader is directed to M’charek
(2005) for a comprehensive review of the science
behind the HGDP. Another global effort to study
human genetic diversity through DNA markers is the
Genographic Project. Under the direction of research-
ers from the National Geographic Society and IBM, the
Genographic Project seeks to trace the deep migra-
tional history of our species. Up-to-date accounts of
the Project can be found at the National Geographic
and IBM websites.
A recent study (Relethford, 2004) does exemplify a
successful application of classical markers, along with
microsatellite DNA markers and craniometrics, in a
worldwide analysis of genetic variation in human
populations. Relethford obtained frequencies of
blood cell polymorphisms (blood groups, serum pro-
teins and enzymes) from Roychoudhury and Nei
(1988), much as he had done in a previous study
(Relethford and Harpending, 1995). A major point to
bring out here is that earlier databases of classical
markers obviously can continue to serve contempor-
ary research purposes. For the most part Birdsell
(1993), in his study of microevolution on Australia,
also followed this path in utilizing marker frequencies
that he had obtained from his fieldwork of nearly a
half-century earlier. These examples of data mining
show that while DNA markers certainly rule the day,
there still can be a place for already available classical
marker frequencies to be used in the investigating
human population variation and genetic history. At
an even more basic level than marker frequency data
sets, there are likely to be many instances of stored
aliquots of human sera, saliva specimens, and hair
samples that were collected during much earlier field-
work projects that potentially could be subjected to
laboratory analysis, but only after all ethical matters
and human subjects concerns are satisfactorily
resolved.
In sum, classical markers served their purpose
well in describing human variation and in proposing
plausible affinities between populations until such
matters came under the finer-grained scrutiny of
DNA markers. It seems fair to say that although
they are no longer at the forefront of population
study, classical markers will continue to contribute
to these endeavors as evidenced in the examples cited
above.
MARKERS AND DISEASE ASSOCIATIONS
It also seems appropriate to conclude that certain clas-
sical markers have been increasing over the years in
their contribution to the study of selection and disease
associations. For instance, the HLA system, with its
numerous haplotype combinations, is highly note-
worthy in this regard. Jackson’s (2000) informative
discussion is replete with relatively recent examples
of interaction between HLA haplotypes and several
infectious diseases, notably HIV/AIDS. Along this HIV
research front, a very recent study has reported a con-
nection between HIV susceptibility and Duffy antigen
status. The presence of DARC (duffy antigen receptor
for chemokines) appears to increase the susceptibility
to infection by HIV. But following infection, the DARC-
negative phenotype leads to a slowing down of the
progression of the disease (He et al., 2008).
For another marker, a major breakthrough
was reported by Allen et al. (1997) in that not only did
thalassemia provide malaria resistance in Papua
New Guinea children it also protected against other
infectious diseases, and importantly this finding may
apply to other malarial resistant genes, such as HbS,
as well. Finally, two very recent studies can be cited
to show how active this field remains. One found
that a haptoglobin phenotype was at much higher
risk for cardiovascular disease in individuals with
diabetes mellitus (Levy et al., 2002), while the other
demonstrated a complex interaction between one of
the transferrin markers and an allele at another iron
metabolism locus as these posed a prominent risk
factor for developing Alzheimer’s disease (Robson
et al., 2004).
It probably is not surprising that these ongoing
examples of classical marker associations with various
diseases are still being discovered, and of course, just
as in the earliest of such disease associations
233Classic Markers of Human Variation
discovered decades ago, they are subject to further
confirmation. There is every reason to predict that this
area of research will continue to be a fruitful endeavor
to pursue.
DISCUSSION POINTS
1. Which classical markers continue to be most useful
in studying human variation and/or disease
associations?
2. Discuss the pros and cons of Boyd’s classification
of human races based on blood groups.
3. What are the ways in which variation can be main-
tained at a polymorphic locus?
4. On what theoretical grounds can different meas-
ures of population distance (including genetic,
anthropometric, odontometric, dermatoglyphic,
linguistic, geographic) be expected to correspond
to or, conversely, to not agree with one another?
5. Discuss the evidence for and against the malarial
hypothesis regarding the frequency distributions of
hemoglobin variants, transferrins, G6PD, and
Duffy markers. Include in this discussion the role
of cultural activities related to subsistence patterns.
6. What are the underlying reasons that classical mark-
ers can be expected to be associated with diseases?
REFERENCES
Allen, S. J., O’Donnell, A., Alexander, N. D. E., et al. (1997).
aþ-Thalassemia protects children against disease caused
by other infections as well as malaria. Proceedings of
the National Academy of Sciences of the United States of
America, 94, 14736–14741.
Allison, A. C. (1956). The sickle and hemoglobin C-genes
in some African populations. Annals of Human Genetics,
21, 67–89.
Allison, M. J. J., Hossaini, A. A., Munizaga, J., et al. (1978).
ABO blood groups in Chilean and Peruvian Mummies.
American Journal of Physical Anthropology, 49,139–142.
Baker, P. T. and Little, M. A. (1976). Man in the Andes: a
Multidisciplinary Study of High-Altitude Quechua. Strouds-
burg, PA: Dowden, Hutchinson, and Ross.
Bernstein, F. (1924). Ergebnisse einer biostatischen zusam-
menfassenden betrachtung uber die erblichen blutstrucke-
ren des Menschen. Klinische Wochenschrift, 3, 1495–1497.
Birdsell, J. B. (1993). Microevolutionary Patterns in Abori-
ginal Australia. New York: Oxford University Press.
Boas, F. (1912). Changes in bodily form of descendents of
immigrants. American Anthropologist, 14, 530–562.
Boren, T., Falk, P., Roth, K. A., et al. (1993). Attachment of
Helicobactor pylori to human gastric epithelium mediated
by blood group antigens. Science, 262, 1892–1895.
Boyd, W. C. (1950). Genetics and the Races of Man: an Intro-
duction to Modern Physical Anthropology. Boston: Little,
Brown, and Company.
Boyd, W. C. (1963a). Genetics and the human race. Science,
140, 1057–1064.
Boyd, W. C. (1963b). Four achievements of the genetical
method in physical anthropology. American Anthropolo-
gist, 65, 243–252.
Brace, C. L. (2005). “Race” Is A Four-Letter Word. Oxford:
Oxford University Press.
Buchi, E. C. (1968). Somatic groups composing the modern
populations of India. In Proceedings of Eighth Inter-
national Congress of Anthropological and Ethnological
Sciences. Tokyo: Science Council of Japan, pp. 154–162
Buettner-Janusch, J. (1966).Origins of Man. Physical Anthro-
pology. New York: John Wiley and Sons.
Cavalli-Sforza, L. L. and Bodmer, W. F. (1999). The Genetics
of Human Populations. Mineola, NY: Dover Publications.
Cavalli-Sforza, L. L., Menozzi, P. and Piazza, A. (1994).
The History and Geography of Human Genes. Princeton:
Princeton University Press.
Chakravarti, A. and Chakraborty, R. (1978). Elevated fre-
quency of Tay–Sachs disease among Ashkenazic Jews
unlikely by genetic drift alone. American Journal of
Human Genetics, 30, 256–261.
Chown, B. and Lewis, M. (1953). The ABO, MNSs, P, Rh,
Lutheran, Kell, Lewis, Duffy and Kidd blood groups and
the secretor status of the Blackfoot Indians of Alberta,
Canada. American Journal of Physical Anthropology,
11, 369–383.
Crawford, M. H. (1973). The use of genetic markers of
the blood in the study of the evolution of human pop-
ulations. In Methods and Theories of Anthropological
Genetics, M. H. Crawford and P. L. Workman (eds).
Albuquerque, NM: University of New Mexico Press,
pp. 19–38.
Crawford, M. H. (ed.) (1984). Current Developments in
Anthropological Genetics, vol. 3. Black Caribs. A Case Study
in Biocultural Adaptation. New York: Plenum Press.
Crawford, M. H. (ed.) (2007). Anthropological Genetics:
Theory, Methods and Applications. New York: Cambridge
University Press.
Crawford, M. H. and Mielke, J. H. (ed.) (1982). Current
Developments in Anthropological Genetics, vol. 2.
New York: Plenum Press.
Crawford, M. H. and Workman, P. L. (ed.) (1973). Methods
and Theories of Anthropological Genetics. Albuquerque,
NM: University of New Mexico Press.
Crawford, M. H., Leyshon, W. C., Brown, K., et al. (1974).
Human Biology in Mexico, part 2: a comparison of blood
group, serum, and red cell enzyme frequencies, and genetic
distances of the Indian populations of Mexico. American
Journal of Physical Anthropology, 41, 251–268.
De Mattos, L. C., Cintra, J. R., Sanches, F. E., et al. (2002).
ABO, Lewis, secretor and non-secretor phenotypes in
patients infected or uninfected by the Helicobacter pylori
bacillus. Sao Paulo Medical Journal, 120(2), doi: 10.1590/
S1516–31802002000200006.
Drayna, D., Coon, H., Kim, U. K., et al. (2003). Genetic
analysis of a complex trait in the Utah Genetic Reference
Project: a major locus for PTC taste ability on chromo-
some 7q and a secondary locus on chromosome 16p.
Human Genetics, 112, 567–572.
234 Robert J. Meier
Duggleby, C. R. (1978). Blood group antigens and the popu-
lation genetics of Macaca mulatta on Cayo Santiago.
American Journal of Physical Anthropology, 48, 35–40.
Eaton, J.W. andGavan, J. A. (1965). Sensitivity toP-T-C among
primates. American Journal of Physical Anthropology, 23,
381–388.
Eaton, J. W., Brandt, P., Mahoney, J. R., et al. (1982). Hap-
toglobin: a natural bacteriostat. Science, 215, 691–693.
Etcheverry, R. (1967). Blood groups in natives of Easter
Island. Nature, 216, 690–691.
Fraikor, A. L. (1977). Tay–Sachs disease: genetic drift among
the Ashkenazi Jews. Social Biology, 24(2), 117–134.
Friedlaender, J. S. (1975). Patterns of Human Variation: the
Demography, Genetics, and Phenetics of Bougainville
Islanders. Cambridge, MA: Harvard University Press.
Friedlaender, J. S. (ed.) (1987). The Solomon Islands Project.
Oxford: Clarendon Press.
Friedman, M. J. and Trager, W. (1981). The biochemistry of
resistance tomalaria. Scientific American, 244(3),154–164.
Frisch, A., Colombo, R., Michaelovsky, E., et al. (2004).
Origin and spread of the 1278insTATC mutation causing
Tay–Sachs disease in Ashkenazi Jews: genetic drift as a
robust and parsimonious hypothesis. Human Genetics,
114, 366–376.
Giblett, E. R. (1969). Genetic Markers in Human Blood.
Oxford: Blackwell Scientific Publications.
Glass, R. I., Holmgren, J., Haley, C. E., et al. (1985). Predis-
position for cholera of individuals with O blood group:
possible evolutionary significance. American Journal of
Epidemiology, 121: 791–796.
Greenberg, J. H., Turner, C. G. and Zegura, S. L. (1986). The
settlement of the Americas: a comparison of the linguistic,
dental and genetic evidence. Current Anthropology, 27,
477–497.
Hamblin, M. T. and Di Rienzo, A (2000). Detection of the
signature of natural selection in humans: evidence from
the Duffy blood group locus. American Journal of Human
Genetics, 66, 1669–1679.
Harper, P. S. and Sunderland, E. (1986). Genetic and Popu-
lation Studies in Wales. Cardiff: University of Wales Press.
Harris, H. (1980). The Principles of Human Biochemical
Genetics, 3rd edn. Amsterdam: Elsevier/North-Holland
Biomedical Press.
He, W., Neil, S., Kukarni, H., et al. (2008). Duffy antigen
receptor for chemokines mediates trans-infection of
HIV-1 from red blood cells to target cells and affects
HIV-AIDS susceptibility. Cell Host and Microbe, 4, 52–62.
Hirschfeld, J. (1959). Immuno-electrophoretic demonstra-
tion of qualitative differences in human sera and their
relation to the haptoglobins. Acta Pathologica et Microbio-
logica Scandinavica, 47, 160–168.
Hirschfeld, L. and Hirschfeld, H. (1919). Serological differen-
ces between theblood of different races.Lancet,18, 675–679.
Jackson, F. L. C. (2000). Human adaptations to infectious
disease. In Human Biology. An Evolutionary and Biocul-
tural Perspective, S. Stinson, B. Bogin, R. Huss-Ashmore
et al (eds). New York: Wiley-Liss, pp. 273–293.
Jamison, P. L., Zegura, S. L. and Milan, F. A. (1978).
Eskimos of Northwestern Alaska: a Biological Perspective.
Stroudsburg, PA: Dowden, Hutchinson, and Ross.
Jenkins, T., Harpending, H. and Nurse, G. T. (1978). Genetic
distances among certain Southern African populations.
In Evolutionary Models and Studies in Human Diversity,
R. J. Meier, C. M. Otten and F. Abdel-Hameed (eds). The
Hague: Mouton Publishers, pp. 227–243.
Labie, D., Pagnier, J., Wajcman, H., et al. (1986). The genetic
origin of the variability of the phenotypic expression of
the Hb S gene. In Genetic Variation and its Maintenance,
D. F. Roberts and G. F. DeStefano (eds). Cambridge:
Cambridge University Press, pp. 149–156.
Landsteiner, K. (1901). Uber agglutinationserscheinungen
normalen menschlichen blutes. Wiener Klinische
Wochenschrift, 14, 1132–1134.
Lasker, G. W. (1946). Migration and physical differenti-
ation. American Journal of Physical Anthropology, 4,
273–300.
Lefevre-Witier, P. and Verges, H. (1978). Genetic structure
of Ideles. In Evolutionary Models and Studies in Human
Diversity, R. J. Meier, C. M. Otten and F. Abdel-Hameed
(eds). The Hague: Mouton Publishers, pp. 255–277.
Levy, A. P., Hochberg, I., Jablonski, K., et al. (2002). Hapto-
globin phenotype is an independent risk factor for cardio-
vascular disease in individuals with diabetes: the strong
heart study. Journal of the American College of Cardiology,
40, 1984–1990.
Linden, S., Mahdavi, J., Semino-Mora, C., et al. (2008).
Role of ABO secretor status in mucosal innate immunity
and H. pylori infection. PLoS Pathogens 4(1), e2.
Livingstone, F. B. (1958). Anthropological implications of
sickle cell gene distribution in West Africa. American
Anthropologist, 60, 533–562.
Livingstone, F. B. (1984). The Duffy blood groups, vivax
malaria, and malaria selection in human populations.
Human Biology, 56, 413–425.
Livingstone, F. B. (1985). Frequencies of Hemoglobin Vari-
ants. New York: Oxford University Press.
Livingstone, F. B. (1989). Who gave whom hemoglobin S:
the use of restriction site haplotype variation for the inter-
pretation of the evolution of the bs-globin gene. American
Journal of Human Biology, 1, 289–302.
Livingstone, F. B., Gershowitz, H., Neel, J. V., et al. (1960).
The distribution of several blood group genes in Liberia,
the Ivory Coast, and Upper Volta. American Journal of
Physical Anthropology, 18, 161–178.
Llop, E. and Rothhammer, F. (1988). A note on the presence
of blood groups A and B in pre-Columbian South America.
American Journal of Physical Anthropology, 75, 107–111.
Malhotra, K. C. (1978). Microevolutionary dynamics among-
Gavdas of Goa. In Evolutionary Models and Studies
in Human Diversity, R. J. Meier, C. M. Otten and F. Abdel-
Hameed (eds). The Hague: Mouton Publishers,
pp. 279–314.
Marks, J. (1995). Human Biodiversity. Genes, Race, and His-
tory. New York: Aldine de Gruyter.
M’charek, A. (2005). The Human Genome Diversity Project.
An Ethnography of Scientific Practice. Cambridge:
Cambridge University Press.
Meier, R. J. (1969). The Easter Islander: a study in human
biology. PhD thesis, University of Wisconsin, Madison,
WI, USA.
235Classic Markers of Human Variation
Meier, R. J. (1980). Anthropological dermatoglyphics: a
review. Yearbook of Physical Anthropology, 23, 147–178.
Melartin, L. and Blumberg, B. S. (1966). Albumin Naskapi:
a new variant of serum albumin. Science, 153,
1664–1666.
Micle, E., Kobilyansky, M., Nathan, M., et al. (1977). ABO-
typing of ancient skeletons from Israel. American Journal
of Physical Anthropology, 47, 89–92.
Mielke, J. H. and Crawford, M. H. (eds) (1980). Current
Developments in Anthropological Genetics, vol. 1.
New York: Plenum Press.
Mielke, J. H., Koningsberg, L. W. and Relethford, J. H.
(2006). Human Biological Variation. New York: Oxford
University Press.
Mohr, J. (1951). Search for linkage between Lutheran blood
group and other hereditary characters. Acta Pathologica et
Microbiologica Scandinavica, 28, 207–210.
Molnar, S. (2006). Human Variation: Races, Types and
Ethnic Groups, 6th edn. Upper Saddle River, NJ:
Pearson/Prentice Hall.
Montagu, M. F. A. (1960). An Introduction to Physical
Anthropology, 3rd edn. Springfield, IL: Charles C. Thomas.
Montagu, M. F. A. (1964). The concept of race. In The Con-
cept of Race, M. F. A. Montagu (ed.). London: Collier-
Macmillan, pp.12–28.
Mourant, A. E. (1954). Distribution of Human Blood Groups.
Oxford: Blackwell Scientific Publications.
Mourant, A. E. (1983). Blood Groups and Anthropology.
London: Oxford University Press.
Mourant, A. E., Kopec, A. C. and Domaniewska-Sobczak, K.
(1976). The Distribution of the Human Blood Groups and
Other Polymorphisms. Oxford: Oxford University Press.
Neel, J. V. and Ward, R. H. (1972). The genetic structure of a
tribal population, the Yanomama Indians, part six: analy-
sis by F-statistics (including a comparison with Makiritare
and Xavante). Genetics, 72, 639–666.
Neel, J. V., Salzano, F. M., Junqueira, P. C., et al. (1964).
Studies on the Xavante Indians of the Brazilian
Mato Grosso. American Journal of Human Genetics, 16,
52–140.
Niswander, J. D., Brown, K. S., Iba, B. Y., et al. (1970).
Population studies on southwestern Indian tribes.
I. History, culture, and genetics of the Papago. American
Journal of Human Genetics, 22, 7–23.
Omoto, K. (1978). Blood protein polymorphisms and the
problem of genetic affinities of the Ainu. In Evolutionary
Models and Studies in Human Diversity, R. J. Meier,
C. M. Otten and F. Abdel-Hameed (eds). The Hague:
Mouton Publishers, pp. 333–341.
O’Rourke, D. (2000). Genetics, geography, and human vari-
ation. In Human Biology. An Evolutionary and Biocultural
Perspective, S. Stinson B. Bogin, R. Huss-Ashmore et al.
(eds). New York: Wiley-Liss, pp. 87–133.
O’Rourke, D. (2006). Blood groups, immunoglobulins, and
genetic variation. InEnvironment, Origins, and Population,
vol. 3. D. H. Ubelaker (ed.). Washington, DC: Smithsonian
Institution, pp. 762–776.
Osborne, R. H. (1958). Serology in physical anthro-
pology. American Journal of Physical Anthropology, 16,
187–195.
Ottenberg, R. (1925). A classiciation of human races based
on geographic distribution of blood groups. Journal of the
American Medical Association, 84, 1393–1395.
Race, R. R. and Sanger, R. (1962). Blood Groups in Man,
4th edn. Philadelphia: F. A. Davis.
Reid, M. E. and Lomas-Francis, C. (1997). The Blood Group
Antigen FactsBook. San Diego, CA: Harcourt Brace and
Company.
Relethford, J. H. (2004). Global patterns of isolation by
distance based on genetic and morphological data.
Human Biology, 76, 499–513.
Relethford, J. H. and Harpending, H. C. (1995). Ancient
differences in population size can mimic a recent
African origin of modern humans. Current Anthropology,
36, 667–674.
Rhoads, J. G. and Friedlaender, J. S. (1987). Blood poly-
morphism variation in the Solomon Islands. In The
Solomon Islands Project, J. S. Friedlaender (ed.). Oxford:
Clarendon Press, pp. 125–154.
Robson, K. J. H., Lehmann, D. J., Wimhurst, V. L. C., et al.
(2004). Synergy between the C2 allele of transferrin and
the C282Y allele of the haemochromatosis gene (HFE) as
risk factors for developing Alzheimer’s disease. Journal of
Medical Genetics, 41, 261–265.
Roychoudhury, A. K. and Nei, M. (1988). Human
Polymorphic Genes. World Distribution. New York: Oxford
University Press.
Sahi, T. (1974). The inheritance of selective adult-type
lactose malabsorption. Scandinavian Journal of Gastro-
enterology, 9(suppl. 30), 1–73.
Sanghvi, L. D. (1953). Comparison of genetical and
morphological methods for a study of biological differences.
American Journal of Physical Anthropology, 11, 385–404.
Schanfield, M. S. (1980). The anthropological usefulness of
polymorphic systems: HLA and immunological allotypes.
In Current Developments in Anthropological Genetics,
vol. 1, J. H. Mielke and M. H. Crawford (eds). New York:
Plenum Press, pp. 65–85.
Schanfield, M. S. and Fudenberg, H. H. (1978). The anthro-
pological usefulness of IgA allotypic markers. In Evolu-
tionary Models and Studies in Human Diversity, R. Meier,
C. Otten, and F. Abdel-Hameed (eds), The Hague: Mouton
Publishers, pp. 343–351.
Shapiro, H. L. and Hulse, F. (1940). Migration and Environ-
ment. New York: Oxford University Press.
Smithies, O. (1955). Zone electrophoresis in starch gels:
group variations in the serum proteins of normal human
adults. Biochemical Journal, 61, 629–641.
Smithies, O. (1958). Third allele at the serum b-globulin
locus in humans. Nature, 181, 1203–1204.
Snyder, L.H. (1930). The “laws” of serologic race-classification
studies in human inheritance IV. Human Biology, 2,
128–133.
Steel, C. M., Beatson, D., Cuthbert, R. J. G., et al. (1988). HLA
haplotype A1 B8 DR3 as a risk factor for HIV related dis-
ease. Lancet, 331, 1185–1188.
Suarez, B. K., Crouse, J. D. and O’Rourke, D. H. (1985).
Genetic variation in North American populations: the
geography of gene frequencies. American Journal of Phys-
ical Anthropology, 67, 217–232.
236 Robert J. Meier
Szathmary, E. J. E. (1983). Dogrib Indians of the NWT,
Canada: genetic diversity and genetic relationship
among subarctic Indians. Annals of Human Biology, 10,
147–162.
Szathmary, E. J. E., Ferrell, R. E. and Gershowitz, H. (1983).
Genetic differentiation in Dogrib Indians: serum protein
and erythrocyte enzyme variation. American Journal of
Physical Anthropology, 62, 249–254.
Thieme, F. P. and Otten, C. M. (1957). The unreliability of
blood typing aged bone. American Journal of Physical
Anthropology, 15, 387–397.
Tills, D., Kopec, A. C. and Tills, R. E. (1983). The Distribution
of the Human Blood Groups and other Polymorphisms.
Oxford: Oxford University Press.
Vogel, F. and Chakravarartti, M. R. (1966). ABO blood
groups and smallpox in a rural population of Bengal and
Bihar (India). Human Genetics, 3: 166–180.
Vogel, F. and Motulsky, A. G. (1997). Human Genetics:
Problems and Approaches, 3rd edn. Berlin, Springer.
Volkman, S. K., Barry, A. E., Lyons, E. J., et al. (2001).
Recent origin of Plasmodium falciparum from a single
progenitor. Science, 293, 482–484.
Washburn, S. L. (1951). The new physical anthropology.
Transactions of the New York Academy of Sciences Series
II, 13, 298–304.
Weiner, J. S. and Lourie, J. A. (1969). Human Biology.
A Guide to Field Methods. IBP Handbook No. 9. Phila-
dephia, PA: F. A. Davis Company.
Weiss, K. M. (1993). Genetic Variation and Human Disease.
Cambridge: Cambridge University Press.
Wiener, A. S. (1948). Blood grouping tests in anthropology.
American Journal of Physical Anthropology, 6, 236–237.
Wooding, S. (2006). Phenylthiocarbamide: a 75-year adventure
in genetics and natural selection.Genetics, 172, 2015–2023.
237Classic Markers of Human Variation