human development indicators congo
TRANSCRIPT
Dr Jean José PADOU Economiste, Expert régional
Pôle Régional de Formation en Gestion de la Dette en Afrique de l’Ouest et du Centre (Pôle-Dette,)
BANQUE DES ETATS DE L’AFRIQUE CENTRALE - BEAC- BP 1917, YAOUNDÉ, CAMEROUN,
TELEPHONE: (237) 23- 40- 30 / 23- 40- 60
E-mail: [email protected]
DETERMINANTS OF THE LEADING HUMAN DEVELOPMENT INDICATORS IN THE REPUBLIC OF CONGO
Abstract
This paper analyses the determinants of selected leading indicators in the health and education sectors in the Republic of Congo, a country, which has just emerged from years of civil conflicts, whose consequences have been dramatic on the level of human development. Due to the unsustainable burden of its external debt, the Republic of Congo is eligible for debt relief initiative for poor income countries (HIPC), and is required to allocate the resources to be granted under the initiative primarily towards poverty alleviation programs, in the key sectors of education, health and rural development. The main finding of this study is that public expenditures in education and health sectors are productive as they lead to an improvement of the leading indicators in those sectors, a result, which should encourage the country in increasing the transfer of resources to the sectors.
June 2002
2
1. INTRODUCTION
An oil producing country, the Republic of Congo is a member of the CFA
Franc1 zone, whose recent economic and social development has been marred by
several years of civil conflicts, which displaced thousands of people and left much of
its physical infrastructures in ruins. The massive displacement of people has led to a
sharp deterioration in the living conditions of the population, and to an increase in
the poverty level. The country experienced a major terms-of-trade shock as a
consequence of the drop in oil price on the international markets in 1986, which led
to a contraction of its export earnings, (Congo relies heavily on oil exports which
represents over 70 percent of its export receipts.)
The Congolese economic performance over the last decade has been very
poor with the level of per capita income registering negative growth rates during most
of the 1990s. Real activity shrank in several areas, particularly in agriculture, but also
in the production of crops. As a result, the level of public expenditures in key social
sectors such as education, rural infrastructures and health decreased dramatically. The
poor economic performance the country registered was caused in part by the burden
of servicing a huge external debt. The external debt burden of the Republic of Congo
has increased significantly since late 1980s. The main causes behind the buildup of
external debt included exogenous factors, a lack of sustained macroeconomic
adjustment and structural reforms (which gave rise to sizeable financing needs, and
failed to strengthen the country’s debt-servicing capacity), non concessional lending
and refinancing policies of creditors (particularly lending on commercial terms, with
short repayment periods, using oil exports receipts as collateral), inadequate debt
management (driven in part by excessive confidence by creditors and debtor about
the prospects for increasing export earnings, thanks to overly optimistic world oil
price projections) and political factors (over the last decade alone, the country had
experienced four civil wars). With per capita income level estimated at around US$
3
1070 during most of the 1980s and the early part of the 1990s, Congo was ranked in
the group of middle-income countries. However, the continuing deterioration of the
economic situation, worsened by the devaluation by 50 percent of the CFA F
currency in 1994, which almost doubled the external debt stock of the country, led to
a sharp drop in per capita income. In 1995, the real per capita income level in Congo
stood at around US$ 600, precipitating the country in the group of less-developed
countries.
With the end of the last civil conflict in 1999, and helped by the recent
increase in oil prices, and the strength of the US dollar, the country has embarked on
a post-conflict economic program with the support of the World Bank, the IMF, and
other development partners. The authorities hope that the post-conflict program
would ultimately lead to a medium term program under the new IMF’s Poverty
Reduction and Growth Facility. Due to the unsustainable level of its external debt,
Congo has also become eligible for the HIPC (Highly Indebted Poor Countries) debt
relief initiative, under which, proceeds from the debt reduction program to be
provided by Congolese foreign creditors are to be allocated primarily towards the
alleviation of poverty in the country.
This paper attempts to delve into the poverty issues facing the Republic of
Congo. Ideally, we would like to look directly at the effect of income on changes in
the poverty level in order to derive the income elasticity, but unfortunately, data on
headcount poverty are not available for Congo. The growing literature in the area has
established many aspects to the concept of poverty. Poverty is defined as material
lack, bad social relations, insecurity and vulnerability, low self-confidence, and
powerlessness. Although, the factors do differ from country to country and from
group to group within each country, poverty can be characterized in four different
dimensions:
1CFA Franc is the currency issued by BEAC, which is the central bank for the six central African countries
of Cameroon, Central African Republic, Chad, Congo, Equatorial Guinea, and Gabon.
4
-the dimension of poverty traditionally favored by Economists is the
income poor, which is the population group whose personal income,
or consumption, is less than a specified ‘income poverty line’ or cut-off
point. This definition however, has been subject to both internal and
external critiques: The internal critique is that the definition is all very
well in theory but difficult to apply in practice. The points raised apply
both to the definition and application of the poverty line, and the
measurement of income expenditure. The external critique is that
poverty is about more than income alone: other measures of well-being
may be just as important. If these other measures are highly correlated
with income poverty then the latter will suffice as the poverty measure,
as it is important in its own right and proxies for the other dimension
of poverty. However, the evidence seems to suggest only an imperfect
correlation.
Other dimensions of the poverty are therefore used:
-the security poor, which is the population group that faces particularly
high risks. These risks can be material but can also pertain to personal
safety through violence or political persecution.
-many countries use illiteracy as the defining characteristic, or line to
identify the education poor. Proxy indicators such as school enrollment
rates or completed schooling years are often used.
-another dimension to the poverty concept is the health poor, defined
as the population group that has health outcomes, or expectations, that
fall below a defined health poverty line. The line could be drawn using
infant-mortality rates, life expectancy, or the nourishment indicators.
The approach we take, is to look at the evolution of those leading indicators
related to the non-revenue aspects of poverty, and for which data are readily
available. We investigate the main determinants of some selected Human
5
Development Indicators (HDIs) in the Republic of Congo. Improvements in
variables such as health and education are widely believed to be not only beneficial in
themselves, but they can be viewed as investments in human capital, which lead to a
higher future standard of living, and to a reduction of the poverty level.
The structure of the paper is as follows: Section II examines the selected
HDIs leading indicators and outlines the framework for the analysis of the factors
that affect the evolution of these indicators in the Republic of Congo. Section III
presents the empirical results for the determinants of the infant mortality rate, school
enrollment, access to basic health services, and energy intakes equations. The
Conclusion in section IV, offers some tentative leads for policy, in light of the
empirical results.
2. Modeling the HDIs
The growing body of literature on poverty has established that improvements
in Human Development Indicators are highly correlated with the rate of growth of
real per capita GDP and with technological progress, Hanmer et al. (1999). The same
set of studies found however a weak correlation between the level of per capita
income and improvements in HDIs. Significant improvement in the explanatory
power of HDIs models could be achieved through the addition of some socio-
economic variables. The most commonly used non-income measures of poverty are
those related to the education and health sectors. Schultz (1999) and Hanmer et al.
(1999) suggest a set of variables that might be used in a regression framework to
estimate determinants of the demand for education and health services.
2.1. Primary School enrollment
The education target set by the international development community is
universal primary education by 2015. The indicator chosen to measure progress
towards the realization of this goal is the primary school enrollment rate.
6
Primary education is an important weapon in the fight against poverty. This is
so, because several studies have shown that the poorest portion of the population
benefits the most from primary schooling. Investments in children and the
development of human capital are believed to represent the cornerstones of
enhancing well being, and breaking the cycle of intergenerational transmission of
poverty; and they are also central to national growth and economic development.
However such investments may require substantial cash outlays.
One key factor likely to determine the rate of primary school enrollment is
the income level. First, families need to be able to send children to school, and
parents need to be able to afford the costs associated with sending their children to
school. Even, if there are no school fees to be met, money is still needed for school
supplies, such as textbooks.
Some of the school costs can be considerable, as was established in the case of
a country like Côte-d’Ivoire by Jensen (2000). He found that the median household
cash outlay for sending children to school (tuition, enrollment fees, books, school
supplies, uniforms, and transportation) was almost CFA F 40,000 (about US$ 90) per
year, in 1986 in Côte-d’Ivoire, which is about one-third the median household per
capita income in the country. Jacoby and E. Skoufias (1997) discovered also that
income fluctuations among households in India lead to variability in school
attendance. The income level would therefore stand as a determinant in the primary
school enrollment equation. We use per capita GDP as a proxy for the income level.
The socioeconomic determinants of household demand for schooling of their
children are also expected to include the level and composition of public
expenditures on education; in low income countries, about 90 percent of public
expenditures on education are constituted of teacher salaries (Schultz, 1999). In the
case of Congo, data limitation has not allowed to disaggregate public expenditures on
education into its different components. Parents’ educations are also believed to
augment the demand for schooling of their children, both because more educated
parents may value their children’s schooling more highly, and because more educated
7
parents can better help their children in their school works. Adult literacy rate is used
as proxy for parents’ education. Urbanization is also expected to enter the primary
school enrolment equation with a positive sign, since urban zones are likely to have
better access to school infrastructures such as classrooms and teachers.
2.2. Infant Mortality
One of the key indicators retained at the international level to analyze and
monitor progress in the health sector is the rate of death among young children. We
base our choice of explanatory variables of the infant mortality rates on Hanmer and
White’s (1999), and Hanmer and Naschold’s (2000) studies of the identification of
robust determinants. These had established that growth in the income level leads to
reductions in the infant mortality rate in a number of developing countries.
In addition to per capita GDP, the coefficients of explanatory variables related
to the availability of health have been also found in the literature, to be significant
across model specifications: The availability of health services can be represented by
the number of health facilities that could be accessed by the population, which will be
comprised of hospitals and other care units and of health workers. The ratios of
physicians and nurses per thousand of the population are used as proxy for the
quantity of health services. Another factor, likely to increase the rate of child survival
is the access to health services. The percentage of the population, which has access to
health facilities, is therefore retained as a control variable in the infant mortality rate
equation. Cross-country studies show that the level of urbanization can largely
account for differences in mortality rates in sub-Saharan Africa.
We decide to include the prevalence rate of malaria, as an explanatory variable,
as it would be expected to affect the infant mortality rate. It is a fact that in many
African countries, the malaria epidemic has had significant effects on progress in
reducing infant and child mortality, since there’s no immunization against that
disease. Congo is a tropical region, where these particular diseases remain stubbornly
prevalent, with consequences on child and adult health and nutritional status.
8
Tropical parasitic diseases, such as malaria, and schistosomiasis have not been
controlled by public health interventions.
Health status will also be expected to rise with increased public spending in
the health sector.
2.3. Access to health facilities
Health facilities, when they exist, have to be accessible to the general
population. Access problems for the poor result from more than mere non-
availability of health facilities. In many African countries, the lack of roads prevents
parts of the population to access adequate health care. Varieties of infrastructures
development can have indirect benefits to the population. For example, rural roads
are important, since they can improve access to health and education services.
Therefore, improvements in the nation’s physical infrastructure, including roads
could be expected to impact positively on the level of access to health facilities. The
variable roads, which represents the number of kilometers of roads per thousand of
the population is used as a control variable in the access to health services equation.
Data on roads in the rural areas would have been more appropriate, but could not be
obtained. Access to health care could be expected to rise with the level of public
expenditures in the health sector. The relative price level of health services and its
evolution (drugs, consultation prices) will also be expected to enter negatively into the
demand for health services. Unfortunately, data on health service costs are not
available for Congo.
Simple expansion of services is not sufficient to ensure higher access to health
care, which may continue to be limited in various socio-economic groups according
to income, gender, etc. Are the poor able to pay? Evidence from a number of
counties in Malawi for example, show that the price elasticity of the demand for
health services is higher (more negative) among the poor. We use the proportion of
household budget allocated to food to proxy for the ability to pay for health services.
As a higher percentage of the household’s income is spent on food, fewer resources
9
are made available to purchase other goods, such as health services. Finally, we use
the percentage of the population living in rural areas as another control variable.
Access to health services would be likely to be greater for the urban population.
2.4. Calorie intake
Deficiencies of energy or of certain nutrients in the diet are known to
diminish physical work capacity of individuals. For example, Bhargava (1997) had
established that in a country such as Rwanda, energy deficiencies are of paramount
importance since they restrict individuals’ behavior and affect their health by
hindering the absorption of nutrients.
Myrdal (1968) observed the vicious circle of poverty and poor work
performance in developing countries caused by chronic food shortages. Improved
nutrition enhances the “capabilities” of individuals to undertake useful tasks, and
Berio (1984) finds a closed linkage between the measurement of human energy
expenditures and the amount of energy intakes.
Modeling nutritional status in Congo is therefore of great interest. One widely
cited indicator of nutritional status in the poverty sector is the level of calorie intake,
which for the present purpose, is retained as the dependent variable. The United
Nations Development Program reports a recommended level of calorie intake for
each country (UNDP, 1990). This measure is used as a base for determining whether
or not a country is achieving a minimal standard of nutrition for its population.
Empirical literature on the subject provides some guidance concerning the
socioeconomic factors that affect calorie intake in developing countries, and we
follow the literature in building up the base specifications. The general strategy is to
account for a range of variables that can help to explain the nutritious status of the
Congolese population. One variable that would be expected to determine the level of
calorie intake is the amount of food consumed, which is largely determined by the
income level of the population. There are however, factors other than the income
level, which might be expected to have an effect on calorie intake. For example: the
10
change in the price level of food. Higher price levels would render food items less
affordable to the population and would result in lower energy intake. However, due
to own-production of food by households, minor fluctuations in food prices may not
have immediate effects on calorie intake. The supply of food nationally might also
depend on the quantity of food the country imports from abroad, if local production
is not sufficient to satisfy the country’s needs. Food imports represent a sizeable
share of total imports of goods in the Republic of Congo. The percentage of income
spent on food items is another control variable used in the calorie intake equation.
One would expect calorie intake to be lower for families who are trying to make ends
meet, and who spend a good portion of their income on food. Households with a
low income do not have much flexibility in spending. Most of their income will go
for basic necessities such as food. For example, Robert Jensen (2000) established
that over 25 percent of the population of Côte-d’Ivoire live below the official World
Bank poverty line and that this group of the population spends a large fraction of
their budget on food, leaving little room for schooling costs, doctor fees, or the
purchase of medicine. Finally the literature has indicated the existence of a close link
between nutritional status and the level of food production. We include food
production as an independent variable in the calories intake equation. However,
Bhargava (1997) raised the possibility of feedback between human capital investment
return and calorie intake, in that increased calorie intake can lead to increased family
productivity and production. Note that if calorie intake influences productive
activities, the production variable may be correlated with the error terms. We tackle
this problem of endogenity of food production by use of the instrumental variable
method. The size of land area used for crops, which is closely linked to food
production, is used as an additional instrument.
3. THE DATA AND EMPIRICAL RESULTS
For the purpose of our study, we have mainly used data contained in the
October 2000 report published by the UNDP, on Human Development in the
11
Republic of Congo. The other data are obtained from the World Bank’s World
Development Indicators CD-Rom (2000), and covers the period 1976-1996. All
variables were transformed in natural logarithms to reduce heteroscedasticity ( e.g.
Nelson et al., 1989).
3.1. The results for Infant Mortality
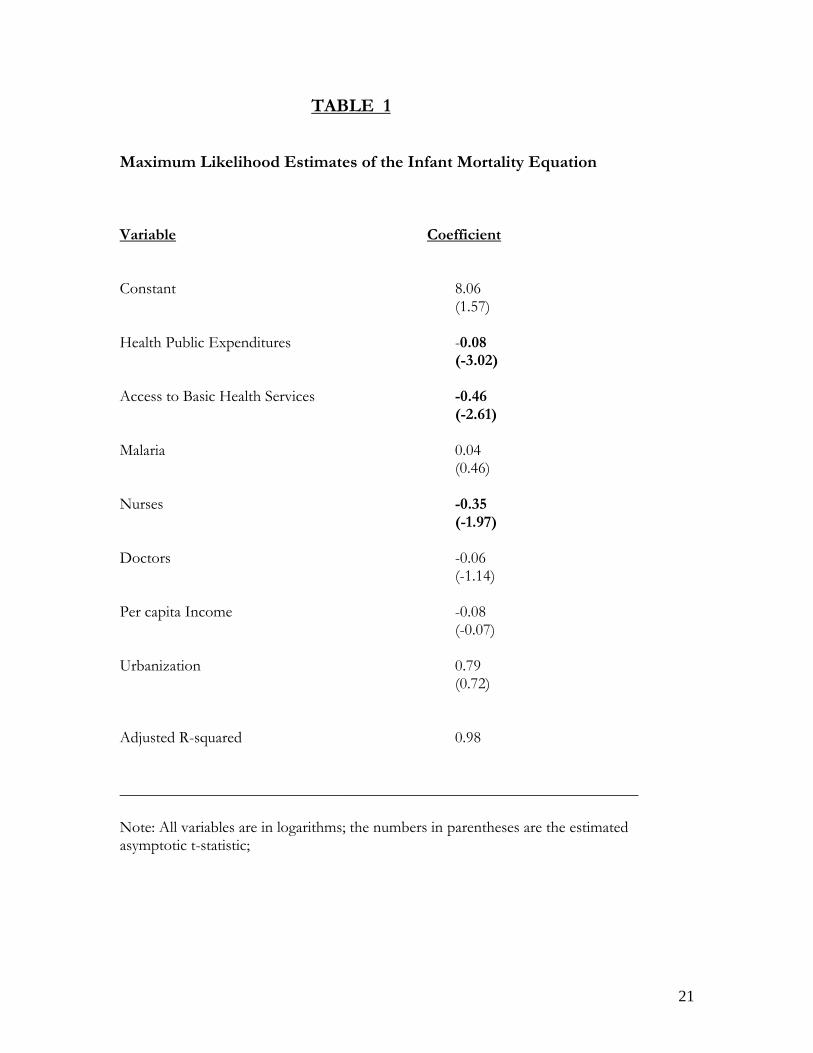
Table 1 presents results of the regression of the determinants of the infant
mortality rate in Congo. The coefficient of determination (R2 denotes the adjusted
coefficient of determination) is reasonably high for the infant mortality rate model
indicating that the regression accounts for a sizeable fraction of the variance of the
dependent variable. Tests conducted on the regression residuals indicate no departure
from normality. This was confirmed by the Jarque-Bera test statistic, which yields a
high p-value, indicating that the null hypothesis of normality of the residuals could be
retained. There seems to be no evidence of (autoregressive conditional)
heteroscedasticity of the residuals and this was confirmed by the Lagrange Multiplier
test statistic.
The Godfrey’s test statistic is however significant, indication of the presence
of serial correlation of the residuals. The test statistic and the p-values all indicate that
the errors terms should be modeled as an autoregressive process. We therefore fit the
infant mortality equation with an AR (1) error terms to account for the presence of
serial correlation of the residuals.
The equation was estimated with the Maximum Likelihood method. All the
input variables seem to have the right sign as expected except the urbanization
variable. The ‘doctors’ and ‘nurses’ variables are all negatively associated with the
infant mortality rate, but the explanatory power of the ‘doctors’ variable is weak. This
might be due to a possible collinearity with the nurse variable. In other words, the
results show that more health workers would result in a higher child survival rate.
Government investment in the health sector is associated with a reduction in the rate
of death of children. The significance of the t-statistic on the health expenditures
12
variable attests to the productivity of public expenditures in the health sector, notably
in the reduction of child mortality. This is important, since the government of Congo
has projected a substantial increase in the amount of public resources to be invested
in the health sector for the coming years. The coefficient of the malaria variable is not
statistically significant, indication that malaria, even though, positively correlated with
the child death rate, does not appear to play a major role. A child’s likelihood of dying
in the first years of life is greatly reduced by the availability of health services. The
variable access to basic health services is, as expected, negatively associated with child
mortality, with a significant asymptotic t-statistic at the ten percent level. Model
restriction using the likelihood ratio test procedure showed that parents’ education
level as proxied by the literacy rate has no meaningful impact on the rate of child
mortality and could be dropped from the model with no loss of explanatory power.
The effect of income level on infant mortality rate is also weak..
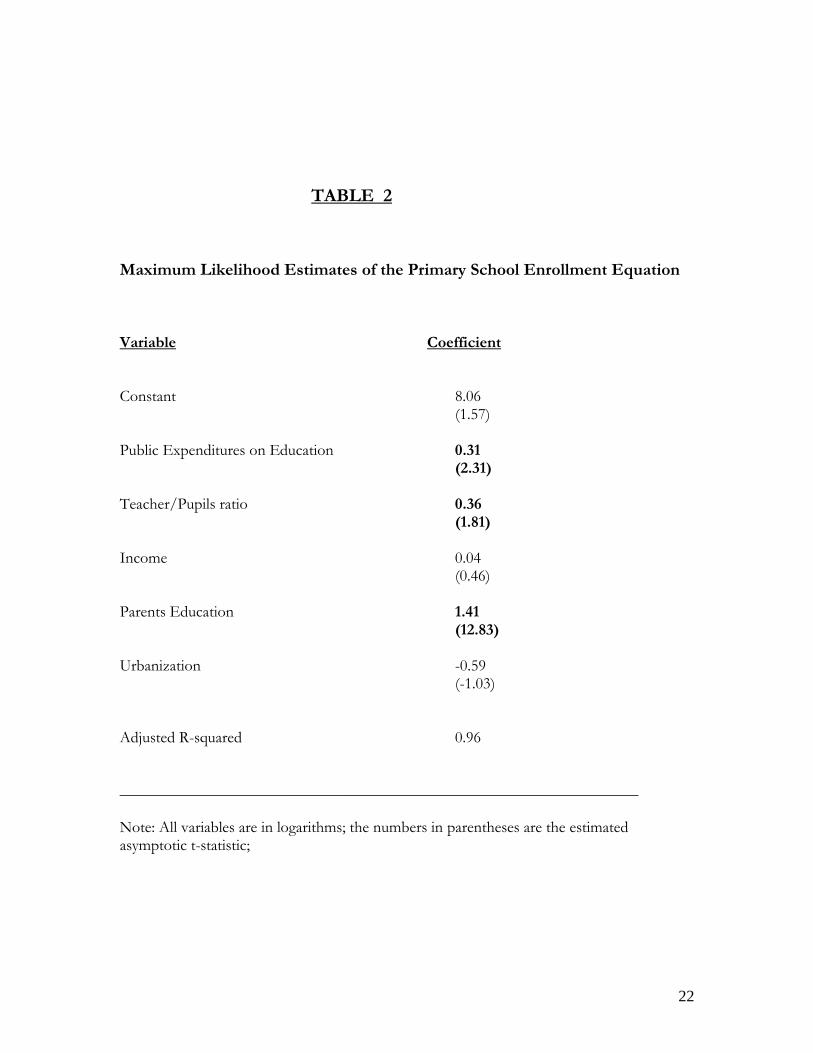
3.2 The results for School Enrollment
The empirical results of the school enrollment are presented in presented in
Table 2. All the independent variables included in the regression seem to have the
right signs, and wield a substantial explanatory power. Over 96% of the variation in
the school enrollment variable is explained by the included independent variables.
The residuals seem to be well behaved in terms of normality and heteroscedasticity.
The possibility of serial correlations provided for by the high value of the probability
on the Godfrey test statistic moves us to model the error series of the equation as a
first order autoregressive process.
The quality of education services is positively associated with the demand for
education services. The coefficient of the pupils-teacher ratio (which is the inverse of
the teacher-pupils ration) is negative and significantly different from zero. This entails
that the effort the Congolese government has engaged in towards the goal of
universal education by the year 2015 should include an increase in the number of
classrooms and teachers. That result is similar to an earlier finding by Case and
13
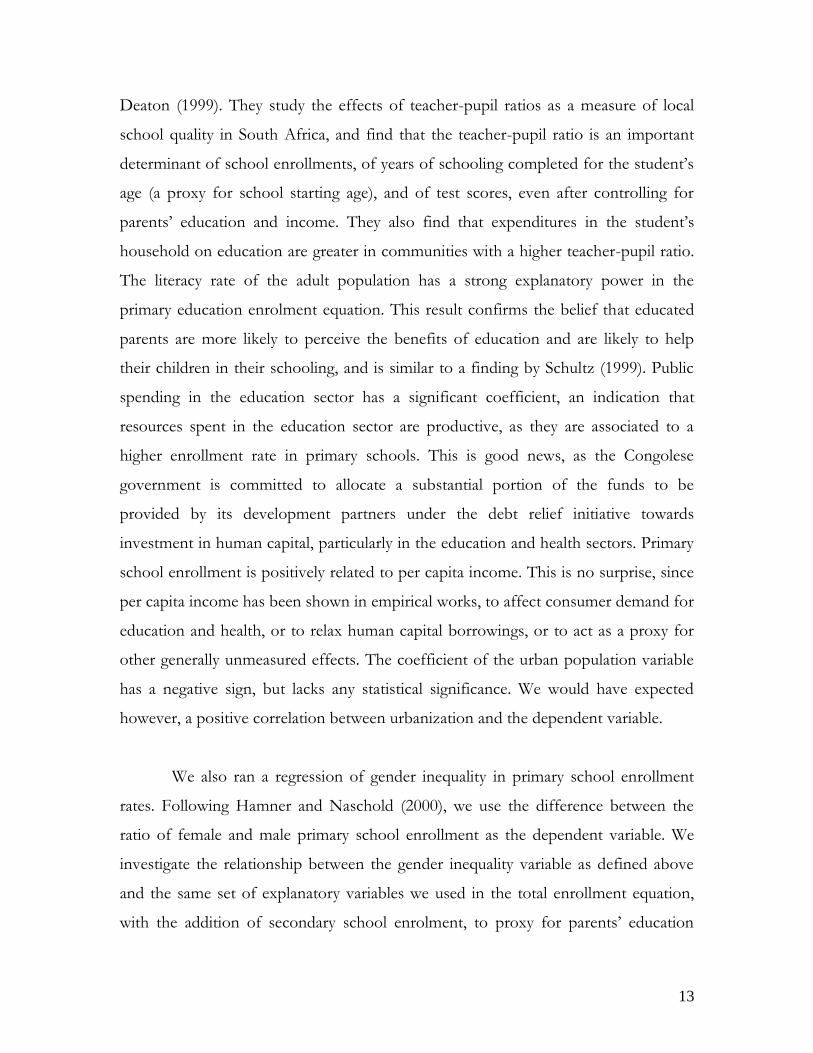
Deaton (1999). They study the effects of teacher-pupil ratios as a measure of local
school quality in South Africa, and find that the teacher-pupil ratio is an important
determinant of school enrollments, of years of schooling completed for the student’s
age (a proxy for school starting age), and of test scores, even after controlling for
parents’ education and income. They also find that expenditures in the student’s
household on education are greater in communities with a higher teacher-pupil ratio.
The literacy rate of the adult population has a strong explanatory power in the
primary education enrolment equation. This result confirms the belief that educated
parents are more likely to perceive the benefits of education and are likely to help
their children in their schooling, and is similar to a finding by Schultz (1999). Public
spending in the education sector has a significant coefficient, an indication that
resources spent in the education sector are productive, as they are associated to a
higher enrollment rate in primary schools. This is good news, as the Congolese
government is committed to allocate a substantial portion of the funds to be
provided by its development partners under the debt relief initiative towards
investment in human capital, particularly in the education and health sectors. Primary
school enrollment is positively related to per capita income. This is no surprise, since
per capita income has been shown in empirical works, to affect consumer demand for
education and health, or to relax human capital borrowings, or to act as a proxy for
other generally unmeasured effects. The coefficient of the urban population variable
has a negative sign, but lacks any statistical significance. We would have expected
however, a positive correlation between urbanization and the dependent variable.
We also ran a regression of gender inequality in primary school enrollment
rates. Following Hamner and Naschold (2000), we use the difference between the
ratio of female and male primary school enrollment as the dependent variable. We
investigate the relationship between the gender inequality variable as defined above
and the same set of explanatory variables we used in the total enrollment equation,
with the addition of secondary school enrolment, to proxy for parents’ education
14
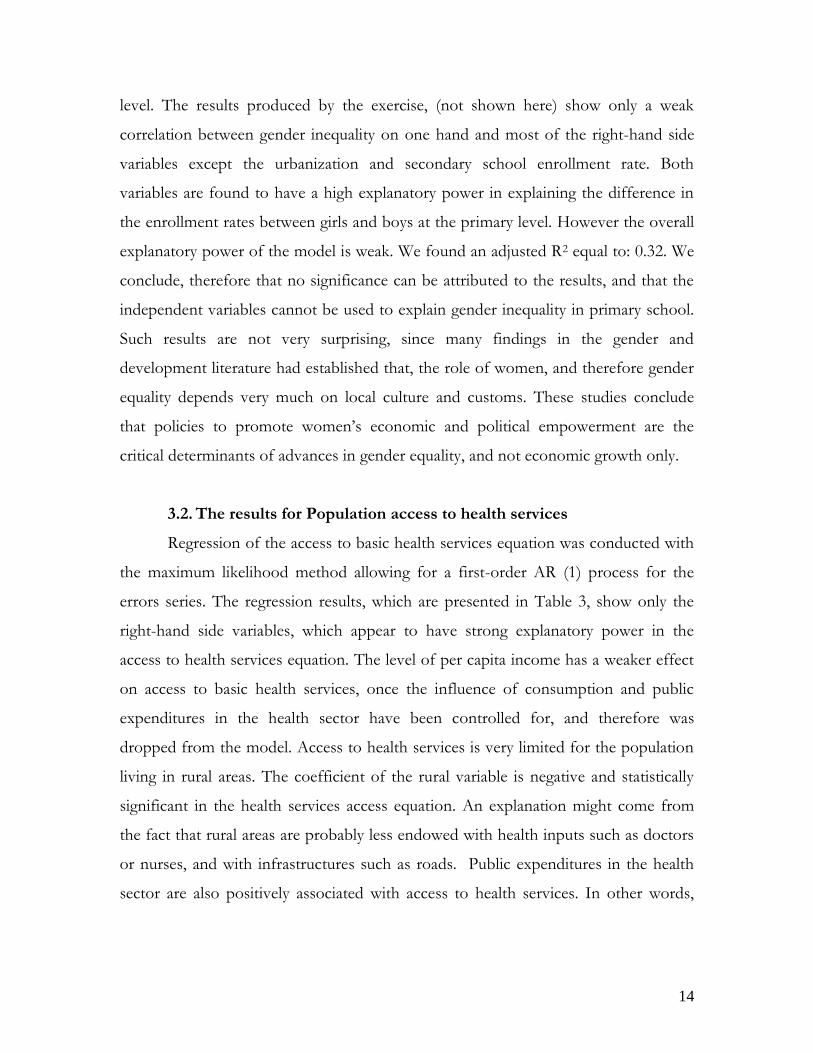
level. The results produced by the exercise, (not shown here) show only a weak
correlation between gender inequality on one hand and most of the right-hand side
variables except the urbanization and secondary school enrollment rate. Both
variables are found to have a high explanatory power in explaining the difference in
the enrollment rates between girls and boys at the primary level. However the overall
explanatory power of the model is weak. We found an adjusted R2 equal to: 0.32. We
conclude, therefore that no significance can be attributed to the results, and that the
independent variables cannot be used to explain gender inequality in primary school.
Such results are not very surprising, since many findings in the gender and
development literature had established that, the role of women, and therefore gender
equality depends very much on local culture and customs. These studies conclude
that policies to promote women’s economic and political empowerment are the
critical determinants of advances in gender equality, and not economic growth only.
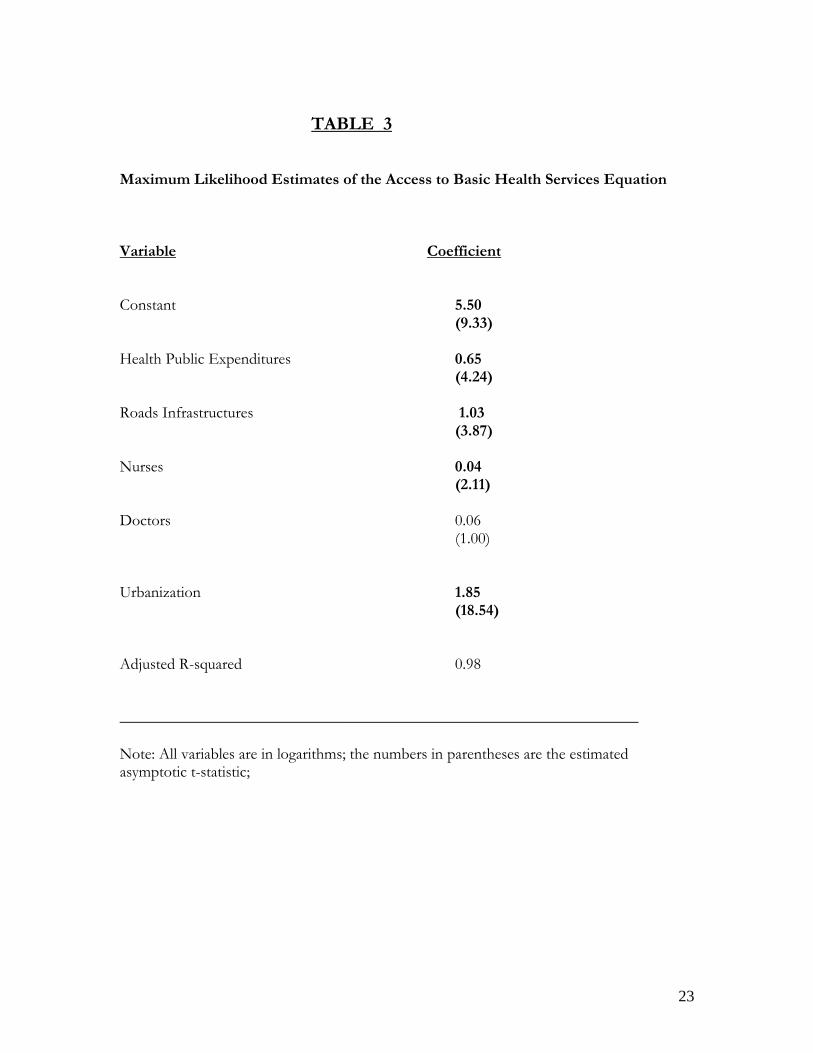
3.2. The results for Population access to health services
Regression of the access to basic health services equation was conducted with
the maximum likelihood method allowing for a first-order AR (1) process for the
errors series. The regression results, which are presented in Table 3, show only the
right-hand side variables, which appear to have strong explanatory power in the
access to health services equation. The level of per capita income has a weaker effect
on access to basic health services, once the influence of consumption and public
expenditures in the health sector have been controlled for, and therefore was
dropped from the model. Access to health services is very limited for the population
living in rural areas. The coefficient of the rural variable is negative and statistically
significant in the health services access equation. An explanation might come from
the fact that rural areas are probably less endowed with health inputs such as doctors
or nurses, and with infrastructures such as roads. Public expenditures in the health
sector are also positively associated with access to health services. In other words,
15
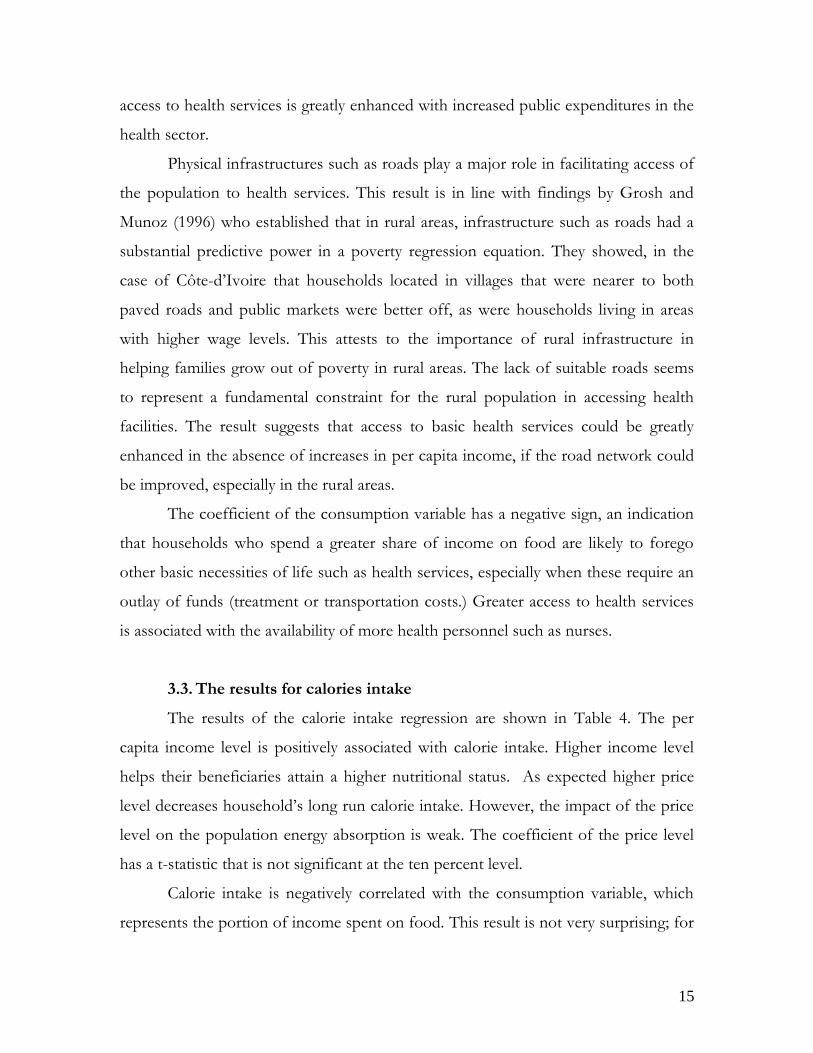
access to health services is greatly enhanced with increased public expenditures in the
health sector.
Physical infrastructures such as roads play a major role in facilitating access of
the population to health services. This result is in line with findings by Grosh and
Munoz (1996) who established that in rural areas, infrastructure such as roads had a
substantial predictive power in a poverty regression equation. They showed, in the
case of Côte-d’Ivoire that households located in villages that were nearer to both
paved roads and public markets were better off, as were households living in areas
with higher wage levels. This attests to the importance of rural infrastructure in
helping families grow out of poverty in rural areas. The lack of suitable roads seems
to represent a fundamental constraint for the rural population in accessing health
facilities. The result suggests that access to basic health services could be greatly
enhanced in the absence of increases in per capita income, if the road network could
be improved, especially in the rural areas.
The coefficient of the consumption variable has a negative sign, an indication
that households who spend a greater share of income on food are likely to forego
other basic necessities of life such as health services, especially when these require an
outlay of funds (treatment or transportation costs.) Greater access to health services
is associated with the availability of more health personnel such as nurses.
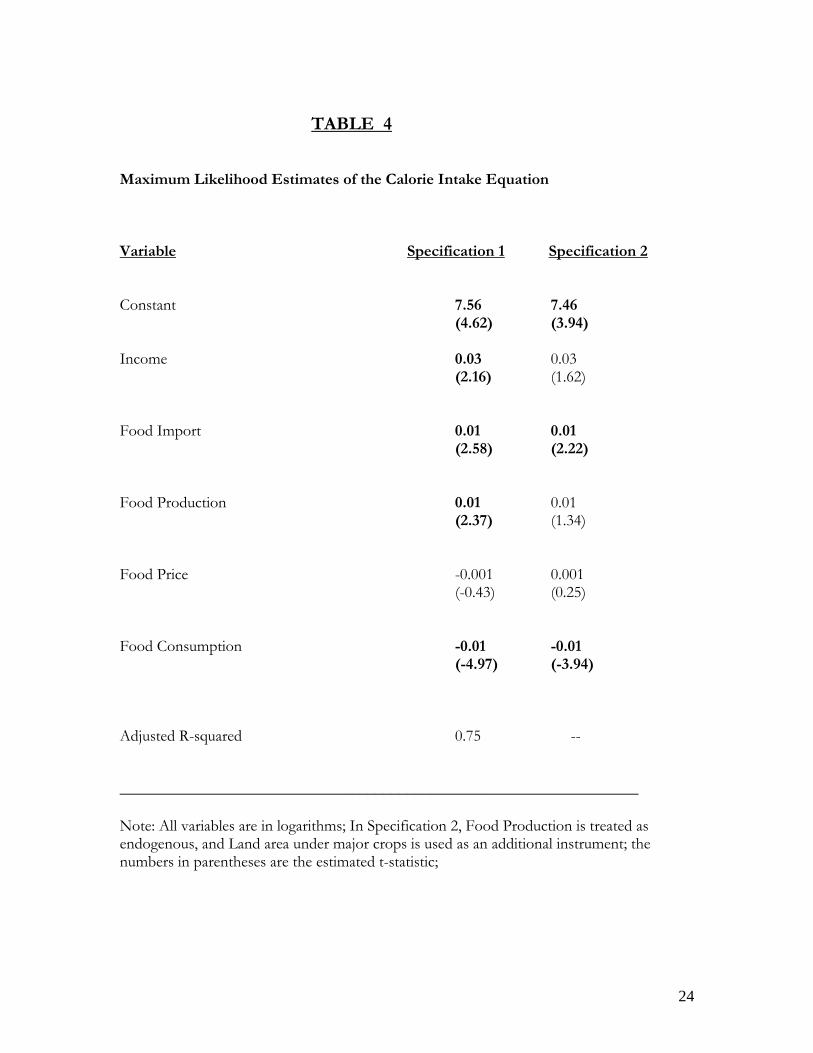
3.3. The results for calories intake
The results of the calorie intake regression are shown in Table 4. The per
capita income level is positively associated with calorie intake. Higher income level
helps their beneficiaries attain a higher nutritional status. As expected higher price
level decreases household’s long run calorie intake. However, the impact of the price
level on the population energy absorption is weak. The coefficient of the price level
has a t-statistic that is not significant at the ten percent level.
Calorie intake is negatively correlated with the consumption variable, which
represents the portion of income spent on food. This result is not very surprising; for
16
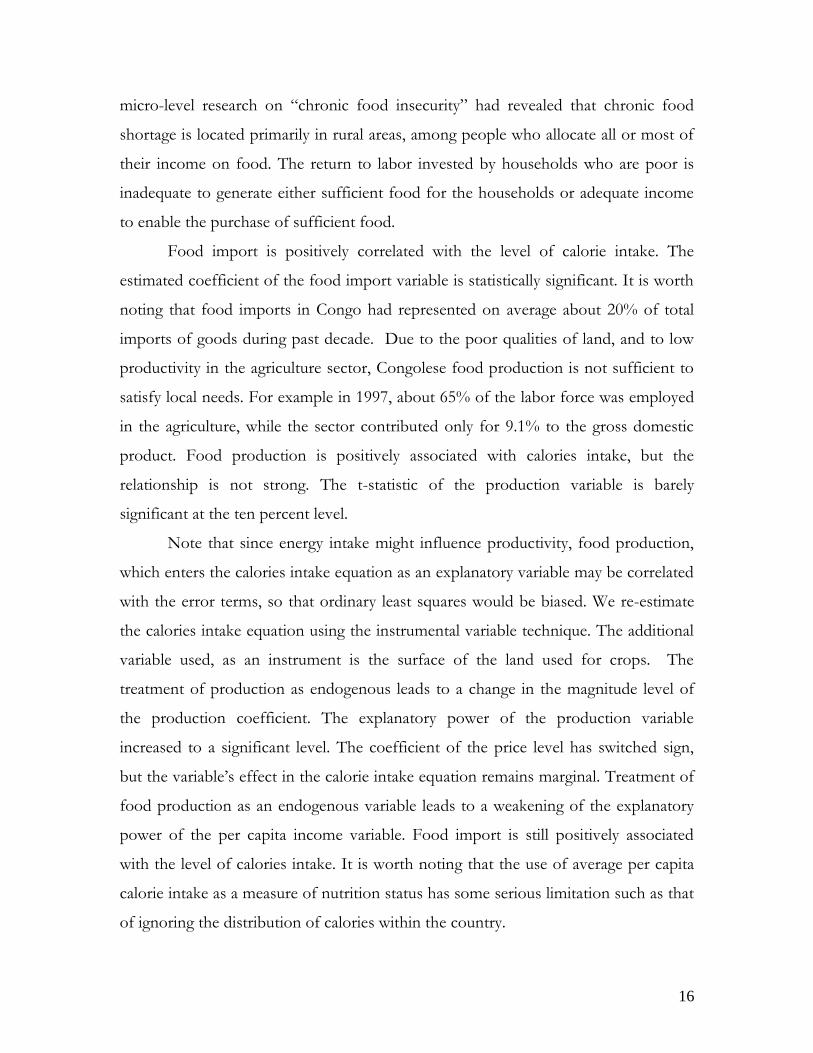
micro-level research on “chronic food insecurity” had revealed that chronic food
shortage is located primarily in rural areas, among people who allocate all or most of
their income on food. The return to labor invested by households who are poor is
inadequate to generate either sufficient food for the households or adequate income
to enable the purchase of sufficient food.
Food import is positively correlated with the level of calorie intake. The
estimated coefficient of the food import variable is statistically significant. It is worth
noting that food imports in Congo had represented on average about 20% of total
imports of goods during past decade. Due to the poor qualities of land, and to low
productivity in the agriculture sector, Congolese food production is not sufficient to
satisfy local needs. For example in 1997, about 65% of the labor force was employed
in the agriculture, while the sector contributed only for 9.1% to the gross domestic
product. Food production is positively associated with calories intake, but the
relationship is not strong. The t-statistic of the production variable is barely
significant at the ten percent level.
Note that since energy intake might influence productivity, food production,
which enters the calories intake equation as an explanatory variable may be correlated
with the error terms, so that ordinary least squares would be biased. We re-estimate
the calories intake equation using the instrumental variable technique. The additional
variable used, as an instrument is the surface of the land used for crops. The
treatment of production as endogenous leads to a change in the magnitude level of
the production coefficient. The explanatory power of the production variable
increased to a significant level. The coefficient of the price level has switched sign,
but the variable’s effect in the calorie intake equation remains marginal. Treatment of
food production as an endogenous variable leads to a weakening of the explanatory
power of the per capita income variable. Food import is still positively associated
with the level of calories intake. It is worth noting that the use of average per capita
calorie intake as a measure of nutrition status has some serious limitation such as that
of ignoring the distribution of calories within the country.
17
4. Conclusion
A population in a poor state of health cannot develop the energy necessary, or
benefit sufficiently from the natural resources available for society to make progress.
Findings of John Matovu (2000), Schultz and Tansel (1997) had indicated that health
limitations are a costly burden on the productive potential of adults in Africa.
Emerging from several years of civil conflicts, Congo has many challenges to face in
its fight against poverty. Improving some of the critical social indicators such as the
infant mortality rate, or the literacy rate will depend on many factors: an increase in
the capacity of the government to deliver more health facilities. This will require
greater investment in the health and education sectors. This strategy will focus on
training more health services providers such as nurses and doctors, investing in the
development of physical infrastructures such as roads in the rural areas. In the effort
to improve education, an important caveat has to be borne in mind. Quality has to be
taken into account in the formulation of a strategy in the education sector. We have
seen that the lack of teachers is one of the culprits for the low ratio of enrollment.
More teachers mean more classrooms. Enrollment has been hampered by factors
such as class sizes that are generally too large which translates into inadequate
teacher/student ratio. The economic case for additional investments of public funds
in the education and health sectors does exist. The balance of benefits over costs for
public education and health programs focused respectively on primary school
enrollment, and child survival in Congo appears promising. Scores of empirical works
had established that improvement in the productivity of either education or
education/health expenditures is both growth and welfare enhancing.
The authorities should take advantage of the fact that Congo is eligible under
the HIPC initiative to ensure that the strategy for poverty reduction called for under
the program, and which is now under preparation provide for increased spending in
the education and health sectors, which has the potential to lead to an improvement
in the HDIs indicators.

18
19
REFERENCES
Berio, A. – J., (1984) “The analysis of Time Allocation and Activity Patterns in Nutrition and Rural Development Planning.” Food and Nutrition Bulletin 6: 58-68 Bhargava, A. (1997) “Nutritional Status and the Allocation of Time in Rwandese.” Journal of Econometrics, March 97. Bhargava, A. (1991) “Estimating Short and Long Run Income Elasticities of Foods and Nutrients for Rural South India.” Journal of the Royal Statistical Society A 154:157-174 Case, A. and Deaton, A. (1999) “School Inputs and Educational Outcomes in South Africa.” Quarterly Journal of Economics, 114(3): 1047-1084 Grosh, M. and Munoz, J. (1996) “A Manual for Planning and Implementing the Living Standards Measurement Study Survey,” 126, World Bank, Washington DC. Hanmer, L and Naschold, Felix (2000) “Attaining International Development Targets: Will Growth be enough?,” Development Policy Review, 18:11-36. Hanmer, L and White, H. (1999) “the Impact of HIV/AIDS on Under-Five Mortality in Zambia and Zimbabwe’ Human Development in sub-Saharan Africa: The determinants of Under-Five Mortality. The Hague: ISSAS, January Jacoby, Hanan G. and Skoufias E. (1997), “Risks, Financial Markets, and Human Capital in a Developing Country.” Review of Economic Studies, 64(3): 311-335. Jensen, Robert, (2000) “Agricultural Volatility and Investments in Children.” American Economic Review 90:399-404 Matovu, J.M. (2000), ”Composition of Government Expenditure, Human Capital Accumulation, and Welfare” IMF Working Paper WP/00/15 Myrdal, G. (1968) “Asian Drama: An enquiry into the poverty of nations” (Allen Lane, Middlesex) Nelson, M., Black, A. E., Morris, J.A. and Cole, T.J. (1989) “Between-and-Within Subject Variation in Nutrient Intake from Infancy to Old Age: Estimating the Number of Days to Rank Dietary Intakes with Desired Precision” American Journal of Clinical Nutrition, 50: 155-167
20
Schultz, T. Paul (1999) “Health and Schooling Investments in Africa” Journal of Economic Perspectives, 3: 67-88. Schultz, T. Paul (1997) “The Formation of Human Capital and Economic Development of Africa: Returns to Health and Schooling Investments.” Working Paper African Development Bank, Abidjan, Côte-d’Ivoire. Schultz, T. Paul and Tansel, A. (1997) “Wage and Labor Supply Effects of Illness in Cote-d’Ivoire and Ghana: Instrumental Variable Estimates for Days Disabled” Journal of Development Economic 53:2, 251-286 Perspectives, 3: 67-88. United Nations Development Program, (1990), Human Development Report, 1990. New York: Oxford University Press. United Nations Development Program, (2000.) “Rapport d’Etudes Relatif à la Constitution de la Base des Données pour la Rédaction du Premier Rapport National sur le Développement Humain de la République du Congo”. Brazzaville
21
TABLE 1
Maximum Likelihood Estimates of the Infant Mortality Equation Variable Coefficient Constant 8.06 (1.57) Health Public Expenditures -0.08 (-3.02) Access to Basic Health Services -0.46 (-2.61) Malaria 0.04 (0.46) Nurses -0.35 (-1.97) Doctors -0.06 (-1.14) Per capita Income -0.08 (-0.07) Urbanization 0.79 (0.72) Adjusted R-squared 0.98 _________________________________________________________________ Note: All variables are in logarithms; the numbers in parentheses are the estimated asymptotic t-statistic;
22
TABLE 2
Maximum Likelihood Estimates of the Primary School Enrollment Equation Variable Coefficient Constant 8.06 (1.57) Public Expenditures on Education 0.31 (2.31) Teacher/Pupils ratio 0.36 (1.81) Income 0.04 (0.46) Parents Education 1.41 (12.83) Urbanization -0.59 (-1.03) Adjusted R-squared 0.96 _________________________________________________________________ Note: All variables are in logarithms; the numbers in parentheses are the estimated asymptotic t-statistic;
23
TABLE 3 Maximum Likelihood Estimates of the Access to Basic Health Services Equation Variable Coefficient Constant 5.50 (9.33) Health Public Expenditures 0.65 (4.24) Roads Infrastructures 1.03 (3.87) Nurses 0.04 (2.11) Doctors 0.06 (1.00) Urbanization 1.85 (18.54) Adjusted R-squared 0.98 _________________________________________________________________ Note: All variables are in logarithms; the numbers in parentheses are the estimated asymptotic t-statistic;
24
TABLE 4 Maximum Likelihood Estimates of the Calorie Intake Equation Variable Specification 1 Specification 2 Constant 7.56 7.46 (4.62) (3.94) Income 0.03 0.03 (2.16) (1.62) Food Import 0.01 0.01 (2.58) (2.22) Food Production 0.01 0.01 (2.37) (1.34) Food Price -0.001 0.001 (-0.43) (0.25) Food Consumption -0.01 -0.01 (-4.97) (-3.94) Adjusted R-squared 0.75 -- _________________________________________________________________ Note: All variables are in logarithms; In Specification 2, Food Production is treated as endogenous, and Land area under major crops is used as an additional instrument; the numbers in parentheses are the estimated t-statistic;