human development index 18 jan 2008 r. shanthini
TRANSCRIPT

Human Development Index
18 Jan 2008 R. Shanthini

• GDP per capita
18 Jan 2008 R. Shanthini

• Life Expectancy
• GDP per capita
18 Jan 2008 R. Shanthini

• Life Expectancy
• GDP per capita
• Literacy Rate• School Enrollment
18 Jan 2008 R. Shanthini

• Life Expectancy
• GDP per capita
HumanDevelopmentIndex
• Literacy Rate• School Enrollment
1/31/3
1/3
18 Jan 2008 R. Shanthini

GDP per capita, PPP (const 2000 International $)
United States
0
5000
10000
15000
20000
25000
30000
35000
40000
45000
1975 1980 1985 1990 1995 2000 2005
18 Jan 2008 R. Shanthini
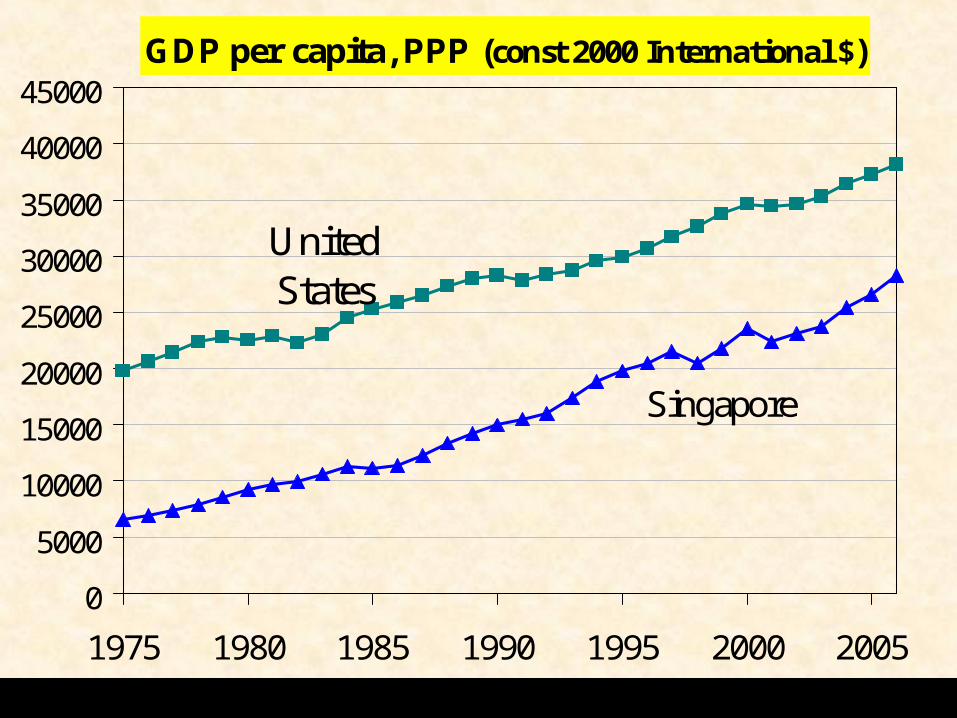
GDP per capita, PPP (const 2000 International $)
Singapore
United States
0
5000
10000
15000
20000
25000
30000
35000
40000
45000
1975 1980 1985 1990 1995 2000 2005
18 Jan 2008 R. Shanthini

GDP per capita, PPP (const 2000 International $)
Sri Lanka
Singapore
United States
0
5000
10000
15000
20000
25000
30000
35000
40000
45000
1975 1980 1985 1990 1995 2000 2005
18 Jan 2008 R. Shanthini

• United States is a very developed country!
• United States is more developed than Singapore!
• Sri Lanka has to develop like Singapore (at least)!
- based on GDP per capita
18 Jan 2008 R. Shanthini

In 2005 Sri Lanka
Singapore
HDI rank 102102 2727
Sources: Human Development Report 2007/2008; World Development Indicators Online 2008
18 Jan 2008 R. Shanthini

In 2005 Sri Lanka
Singapore
HDI rank 102102 2727Life Expectancy 7575 8080
Sources: Human Development Report 2007/2008; World Development Indicators Online 2008
18 Jan 2008 R. Shanthini

In 2005 Sri Lanka
Singapore
HDI rank 102102 2727Life Expectancy 7575 8080
Adult literacy Rate
91 91
(in 2001)(in 2001)93 93
(in 2000)(in 2000)
Sources: Human Development Report 2007/2008; World Development Indicators Online 2008
18 Jan 2008 R. Shanthini

In 2005 Sri Lanka
Singapore
HDI rank 102102 2727Life Expectancy 7575 8080
Adult literacy Rate
91 91
(in 2001)(in 2001)93 93
(in 2000)(in 2000)GDP per capita(PPP US$)
4,5954,595 29,66329,663
Sources: Human Development Report 2007/2008; World Development Indicators Online 2008
18 Jan 2008 R. Shanthini

In 2005 Spain United States
Life Index 0.925 0.881
Education Index
GDP per capita(PPP US$)
HDI RankSource: Human Development Report 2007/2008
18 Jan 2008 R. Shanthini

In 2005 Spain United States
Life Index 0.925 0.881
Education Index 0.987 0.971
GDP per capita(PPP US$)
HDI RankSource: Human Development Report 2007/2008
18 Jan 2008 R. Shanthini

In 2005 Spain United States
Life Index 0.925 0.881
Education Index 0.987 0.971
GDP per capita(PPP US$)
27,169 41,890
HDI RankSource: Human Development Report 2007/2008
18 Jan 2008 R. Shanthini

In 2005 Spain United States
Life Index 0.925 0.881
Education Index 0.987 0.971
GDP per capita(PPP US$)
27,169 41,890
HDI Rank 15 14Source: Human Development Report 2007/2008
18 Jan 2008 R. Shanthini

In 2005 Sri Lanka
Turkey
Life Index 0.776 0.773
Education Index
GDP per capita(PPP US$)
HDI RankSource: Human Development Report 2007/2008
18 Jan 2008 R. Shanthini

In 2005 Sri Lanka
Turkey
Life Index 0.776 0.773
Education Index 0.814 0.812
GDP per capita(PPP US$)
HDI RankSource: Human Development Report 2007/2008
18 Jan 2008 R. Shanthini

In 2005 Sri Lanka
Turkey
Life Index 0.776 0.773
Education Index 0.814 0.812
GDP per capita(PPP US$)
4,595 8,407
HDI RankSource: Human Development Report 2007/2008
18 Jan 2008 R. Shanthini

In 2005 Sri Lanka
Turkey
Life Index 0.776 0.773
Education Index 0.814 0.812
GDP per capita(PPP US$)
4,595 8,407
HDI Rank 102 87Source: Human Development Report 2007/2008
18 Jan 2008 R. Shanthini
GDP per capita hasa strong influence on the HDI.
18 Jan 2008 R. Shanthini
How important is GDP per capita in Human Development?
18 Jan 2008 R. Shanthini

from 1977 to 2005Life expectancy at birth, total (years)
60
65
70
75
80
85
0 10000 20000 30000 40000
GDP per capita, PPP (const. 2000 International $)
Sri Lanka
Singapore
United States
Source: World Development Indicators Online 200818 Jan 2008 R. Shanthini

from 1970 to 1999 (not updated)
Adult Illiteracy Rate (% of people 15 and above)
Sri Lanka
5
10
15
20
25
30
0 10000 20000 30000GDP per capita
Singapore

from 1960 to 1995 (not updated)
School Enrollment, secondary (% gross)
Sri Lanka
20
30
40
50
60
70
80
0 10000 20000 30000GDP per capita
Singapore

It seems that GDP per capita plays only a marginal role in Human Development?
18 Jan 2008 R. Shanthini

But, GDP per capita growth is important for people to live comfortably!
Is that true?18 Jan 2008 R. Shanthini
Let us take a look at the GINI Index, which is a measure of unequal distribution of wealth
• Gini Index of zero means absolute equality
• Gini Index of 100 means absolute inequality
18 Jan 2008 R. Shanthini

Gini Index must be close to 0 for equal distribution of wealth
GDP per capita (PPP $) 2005
Gini Index
Sri Lanka 4,595Singapore 29,663United States
41,890
Source: Human Development Report 2007/2008
18 Jan 2008 R. Shanthini

Gini Index must be close to 0 for equal distribution of wealth
GDP per capita (PPP $) 2005
Gini Index
Sri Lanka 4,595 40.2Singapore 29,663 42.5United States
41,890 40.8
Source: Human Development Report 2007/2008
18 Jan 2008 R. Shanthini

GDPI_GI= GDPI*IEQI
Socially responsible GDP per capita index
where
IEQI = 1 - ln(Gini Index) - ln(20)
ln(100) - ln(20)
GDPI =ln(GDP per capita) - ln(100)
ln(40000) - ln(100)
and
18 Jan 2008 R. Shanthini

• Life Expectancy
•Socially responsible GDP per capita
Socially Responsible Human Development Index
• Literacy Rate• School Enrollment
1/31/31/3
18 Jan 2008 R. Shanthini

Is the GDP per capita-dependent Human Development environmentally responsible? No, it is not.
18 Jan 2008 R. Shanthini

from 1975 to 2003
Source: World Development Indicators Online 2008
Electric Power Consumption (kWh per capita)
0
2000
4000
6000
8000
10000
0 5000 10000 15000 20000 25000
GDP per capita, PPP (const. 2000 International $)
Sri Lanka
Singapore
Malaysia
18 Jan 2008 R. Shanthini

from 1975 to 2003
Source: World Development Indicators Online 2008
CO2 emissions (metric tons per capita)
0
5
10
15
20
0 5000 10000 15000 20000 25000
GDP per capita, PPP (const. 2000 International $)
Sri Lanka
Singapore
Malaysia
18 Jan 2008 R. Shanthini

0
5000
10000
15000
20000
25000
30000
1750 1800 1850 1900 1950 2000Year
Global CO2 emissions from the burning of fossil fuels & the
manufacture of cement
(Unit: 109 kg)
Source: http://cdiac.ornl.gov/trends/trends.htm
18 Jan 2008 R. Shanthini

courtesy NASA Earth Science EnterpriseSource: http://www.visionlearning.com/library/module_viewer2.php?mid=95&l=&let1=Ear
11 Jan 2008 R. Shanthini

275
300
325
350
375
400
1750 1800 1850 1900 1950 2000Year
CO2 concentration in the atmosphere
(Unit: ppmv)
Source: http://cdiac.ornl.gov/trends/trends.htm
11 Jan 2008 R. Shanthini
383.7

ERI= CEFI*ECRI
Environmentally Responsible Index
where
CO2I = ln(30) - ln(CO2pc)
ln(30) - ln(0.1)
and
ElecI = ln(30000) - ln(Elecpc)
ln(30000) - ln(10)
11 Jan 2008 R. Shanthini

Responsible Human Development Index
• Life Expectancy
• Socially responsible GDP per capita
• Literacy Rate• School Enrollment
1/41/41/4
• Environmental Responsibility
1/4
11 Jan 2008 R. Shanthini

The modified HDI is a good index?
18 Jan 2008 R. Shanthini
No, it is not.

The biggest problem with HDI ishow the indices are defined.
Life Index = Life Expectancy - 25
85 - 25
18 Jan 2008 R. Shanthini
Education Index =
2 Adult Literacy
3 100
2 Enrollment
3 100+

GDPI_GI= GDPI*IEQI
IEQI = 1 - ln(Gini Index) - ln(20)
ln(100) - ln(20)
GDP Index =ln(GDP per capita) - ln(100)
ln(40000) - ln(100)
18 Jan 2008 R. Shanthini
Socially responsible GDP index

ERI= CEFI*ECRI
Environmentally Responsible Index
where
CO2I = ln(30) - ln(CO2pc)
ln(30) - ln(0.1)
and
ElecI = ln(30000) - ln(Elecpc)
ln(30000) - ln(10)
11 Jan 2008 R. Shanthini

What is the problem?
18 Jan 2008 R. Shanthini
No limit is placed on GDP per capita, CO2 emissions and Electricity consumption
sustainable