human demographic history impacts genetic risk prediction
TRANSCRIPT

Please cite this article in press as: Martin et al., Human Demographic History Impacts Genetic Risk Prediction across Diverse Populations,The American Journal of Human Genetics (2017), http://dx.doi.org/10.1016/j.ajhg.2017.03.004
ARTICLE
Human Demographic History ImpactsGenetic Risk Prediction across Diverse Populations
Alicia R. Martin,1,2,3,4 Christopher R. Gignoux,4 Raymond K. Walters,1,2,3 Genevieve L. Wojcik,4
Benjamin M. Neale,1,2,3 Simon Gravel,5,6 Mark J. Daly,1,2,3 Carlos D. Bustamante,4
and Eimear E. Kenny7,8,9,10,*
The vast majority of genome-wide association studies (GWASs) are performed in Europeans, and their transferability to other popula-
tions is dependent on many factors (e.g., linkage disequilibrium, allele frequencies, genetic architecture). As medical genomics studies
become increasingly large and diverse, gaining insights into population history and consequently the transferability of disease risk mea-
surement is critical. Here, we disentangle recent population history in the widely used 1000 Genomes Project reference panel, with an
emphasis on populations underrepresented in medical studies. To examine the transferability of single-ancestry GWASs, we used pub-
lished summary statistics to calculate polygenic risk scores for eight well-studied phenotypes. We identify directional inconsistencies in
all scores; for example, height is predicted to decrease with genetic distance from Europeans, despite robust anthropological evidence
that West Africans are as tall as Europeans on average. To gain deeper quantitative insights into GWAS transferability, we developed a
complex trait coalescent-based simulation framework considering effects of polygenicity, causal allele frequency divergence, and heri-
tability. As expected, correlations between true and inferred risk are typically highest in the population from which summary statistics
were derived. We demonstrate that scores inferred from European GWASs are biased by genetic drift in other populations even when
choosing the same causal variants and that biases in any direction are possible and unpredictable. This work cautions that summarizing
findings from large-scale GWASs may have limited portability to other populations using standard approaches and highlights the need
for generalized risk prediction methods and the inclusion of more diverse individuals in medical genomics.
Introduction
The majority of genome-wide association studies (GWASs)
have been performed in populations of European de-
scent.1–4 An open question in medical genomics is the de-
gree to which these results transfer to new populations.
GWASs have yielded tens of thousands of common genetic
variants significantly associated with human medical and
evolutionary phenotypes, most of which have replicated
in other ethnic groups.5–7 However, GWASs are optimally
powered to discover common variant associations, and the
European bias in GWASs results in associated SNPs with
higher minor allele frequencies on average compared to
other populations. The predictive power of GWAS findings
andgenetic diagnostic accuracy innon-Europeans are there-
fore limited by population differences in allele frequencies
and linkage disequilibrium structure. For example, a previ-
ous study showed that the accuracy of breeding values and
genomic prediction decays approximately linearly with
increasingdivergencebetween thediscovery and target pop-
ulation.8 Additionally, multiple individuals with African
ancestry have received false positive misdiagnoses of hyper-
trophic cardiomyopathy that would have been prevented
with the inclusion of even small numbers of African Ameri-
1Analytic and Translational Genetics Unit, Department of Medicine, Massachu2Program in Medical and Population Genetics, Broad Institute of Harvard and
Broad Institute of Harvard and MIT, Cambridge, MA 02142, USA; 4Department
HumanGenetics, McGill University, Montreal, QCH3A 0G1, Canada; 6McGill U
Canada; 7Department of Genetics and Genomic Sciences, Icahn School of Me
Institute of Personalized Medicine, Icahn School of Medicine at Mount Sina
of Medicine at Mount Sinai, New York, NY 10029, USA; 10Icahn Institute of G
New York, NY 10029, USA
*Correspondence: [email protected]
http://dx.doi.org/10.1016/j.ajhg.2017.03.004.
Th
� 2017 American Society of Human Genetics.
cans in these studies.9 Further, a previous study finding that
96% of GWAS participants are of European descent1 has
recently been updated; although the non-European propor-
tion of GWAS participants has increased to nearly 20%, this
is primarily driven by Asian individuals, and the proportion
of individuals with African and Hispanic/Latino ancestry in
GWASs has remained essentially unchanged.4
As GWAS sample sizes grow to hundreds of thousands of
samples, they also become better powered to detect rare
variant associations.10–12 Large-scale sequencing studies
have demonstrated that rare variants show stronger
geographic clustering than common variants.13–15 Rare,
disease-associated variants are therefore expected to track
with recent population demography and/or be population
restricted.14,16–18 As the next era of GWASs expands to
evaluate the disease-associated role of rare variants, it is
not only scientifically imperative to include multi-ethnic
populations, it is also likely that such studies will
encounter increasing genetic heterogeneity in very large
study populations. A comprehensive understanding of
the genetic diversity and demographic history of multi-
ethnic populations is critical for appropriate applications
of GWASs and ultimately for ensuring that genetics does
not contribute to or enhance health disparities.4
setts General Hospital and HarvardMedical School, Boston, MA 02114, USA;
MIT, Cambridge, MA 02142, USA; 3Stanley Center for Psychiatric Research,
of Genetics, Stanford University, Stanford, CA 94305, USA; 5Department of
niversity andGenomeQuebec Innovation Centre, Montreal, QCH3A 0G1,
dicine at Mount Sinai, New York, NY 10029, USA; 8The Charles Bronfman
i, New York, NY 10029, USA; 9Center of Statistical Genetics, Icahn School
enomics and Multiscale Biology, Icahn School of Medicine at Mount Sinai,
e American Journal of Human Genetics 100, 1–15, April 6, 2017 1

Please cite this article in press as: Martin et al., Human Demographic History Impacts Genetic Risk Prediction across Diverse Populations,The American Journal of Human Genetics (2017), http://dx.doi.org/10.1016/j.ajhg.2017.03.004
The most recent release of the 1000 Genomes Project
(phase 3) provides one of the largest global reference
panels of whole-genome sequencing data, enabling a
broad survey of human genetic variation.19 The depth
and breadth of diversity queried facilitates a deep under-
standing of the evolutionary forces (e.g., selection and
drift) shaping existing genetic variation in present-
day populations that contribute to adaptation and
disease.20–25 Studies of admixed populations have been
particularly fruitful in identifying genetic adaptations
and risk for diseases that are stratified across diverged
ancestral origins.26–31 Admixture patterns became espe-
cially complex during the peopling of the Americas, with
extensive recent admixture spanning multiple continents.
Processes shaping structure in these admixed populations
include sex-biased migration and admixture, isolation-
by-distance, differential drift in mainland versus island
populations, and variable admixture timing.14,32,33
Standard GWAS strategies approach population struc-
ture as a nuisance factor. A typical stepwise procedure first
detects dimensions of global population structure in each
individual, using principal-component analysis (PCA) or
other methods,34–37 and often excludes ‘‘outlier’’ individ-
uals from the analysis and/or corrects for inflation arising
from population structure in the statistical model for
association. Such strategies reduce false positives in test
statistics, but can also reduce power for association in
heterogeneous populations and are less likely to work for
rare variant association.38,39 Recent methodological
advances have leveraged patterns of global and local
ancestry for improved association power,27,40,41 fine-map-
ping,42 and genome assembly.43 At the same time, popula-
tion genetic studies have demonstrated the presence of
fine-scale sub-continental structure in the African, Native
American, and European components of populations
from the Americas.44–47 If trait-associated variants follow
the same patterns of demography, then we expect that
modeling sub-continental ancestry may enable their
improved detection in admixed populations.
The dawn of the GWAS era saw limited success in identi-
fying genome-wide significant loci associated with disease,
and a major endeavor to better understand the genetic
architecture of complex traits emerged. The peaks that
met genome-wide significance typically did not explain a
significant fraction of the phenotypic variance, and a
major goal to estimate how many more signals remained
yet to be discovered arose; this objective ushered in a
wave of methodological development in heritability, linear
mixed models, and polygenic risk prediction, as discussed
and reviewed extensively elsewhere.11,48–56 Numerous
complex traits have been studied with cohort sizes in the
hundreds of thousands, and yet in each case there are
many more signals that improve prediction accuracy
than meet genome-wide significance.48,57–59 For example,
including only genome-wide significant loci in the predic-
tion of schizophrenia explains <3% of the phenotypic
variance, whereas loci meeting the significance threshold
2 The American Journal of Human Genetics 100, 1–15, April 6, 2017
that optimally balances signal versus noise (in this case,
p % 0.1) in the meta-analysis explains considerably more
(>18%) of the phenotypic variance.11 Because the predic-
tion accuracy, which is usually measured via prediction
R2, Nagelkerke’s R2, or receiver operator curve AUC, of
polygenic risk scores is currently low for most traits,56
genetic risk prediction is not clinically viable at present,
but polygenic risk scores have nonetheless repeatedly
proven valuable in research contexts across a multitude
of complex traits11,48,60–65 and will become increasingly
useful as GWAS sample sizes grow.59 Additionally, several
methodological advancements to the standard approach
have recently been undertaken.58,66–68
In this study, we explore the impact of population diver-
sity on the landscape of variation underlying human traits.
We infer demographic history for the global populations in
the 1000 Genomes Project, focusing particularly on ad-
mixed populations from the Americas, which are under-
represented in medical genetic studies.4 We disentangle
local ancestry to infer the ancestral origins of these popula-
tions.We link this work to ongoing efforts to improve study
design and disease variant discovery by quantifying biases
in clinical databases and GWASs in diverse and admixed
populations. These biases have a striking impact on genetic
risk prediction; for example, a previous study calculated
polygenic risk scores for schizophrenia in East Asians and
Africans based on GWAS summary statistics derived from
a European cohort and found that prediction accuracy
was reduced by more than 50% in non-European popula-
tions.67 To disentangle the role of demography on poly-
genic risk prediction derived from single-ancestry GWASs,
we designed a coalescent-based simulation framework re-
flecting modern human population history and show that
polygenic risk scores derived from European GWASs are
biased when applied to diverged populations. Specifically,
we identify reduced variance in risk prediction with
increasing divergence from Europe reflecting decreased
overall variance explained, anddemonstrate that anenrich-
ment of low-frequency risk and high-frequency protective
alleles contribute to an overall protective shift in European
inferred risk on average across traits. Our results highlight
the need for the inclusion of more diverse populations
in GWASs as well as genetic risk prediction methods
improving transferability across populations.
Material and Methods
Ancestry DeconvolutionWe used the phased haplotypes from the 1000 Genomes con-
sortium. We phased reference haplotypes from 43 Native
American samples from Mao et al.69 inferred to have >0.99
Native ancestry in ADMIXTURE using SHAPEIT2 (v.2.r778),70
then merged the haplotypes using scripts made publicly avail-
able. These combined phased haplotypes were used as input to
the PopPhased version of RFMix v.1.5.471 with the following
flags: -w 0.2, -e 1, -n 5, - -use-reference-panels-in-EM, - -forward-
backward EM. The node size of 5 was selected to reduce bias in

Please cite this article in press as: Martin et al., Human Demographic History Impacts Genetic Risk Prediction across Diverse Populations,The American Journal of Human Genetics (2017), http://dx.doi.org/10.1016/j.ajhg.2017.03.004
random forests resulting from unbalanced reference panel sizes
(AFR panel N ¼ 504, EUR panel N ¼ 503, and NAT panel
N ¼ 43). We used the default minimum window size of 0.2 cM
to enable model comparisons with previously inferred models
using Tracts.72 We used 1 EM iteration to improve the local
ancestry calls without substantially increasing computational
complexity. We used the reference panel in the EM to take better
advantage of the Native American ancestry tracts from the
Hispanic/Latinos in the EM given the small NAT reference panel.
We set the LWK, MSL, GWD, YRI, and ESN as reference African
populations, the CEU, GBR, FIN, IBS, and TSI as reference
European populations, and the samples from Mao et al.69 with
inferred >0.99 Native ancestry as reference Native American
populations, as in Abecasis et al.73
Ancestry-Specific PCAWe performed ancestry-specific PCA, as described in Moreno-Es-
trada et al.32 The resulting matrix is not necessarily orthogonal-
ized, so we subsequently performed singular value decomposition
in python 2.7 using numpy. There were a small number of major
outliers, as seen previously.32 There was one outlier (ASW individ-
ual NA20314) when analyzing the African tracts, which was ex-
pected as this individual has no African ancestry. There were eight
outliers (PUR HG00731, PUR HG00732, ACB HG01880, ACB
HG01882, PEL HG01944, ACB HG02497, ASW NA20320, ASW
NA20321) when analyzing the European tracts. Some of these in-
dividuals hadminimal European ancestry, had South or East Asian
ancestry misclassified as European ancestry resulting from a
limited 3-way ancestry reference panel, or were unexpected out-
liers. As described in the PCAmaskmanual, a handful of major out-
liers sometimes occur. As AS-PCA is an iterative procedure, we
therefore removed the major outliers for each sub-continental
analysis and orthogonalized the matrix on this subset.
TractsThe RFMix output was collapsed into haploid bed files, and ‘‘UNK’’
or unknown ancestry was assigned where the posterior probability
of a given ancestry was <0.90. These collapsed haploid tracts were
used to infer admixture timings, quantities, and proportions for
the ACB and PEL (new to phase 3) using Tracts.72 Because the
ACB have a very small proportion of Native American ancestry,
we fit three 2-way models of admixture, including one model of
single- and two models of double-pulse admixture events, using
Tracts. In both of the double-pulse admixture models, the model
includes an early mixture of African and European ancestry fol-
lowed by another later pulse of either European or African
ancestry. We randomized starting parameters and fit each model
100 times and compared the log-likelihoods of the model fits.
The single-pulse and double-pulse model with a second wave of
African admixture provided the best fits and reached similar log-
likelihoods, with the latter showing a slight improvement in fit.
We next assessed the fit of nine different models in Tracts for the
PEL,72 including several two-pulse and three-pulse models.
Ordering the populations as NAT, EUR, and AFR, we tested the
following models: ppp_ppp, ppp_pxp, ppp_xxp, ppx_xxp,
ppx_xxp_ppx, ppx_xxp_pxx, ppx_xxp_pxp, ppx_xxp_xpx, and
ppx_xxp_xxp, where the order of each letter corresponds with
the order of populations given above, an underscore indicates a
distinct migration event with the first event corresponding with
the most generations before present, p corresponds with a pulse
of the ordered ancestries, and x corresponds with no input from
Th
the ordered ancestries. We tested all nine models preliminarily
three times, and for all models that converged and were within
the top three models, we subsequently fit each model with 100
starting parameter randomizations.
Imputation AccuracyImputation accuracy was calculated using a leave-one-out internal
validation approach. Two array designs were compared for this
analysis: Illumina OmniExpress and Affymetrix Axiom World
Array LAT. Sites from these array designs were subset from chromo-
some 9 of the 1000 Genomes Project Phase 3 release for admixed
populations. After fixing these sites, each individual was imputed
using the rest of the dataset as a reference panel.
Overall imputation accuracy was binned by minor allele fre-
quency (0.5%–1%, 1%–2%, 2%–3%, 3%–4%, 4%–5%, 5%–10%,
10%–20%, 20%–30%, 30%–40%, 40%–50%) comparing the geno-
typed true alleles to the imputed dosages. A second round of ana-
lyses stratified the imputation by local ancestry diplotype, which
was estimated as described earlier. Within each ancestral diplotype
(AFR_AFR, AFR_NAT, AFR_EUR, EUR_EUR, EUR_NAT, NAT_NAT),
imputation accuracy was again estimated within MAF bins.
Empirical Polygenic Risk Score InferencesIn the most standard approach, genetic risk scores for a target
cohort are generated using genome-wide summary statistics from
a discovery GWAS with a set of SNPs common to both studies.
From this starting set of SNPs, a further reduced set of pruned,
approximately independent SNPs are then identified through a
greedy clumping algorithm. Typically, progressively larger sets of
SNPs defined by a range of p value thresholds (e.g., p < 5 3 10�8,
1 3 10�5, 1 3 10�4, 1 3 10�3, 0.01, etc.) are evaluated to identify
the best model balancing the signal to noise ratio to maximize
phenotypic variance explained.57,58 Once the optimal significance
threshold and the final set of pruned, approximately independent
set of SNPs have been selected, a polygenic risk score for each
individual in a target sample is computed as the sum of the count
of risk alleles weighted by the effect size (e.g., log odds ratio).
To compute polygenic risk scores in the 1000 Genomes samples
using summary statistics from previous GWASs, we first filtered to
biallelic SNPs and removed ambiguous AT/GC SNPs from the inte-
grated 1000 Genome call set. To get relatively independent associ-
ations when multiple significant p value associations are in the
same region in a GWAS (i.e., in LD), we performed clumping in
plink using the - -clump flag for all variants with MAF R 0.01,74
which uses a greedy algorithm ordering SNPs by p value, then
selectively removes SNPs within close proximity and LD in
ascending p value order (i.e., starting with the most significant
SNP). As a population cohort with similar LD patterns to the study
sets, we used European 1000 Genomes samples (CEU, GBR, FIN,
IBS, and TSI). To compute the polygenic risk scores, we considered
all SNPs with p values % 1 3 10�2 in the GWAS, a window size
of 250 kb, and an R2 threshold of 0.5 in Europeans to group
SNPs. After obtaining the most significant, approximately inde-
pendent signals (Table S4), we computed polygenic scores using
the - -score flag in plink.74
Polygenic Risk Score SimulationsWe simulated genotypes in a coalescent framework with msprime
v.1.375 for chromosome 20 incorporating a recombination map of
GRCh37 and an assumed mutation rate of 2 3 10�8 mutations /
(base pair * generation). We used a demographic model previously
e American Journal of Human Genetics 100, 1–15, April 6, 2017 3

−3
−2
−1
0
1
−2 −1 0 1 2PC1
−P
C2
ReferenceFINCEUGBRIBSTSI
AdmixedACBASWCLMMXLPELPUR
−2
−1
0
1
−1 0 1 2−PC1
PC
2
ReferenceESNGWDLWKMSLYRI
AdmixedACBASW
−2.4
−2.0
−1.6
−1.2
−2 −1 0 1PC1
PC
2
AdmixedCLMMXLPELPUR
D E
F G
A
Ref
eren
cepa
nel
0.00.20.40.60.81.0
NAT CEU YRI
Afr
ican
Am
eric
an0.00.20.40.60.81.0
ACB ASW
His
pani
c/La
tino
0.00.20.40.60.81.0
PUR CLM MXL PEL
CB
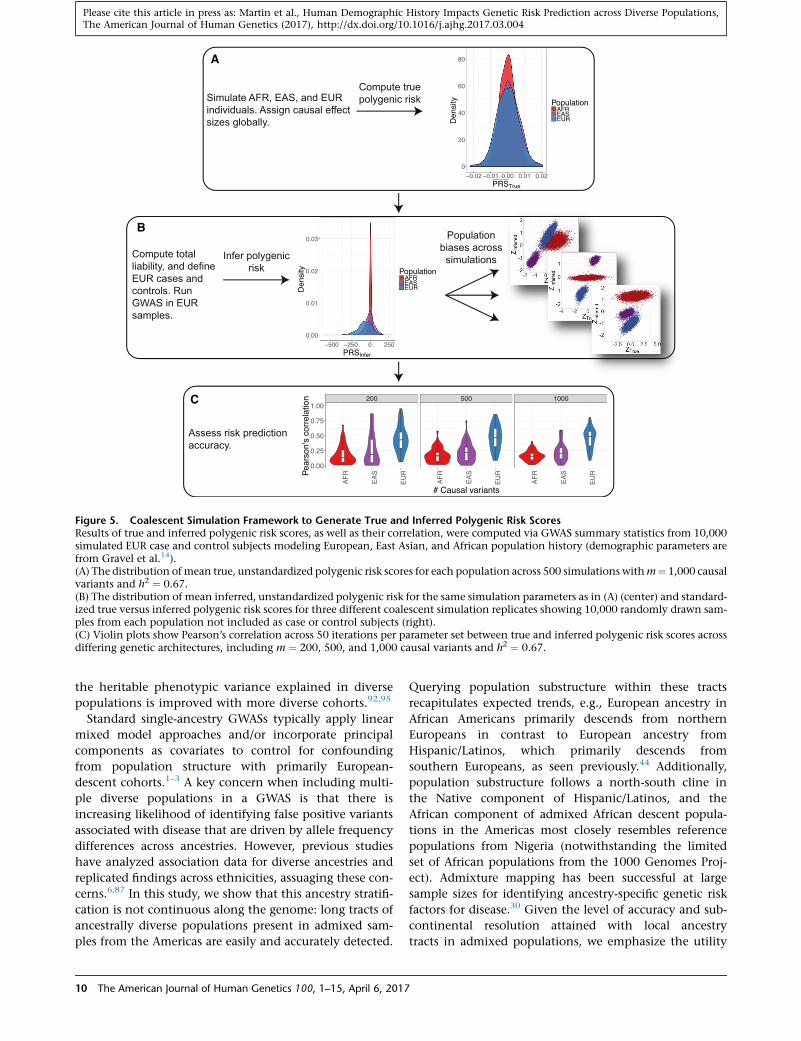
Figure 1. Sub-continental Diversity and Origins of African, European, and Native American Components of Recently AdmixedAmerican Populations(A) ADMIXTURE analysis at K ¼ 3 focusing on admixed Americas samples, with the NAT,69 CEU, and YRI as reference populations.
(legend continued on next page)
4 The American Journal of Human Genetics 100, 1–15, April 6, 2017
Please cite this article in press as: Martin et al., Human Demographic History Impacts Genetic Risk Prediction across Diverse Populations,The American Journal of Human Genetics (2017), http://dx.doi.org/10.1016/j.ajhg.2017.03.004

Please cite this article in press as: Martin et al., Human Demographic History Impacts Genetic Risk Prediction across Diverse Populations,The American Journal of Human Genetics (2017), http://dx.doi.org/10.1016/j.ajhg.2017.03.004
inferred using 1000 Genomes sequencing data14 to simulate indi-
viduals that reflect European, East Asian, and African population
histories. We focus on these populations as the demography has
previously been modeled and this avoids the challenges of simu-
lating the geographically heterogeneous47 and sex-biased process
of admixture in the Americas.76 To imitate a GWAS with European
sample bias and evaluate polygenic risk scores in other popula-
tions, we simulated 200,000 European, 200,000 East Asian, and
200,000 African individuals. Next, we assigned ‘‘true’’ causal effect
sizes tom evenly spaced alleles. Specifically, we randomly assigned
effect sizes as
b � N
�0;
h2
m
�
where the normal distribution is specified by the mean and stan-
dard deviation (as in python’s numpy package). For all other
non-causal sites, the effect size is zero. We then define X as
X ¼Xmi¼1
gibi
where gi are the genotype states (i.e., 0, 1, or 2). To handle varying
allele frequencies and potential weak LD between causal sites, to
ensure a neutral model with random true polygenic risks with
respect to allele frequencies, and to obtain the total desired vari-
ance, we normalize X as
ZX ¼ X� mX
sX
:
We then compute the true polygenic risk score as
G ¼ffiffiffiffiffih2
p� ZX
such that the total variance of the scores is h2. We also simulated
environmental noise and standardize to ensure equal variance be-
tween normalized genetic and environmental effects before,
defining the environmental effect E as
ε ¼ N�0;1� h2
�
Zε¼ ε� m
ε
sε
E ¼ffiffiffiffiffiffiffiffiffiffiffiffiffiffi1� h2
p� Z
ε
such that the total variance of the environmental effect is 1 – h2.
We then define the total liability as
L ¼ffiffiffiffiffih2
p� ZX þ
ffiffiffiffiffiffiffiffiffiffiffiffiffiffi1� h2
p� Z
ε
¼ Gþ E:
We assigned 10,000 European individuals at the most extreme
end of the liability threshold ‘‘case’’ status assuming a prevalence
of 5%. We randomly assigned 10,000 different European individ-
uals ‘‘control’’ status. We ran a GWAS with these 10,000 European
(B, D, and F) Local ancestry karyograms for representative PEL indAmerican components shown.(C, E, and G) Ancestry-specific PCA applied to admixed haploid gepopulations from 1000 Genomes (where possible) for (C) African trnumber of admixed samples that constituted major outliers from thASW sample (NA20314) and (E) eight samples, including three ACB
Th
case subjects and 10,000 European control subjects, computing
Fisher’s exact test for all sites withMAF> 0.01. As before for empir-
ical polygenic risk score calculations from real GWAS summary
statistics, we clumped these SNPs into LD blocks for all sites with
p% 1 3 10�2, and R2 % 0.5 in Europeans within a window size of
250 kb. We used these SNPs to compute inferred polygenic risk
scores as before, summing the product of the log odds ratio and ge-
notype for the true polygenic risk in a cohort of 10,000 simulated
European, African, and East Asian individuals (all not included in
the simulated GWAS). We compared the true versus inferred poly-
genic risk scores for these individuals across varying complexities
(m ¼ 200, 500, 1,000) and heritabilites (h2 ¼ 0.33, 0.50, 0.67).
Results
Genetic Diversity within and between Populations in the
Americas
We first assessed the overall diversity at the global and
sub-continental level of the 1000 Genomes Project
(phase 3) populations19 using a likelihood model via
ADMIXTURE77 and PCA78 (Figures S1 and S2). The six pop-
ulations from the Americas demonstrate considerable con-
tinental admixture, with genetic ancestry primarily from
Europe, Africa, and the Americas, recapitulating previously
observed population structure.19 To quantify continental
genetic diversity in these populations, we repeated the
analysis using YRI, CEU, and NAT69 samples as reference
panels (population labels and abbreviations in Table S1).
We observed widely varying continental admixture contri-
butions in the six populations from the Americas at K ¼ 3
(Figure 1A and Table S2). For example, when compared to
the ASW, the ACB have a higher proportion of African
ancestry (m ¼ 0.88, 95% CI ¼ [0.87–0.89] versus m ¼ 0.76,
95% CI ¼ [0.73–0.78]; two-sided t test p ¼ 3.0 3 10�13)
and a smaller proportion of EUR and NAT ancestry. The
PEL have more NAT ancestry than all of the other AMR
populations (m ¼ 0.77, 95% CI ¼ [0.75–0.80] versus CLM:
m ¼ 0.26, 95% CI ¼ [0.24, 0.27], p ¼ 2.9 3 10�95; PUR:
m ¼ 0.13, 95% CI ¼ [0.12, 0.13], p ¼ 4.8 3 10�93; and
MXL: m ¼ 0.47, 95% CI ¼ [0.43, 0.50], p ¼ 1.7 3 10�28)
ascertained in 1000 Genomes.
We explored the origin of the subcontinental-level
ancestry from recently admixed individuals by iden-
tifying local ancestry tracts26,32,71,79 (Material and
Methods, Figure S3). As proxy sources of populations for
the recent admixture, we used EUR and AFR continental
samples from the 1000 Genomes Project as well as NAT
samples genotyped previously.69 Concordance between
global ancestry estimates inferred using ADMIXTURE at
K ¼ 5 and RFMix was typically high (Pearson’s correla-
tion R98%, see Figure S4). Using Tracts,72 we modeled
ividual HG01893 with (B) African, (D) European, and (F) Native
nomes as well as ancestrally homogeneous continental referenceacts, (E) European tracts, and (G) Native American tracts. A smalle ancestry-specific PCA analysis were removed, including (C) one, two ASW, one PEL, and two PUR samples.
e American Journal of Human Genetics 100, 1–15, April 6, 2017 5
Please cite this article in press as: Martin et al., Human Demographic History Impacts Genetic Risk Prediction across Diverse Populations,The American Journal of Human Genetics (2017), http://dx.doi.org/10.1016/j.ajhg.2017.03.004
the length distribution of the AFR, EUR, and NAT tracts to
infer that admixing began ~12 and ~8 generations ago in
the PEL and ACB populations, respectively (Figure S5),
consistent with previous estimates from other populations
from the Americas.44,72,32
We further investigated the subcontinental ancestry of
admixed populations from the Americas one ancestry at
a time using a version of PCA modified to handle highly
masked data (ancestry-specific or AS-PCA) as implemented
in PCAmask.32 Example ancestry tracts in a PEL individual
subset to AFR, EUR, and NAT components are shown in
Figures 1B, 1D, and 1F, respectively. Consistent with previ-
ous observations, the inferred European tracts in Hispanic/
Latino populations most closely resemble southern Euro-
pean IBS and TSI populations with some additional
drift32 (Figure 1E). The European tracts of the PUR are
more differentiated compared to the CLM, MXL, and PEL
populations, consistent with sex bias (Figure S6 and Table
S3) and excess drift from founder effects in this island pop-
ulation.32 In contrast to the southern European tracts from
the Hispanic/Latino populations, the African descent pop-
ulations in the Americas have European admixture that
more closely resembles the northwestern CEU and GBR
European populations. The clusters are less distinct, owing
to lower overall fractions of European ancestry, but the
European components of the Hispanic/Latino and African
American populations are significantly different (Wil-
coxon rank sum test p ¼ 2.4 3 10�60).
The ability to localize aggregated ancestral genomic
tracts enables insights into the evolutionary origins of
admixed populations. To disentangle whether the consid-
erable Native American ancestry in the ASW individuals
arose from recent admixture with Hispanic/Latino individ-
uals or recent admixture with indigenous Native American
populations, we queried the European tracts. We find that
the European tracts of all ASW individuals with consider-
able Native American ancestry are well within the ASW
cluster and project closer in Euclidean distance with AS-
PC1 and AS-PC2 to northwestern Europe than the Euro-
pean tracts from Hispanic/Latino samples (p ¼ 1.15 3
10�3), providing support for the latter hypothesis and
providing regional nuance to previous findings.44
We also investigated the African origin of the admixed
AFR/AMR populations (ACB and ASW), as well as the
Native American origin of the Hispanic/Latino popula-
tions (CLM, MXL, PEL, and PUR). The African tracts of
ancestry from the AFR/AMR populations project closer to
the YRI and ESN of Nigeria than the GWD, MSL, and
LWK populations (Figure 1C). This is consistent with slave
records and previous genome-wide analyses of African
Americans indicating that most sharing occurred in West
and West-Central Africa.80–82 There are subtle differences
between the African origins of the ACB and ASW popula-
tions (e.g., difference in distance from YRI on AS-PC1
and AS-PC2 p ¼ 6.4 3 10�6), likely due either to mild
island founder effects in the ACB samples or differences
in African source populations for enslaved Africans who
6 The American Journal of Human Genetics 100, 1–15, April 6, 2017
remained in Barbados versus those who were brought
to the USA. The Native tracts of ancestry from the AMR
populations first separate the southernmost PEL popula-
tions from the CLM, MXL, and PUR on AS-PC1, then
separate the northernmost MXL from the CLM and
PUR on AS-PC2, consistent with a north-south cline of
divergence among indigenous Native American ancestry
(Figure 1G).32,83
Impact of Continental and Sub-continental Diversity on
Disease Variant Mapping
To investigate the role of ancestry in phenotype interpreta-
tion from genetic data, we assessed diversity across popula-
tions and local ancestries for recently admixed populations
across the whole genome and sites from two reference da-
tabases: the GWAS catalog and ClinVar pathogenic and
likely pathogenic sites. We recapitulate results showing
that there is less variation across the genome (both
genome-wide and on the Affymetrix 6.0 GWAS array sites
used in local ancestry calling) in out-of-Africa versus Afri-
can populations, but that GWAS variants are more poly-
morphic in European and Hispanic/Latino populations
(Figures S7A, S7B, S8A, and S8B).We use a normalizedmea-
sure of the minor allele frequency, an indicator of the
amount of diversity captured in a population, to obtain a
background coverage of each population, as done previ-
ously (e.g., Figure S4 from Auton et al.19). We show that
the Affymetrix 6.0 array has a slight European bias (Figures
S5A and S6A).We compared the site frequency spectrum of
variants across the genome versus at GWAS catalog sites
and identify elevated allele frequencies at GWAS catalog
loci, particularly in populations with more European
ancestry (e.g., the EUR, AMR, and SAS super populations,
Figures S5C and S5D).We further compared heterozygosity
(estimated here as 2pq) and the site frequency spectrum in
recently admixed populations across diploid and haploid
local ancestry tracts, respectively. Sites in the GWAS cata-
log and ClinVar are more and less common than
genome-wide variants, respectively (Figure 2). Whereas
heterozygosity across the whole genome is highest in Afri-
can ancestry tracts, it is consistently the greatest in Euro-
pean ancestry tracts across these databases (Figures 2,
S8C, and S8D), reflecting a strong bias toward European
study participants.1–4,19,84 These results highlight imbal-
ances in genome interpretability across local ancestry
tracts in recently admixed populations and the utility of
analyzing these variants jointly with these ancestry tracts
over genome-wide ancestry estimates alone.
We also assessed imputation accuracy across the 3-way
admixed populations from the Americas (CLM, MXL,
PEL, PUR) for two arrays: the Illumina OmniExpress and
the Affymetrix Axiom World Array LAT. Imputation accu-
racy was estimated as the correlation (r2) between the
original genotypes and the imputed dosages. For both
array designs, imputation accuracy across all minor allele
frequency (MAF) bins was highest for populations with
the largest proportion of European ancestry (PUR) and

0.0
0.1
0.2
0.3
Reference AFR_AFR EUR_EUR NAT_NATDiploid ancestry
2pq
PopulationYRI
CEU
CHB
JPT
ACB
ASW
CLM
MXL
PEL
PUR
GWAS catalog
0.000
0.005
0.010
0.015
0.020
Reference AFR_AFR EUR_EUR NAT_NATDiploid ancestry
2pq
PopulationYRI
CEU
CHB
JPT
ACB
ASW
CLM
MXL
PEL
PUR
ClinVar
0.00
0.01
0.02
0.03
0.04
Reference AFR_AFR EUR_EUR NAT_NATDiploid ancestry
2pq
PopulationYRI
CEU
CHB
JPT
ACB
ASW
CLM
MXL
PEL
PUR
Whole genomeA
B
C
Figure 2. Heterozygosity by Continentaland Diploid Local AncestryHeterozygosity, estimated here as 2pq, iscalculated in admixed populations stratifiedby diploid local ancestry in (A) the wholegenome, (B) sites from the GWAS catalog,and (C) sites from ClinVar classified as‘‘pathogenic’’ or ‘‘likely pathogenic.’’ Themean and 95% confidence intervals werecalculated by bootstrapping 1,000 times.Populations not shown in a given panelhave too few diploid ancestry tracts overlap-ping sites to calculate heterozygosity.
Please cite this article in press as: Martin et al., Human Demographic History Impacts Genetic Risk Prediction across Diverse Populations,The American Journal of Human Genetics (2017), http://dx.doi.org/10.1016/j.ajhg.2017.03.004
lowest for populations with the largest proportion of
Native American ancestry (PEL, Figures S9A and S9B). We
also stratified imputation accuracy by local ancestry tract
diplotype within the Americas. Consistently, tracts with
at least one Native American ancestry tract had lower
imputation accuracy when compared to tracts with only
European and/or African ancestry (Figures 3 and S10).
Transferability of GWAS Findings across Populations
To quantify the transferability of European-biased genetic
studies to other populations, we next used published
GWAS summary statistics to infer polygenic risk scores48
across populations for well-studied traits, including
height,10 waist-hip ratio,85 schizophrenia,11 type II dia-
betes,86,87 and asthma88 (Figures 4A–4D and S11, Material
and Methods). Most of these summary statistics are
derived from studies with primarily European cohorts,
although GWASs of type II diabetes have been performed
The American Journal of
in both European-specific cohorts as
well as across multi-ethnic cohorts.
We identify clear directional inconsis-
tencies in these inferred scores. For
example, although the height sum-
mary statistics show the expected
southern/northern cline of increasing
European height (FIN, CEU, and
GBR populations have significantly
higher polygenic risk scores than IBS
and TSI, p ¼ 1.5 3 10�75, Figure S9A),
polygenic scores for height across
super populations show biased predic-
tions; the African populations sampled
are genetically predicted to be consid-
erably shorter than all Europeans and
minimally taller than East Asians
(Figure 4A), which contradicts empir-
ical observations (with the exception
of some indigenous pygmy/pygmoid
populations).89,90 Additionally, poly-
genic risk scores for schizophrenia,
while at a similar prevalence across
populations where it has been well
studied91 and sharing significant ge-
netic risk across populations,92 shows
considerably decreased scores in Africans compared
to all other populations (Figure 4B). Lastly, the rela-
tive order of polygenic risk scores computed for type II
diabetes across populations differs depending on
whether the summary statistics are derived from a Euro-
pean-specific (Figure 4C) or multi-ethnic (Figure 4D)
cohort.
Ancestry-Specific Biases in Polygenic Risk Score
Estimates
We performed coalescent simulations to determine how
GWAS signals discovered in one ancestral case/control
cohort (i.e., ‘‘single-ancestry’’ GWAS) are expected to
impact polygenic risk score estimates in other populations
under neutrality using summary statistics (for details, see
Material and Methods). In brief, we simulated variants
according to a previously published demographic model
inferred from Africans, East Asians, and Europeans.14 We
Human Genetics 100, 1–15, April 6, 2017 7

Figure 3. Imputation Accuracy by Local Ancestry in the AmericasAccuracy was assessed via a leave-one-out strategy, stratified by diploid local ancestry on chromosome 9 for the Illumina OmniExpressgenotyping array. Dashed lines indicate heterozygous diploid ancestry, and solid lines show homozygous diploid ancestry.
Please cite this article in press as: Martin et al., Human Demographic History Impacts Genetic Risk Prediction across Diverse Populations,The American Journal of Human Genetics (2017), http://dx.doi.org/10.1016/j.ajhg.2017.03.004
specified ‘‘causal’’ alleles and effect sizes randomly, such
that each causal variant has evolved neutrally and has a
mean effect of zero with the standard deviation equal
to the global heritability divided by number of causal
variants. We computed the true polygenic risk for each in-
dividual as the product of the estimated effect sizes and
genotypes, then standardized the scores across all individ-
uals. We calculated the total liability as the sum of the
genetic and random environmental contributions, then
identified 10,000 European case subjects with the most
extreme liabilities and 10,000 other European control sub-
jects. We computed Fisher’s exact tests with this European
case-control cohort, then quantified inferred polygenic
risk scores as the sum of the product of genotypes and
log odds ratios for 10,000 samples per population not
included in the GWAS.
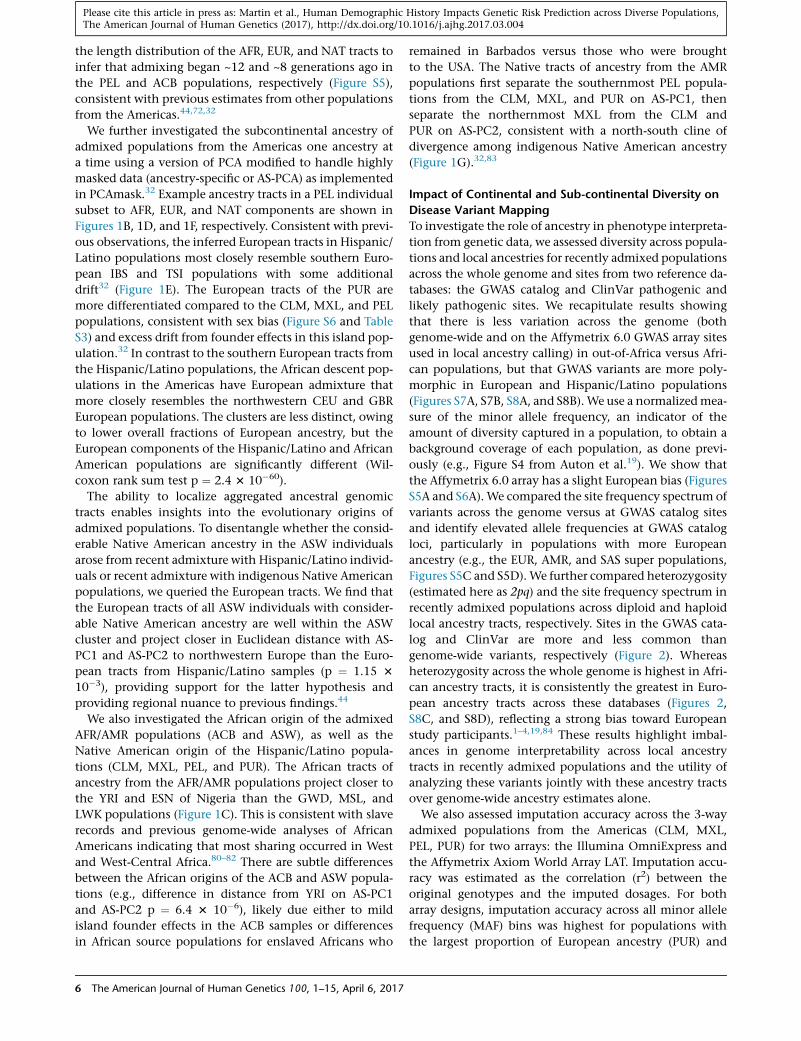
In our simulations and consistent with realistic coales-
cent models, most variants are rare and population spe-
cific; ‘‘causal’’ variants are sampled from the global site fre-
quency spectrum, resulting in subtle differences in true
polygenic risk across populations (Figures S12, 5A, and
5B). We mirrored standard practices for performing a
GWAS and computing polygenic risk scores (see above
and Material and Methods). While causal variants in our
simulations are drawn from the global site frequency spec-
trum and are therefore mostly rare, inferred scores are
derived specifically from common variants that are typi-
cally much more common in the study population than
elsewhere (here Europeans with case/control MAF R
0.01). Consequently, while the distribution of mean true
8 The American Journal of Human Genetics 100, 1–15, April 6, 2017
polygenic risk across simulation runs for each population
are not significantly different (Figure 5A), the inferred
risk is less than zero in Europeans (p ¼ 1.9 3 10�54, 95%
CI ¼ [�84.3, �67.4]), slightly less than zero in East Asians
(p ¼ 5.9 3 10�5, 95% CI ¼ [�19.1, �6.6]), and not sig-
nificantly different from zero in Africans (Figure 5B); the
variance in inferred risk scores, a proxy for the fraction of
heritable variation explained, also decreases with this
trend. Specifically, when h2 ¼ 0.67 and m ¼ 1,000 causal
markers, we find that the true and inferred polygenic risk
scores in the EUR population are significantly correlated
(i.e., non-zero, mean r¼ 0.59, p< 13 10�200), but the cor-
relations in EAS and AFR populations are significantly less
than in EUR (r ¼ 0.35 and p ¼ 1.5 3 10�48, r ¼ 0.22 and p
< 13 10�200, respectively). Because of allele frequency dif-
ferences, number of SNPs, and inferred effect size differ-
ences along the frequency spectrum, the scale is orders of
magnitude different between the true and inferred raw,
unstandardized scores, cautioning that while they are
informative on a relative scale (Figures 5C and S11), their
absolute scale should not be over interpreted. The inferred
risk difference between populations is driven by the
increased power to detect minor risk alleles rather than
protective alleles in the study population,93 given the dif-
ferential selection of case and control subjects in the liabil-
ity threshold model. We demonstrate this empirically in
these neutral simulations within the European population
(Figure S14A), indicating that this phenomenon occurs
even in the absence of population structure and when
case and control cohort sizes are equal.

A B
C D
Figure 4. Biased Genetic Discoveries In-fluence Disease Risk InferencesInferred and standardized polygenic riskscores across all individuals and coloredby population for (A) height based on sum-mary statistics from Wood et al.,10 (B)schizophrenia based on summary statisticsfrom the Schizophrenia Working Group ofthe Psychiatric Genomics Consortium,11
(C) type II diabetes summary statisticsderived from a European cohort fromGaulton et al.,86 and (D) type II diabetessummary statistics derived from a multi-ethnic cohort from Mahajan et al.87
Please cite this article in press as: Martin et al., Human Demographic History Impacts Genetic Risk Prediction across Diverse Populations,The American Journal of Human Genetics (2017), http://dx.doi.org/10.1016/j.ajhg.2017.03.004
We find that the correlation between true and inferred
polygenic risk is generally low (Figures 5C and S13), con-
sistent with limited variance explained by polygenic
risk scores from GWASs of these cohort sizes for height
(e.g., ~10% of variance explained for a cohort of size
183,72763) and schizophrenia (e.g., ~7% variance ex-
plained for a cohort of size 36,989 case subjects and
113,075 control subjects11). Low correlations in our simu-
lations are most likely because common tag variants are a
poor proxy for rare causal variants. As expected, correla-
tions between true and inferred risk within populations
are typically highest in the European population (i.e., the
population in which variants were discovered, Figures 5A
and S13). To quantify the differential prediction accuracy
of polygenic risk scores across populations, we also eval-
uate the log odds ratio of being a case subject compared
to a control subject across deciles of inferred polygenic
risk in each population. We identify greater power to
discern between case and control subjects in the EUR dis-
covery population relative to the AFR and EAS populations
(i.e., more heritable variation explained, as evidenced by a
steeper slope) (Figure S14B). Across all populations, the
mean Spearman correlations between true and inferred
polygenic risk increase with increasing heritability while
the standard deviations of these correlations significantly
decrease (p ¼ 0.05); however, there is considerable
within-population heterogeneity resulting in high varia-
tion in scores across all populations. We find that in these
The American Journal of H
neutral simulations, a polygenic risk
score bias in essentially any direction
is possible even when choosing the
exact same causal variants and herita-
bility and varying only fixed effect
size (i.e., inferred polygenic risk in
Europeans can be higher, lower, or in-
termediate compared to true risk rela-
tive to East Asians or Africans, Figures
S12 and 5B).
Discussion
To date, GWASs have been per-
formed opportunistically in primar-
ily single-ancestry European cohorts, and an open ques-
tion remains about their biomedical relevance for
disease associations in other ancestries. As studies gain
power by increasing sample sizes, effect size estimates
become more precise and novel associations at lower fre-
quencies are feasible. However, rare variants are largely
population-private, and their effects are unlikely to trans-
fer to new populations. Because linkage disequilibrium
and allele frequencies vary across ancestries, effect size
estimates from diverse cohorts are typically more precise
than from single-ancestry cohorts (and often tempered),5
and the resolution of causal variant fine-mapping is
considerably improved.87 Across a range of genetic archi-
tectures, diverse cohorts provide the opportunity to
reduce false positives. At the Mendelian end of the spec-
trum, for example, disentangling risk variants with
incomplete penetrance from benign false positives and
localizing functional effects in genes is much more
feasible with large diverse population cohorts than with
single-ancestry analyses.94 Multiple false positive reports
of pathogenic variants causing hypertrophic cardiomy-
opathy, a disease with relatively simple genomic architec-
ture, have been returned to individuals of African descent
or unspecified ancestry that would have been prevented
if even a small number of African American samples
were included in control cohorts.9 At the highly complex
end of the polygenicity spectrum, we and others have
shown that the utility of polygenic risk inferences and
uman Genetics 100, 1–15, April 6, 2017 9
B
A
C
Figure 5. Coalescent Simulation Framework to Generate True and Inferred Polygenic Risk ScoresResults of true and inferred polygenic risk scores, as well as their correlation, were computed via GWAS summary statistics from 10,000simulated EUR case and control subjects modeling European, East Asian, and African population history (demographic parameters arefrom Gravel et al.14).(A) The distribution ofmean true, unstandardized polygenic risk scores for each population across 500 simulations withm¼ 1,000 causalvariants and h2 ¼ 0.67.(B) The distribution of mean inferred, unstandardized polygenic risk for the same simulation parameters as in (A) (center) and standard-ized true versus inferred polygenic risk scores for three different coalescent simulation replicates showing 10,000 randomly drawn sam-ples from each population not included as case or control subjects (right).(C) Violin plots show Pearson’s correlation across 50 iterations per parameter set between true and inferred polygenic risk scores acrossdiffering genetic architectures, including m ¼ 200, 500, and 1,000 causal variants and h2 ¼ 0.67.
Please cite this article in press as: Martin et al., Human Demographic History Impacts Genetic Risk Prediction across Diverse Populations,The American Journal of Human Genetics (2017), http://dx.doi.org/10.1016/j.ajhg.2017.03.004
the heritable phenotypic variance explained in diverse
populations is improved with more diverse cohorts.92,95
Standard single-ancestry GWASs typically apply linear
mixed model approaches and/or incorporate principal
components as covariates to control for confounding
from population structure with primarily European-
descent cohorts.1–3 A key concern when including multi-
ple diverse populations in a GWAS is that there is
increasing likelihood of identifying false positive variants
associated with disease that are driven by allele frequency
differences across ancestries. However, previous studies
have analyzed association data for diverse ancestries and
replicated findings across ethnicities, assuaging these con-
cerns.6,87 In this study, we show that this ancestry stratifi-
cation is not continuous along the genome: long tracts of
ancestrally diverse populations present in admixed sam-
ples from the Americas are easily and accurately detected.
10 The American Journal of Human Genetics 100, 1–15, April 6, 2017
Querying population substructure within these tracts
recapitulates expected trends, e.g., European ancestry in
African Americans primarily descends from northern
Europeans in contrast to European ancestry from
Hispanic/Latinos, which primarily descends from
southern Europeans, as seen previously.44 Additionally,
population substructure follows a north-south cline in
the Native component of Hispanic/Latinos, and the
African component of admixed African descent popula-
tions in the Americas most closely resembles reference
populations from Nigeria (notwithstanding the limited
set of African populations from the 1000 Genomes Proj-
ect). Admixture mapping has been successful at large
sample sizes for identifying ancestry-specific genetic risk
factors for disease.30 Given the level of accuracy and sub-
continental resolution attained with local ancestry
tracts in admixed populations, we emphasize the utility

Please cite this article in press as: Martin et al., Human Demographic History Impacts Genetic Risk Prediction across Diverse Populations,The American Journal of Human Genetics (2017), http://dx.doi.org/10.1016/j.ajhg.2017.03.004
of a unified framework to jointly analyze genetic associa-
tions with local ancestry simultaneously.40
The transferability of GWASs is aided by the inclusion of
diverse populations.96 We have shown that European dis-
covery biases in GWASs are recapitulated in local ancestry
tracts in admixed samples. We have quantified GWAS
study biases in ancestral populations and shown that
GWAS variants are at lower frequency specifically within
African and Native tracts and higher frequency in Euro-
pean tracts in admixed American populations. Imputation
accuracy is also stratified across diverged ancestries,
including across local ancestries in admixed populations.
With decreased imputation accuracy especially on Native
American tracts, there is decreased power for potential
ancestry-specific associations. This differentially limits
conclusions for GWASs in an admixed population in a
two-pronged manner: the ability to capture variation and
the power to estimate associations.
As GWASs scale to sample sizes on the order of hundreds
of thousands to millions, genetic risk prediction accuracy
at the individual level improves.59 However, we show
that the utility of polygenic risk scores computed using
GWAS summary statistics are dependent on genetic simi-
larity to the discovery cohort. Best linear unbiased predic-
tion (BLUP) methods have been proposed to improve risk
scores, but they require access to raw genetic data typically
from very large datasets, are also dependent on LD struc-
ture in the study population, and offer only modest im-
provements in prediction accuracy.52 Furthermore, poly-
genic risk scores (PRSs) contain a mix of true positives
(which have the bias described above) and false positives
in the training GWAS. False positives, being chance statis-
tical fluctuations, do not have the same allele frequency
bias and therefore unfortunately play an outsized role in
applying a PRS in a new population.
We have demonstrated that polygenic risk scores
computed via current standard methods with summary
statistics from a single-ancestry discovery cohort have
numerous problems: differences in polygenic risk scores
across populations are significant but not supported by
epidemiological or anthropometric studies of the same
traits, and directionality biases in polygenic risk scores
across populations are unpredictable. Our coalescent simu-
lations recapitulate these results and show that across rep-
licates (i.e., traits, and thus not necessarily within a single
trait), cross-population prediction accuracy is diminished
with increasing divergence from the discovery cohort.
These simulations provide further insight into directional
inconsistencies in inferred polygenic risk scores with the
same demographic model across replicate simulations,
indicating that different traits are likely to suffer from
biases that cannot be adjusted, e.g., using prinicipal com-
ponents alone. Directional selection is expected to bias
polygenic risk inferences even more. Because biases arise
from genetic drift alone, we recommend (1) avoiding inter-
pretations from polygenic risk score differences extrapo-
lated across populations, as these are likely confounded
The
by latent population structure that is not properly cor-
rected for with current standard methods, (2) mean-
centering polygenic risk scores for each population, and
(3) computing polygenic risk scores in populations with
similar demographic histories as the study sample to
ensure maximal predictive power. Further, additional
methods that account for local ancestry in genetic risk
prediction to incorporate different ancestral linkage
disequilibrium and allele frequencies are needed. This
study demonstrates the utility of disentangling ancestry
tracts in recently admixed populations for inferring recent
demographic history and identifying ancestry-stratified
analytical biases; we also motivate the need to include
more ancestrally diverse cohorts in GWASs to ensure that
health disparities arising from genetic risk prediction do
not become pervasive in individuals of admixed and
non-European descent.
Supplemental Data
Supplemental Data include 14 figures and 4 tables and can be
found with this article online at http://dx.doi.org/10.1016/j.
ajhg.2017.03.004.
Conflicts of Interest
C.D.B. is amember of the scientific advisory boards for Liberty Bio-
security, Personalis, 23andMe Roots into the Future, Ancestry.
com, IdentifyGenomics, and Etalon and is a founder of CDB
Consulting. C.R.G. owns stock in 23andMe. M.J.D. is a member
the scientific advisory board for Ancestry.com. E.E.K. and C.R.G.
are members of the scientific advisory board for Encompass Biosci-
ences. E.E.K. consults for Illumina. B.M.N. is a member of the sci-
entific advisory board for Deep Genomics.
Acknowledgments
We thank Suyash Shringarpure, Brian Maples, Andres Moreno-
Estrada, Danny Park, Noah Zaitlen, Alexander Gusev, and Alkes
Price for helpful discussions/feedback. We thank Verneri Antilla
for providingGWAS summary statistics.We thank Jerome Kelleher
for several conversations about msprime, providing example
scripts, and implementing new simulation capabilities. This
work was supported by funds from several grants: the National
Human Genome Research Institute under award numbers
U01HG009080 (E.E.K., C.D.B., C.R.G.), U01HG007419 (C.D.B.,
C.R.G., G.L.W.), U01HG007417 (E.E.K.), U01HG005208 (M.J.D.),
T32HG000044 (C.R.G.), and R01GM083606 (C.D.B.), the
National Institute of General Medical Sciences under award num-
ber T32GM007790 (A.R.M.) at the National Institute of Health, the
National Institute for Mental Health 5U01MH094432-02 (R.G.W.,
M.J.D.), the Directorate of Mathematical and Physical Sciences
award 1201234 (S.G., C.D.B.) at the National Science Foundation,
the Canadian Institutes of Health Research through the Canada
Research Chair program and operating grant MOP-136855
(S.G.), and a Sloan Research Fellowship (S.G.).
Received: November 23, 2016
Accepted: March 10, 2017
Published: March 30, 2017
American Journal of Human Genetics 100, 1–15, April 6, 2017 11

Please cite this article in press as: Martin et al., Human Demographic History Impacts Genetic Risk Prediction across Diverse Populations,The American Journal of Human Genetics (2017), http://dx.doi.org/10.1016/j.ajhg.2017.03.004
Web Resources
ancestry_pipeline, https://github.com/armartin/ancestry_pipeline/
Local ancestry calls, https://personal.broadinstitute.org/armartin/
tgp_admixture/
msprime, https://github.com/jeromekelleher/msprime
PCAmask, https://sites.google.com/site/pcamask/dowload
Phased 1000 Genomes haplotypes, ftp://ftp-trace.ncbi.nih.gov/
1000genomes/ftp/release/20130502/supporting/
shapeit2_scaffolds/wgs_gt_scaffolds/
Tracts, https://github.com/sgravel/tracts
References
1. Need, A.C., and Goldstein, D.B. (2009). Next generation dis-
parities in human genomics: concerns and remedies. Trends
Genet. 25, 489–494.
2. Bustamante, C.D., Burchard, E.G., and De la Vega, F.M. (2011).
Genomics for the world. Nature 475, 163–165.
3. Petrovski, S., and Goldstein, D.B. (2016). Unequal representa-
tion of genetic variation across ancestry groups creates health-
care inequality in the application of precision medicine.
Genome Biol. 17, 157.
4. Popejoy, A.B., and Fullerton, S.M. (2016). Genomics is failing
on diversity. Nature 538, 161–164.
5. Carlson, C.S., Matise, T.C., North, K.E., Haiman, C.A., Fesin-
meyer, M.D., Buyske, S., Schumacher, F.R., Peters, U., France-
schini, N., Ritchie, M.D., et al.; PAGE Consortium (2013).
Generalization and dilution of association results from Euro-
pean GWAS in populations of non-European ancestry: the
PAGE study. PLoS Biol. 11, e1001661.
6. Waters, K.M., Stram, D.O., Hassanein, M.T., Le Marchand, L.,
Wilkens, L.R., Maskarinec, G., Monroe, K.R., Kolonel, L.N.,
Altshuler,D.,Henderson,B.E., andHaiman,C.A. (2010).Consis-
tent association of type 2 diabetes risk variants found in euro-
peans in diverse racial and ethnic groups. PLoS Genet. 6, 6.
7. Hindorff, L.A., Sethupathy, P., Junkins, H.A., Ramos, E.M.,
Mehta, J.P., Collins, F.S., and Manolio, T.A. (2009). Potential
etiologic and functional implications of genome-wide associa-
tion loci for human diseases and traits. Proc. Natl. Acad. Sci.
USA 106, 9362–9367.
8. Scutari, M., Mackay, I., and Balding, D. (2016). Using genetic
distance to infer the accuracy of genomic prediction. PLoS
Genet. 12, e1006288.
9. Manrai, A.K., Funke, B.H., Rehm, H.L., Olesen, M.S., Maron,
B.A., Szolovits, P., Margulies, D.M., Loscalzo, J., and Kohane,
I.S. (2016). Genetic misdiagnoses and the potential for health
disparities. N. Engl. J. Med. 375, 655–665.
10. Wood, A.R., Esko, T., Yang, J., Vedantam, S., Pers, T.H., Gustafs-
son, S., Chu, A.Y., Estrada, K., Luan, J., Kutalik, Z., et al.;
Electronic Medical Records and Genomics (eMEMERGEGE)
Consortium; MIGen Consortium; PAGEGE Consortium; and
LifeLines Cohort Study (2014). Defining the role of common
variation in the genomic and biological architecture of adult
human height. Nat. Genet. 46, 1173–1186.
11. Schizophrenia Working Group of the Psychiatric Genomics
Consortium (2014). Biological insights from 108 schizo-
phrenia-associated genetic loci. Nature 511, 421–427.
12. Munoz, M., Pong-Wong, R., Canela-Xandri, O., Rawlik, K.,
Haley, C.S., and Tenesa, A. (2016). Evaluating the contribution
of genetics and familial shared environment to common dis-
ease using the UK Biobank. Nat. Genet. 48, 980–983.
12 The American Journal of Human Genetics 100, 1–15, April 6, 2017
13. Mathieson, I., and McVean, G. (2012). Differential con-
founding of rare and common variants in spatially structured
populations. Nat. Genet. 44, 243–246.
14. Gravel, S., Henn, B.M., Gutenkunst, R.N., Indap, A.R., Marth,
G.T., Clark, A.G., Yu, F., Gibbs, R.A., Bustamante, C.D.; and
1000 Genomes Project (2011). Demographic history and
rare allele sharing among human populations. Proc. Natl.
Acad. Sci. USA 108, 11983–11988.
15. Walter, K., Min, J.L., Huang, J., Crooks, L., Memari, Y.,
McCarthy, S., Perry, J.R., Xu, C., Futema, M., Lawson, D.,
et al.; UK10K Consortium (2015). The UK10K project iden-
tifies rare variants in health and disease. Nature 526, 82–90.
16. Novembre, J., Johnson, T., Bryc, K., Kutalik, Z., Boyko, A.R.,
Auton, A., Indap, A., King, K.S., Bergmann, S., Nelson, M.R.,
et al. (2008). Genes mirror geography within Europe. Nature
456, 98–101.
17. Do, R., Kathiresan, S., and Abecasis, G.R. (2012). Exome
sequencing and complex disease: practical aspects of rare
variant association studies. Hum. Mol. Genet. 21 (R1), R1–R9.
18. Lek, M., Karczewski, K.J., Minikel, E.V., Samocha, K.E., Banks,
E., Fennell, T., O’Donnell-Luria, A.H., Ware, J.S., Hill, A.J.,
Cummings, B.B., et al.; Exome Aggregation Consortium
(2016). Analysis of protein-coding genetic variation in
60,706 humans. Nature 536, 285–291.
19. Auton, A., Brooks, L.D., Durbin, R.M., Garrison, E.P., Kang,
H.M., Korbel, J.O., Marchini, J.L., McCarthy, S., McVean,
G.A., Abecasis, G.R.; and 1000 Genomes Project Consortium
(2015). A global reference for human genetic variation. Nature
526, 68–74.
20. Tennessen, J.A., Bigham, A.W., O’Connor, T.D., Fu,W., Kenny,
E.E., Gravel, S., McGee, S., Do, R., Liu, X., Jun, G., et al.; Broad
GO; Seattle GO; andNHLBI Exome Sequencing Project (2012).
Evolution and functional impact of rare coding variation from
deep sequencing of human exomes. Science 337, 64–69.
21. Grossman, S.R., Shlyakhter, I., Karlsson, E.K., Byrne, E.H., Mo-
rales, S., Frieden, G., Hostetter, E., Angelino, E., Garber, M.,
Zuk, O., et al. (2010). A composite of multiple signals distin-
guishes causal variants in regions of positive selection. Science
327, 883–886.
22. MacArthur, D.G., Balasubramanian, S., Frankish, A., Huang,
N., Morris, J., Walter, K., Jostins, L., Habegger, L., Pickrell,
J.K., Montgomery, S.B., et al.; 1000 Genomes Project
Consortium (2012). A systematic survey of loss-of-function
variants in human protein-coding genes. Science 335,
823–828.
23. Lohmueller, K.E., Indap, A.R., Schmidt, S., Boyko, A.R., Her-
nandez, R.D., Hubisz, M.J., Sninsky, J.J., White, T.J., Sunyaev,
S.R., Nielsen, R., et al. (2008). Proportionally more deleterious
genetic variation in European than in African populations.
Nature 451, 994–997.
24. Fu,W., Gittelman, R.M., Bamshad,M.J., and Akey, J.M. (2014).
Characteristics of neutral and deleterious protein-coding vari-
ation among individuals and populations. Am. J. Hum. Genet.
95, 421–436.
25. Simons, Y.B., Turchin, M.C., Pritchard, J.K., and Sella, G.
(2014). The deleterious mutation load is insensitive to recent
population history. Nat. Genet. 46, 220–224.
26. Price, A.L., Tandon, A., Patterson, N., Barnes, K.C., Rafaels, N.,
Ruczinski, I., Beaty, T.H., Mathias, R., Reich, D., and Myers, S.
(2009). Sensitive detection of chromosomal segments of
distinct ancestry in admixed populations. PLoS Genet. 5,
e1000519.

Please cite this article in press as: Martin et al., Human Demographic History Impacts Genetic Risk Prediction across Diverse Populations,The American Journal of Human Genetics (2017), http://dx.doi.org/10.1016/j.ajhg.2017.03.004
27. Pasaniuc, B., Zaitlen, N., Lettre, G., Chen, G.K., Tandon, A.,
Kao, W.H.L., Ruczinski, I., Fornage, M., Siscovick, D.S., Zhu,
X., et al. (2011). Enhanced statistical tests for GWAS in ad-
mixed populations: assessment using African Americans
from CARe and a Breast Cancer Consortium. PLoS Genet. 7,
e1001371.
28. Fejerman, L., Chen, G.K., Eng, C., Huntsman, S., Hu, D., Wil-
liams, A., Pasaniuc, B., John, E.M., Via, M., Gignoux, C., et al.
(2012). Admixture mapping identifies a locus on 6q25 associ-
ated with breast cancer risk in US Latinas. Hum. Mol. Genet.
21, 1907–1917.
29. Fejerman, L., Ahmadiyeh, N., Hu, D., Huntsman, S., Beckman,
K.B., Caswell, J.L., Tsung, K., John, E.M., Torres-Mejia, G., Car-
vajal-Carmona, L., et al.; COLUMBUS Consortium (2014).
Genome-wide association study of breast cancer in Latinas
identifies novel protective variants on 6q25. Nat. Commun.
5, 5260.
30. Freedman, M.L., Haiman, C.A., Patterson, N., McDonald, G.J.,
Tandon, A., Waliszewska, A., Penney, K., Steen, R.G., Ardlie,
K., John, E.M., et al. (2006). Admixture mapping identifies
8q24 as a prostate cancer risk locus in African-American
men. Proc. Natl. Acad. Sci. USA 103, 14068–14073.
31. Bhatia, G., Patterson, N., Pasaniuc, B., Zaitlen, N., Genovese,
G., Pollack, S., Mallick, S., Myers, S., Tandon, A., Spencer, C.,
et al. (2011). Genome-wide comparison of African-ancestry
populations from CARe and other cohorts reveals signals of
natural selection. Am. J. Hum. Genet. 89, 368–381.
32. Moreno-Estrada, A., Gravel, S., Zakharia, F., McCauley, J.L.,
Byrnes, J.K., Gignoux, C.R., Ortiz-Tello, P.A., Martınez, R.J.,
Hedges, D.J., Morris, R.W., et al. (2013). Reconstructing the
population genetic history of the Caribbean. PLoS Genet. 9,
e1003925.
33. Bryc, K., Velez, C., Karafet, T., Moreno-Estrada, A., Reynolds,
A., Auton, A., Hammer, M., Bustamante, C.D., and Ostrer, H.
(2010). Colloquium paper: genome-wide patterns of popula-
tion structure and admixture among Hispanic/Latino popula-
tions. Proc. Natl. Acad. Sci. USA 107 (Suppl 2 ), 8954–8961.
34. Pritchard, J.K., Stephens, M., and Donnelly, P. (2000). Infer-
ence of population structure using multilocus genotype
data. Genetics 155, 945–959.
35. Tang, H., Peng, J., Wang, P., and Risch, N.J. (2005). Estimation
of individual admixture: analytical and study design consider-
ations. Genet. Epidemiol. 28, 289–301.
36. Alexander, D.H., Novembre, J., and Lange, K. (2009). Fast
model-based estimation of ancestry in unrelated individuals.
Genome Res. 19, 1655–1664.
37. Price, A.L., Zaitlen, N.A., Reich, D., and Patterson, N. (2010).
New approaches to population stratification in genome-wide
association studies. Nat. Rev. Genet. 11, 459–463.
38. Mathieson, I., and McVean, G. (2014). Demography and the
age of rare variants. PLoS Genet. 10, e1004528.
39. O’Connor, T.D., Fu, W., Mychaleckyj, J.C., Logsdon, B., Auer,
P., Carlson, C.S., Leal, S.M., Smith, J.D., Rieder, M.J., Bamshad,
M.J., et al.; NHLBI GO Exome Sequencing Project; and ESP
Population Genetics and Statistical Analysis Working Group,
Emily Turner (2015). Rare variation facilitates inferences of
fine-scale population structure in humans. Mol. Biol. Evol.
32, 653–660.
40. Szulc, P., Bogdan, M., Frommlet, F., and Tang, H. (2016). Joint
genotype- and ancestry-based genome-wide association
studies in admixed populations. bioRxiv. http://dx.doi.org/
10.1101/062554.
The
41. Conomos, M.P., Reiner, A.P., Weir, B.S., and Thornton, T.A.
(2016). Model-free estimation of recent genetic relatedness.
Am. J. Hum. Genet. 98, 127–148.
42. Zaitlen, N., Pasxaniuc, B., Gur, T., Ziv, E., and Halperin, E.
(2010). Leveraging genetic variability across populations for
the identification of causal variants. Am. J. Hum. Genet. 86,
23–33.
43. Genovese, G., Handsaker, R.E., Li, H., Kenny, E.E., and McCar-
roll, S.A. (2013). Mapping the human reference genome’s
missing sequence by three-way admixture in Latino genomes.
Am. J. Hum. Genet. 93, 411–421.
44. Baharian, S., Barakatt, M., Gignoux, C.R., Shringarpure, S.,
Errington, J., Blot, W.J., Bustamante, C.D., Kenny, E.E.,
Williams, S.M., Aldrich, M.C., and Gravel, S. (2016). The great
migration and African-American genomic diversity. PLoS
Genet. 12, e1006059.
45. Reich, D., Patterson, N., Campbell, D., Tandon, A., Mazieres,
S., Ray, N., Parra, M.V., Rojas, W., Duque, C., Mesa, N., et al.
(2012). Reconstructing Native American population history.
Nature 488, 370–374.
46. Ruiz-Linares, A., Adhikari, K., Acuna-Alonzo, V., Quinto-San-
chez, M., Jaramillo, C., Arias, W., Fuentes, M., Pizarro, M.,
Everardo, P., de Avila, F., et al. (2014). Admixture in Latin
America: geographic structure, phenotypic diversity and self-
perception of ancestry based on 7,342 individuals. PLoS
Genet. 10, e1004572.
47. Moreno-Estrada, A., Gignoux, C.R., Fernandez-Lopez, J.C.,
Zakharia, F., Sikora, M., Contreras, A.V., Acuna-Alonzo, V.,
Sandoval, K., Eng, C., Romero-Hidalgo, S., et al. (2014).
Human genetics. The genetics of Mexico recapitulates Native
American substructure and affects biomedical traits. Science
344, 1280–1285.
48. Purcell, S.M., Wray, N.R., Stone, J.L., Visscher, P.M., O’Dono-
van, M.C., Sullivan, P.F., Sklar, P.; and International Schizo-
phrenia Consortium (2009). Common polygenic variation
contributes to risk of schizophrenia and bipolar disorder.
Nature 460, 748–752.
49. Yang, J., Benyamin, B., McEvoy, B.P., Gordon, S., Henders,
A.K., Nyholt, D.R., Madden, P.A., Heath, A.C., Martin, N.G.,
Montgomery, G.W., et al. (2010). Common SNPs explain a
large proportion of the heritability for human height. Nat.
Genet. 42, 565–569.
50. Yang, J., Weedon, M.N., Purcell, S., Lettre, G., Estrada, K.,
Willer, C.J., Smith, A.V., Ingelsson, E., O’Connell, J.R., Man-
gino, M., et al.; GIANT Consortium (2011). Genomic inflation
factors under polygenic inheritance. Eur. J. Hum. Genet. 19,
807–812.
51. Wray, N.R., Goddard, M.E., and Visscher, P.M. (2007). Predic-
tion of individual genetic risk to disease from genome-wide
association studies. Genome Res. 17, 1520–1528.
52. Wray, N.R., Yang, J., Hayes, B.J., Price, A.L., Goddard, M.E.,
and Visscher, P.M. (2013). Pitfalls of predicting complex traits
from SNPs. Nat. Rev. Genet. 14, 507–515.
53. Wray, N.R., Lee, S.H., Mehta, D., Vinkhuyzen, A.A., Dud-
bridge, F., and Middeldorp, C.M. (2014). Research review:
polygenic methods and their application to psychiatric traits.
J. Child Psychol. Psychiatry 55, 1068–1087.
54. Chatterjee, N., Shi, J., and Garcıa-Closas, M. (2016). Devel-
oping and evaluating polygenic risk prediction models for
stratified disease prevention. Nat. Rev. Genet. 17, 392–406.
55. Dudbridge, F. (2016). Polygenic epidemiology. Genet. Epide-
miol. 40, 268–272.
American Journal of Human Genetics 100, 1–15, April 6, 2017 13

Please cite this article in press as: Martin et al., Human Demographic History Impacts Genetic Risk Prediction across Diverse Populations,The American Journal of Human Genetics (2017), http://dx.doi.org/10.1016/j.ajhg.2017.03.004
56. So, H.C., and Sham, P.C. (2017). Exploring the predictive
power of polygenic scores derived from genome-wide associa-
tion studies: a study of 10 complex traits. Bioinformatics 33,
886–892.
57. Euesden, J., Lewis, C.M., andO’Reilly, P.F. (2015). PRSice: poly-
genic risk score software. Bioinformatics 31, 1466–1468.
58. Shi, J., Park, J.H., Duan, J., Berndt, S.T., Moy, W., Yu, K., Song,
L., Wheeler, W., Hua, X., Silverman, D., et al.; MGS (Molecular
Genetics of Schizophrenia) GWAS Consortium; GECCO
(The Genetics and Epidemiology of Colorectal Cancer
Consortium); GAME-ON/TRICL (Transdisciplinary Research
in Cancer of the Lung) GWAS Consortium; PRACTICAL
(PRostate cancer AssoCiation group To Investigate Cancer
Associated aLterations) Consortium; PanScan Consortium;
and GAME-ON/ELLIPSE Consortium (2016). Winner’s curse
correction and variable thresholding improve performance
of polygenic risk modeling based on genome-wide association
study summary-level data. PLoS Genet. 12, e1006493.
59. Dudbridge, F. (2013). Power and predictive accuracy of poly-
genic risk scores. PLoS Genet. 9, e1003348.
60. Pharoah, P.D., Antoniou, A.C., Easton, D.F., and Ponder, B.A.
(2008). Polygenes, risk prediction, and targeted prevention
of breast cancer. N. Engl. J. Med. 358, 2796–2803.
61. Evans, D.M., Visscher, P.M., and Wray, N.R. (2009). Har-
nessing the information contained within genome-wide asso-
ciation studies to improve individual prediction of complex
disease risk. Hum. Mol. Genet. 18, 3525–3531.
62. Okbay, A., Beauchamp, J.P., Fontana, M.A., Lee, J.J., Pers, T.H.,
Rietveld, C.A., Turley, P., Chen, G.B., Emilsson, V., Meddens,
S.F., et al.; LifeLines Cohort Study (2016). Genome-wide asso-
ciation study identifies 74 loci associated with educational
attainment. Nature 533, 539–542.
63. Lango Allen, H., Estrada, K., Lettre, G., Berndt, S.I., Weedon,
M.N., Rivadeneira, F., Willer, C.J., Jackson, A.U., Vedantam,
S., Raychaudhuri, S., et al. (2010). Hundreds of variants clus-
tered in genomic loci and biological pathways affect human
height. Nature 467, 832–838.
64. Bush, W.S., Sawcer, S.J., de Jager, P.L., Oksenberg, J.R., McCau-
ley, J.L., Pericak-Vance, M.A., Haines, J.L.; and International
Multiple Sclerosis Genetics Consortium (IMSGC) (2010). Evi-
dence for polygenic susceptibility to multiple sclerosis–the
shape of things to come. Am. J. Hum. Genet. 86, 621–625.
65. Stahl, E.A., Wegmann, D., Trynka, G., Gutierrez-Achury, J.,
Do, R., Voight, B.F., Kraft, P., Chen, R., Kallberg, H.J., Kurree-
man, F.A., et al.; Diabetes Genetics Replication andMeta-anal-
ysis Consortium; and Myocardial Infarction Genetics Con-
sortium (2012). Bayesian inference analyses of the polygenic
architecture of rheumatoid arthritis. Nat. Genet. 44, 483–489.
66. Maier, R., Moser, G., Chen, G.B., Ripke, S., Coryell, W., Potash,
J.B., Scheftner, W.A., Shi, J., Weissman, M.M., Hultman, C.M.,
et al.; Cross-Disorder Working Group of the Psychiatric Geno-
mics Consortium (2015). Joint analysis of psychiatric disor-
ders increases accuracy of risk prediction for schizophrenia,
bipolar disorder, and major depressive disorder. Am. J. Hum.
Genet. 96, 283–294.
67. Vilhjalmsson, B.J., Yang, J., Finucane, H.K., Gusev, A., Lind-
strom, S., Ripke, S., Genovese, G., Loh, P.R., Bhatia, G., Do,
R., et al.; Schizophrenia Working Group of the Psychiatric Ge-
nomics Consortium, Discovery, Biology, and Risk of Inherited
Variants in Breast Cancer (DRIVE) study (2015). Modeling
linkage disequilibrium increases accuracy of polygenic risk
scores. Am. J. Hum. Genet. 97, 576–592.
14 The American Journal of Human Genetics 100, 1–15, April 6, 2017
68. Chen, H., Hey, J., and Slatkin, M. (2015). A hidden Markov
model for investigating recent positive selection through
haplotype structure. Theor. Popul. Biol. 99, 18–30.
69. Mao, X., Bigham, A.W., Mei, R., Gutierrez, G., Weiss, K.M.,
Brutsaert, T.D., Leon-Velarde, F., Moore, L.G., Vargas, E.,
McKeigue, P.M., et al. (2007). A genomewide admixture map-
ping panel for Hispanic/Latino populations. Am. J. Hum.
Genet. 80, 1171–1178.
70. O’Connell, J., Gurdasani, D., Delaneau, O., Pirastu, N., Ulivi,
S., Cocca, M., Traglia, M., Huang, J., Huffman, J.E., Rudan,
I., et al. (2014). A general approach for haplotype phasing
across the full spectrum of relatedness. PLoS Genet. 10,
e1004234.
71. Maples, B.K., Gravel, S., Kenny, E.E., and Bustamante, C.D.
(2013). RFMix: a discriminative modeling approach for rapid
and robust local-ancestry inference. Am. J. Hum. Genet. 93,
278–288.
72. Gravel, S. (2012). Population genetics models of local
ancestry. Genetics 191, 607–619.
73. Abecasis, G.R., Auton, A., Brooks, L.D., DePristo, M.A., Dur-
bin, R.M., Handsaker, R.E., Kang, H.M., Marth, G.T., McVean,
G.A.; and 1000 Genomes Project Consortium (2012). An inte-
grated map of genetic variation from 1,092 human genomes.
Nature 491, 56–65.
74. Purcell, S., Neale, B., Todd-Brown, K., Thomas, L., Ferreira,
M.A., Bender, D., Maller, J., Sklar, P., de Bakker, P.I., Daly,
M.J., and Sham, P.C. (2007). PLINK: a tool set for whole-
genome association and population-based linkage analyses.
Am. J. Hum. Genet. 81, 559–575.
75. Kelleher, J., Etheridge, A.M., and McVean, G. (2016). Efficient
coalescent simulation and genealogical analysis for large sam-
ple sizes. PLoS Comput. Biol. 12, e1004842.
76. Mathias, R.A., Taub, M.A., Gignoux, C.R., Fu, W., Musharoff,
S., O’Connor, T.D., Vergara, C., Torgerson, D.G., Pino-Yanes,
M., Shringarpure, S.S., et al.; CAAPA (2016). A continuum of
admixture in theWestern Hemisphere revealed by the African
Diaspora genome. Nat. Commun. 7, 12522.
77. Shringarpure, S.S., Bustamante, C.D., Lange, K.L., and Alex-
ander, D.H. (2016). Efficient analysis of large datasets and
sex bias with ADMIXTURE. bioRxiv. http://dx.doi.org/10.
1101/039347.
78. Price, A.L., Patterson, N.J., Plenge, R.M., Weinblatt, M.E.,
Shadick, N.A., and Reich, D. (2006). Principal components
analysis corrects for stratification in genome-wide association
studies. Nat. Genet. 38, 904–909.
79. Baran, Y., Pasaniuc, B., Sankararaman, S., Torgerson, D.G.,
Gignoux, C., Eng, C., Rodriguez-Cintron, W., Chapela, R.,
Ford, J.G., Avila, P.C., et al. (2012). Fast and accurate inference
of local ancestry in Latino populations. Bioinformatics 28,
1359–1367.
80. Tishkoff, S.A., Reed, F.A., Friedlaender, F.R., Ehret, C., Ran-
ciaro, A., Froment, A., Hirbo, J.B., Awomoyi, A.A., Bodo,
J.M., Doumbo, O., et al. (2009). The genetic structure and his-
tory of Africans and African Americans. Science 324, 1035–
1044.
81. Zakharia, F., Basu, A., Absher, D., Assimes, T.L., Go, A.S.,
Hlatky, M.A., Iribarren, C., Knowles, J.W., Li, J., Narasimhan,
B., et al. (2009). Characterizing the admixed African ancestry
of African Americans. Genome Biol. 10, R141.
82. Schroeder, H., Avila-Arcos, M.C., Malaspinas, A.S., Poznik,
G.D., Sandoval-Velasco, M., Carpenter, M.L., Moreno-Mayar,
J.V., Sikora, M., Johnson, P.L., Allentoft, M.E., et al. (2015).

Please cite this article in press as: Martin et al., Human Demographic History Impacts Genetic Risk Prediction across Diverse Populations,The American Journal of Human Genetics (2017), http://dx.doi.org/10.1016/j.ajhg.2017.03.004
Genome-wide ancestry of 17th-century enslaved Africans
from the Caribbean. Proc. Natl. Acad. Sci. USA 112, 3669–
3673.
83. Gravel, S., Zakharia, F.,Moreno-Estrada, A., Byrnes, J.K.,Muzzio,
M., Rodriguez-Flores, J.L., Kenny, E.E., Gignoux, C.R., Maples,
B.K., Guiblet, W., et al.; 1000 Genomes Project (2013). Recon-
structing Native American migrations from whole-genome
and whole-exome data. PLoS Genet. 9, e1004023.
84. Kessler, M.D., Yerges-Armstrong, L., Taub, M.A., Shetty, A.C.,
Maloney, K., Jeng, L.J.B., Ruczinski, I., Levin, A.M., Williams,
L.K., Beaty, T.H., et al.; Consortium on Asthma among Afri-
can-ancestry Populations in the Americas (CAAPA) (2016).
Challenges and disparities in the application of personalized
genomic medicine to populations with African ancestry.
Nat. Commun. 7, 12521.
85. Shungin, D., Winkler, T.W., Croteau-Chonka, D.C., Ferreira,
T., Locke, A.E., Magi, R., Strawbridge, R.J., Pers, T.H., Fischer,
K., Justice, A.E., et al.; ADIPOGen Consortium; CARDIO-
GRAMplusC4D Consortium; CKDGen Consortium; GEFOS
Consortium; GENIE Consortium; GLGC; ICBP; International
Endogene Consortium; LifeLines Cohort Study; MAGIC In-
vestigators; MuTHER Consortium; PAGE Consortium; and
ReproGen Consortium (2015). New genetic loci link adipose
and insulin biology to body fat distribution. Nature 518,
187–196.
86. Gaulton, K.J., Ferreira, T., Lee, Y., Raimondo, A., Magi, R.,
Reschen, M.E., Mahajan, A., Locke, A., Rayner, N.W., Robert-
son, N., et al.; DIAbetes Genetics Replication And Meta-anal-
ysis (DIAGRAM) Consortium (2015). Genetic fine mapping
and genomic annotation defines causal mechanisms at type
2 diabetes susceptibility loci. Nat. Genet. 47, 1415–1425.
87. Mahajan, A., Go, M.J., Zhang, W., Below, J.E., Gaulton, K.J.,
Ferreira, T., Horikoshi, M., Johnson, A.D., Ng, M.C., Proko-
penko, I., et al.; DIAbetes Genetics Replication AndMeta-anal-
ysis (DIAGRAM) Consortium; Asian Genetic Epidemiology
Network Type 2 Diabetes (AGEN-T2D) Consortium; South
Asian Type 2 Diabetes (SAT2D) Consortium; Mexican Amer-
ican Type 2 Diabetes (MAT2D) Consortium; and Type 2 Dia-
betes Genetic Exploration by Nex-generation sequencing in
muylti-Ethnic Samples (T2D-GENES) Consortium (2014).
Genome-wide trans-ancestry meta-analysis provides insight
into the genetic architecture of type 2 diabetes susceptibility.
Nat. Genet. 46, 234–244.
The
88. Moffatt, M.F., Gut, I.G., Demenais, F., Strachan, D.P., Bouzi-
gon, E., Heath, S., von Mutius, E., Farrall, M., Lathrop, M.,
Cookson, W.O.; and GABRIEL Consortium (2010). A large-
scale, consortium-based genomewide association study of
asthma. N. Engl. J. Med. 363, 1211–1221.
89. N’Diaye, A., Chen, G.K., Palmer, C.D., Ge, B., Tayo, B., Ma-
thias, R.A., Ding, J., Nalls, M.A., Adeyemo, A., Adoue, V.,
et al. (2011). Identification, replication, and fine-mapping of
loci associated with adult height in individuals of african
ancestry. PLoS Genet. 7, e1002298.
90. Gustafsson, A., and Lindenfors, P. (2004). Human size evolu-
tion: no evolutionary allometric relationship between male
and female stature. J. Hum. Evol. 47, 253–266.
91. Whiteford, H.A., Degenhardt, L., Rehm, J., Baxter, A.J., Ferrari,
A.J., Erskine, H.E., Charlson, F.J., Norman, R.E., Flaxman, A.D.,
Johns, N., et al. (2013). Global burden of disease attributable
to mental and substance use disorders: findings from the
Global Burden of Disease Study 2010. Lancet 382, 1575–1586.
92. de Candia, T.R., Lee, S.H., Yang, J., Browning, B.L., Gejman,
P.V., Levinson, D.F., Mowry, B.J., Hewitt, J.K., Goddard, M.E.,
O’Donovan, M.C., et al.; International Schizophrenia Con-
sortium; and Molecular Genetics of Schizophrenia Collabora-
tion (2013). Additive genetic variation in schizophrenia risk is
shared by populations of African and European descent. Am. J.
Hum. Genet. 93, 463–470.
93. Chan, Y., Lim, E.T., Sandholm, N., Wang, S.R., McKnight, A.J.,
Ripke, S., Daly, M.J., Neale, B.M., Salem, R.M., Hirschhorn,
J.N.; DIAGRAM Consortium; GENIE Consortium; GIANT
Consortium; IIBDGC Consortium; and PGC Consortium
(2014). An excess of risk-increasing low-frequency variants
can be a signal of polygenic inheritance in complex diseases.
Am. J. Hum. Genet. 94, 437–452.
94. Minikel, E.V., Vallabh, S.M., Lek, M., Estrada, K., Samocha,
K.E., Sathirapongsasuti, J.F., McLean, C.Y., Tung, J.Y., Yu,
L.P., Gambetti, P., et al.; Exome Aggregation Consortium
(ExAC) (2016). Quantifying prion disease penetrance using
large population control cohorts. Sci. Transl. Med. 8, 322ra9.
95. Li, Y.R., and Keating, B.J. (2014). Trans-ethnic genome-wide
association studies: advantages and challenges of mapping
in diverse populations. Genome Med. 6, 91.
96. Rosenberg, N.A., Huang, L., Jewett, E.M., Szpiech, Z.A., Jan-
kovic, I., and Boehnke, M. (2010). Genome-wide association
studies in diverse populations. Nat. Rev. Genet. 11, 356–366.
American Journal of Human Genetics 100, 1–15, April 6, 2017 15