human capital, creative class and regional economic performance a
TRANSCRIPT
Human capital, creative class and regional economic performance
A dynamic panel analysis
Esubalew Alehegn
School of Social Sciences
University of Trento
Silvia Sacchetti
School of Management
University of Stirling
Ermanno Tortia
Department of Economics and Management
University of Trento
54th
Annual Conference of the Italian Economic Association
University of Bologna, Italy
24 - 26 October 2013
Draft Version
This version, October 20th
, 2013
Please do not cite without authors’ permission
1
Human capital, creative class and regional economic performance
A dynamic panel analysis
Abstract
Though the measurement and implication of human capital on economic growth has been well
established since the works of Becker in the 1960s, recently Florida has argued that creative
class is superior to human capital in explaining economic growth. The underlying difference
between the two scholars is a measurement approach in which while Becker uses education as
indicator of human capital Florida employs occupation as an identifier of creative class. We
extract annual data from the rich administrative statistics of the Institute for Employment
Research (IAB) over the years 1998-2008 and employ system GMM to estimate and compare
the effects on regional economic performance of human capital and creative class in Germany
where economic performance is measured by GDP growth, employment growth and wage
growth. The estimation unveils that analysis of regional economy through creative class in
place of human capital can be used as an alternative approach yet the creative class, as has
been praised by Florida, is not found to be superior to human capital in explicating economic
performance of regions. Indeed, albeit the share of creative class (creative core and creative
professionals) and university graduates have positive and robust impacts on GDP growth it is
by no means the share of university graduates that have a far greater impact on economic
growth. The opposite holds for employment growth and is inconclusive for wage growth. This
finding may imply that the creative class driven economic development is directed towards
more labor intensive forms of development whilst human capital is directed towards the form
of development characterized by specialization and high capital intensity.
Key words: creative class, human capital, economic performance and dynamic panel
JEL Classification: R11. O31.O52
1. Introduction
Literature has emphasised the reasons why occupations that apply a high content of creativity
and/or knowledge tend to locate in particular areas and how in doing this they can serve local
markets, generate economic growth, and benefit local communities overall (Florida, 2002;
Markusen, 2004; Sacchetti et al., 2009). These impacts have been related to the presence of
broader conditions. Development policy, in particular, has long emphasised the role of
developing supporting institutions that can foster innovation, trade, job expectations and
opportunities for entrepreneurship (Krugman, 1990; Markusen, 2004; OECD, 1993, 1996).
Industrial growth policy became popular in particular after a wider recognition of Isard’s work
on the method of regional analysis (Isard, 1960) and the establishment of economic theories
2
for which the economic performance of a region significantly depends on its export capability
and share. Following these, many regional analysis techniques (such as location quotients,
shift shares and input-output analysis) have been developed to examine regional industrial
structure, industry cycles, industrial linkages and industry-related variables. Indeed, many
states have established industry task forces and launched strategic plans to develop specific
target industries that could improve the business environment, create new jobs and eventually
boost the overall economic performance of a region (Koo, 2005; Markusen, 2004).
Social elements, complementary, have been argued to increase community development and
regional competitiveness, nurturing use of creativity and critical judgement across
communities and facilitating the attraction and retention of creativity-intensive occupations
and talents more generally. Specifically, community involvement has been argued to give
space to creative thinking and innovate on issues of public interest through for example use of
public fora for discussion and deliberation within communities (Sacchetti and Sugden, 2009;
Young, 1990). The promotion of social innovation relates also to innovative forms of
production governance, typically those of the social economy that places at the centre social
objectives and cooperation (Borzaga and Defourny, 2001; European Union, 2013). Moreover,
the advantage of territories has been interpreted through the specific features of social capital,
whose presence puts inter-personal links, cooperative attitudes, trust and reciprocity at the core
of behavioural patterns (Fukuyama 1995; Putnam 1993) and may be thought in terms of
enablers of innovation and creativity. Along these lines, Florida (2002) has emphasised the
role of diversity, tolerance and openness of a society, since the arts and creativity more
broadly are argued to flourish in societies that are open to multiple and daring perspectives.
Albeit concurring with the opportunity of considering the idea of creativity more generally, as
a potential for any human activity or occupation as in Sacchetti et al. (2009) and Sacchetti and
Tortia (2013), for the scope of this study we use a selective approach, going from the
encompassing perspective that looks at the creative content of any job in any sector, to a
consideration of specific occupations characterised by a high degree of creative contents.
These are occupations defined by an ability “to identify and problematize a situation in a
particular domain in a new and relevant way thereby transforming inter-subjective
3
understanding into new action and, therefore, bringing something into existence using
intelligence and imagination” (Sacchetti and Tortia, 2013).
In order to identify creative occupations, we refer to the concept of the creative class defined
by Florida (2002), which includes professions where the scope of the job allows identifying
problems, proposing new solutions or combining existing knowledge in new ways. In his
approach, Florida focuses on the creative content of individual occupations rather than
industrial sectors as an integral part of ensuring economic growth. This crucial passage is
discussed also by Markusen (2004) who establishes that the utility of targeting occupations is
in their ability to transversally generate positive territorial externalities by stimulating
entrepreneurship, recruiting and retaining talents, and serving multiple industrial sectors.
Industrial classifications, moreover, would underestimate the presence of artists tout court.
Within this approach occupational measures (i.e. Standard Occupational Codes, SOC) are
argued to be best positioned to measure creative occupations not only with respect to
conventional industrial measures (i.e. Standard Industrial Code, SIC) but also with respect to
education, that is the other major indicator of human capital (HC).
Human capital as a driver of economic growth and of regional economic performance has
been well established following the works of Becker (1960) and Shultz (1961). This literature
has measured HC through education and tested its impacts and implications on households’
economic conditions at the macro level. Some considerations on why regional growth studies
can benefit from measuring HC by occupations, besides conventional education attainments,
can help the interpretation of differential impacts, if any, on economic growth. Specifically,
each measurement reveals an underpinning conceptual approach. Take, as a magnifying lens,
the classic work by Sen (2002) on functioning (to be understood as outcomes, or people
“doings”) and capabilities (or the freedom to achieve a particular functioning). When focusing
on education, the HC approach gives attention to one specific functioning or outcome, which
is the analytical skill achievement, regardless of its creative content and actual application to
production activities. Conversely, by focusing on occupations, the creative class approach
directs attention to another type of functioning, i.e. the creative achievement, regardless of the
actual education achievement. Occupational achievements, from this perspective, are an
4
indication of the real doings of an individual in his/her job position, where s/he can apply and
regenerate knowledge, critical thinking and skills, potentially creating spinoffs and additional
occupation. Education, on the other hand can be regarded as an outcome that measures a
potential occupation, and does not necessarily overlap with doings or the use of the skills
learned, such as when educated individuals are unemployed or under-utilised within their
occupational role.
In our specific case, creative class occupational categories capture also individuals who may
not have a higher education degree (e.g. a self-taught artist, manager, policy maker …) and
whose work is valued for skills developed in the creative practice of the arts or profession.
Albeit of course this is very much consistent with educational skills, it is occupation, rather
than education, that provides an indication of the presence of industrial activities that can
absorb a creative and skilled labour force. In this sense HC (educational skills; creative
occupations skills) and the presence of a regional industrial base are complementary aspects of
a knowledge-based economy: you need skills to transform creativity into a tangible output;
you need creativity and critical judgement abilities to make your skills applicable; you need a
production outlet to have an opportunity to apply your skills.
The purpose of this study is twofold: 1) to estimate and compare the impacts of creative class
as well as human capital on regional economic performance in Germany on the basis of rich
panel data over the years 1998-2008, and 2) to measures the extent to which Bohemians might
affect the share of other creative class (creative core and creative professional) in a regional
setup. It is evident that the implications of a conventional human capital measure, as
popularized by Becker (1960) and Schultz (1961), and creative class as theorized by Florida
(2002), have been extensively studied at regional level without taking a comparative analysis
in Germany of which of the two indicators would better explain regional economic
performance. We take Germany as case study because of the relatively high economic
performance of the country with respect to other European areas, the existence of strong
regional economic policy that has received considerable attention, and the availability of data
that fits into the Florida concept. This paper contributes in the following ways.
5
First, while the impact of HC on regional economy in Germany or elsewhere has actually been
analysed by a number of scholars, such contributions have measured human capital only by
educational qualification- a conventional measure which does not take into account the
creative class method. Our study intends to address this gap by measuring human capital
through educational qualification and of another variant of human capital, i.e. creative class by
occupation and estimate how the two approaches affect regional economy. In this respect
measuring regional economic performance through Becker’s and Shultz’s approach or through
Florida’s creative class method will help to appreciate differential impacts on growth of the
education-based and of occupation-based approaches.
Second, an analysis of the regional economy impacts based on occupations instead of
education qualifications have not been attempted in a thorough and fully convincing way in
the German context. Available studies grossly indicate that creative class occupations seem to
boost economic performance of regions. Nevertheless, existing studies of the impact of
creative class on regional economy do not seem to offer replicable methods, nor are they able
to provide a comprehensive analysis to support regional labour market policy as well as
regional economic policy. Our study, using a rich dataset and applying rigorous method
intends to address these.
Third, regional economic development is increasingly becoming dependent on the knowledge-
content of economic activities, which is anchored to the presence of individuals with the
professional background and experience defined by the creative class. Here, as anticipated,
creative occupations define the actual ability of individuals to apply knowledge, exert critical
judgement and intuition to economic activities, in a way that education cannot do, as the latter
mainly reflect competence with respect to codified/analytical knowledge. Knowledge is not
defined solely as analytical but also as synthetic and symbolic. A study of regional economy
through educational attainments and creative class occupations will, therefore, be relevant in
understanding how useful the two approaches to harnessing human capital for policy making.
6
Fourth, an occupation-based study can give inputs in identifying the kind of occupations that
contribute to employment growth at the regional level. A final contribution is to do with the
use of robust longitudinal data set as well as dynamic panel model. Previous creative class
studies have mainly been concerned with associations between creative class and regional
economic growth. Besides, the estimation of regional economic development effects of
creative class including much of Florida’s and related works employ simple regressions of
cross-sectional data. These attempts do not capture unobservable regional fixed effects,
endogeneity problems and time dynamics. Since our study uses rich administrative panel data
it would allow us to estimate both cross-section features and time series dynamic effects of the
creative class on regional economies. Besides, use of dynamic panel (GMM) addresses
endogeneity and reverses causality issues where previous studies fail to account.
This paper has seven parts. The forgoing has the introduction which highlights the need to take
into account the creative class approach as a contemporary and alternative option to human
capital in the analysis of regional economy, the motivation as well as the contribution of the
paper. In the following we provide the conceptual issues of the creative class as framed by
Florida (2002) along with the criticisms of the concept. Then we provide some theoretical
reflections of the creative class along with empirics. In part four we provide the econometric
models and estimation strategies for regional economic performance (as measured by regional
GDP growth, employment growth and wage growth). In part five descriptions of the panel
data used for the study and summary statistics are presented. Part six, which is the main part of
the paper, provides estimation results and discussions. Finally, we provide conclusion.
2. The concept of creative class and critiques
Florida’s creative class concept refers to “people who are engaged in complex problem
solving areas that involve a great deal of independent judgment and require high levels of
intellectuality. These people are primarily paid to create and have considerable autonomy and
flexibility than others” (Florida, 2004). Basically, he divides the creative class into creative
core and creative professional where within the creative core we find the following
professions: “scientists and engineers, university professors, poets and novelists, artists,
7
entertainers, actors, designers and architects, as well as the thought leadership of modern
society: nonfiction writers, editors, cultural figures, think-thank researchers, analysts and other
opinion makers. Whether they are software programmers or engineers, architects or
filmmakers, they fully engage in the creative process…” (Florida, 2002). The outcomes are
“new forms or designs that are readily transferable and broadly useful-such as designing a
product that can be widely made, sold and used; coming up with a theorem or strategy that can
be applied in many cases; or composing music that can be performed again and again”
(Florida, 2005). Besides the creative core are what Florida calls “creative professionals” who
“work in a wide range of knowledge-intensive industries such as high-tech sectors, financial
services, the legal and healthcare professions, and business management”(Florida, 2005). Here
is the strong overlap of creative professionals with educational achievements. These people, in
fact, “engage in creative problem-solving, drawing on complex bodies of knowledge to solve
specific problems. Doing so typically requires a high degree of formal education and,
therefore, a high level of human capital” (Ibid).
His contribution appears to be impressive and an alternative approach to replacing human
capital by creative class which can be measured on the basis of who does what (occupation)
instead of through the conventional system of educational qualification that does not
necessarily tell the real activity of an individual. However, creative class has received a
number of criticisms, regarding: a) the elusiveness of the creative class concept; b) the causal
relations and interpretations of creative class and c) the policy implication of the creative class
(Andersen, et al., 2010). Asheim and Hansen (2009) for example recommend that breaking the
creative class into less heterogeneous subcategories is necessary in order to better understand
the dynamics of the knowledge economy else it is not possible to guarantee all groups of
creative class to have same preferences, for example, either all would like to live in places
where people climate is nice or in places where there are conducive business climate. Another
comment regarding the elusive concept of creative class is made by Glaeser (2005) who
addresses the similarity between creative class and human capital. Based on an evidence of
strong associations between highly educated people and regional growth Glaeser argues that
Florida gives the creative class credit for causing regional growth where growth is actually
generated by human capital.
8
On causal relations, Florida has been attacked on the basis of the unconvincing causal
relationships of creative class and economic growth that he established. Scott (2006) argues
that Florida has not expressed the necessary and sufficient conditions that make creative
individuals come together and remain in a particular place over a reasonable long period of
time. Rather, entrepreneurial and innovative energies are stimulated by a differentiated local
production system favouring the importance of a business climate as a source for
innovativeness rather than just people climate. By this Scott maintains that it is business that
generates economic growth and not necessarily creative people that produce growth.
Similarly, Malanga (2004) suggests that Florida only focuses on a very small part of the
economy when emphasizing the high-tech industries as prime economic drivers. These
industries only account about 8% of the total employment in which Florida probably leaves
out some very important dynamics of the economy. Hansen and Niedomysl (2009) indicate
that creative class is vaguely more selective in their choice of destination compared to people
outside creative class. They demonstrate that people belongs to the creative class in Sweden
move for jobs rather than attractive neighbourhoods indicating that the causal relation in the
Swedish context is in favour of people moving for jobs rather than jobs moving to people.
As per policy implications, the creative class approach of regional economic development
appears to have a supply side policy. It draws policy prescriptions on the basis of rather simple
theoretical underpinnings and unconvincing justifications. Following Florida’s creative
concept, creative city ideas have been applied by policy-makers including in Nordic city
regions. Peck (2005) has in this regard warned that the tendency to put Florida’s ideas into
practice as supply-side policy merely to satisfy creative employees is dangerous. The idea that
creativity increases the competitiveness of cities sustainably does not take into account the
structural differences of cities, historical variations, power of the life cycle that cities which
have been more prosperous and creative once could fall into being decay and unattractive, and
the possibilities of the power of other explanatory variables that could shape cities the way
they are. The creativity driven policy prescriptions for cities seem to end up having same
method of city competitiveness which is not convincing. Albeit Peck appreciates the role that
creative class and creativity plays in economic development efforts, creative class based
9
economic development policy can have problems including the race to attract talent and
mobile workers may remove focus from important local challenges such as large socio-
economic inequalities. Moreover, it would be very likely that many regions will focus on same
type of policy initiatives in order to comfort highly educated people and, therefore, try to
attract same creative people. Such attempt, in reality, is hard to implement.
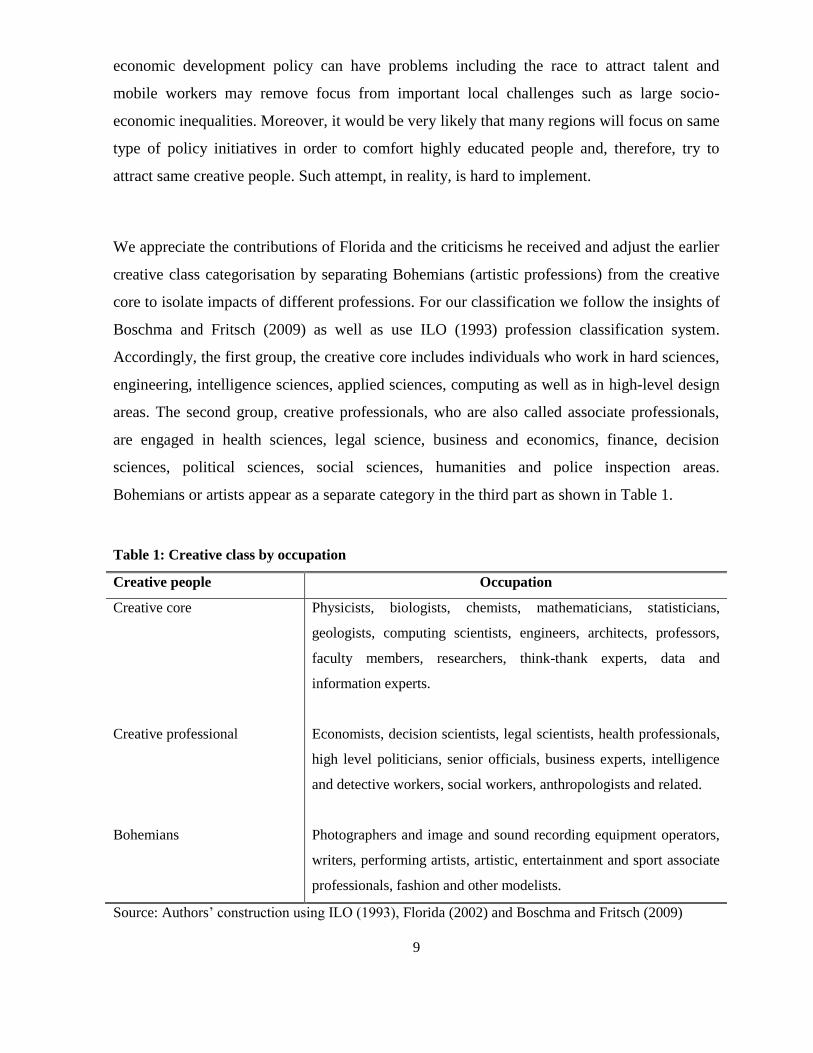
We appreciate the contributions of Florida and the criticisms he received and adjust the earlier
creative class categorisation by separating Bohemians (artistic professions) from the creative
core to isolate impacts of different professions. For our classification we follow the insights of
Boschma and Fritsch (2009) as well as use ILO (1993) profession classification system.
Accordingly, the first group, the creative core includes individuals who work in hard sciences,
engineering, intelligence sciences, applied sciences, computing as well as in high-level design
areas. The second group, creative professionals, who are also called associate professionals,
are engaged in health sciences, legal science, business and economics, finance, decision
sciences, political sciences, social sciences, humanities and police inspection areas.
Bohemians or artists appear as a separate category in the third part as shown in Table 1.
Table 1: Creative class by occupation
Creative people Occupation
Creative core Physicists, biologists, chemists, mathematicians, statisticians,
geologists, computing scientists, engineers, architects, professors,
faculty members, researchers, think-thank experts, data and
information experts.
Creative professional Economists, decision scientists, legal scientists, health professionals,
high level politicians, senior officials, business experts, intelligence
and detective workers, social workers, anthropologists and related.
Bohemians Photographers and image and sound recording equipment operators,
writers, performing artists, artistic, entertainment and sport associate
professionals, fashion and other modelists.
Source: Authors’ construction using ILO (1993), Florida (2002) and Boschma and Fritsch (2009)
10
3. Creative class: Theory and empirics
The central indicators of the creative class are occupations1, especially creative occupations, to
which their implications for economic growth have been acknowledged by scholars including
Mather (1999), Theodore (1999) and Thompson and Thompson (1985). However, the popular
recognition of creative class has come into effect following Florida’s bestselling book: “The
rise of the creative class: And how it's transforming work, leisure, community and everyday
life”. The main aspect of the argument is that the creative class which is measured by
occupation is superior to education which measures HC in explaining the performance of
regional and local economies. The theory also argues that-unlike mainstream economics which
takes the growth performance of regions as a function of business climate- regional economic
development need to be approached from the point of view of a region’s capability to attract
talented individuals, through availability of amenities and openness of society.
This tenet can be articulated into three main theories. The first states that creative class is the
crucial driver of regional economic development. The second focuses on the economics of
location of specific factors (regional features) which attract creative class. The third addresses
the economics of Bohemians and their impact in attracting other creative class professions. We
focus on the first and third of the tenets, since our aim here is to analyse the distinctive
impacts of creative class occupations on the one hand and education on the other on economic
growth as well as how bohemians might affect the share of other creative classes in a region.
Creative class is a motor for regional economic development: The central idea is that creative
class is a critical engine of regional economic development. Proponents of this theory support
the view that creative class outperforms education as a measure of HC in boosting the
productivity and competitiveness of a region. A region with good number of creative or
innovative people tends to be competent sustainably (Markusen, 2006). Such contexts imply
that regional economic growth is not primarily based on particular industries such as high-tech
1 For details of how occupation can be used as indicators of creative class or human capital readers are invited to
refer the works of Markusen et.al, (2008).
11
operated by high level HC, but on creative people who are not tied to specific industry. This
thought seems to undermine sector-based regional economic development taking the emphasis
off the role of agglomeration externalities, regional specialization or localization economies
(Glaeser et al., 1992).
The creative class approach differs from industry-driven regional development in that the
latter emphasizes knowledge spillovers between firms and industries. Besides, whereas the
conventional industry approach takes sectorial innovation as a precondition for regional
economic development, a creative occupation approach considers the capability to generate
innovation of the creative class as a preferred way of sustaining regional economic
development (Stolarick and Florida, 2006). This view supports the works of Zucker et al.
(1998) and Almeida and Kogut (1999) who identify that transfer of knowledge and skills
embodied in people, instead of firms, are crucial for economic growth and spillover.
The theorised relation between creative class and economic growth is praised by some
scholars as an improvement of the method used to examine the relationship between HC and
regional economic development (Marlet and van Woerkens, 2004). Creative class indicates
economic performance via occupation outcomes and therefore better explains economic
growth than the traditional means of educational attainment in which accumulation of
innovative capital is to depend on formal education through codified knowledge and formal
training. Indeed, HC per se cannot contribute to regional economic development if the
educational qualification obtained is not invested in forms of relevant employment (if what
one knows is not practiced). It is the capability in creating ideas, inputs, processes and
products which matters more for economy. The claim is that regions with a concentration of
creative occupations are likely to generate innovation in any sphere of society, through new
ideas, concepts or technologies and increase the propensity of entrepreneurial atmosphere
which is often seen as a requirement for sustained economic advancement.
A number of studies, although with improvable methods, have attempted to test this theory.
These include the works of Mellander and Florida (2011), Florida et al., (2010), Florida and
12
Mellander (2009), Florida et al. (2008), Stolarick and Florida (2006), Boshchma and Fritsch
(2009), Lengyel and Sagvari (2010), Moller and Tubadji (2009), and Mellander and Florida
(2011) study the impact of creative class, super-creative and creative professional against the
conventional educational attainment on regional wages per capita in Sweden where wage is
taken as an indicator of regional growth. The finding indicates that creative class outperforms
conventional educational attainment measure. Besides, occupations in the arts and culture play
a significant role. These findings are consistent with Marlet and van Woerkens (2004) who
argue that occupational measures may well set a “new standard” for measuring human capital
and deserve more attention in empirical studies of regional growth.
Florida et al. (2010) study on Canada’s regional growth between 2001 and 2006 also shows,
using educational attainment and creative class, that both measures are strongly associated
with regional income. However, the creative class variable is significant while the education
variable is not. Of the two main groups that make up the creative class, creative professionals
are more strongly related with regional income than the creative core. Similar results are
observed from Florida and Mellander (2009), Florida et al., (2008) and Stolarick (2006).
Florida et al. (2008) finding shows that creative class outperforms conventional educational
attainment when measuring regional labour productivity (measured by wages), whereas
conventional education measures of human capital better measure regional income.
Boschma and Fritsch (2009) analysis of a cross country study of creative class and its impact
on regional economic performance in over 450 regions of seven European countries reveals a
positive robust effect on employment growth and new business formation. The result supports
the view that the occupation-based creative class indicator is a more significant measure for
HC than formal education. Whilst supporting Florida’s view, yet the corroboration is based on
simple regression model that does not take into account endogeneity as it is based on cross-
sectional data that are not able to capture the cross-section and time dynamics across time.
On the contrary, Lengyel and Sagvari (2011), who estimate effects of educated labour and
creative occupations on regional development using cross-sectional data in Hungary, suggest
13
that the share of educated labour has a bigger effect on regional development than the share of
creative occupations. This supports the classical view that HC measured by education plays a
major role in economic development as opposed to the views of Florida and his empirical
findings (Florida et al., 2008; Mellander and Florida, 2011).
Moller and Tubadji (2009), using dynamic panel, analyse the effects of creative class on
regional employment growth for West Germany. Like Boschma and Fritsch (2009) the study
extracts artists from the rest of the creative core in order to study the separate effects of the
arts and the sciences. In this way they find that agglomeration of creative class (creative core
excluding artists and creative professionals) increases the propensity of economic performance
of a region and outperforms conventional indicators of HC. Nevertheless, the estimation does
not support another of Florida’s view that creative workers flock where Bohemians live.
Besides, they identify that creative class is, rather attracted by favourable economic conditions
such as by employment growth or wage. Similarly, Hansen et al. (2010) analysis of the effects
of creative class on regional development shows that the relationship between regional
developments, the creative class, people and business climate are positive. Whereas larger
regions favour Florida’s arguments, the findings from smaller regions do not support them.
Creative class flocks to where Bohemians live: Florida (2002) assumes that where there are
more Bohemians, there will be more creative class-the former attracting the latter. This theory
is constructed based on the observations of large urban regions of U.S. with a population of
more than 100, 000. The approach, as it has been framed for large urban regions, is more
suited for regions whose population is large enough, making the application of the theory in
rural regions or regions with small urban sizes, if not impossible, difficult. This begs the
question concerning the relation between the creative class and rural economic development as
well as for regions of small urban areas such as in many European countries, whose urban
areas are so small compared to urban areas in U.S. and Canada where Florida espouses his
theory. Fritsch and Stuetzer (2008) estimation of the effect of Bohemian on creative core and
creative professional in Germany reveals a positive and significant effect. This study,
however, uses cross-sectional data and as such the positive impact of Bohemia on creative
class cannot be taken for granted since the estimation is not in a position to capture reverse
14
causality and endogeneity problems one of the critical aspects of impact studies. Moreover, it
seems that the estimation is underspecified. The studies of Boschma and Fritsch (2009) which
use cross-sectional data for regions in Europe reveals that Bohemians attract the creative core
and creative professional as well as the creative class to a significant level. Florida’s (2002a)
study shows that Bohemians play an important role in regional economy not only by being
involved in innovative activities themselves but also by creating atmosphere that attracts other
intellectuals who have ripe talent in solving so many regional social and economic problems.
Glaeser’s (2005) indicates that the effect of Bohemians (or those who work in the artistic
kinds of occupations) on creative class is not robust. He is, in fact, at odds with Florida’s
popularization of the creative class theory, and defends the idea that the creative class is just a
human-capital surrogate. Also Moller and Tubadji (2009) reject the view that Bohemians
attract a significant share of the creative class. These authors instead note that it is the labor
market and other incentives that play positive roles in attracting the labor force of the creative
class. Besides, they argue that the decision to move into a new place is not due to the presence
of Bohemians but to other economic factors.
4. Econometric model and estimation strategy
In order to measure the impacts of human capital and creative class on regional economic
performance (GDP growth, employment growth and wage2 growth) as well as estimate the
creative class impacts of Bohemians we use a dynamic panel model on the basis of 11 years
rich longitudinal data that span from 1998-2008. The general form of the dynamic panel
model that we employ for the empirical study has the following form (Arellano, 2003):
'
, 1ln ln ln 1... 2..., (1)i t i t i ty y x i N and t T
Where y is regional economic performance such as regional GDP or employment growth in a
region i , t is year, 'x are share of creative class or human capital, and i t is time-invariant and
time-variant error terms. When equation (1) is converted into an estimable model we get:
2The three indicators of regional economic development have actually been fundamental variables being used in
the analysis of economic development in mainstream economics.
15
'
1ln ln ln ' ln * 1... , 2,..., (2)it it it i i tGDP GDP X k yr with i N and t T
Where itGDP in logs is gross real domestic product of region i in year t ,
1itGDP represents the first lag of GDP, is coefficient of GDPit-1, is coefficient of
predictors (human capital or creative class), itX ' is share3 of creative class or human
capital from total full time employees. Moreover, is coefficient of control variables,
'k is a control variable, *yr is year dummy in order to control some unobservable
shocks, is coefficient of year, i is an unobserved region-specific time-invariant effect
which may be correlated with variables with 'x but not with ti , , and ti , is an independent
and identically distributed (iid) error or idiosyncratic term with tandiallforE ti 0)( , .
A first step in estimating a dynamic panel model is to employ pooled OLS. However, in using
OLS the lagged dependent variable, regional GDP, will be correlated with the time-invariant
region fixed effect i . This inflates coefficient of lagged dependent variable, a phenomena of
Nickel upward dynamic bias, creating instability and, therefore, endogeneity problem.
Besides, pooled OLS leads to inconsistent and biased results. Such problem can be solved if
i is purged by within (fixed effects) estimator or least square dummy variable (LSDV)
estimator. This strategy uses demeaned estimation whereby demeaning we find that the
transformed variables on the right-hand side of equation (1) are correlated with demeaned
error term )( ,
iti . So does 1, 1( )ii tGDP GDP
where 1 , 12
1
1
T
i i tt
GDP GDPT
is
negatively correlated with demeaned error term. This way within estimator-unlike pooled
OLS- provides consistent estimation. However, the problem of the within estimator is that the
sum of parameters of lagged dependent variables has a tendency of downward bias even if
these variables are not serially correlated with ti , . If the spell of T then the downward
bias of the within estimator will be minimized. Nevertheless, evidences show that even for
3There are two ways of measuring share of the creative class in a particular region. The first is taking the
proportion of the creative core and creative professional job workers from the total creative class labor force of
the particular region. The second is taking the share of each of the creative class from the total labor force in a
specific region. We know that total labor force of the creative class is not necessarily equal to total labor force
because according to Florida’s model only about 30-35% of the labor force is considered to be creative in cases
of U.S. This figure may not be significantly different from most other European countries including Germany.
16
T=30 fixed effects estimator has downward bias.
There are two ways to solve the problem of upward bias OLS and downward bias within
estimators: first difference or difference GMM (Anderson and Hsiao, 1981; Holtz-Eakin et al.,
1988; Arellano and Bond; 1991) and forward orthogonal deviations (FOD) or orthogonal
deviations or system GMM (Arellano and Bover, 1995; Blundell and Bond, 1998). The two
methods not only purge the time invariant fixed effect but also provide consistent and
unbiased results although the first difference estimator is prone to some problem. When the
first difference method is applied to equation (2) we obtain:
'
, , 1 , ,' (3)i t i t i t i tGDP GDP x k yr
With the assumption that,
, ,( ) 0 1,..., 2,...,i t i tE LP for i N and t T
Now, the time-invariant variable is kicked out, hence, making the estimation consistent and
unbiased (Ahn and Schmidt, 1995). However, first difference GMM estimator suffers from
large finite sample biases when instruments available are weak. In case of persistent series
(value of autoregressive order, , is close to unity) and the variance of the fixed effect ( )i
increases relative to the variance of disturbances )( it , the instruments (lagged levels of the
variables for subsequent first differences) are weak (Trufat, 2006). Blundell and Bond (1998)
and Blundell et al. (2002) simulations show that Dif-GMM estimator, in situation of weak
instruments, is biased downwards in the direction of within group estimator. The bias can be
detected by comparing first differenced GMM results of the autoregressive parameter with that
of pooled OLS and within estimator. We expect a consistent estimate of GMM, in the absence
of finite sample biases, if it lies between pooled OLS and within estimators (Nickell, 1981).
One can also test if the series are persistent, that is, the closer to unity, the more likely that
there exists bias due to weak instruments. Besides, since first difference uses deep lagged
values of the dependent variable to instrument dependent variable this works at a cost of
reducing sample size. This problem will be enormous if data are unbalanced and if deep lags
are to be used.
17
Under such conditions forward orthogonal deviations or system GMM works well since it
subtracts averages of future values instead of lags. System GMM (Hsiao, 2003; Arellano and
Bover, 1995; Blundell and Bond, 1998) reduces problem of finite sample biases associated
with Dif-GMM due to weak instruments where SYS GMM estimates a system of equations in
both first differences and in levels. In the first-difference equations lagged level values of the
variables are used as instruments while in levels equations one uses lagged differences as
instruments. This estimation strategy requires additional 3T moment conditions to be valid:
, 1 ,[ ( )] 0 4, 5,..., .i t i t iE e for t T These moment conditions can only be fulfilled
when the log change of labor productivity is not correlated with region-specific effects i and
with the epsilon of the next period (the region does not have knowledge about future shocks).
The implementation of D-GMM or S-GMM will depend on which fulfills better requirements
of serial correlations and over identification. While Arellano-Bond AR (1) and AR (2) test
existence of serial correlation the Sargan /Hansen test inform existence or absence of over
identification. The GMM estimator is consistent if there is no second order serial correlation in
the error terms of the first differenced equation. The null hypothesis that errors are serially
uncorrelated is tested against the alternative and not rejecting the null hypothesis shows the
validity of the assumption of no second order serial correlation. The Sargan or Hansen test is
diagnosis of over-identifying restrictions that tests the validity of sets of instruments. The set
of instruments used are valid if there is no correlation between instruments used and the error
terms. The null hypothesis that the instruments and the error terms are independent is tested
against the alternative and failure to reject the null hypothesis suggests that the instruments
used are valid. If robust option is used only, the Hansen test of over identification can be used
to check whether the instruments used are over or under identified. In this study we use the
forward orthogonal or system GMM estimator not only because we found it as a consistent
and unbiased estimator but also it does not significantly reduce the sample size of the
unbalanced data we have. The estimation procedures for the employment growth, wage
growth as well as growth of creative class share follow the same approach.
18
5. Data and descriptive statistics
The data for this study cover from 1998-2008 and are obtained from the individual panel,
establishment panel, and establishment panel history from the Sample of Integrated Labor
Market Biographies (SIAB) of the Institute for Employment Research (IAB) of Germany
while data on GDP are obtained from the Federal Statistical Office. The individual panel
contains employment histories of 1.6 million employees who are subject to paying social
security, a two percent representative sample of employees in Germany over 1975-2008. The
sample, which has more than 200,000 employment spells per year, provides precise
information on daily wages, working days as well as further individual characteristics for all
individuals who contribute to social security system. Among the excluded are self-employed,
civil servants, part-time workers and apprentices. Since the study is based on annual data we
consider all full time employees who are employed on the 30th
June of each year. In addition
to detail information on professions, data contain personal characteristics of workers including
gender, age and education as well as basic information about employer (industry affiliation,
location and firm size). There are 132 profession/occupation categories each with three-digit
code ranging from 011 to 996. An advantage of this sample is the inclusion of regional
professional composition of employed persons. Further advantages are the high validity and
up to date nature of the data (Wedemeier, 2010).
Based on the three-digit codes assigned to each occupation and employing Florida’s (2002)
theory, we classify creative class into creative core and creative professional. The creative
core or the super creative core include experts that work in hard sciences, engineering,
technology, teaching and research centers. These are individuals registered in the employment
database as physicists, biologists, chemists, mathematicians, statisticians, geologists, computer
experts, engineers, architects, faculty members, teachers, researchers, think-thank workers,
and information experts. The second group of employees: creative professionals are experts
who are registered in SIAB database as health professionals, economists, business analysts,
juries, public service administrative workers, managers, senior officials, politicians,
legislators, senior officials, business professionals, police inspectors, detectives, sociologists
and anthropologists. Besides, we use the approach of Boschma and Fritsch (2009) as well as
Moller and Tubadji (2009) to extract Bohemian as separate groups of professionals. These
19
experts are archived in the database as creative writers, performing artists; photographers and
image and sound recording equipment operators, entertainers, sports associate professionals;
fashion and other models (construction of the creative class are presents in Table 2, Annex).
Educational qualification is categorized into six levels where the SIAB has archived: The first
primary /lower secondary /intermediate or equivalent education without vocational
qualification, the second is primary /lower secondary /intermediate or equivalent school
education with vocational qualification, the third is upper secondary school (Abitur) without
vocational qualification, the forth is upper secondary school (Abitur) with vocational
qualification, the fifth has to do with degree from a university of applied sciences
(Fachhochschule) and the last category is that of a university degree qualification. In Germany
having vocational training- in addition to completion of lower or primary, junior or secondary
school- plays a critical role for employment. For this reason we aggregate the six groups of
education into three: 1) primary, junior and lower secondary without vocational certificate +
upper secondary graduates without vocational training (1+3), 2) primary, junior and lower
secondary with vocational certificate + upper secondary graduates with vocational training
(2+4), and finally degree in applied sciences (Fachhochschule) + university degree (5+6).
Educational as well as occupational data are all obtained from individual panel.
We also use the establishment panel which contains information on median wage and industry
classification. The establishment panel has also information on work place- an important
constituent on which the whole analysis of this paper is based. Moreover, we got regional
(NUTS3) GDP and consumer price index (CPI) from Federal Statistical Office of Germany
where nominal GDP is converted into real GDP using CPI of the 1995 constant price. Further,
data on population, region area, and location of industry as in East or West Germany are
obtained from establishment panel history (BHP). Observations with no valid information
have been dropped. Absence of valid information for some territories has reduced the total
number of regions for this study to be 394. This number is about 95% of the total number of
regions (NUTS2) in Germany making our data and analysis at regional level almost complete.
20
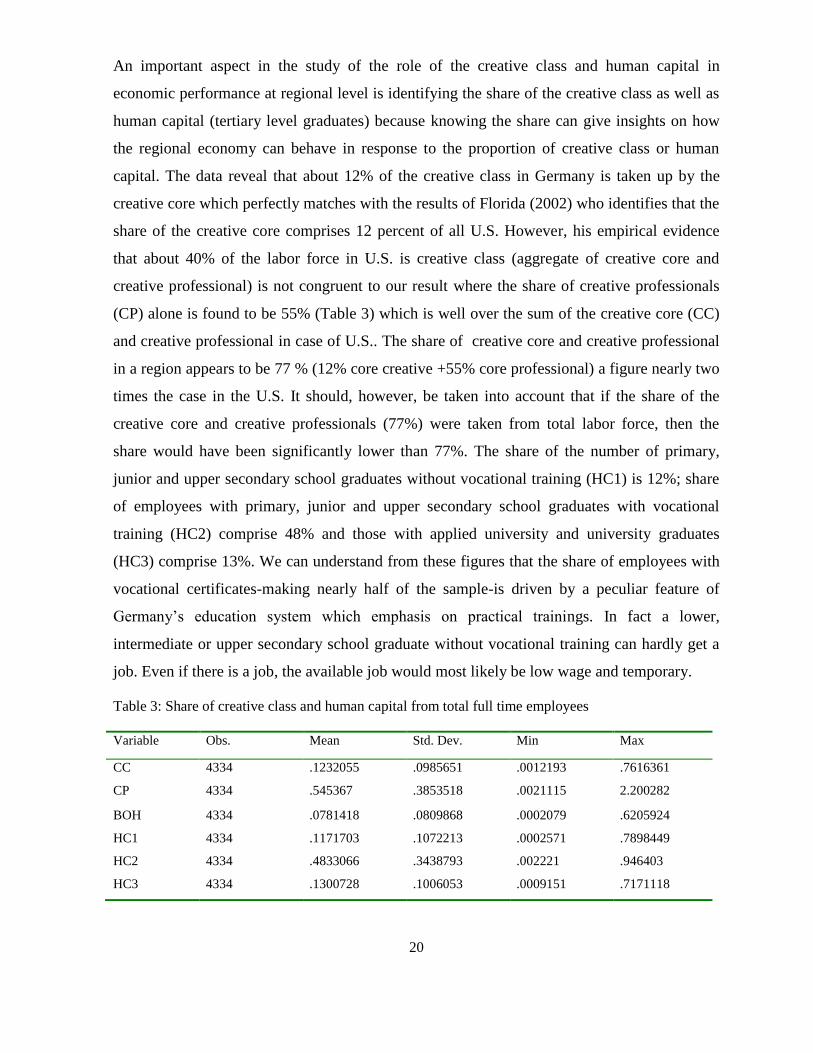
An important aspect in the study of the role of the creative class and human capital in
economic performance at regional level is identifying the share of the creative class as well as
human capital (tertiary level graduates) because knowing the share can give insights on how
the regional economy can behave in response to the proportion of creative class or human
capital. The data reveal that about 12% of the creative class in Germany is taken up by the
creative core which perfectly matches with the results of Florida (2002) who identifies that the
share of the creative core comprises 12 percent of all U.S. However, his empirical evidence
that about 40% of the labor force in U.S. is creative class (aggregate of creative core and
creative professional) is not congruent to our result where the share of creative professionals
(CP) alone is found to be 55% (Table 3) which is well over the sum of the creative core (CC)
and creative professional in case of U.S.. The share of creative core and creative professional
in a region appears to be 77 % (12% core creative +55% core professional) a figure nearly two
times the case in the U.S. It should, however, be taken into account that if the share of the
creative core and creative professionals (77%) were taken from total labor force, then the
share would have been significantly lower than 77%. The share of the number of primary,
junior and upper secondary school graduates without vocational training (HC1) is 12%; share
of employees with primary, junior and upper secondary school graduates with vocational
training (HC2) comprise 48% and those with applied university and university graduates
(HC3) comprise 13%. We can understand from these figures that the share of employees with
vocational certificates-making nearly half of the sample-is driven by a peculiar feature of
Germany’s education system which emphasis on practical trainings. In fact a lower,
intermediate or upper secondary school graduate without vocational training can hardly get a
job. Even if there is a job, the available job would most likely be low wage and temporary.
Table 3: Share of creative class and human capital from total full time employees
Variable Obs. Mean Std. Dev. Min Max
CC 4334 .1232055 .0985651 .0012193 .7616361
CP 4334 .545367 .3853518 .0021115 2.200282
BOH 4334 .0781418 .0809868 .0002079 .6205924
HC1 4334 .1171703 .1072213 .0002571 .7898449
HC2 4334 .4833066 .3438793 .002221 .946403
HC3 4334 .1300728 .1006053 .0009151 .7171118
21
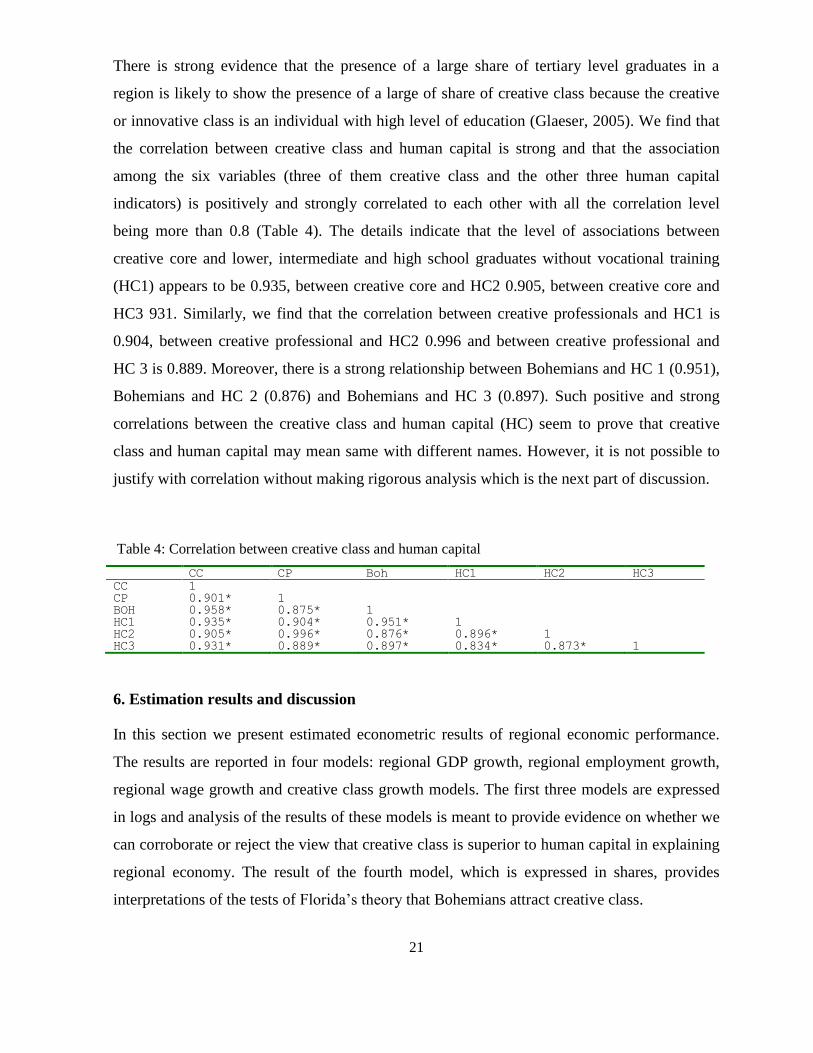
There is strong evidence that the presence of a large share of tertiary level graduates in a
region is likely to show the presence of a large of share of creative class because the creative
or innovative class is an individual with high level of education (Glaeser, 2005). We find that
the correlation between creative class and human capital is strong and that the association
among the six variables (three of them creative class and the other three human capital
indicators) is positively and strongly correlated to each other with all the correlation level
being more than 0.8 (Table 4). The details indicate that the level of associations between
creative core and lower, intermediate and high school graduates without vocational training
(HC1) appears to be 0.935, between creative core and HC2 0.905, between creative core and
HC3 931. Similarly, we find that the correlation between creative professionals and HC1 is
0.904, between creative professional and HC2 0.996 and between creative professional and
HC 3 is 0.889. Moreover, there is a strong relationship between Bohemians and HC 1 (0.951),
Bohemians and HC 2 (0.876) and Bohemians and HC 3 (0.897). Such positive and strong
correlations between the creative class and human capital (HC) seem to prove that creative
class and human capital may mean same with different names. However, it is not possible to
justify with correlation without making rigorous analysis which is the next part of discussion.
Table 4: Correlation between creative class and human capital
CC CP Boh HC1 HC2 HC3
CC 1 CP 0.901* 1 BOH 0.958* 0.875* 1 HC1 0.935* 0.904* 0.951* 1 HC2 0.905* 0.996* 0.876* 0.896* 1 HC3 0.931* 0.889* 0.897* 0.834* 0.873* 1
6. Estimation results and discussion
In this section we present estimated econometric results of regional economic performance.
The results are reported in four models: regional GDP growth, regional employment growth,
regional wage growth and creative class growth models. The first three models are expressed
in logs and analysis of the results of these models is meant to provide evidence on whether we
can corroborate or reject the view that creative class is superior to human capital in explaining
regional economy. The result of the fourth model, which is expressed in shares, provides
interpretations of the tests of Florida’s theory that Bohemians attract creative class.
22
Creative class, human capital and regional economic growth: We first provide results of
the regional real GDP 4growth impacts of the creative class and human capital and compare
whether creative class or human capital better explain regional economy. In order to determine
the maximum possible lag lengths for regional real GDP (and for all other models too) we first
estimate autoregressive models and examine whether the lagged values we checked have
significant impacts on the dependent variable. We take, as a rule of thumb, only those lags that
have robust impacts. For the regional log of GDP we find that lagged dependent variables of
up to three lags have significant impact on regional growth of GDP (Table 5 in Appendix).
Therefore, we take three lags of the dependent variable for the GDP growth model and that
since the lags of dependent variable of a higher order than three are not significant, we present
results using up to three lags only. All estimations use xtabond25 which is developed by
Roodman (2009).
When the two-step system GMM estimator is used the coefficients of the lagged dependent
variable regional real GDP behave exactly as required while he creative class or human capital
is used as explanatory variable. The estimator fulfills the requirement of the dynamic panel
model because it is found that the sum of the coefficients of the lagged dependent variable of
two-step system GMM estimator lies between the pooled OLS and within estimator. To be
more specific we find that the sum of the coefficients of the lagged dependent variables GDP
is 0.981 in the pooled OLS, 0.335 in the fixed effects, and 0.885 in the two-step system GMM
when creative class is used as explanatory variable. In the same manner when human capital
is used as independent variable the sum of the coefficients of the lagged dependent variable
GDP is found to be 0.976 in the pooled OLS, 0.335 in the fixed effects, and 0.937 in the two-
step system GMM. Since GDP is a near unit root process, it is well-known that estimates in
pooled OLS model are biased upwards and fixed effects are biased downwards (Baltagi,
4 It should be noted throughout this paper that since nominal GDP is changed into real GDP using GDP deflator
all GDP figures and interpretations shall be considered as real GDP. 5 The syntax has three parts: the first lists the dependent and explanatory variables, the second part is for gmm
style which lists a set of endogenous and predetermined variables and a third part is for the ivstyle which contains
strictly exogenous or exogenous variables. Xtabond2, unlike the previous xtabond, instruments the lagged
dependent variable using gmm style and iv style as well as uses system GMM estimator which provides a much
more efficient and consistent estimate than the difference GMM estimator.
23
2008). We have also checked GMM difference (not included in the table) where we found that
the estimates are far less than the fixed effects estimator. Using Monte Carlo experiments
Blundell et al. (2002) and Blundell and Bond (1998) show that the coefficients for the lagged
dependent variable are strongly biased downwards in the GMM difference model in case of
near unit root processes. Following this observation we exclude difference GMM estimator.
The estimates in the GMM system, however, lies between the upper bound of the OLS model
and the lower bound of the fixed effects model. Thus, we use the two-step system GMM in
estimating regional GDP growth.
Following identification of lag length 3 and the two-step system GMM estimator we estimate
and compare the regional GDP growth impacts of creative class and human capital over the
years 1998-2008. The first column in Table 6 reports the effects of creative class
(disaggregated into creative core, creative professional and Bohemia) on logs of regional GDP
while the second column provides results of the impacts of human capital [categorized into
human capital 1 (HC1), human capital 2 (HC2) and human capital 3 (HC)] on logs of regional
GDP. In addition, we include logs of employment (LEMP), logs of industry size (LIND) and
logs of population density (LPOP) as control variables. Because regional GDP could be
affected by a host of factors that may not be captured by regional specific effects we include
year dummy in order to control unobservable shocks (Roodman, 2009).
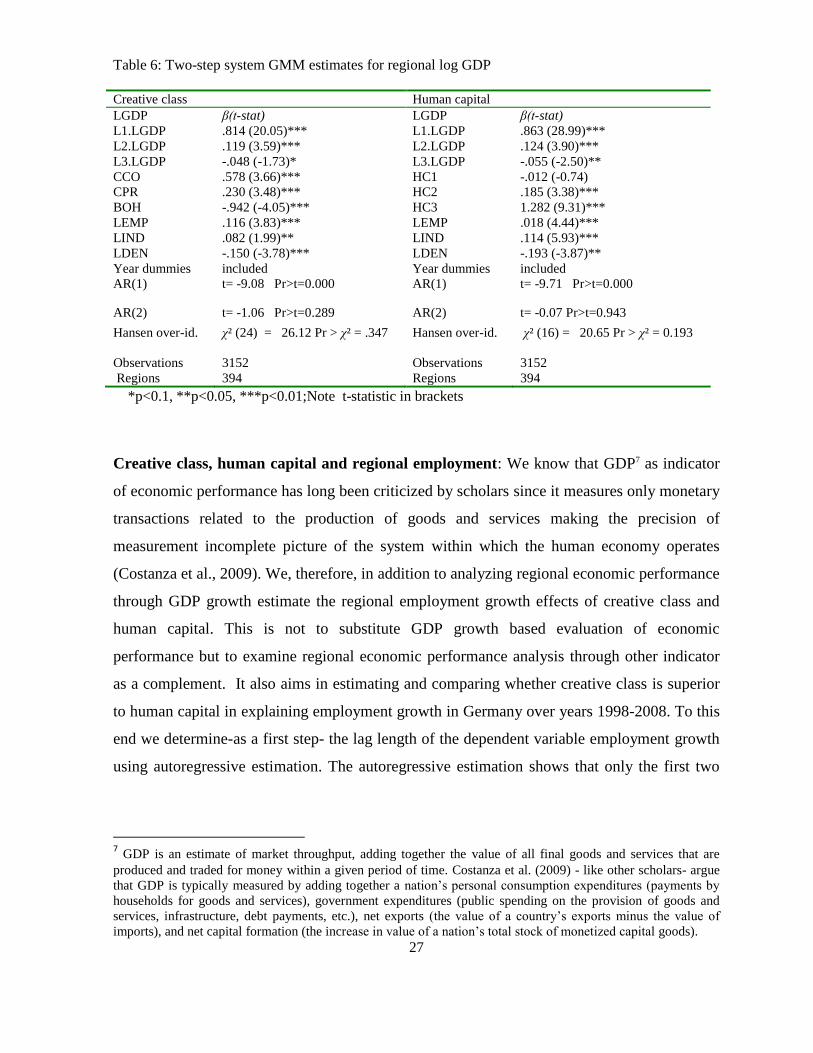
We find that the first two lags of GDP have positive and significant impacts on current GDP.
More specifically, the first and second lag of GDP has affected positively and significantly
contemporaneous regional GDP growth at p< 1% level. In the first column one can see that a
1% increase in the first lag of GDP is attributed to a 0.81% rise in regional real GDP, a 1%
growth of the second lag of GDP has an effect of increasing current GDP by 0.11%. The first
lag of GDP has, therefore, more impact than the second lag as the coefficient of the parameter
for the first lag appears to be more than the coefficient of the second lag. In the second column
too, the first and second lag of GDP have robust and positive impacts on growth of current
regional GDP where a 1% increase in the first and second lag of GDP have respectively
increased current regional GDP by 0.86% and 0.12%. The third lag of GDP has, however,
24
negative and significant impact on current GDP growth in both creative class and human
capital driven regional GDP growth model.
Florida’s (2002) theory that the creative class plays a critical role in regional economic growth
appears to be supported by our estimation to which the shares of the creative core and creative
professionals have each positive and robust impact on growth of regional GDP. A 1% increase
in the share of the creative core in a region is followed by a 0.58% increase in the growth of
contemporaneous regional GDP. The same is true for the creative professionals where a unit
percent increase in the share of the creative professionals have contributed to the growth of
regional GDP by about 0.23%. One can, however, observe that though the regional GDP
growth impacts of the share of creative core and creative professional are found to be robust at
1% level, it is the creative core that plays a bigger impact (the elasticity of real GDP growth
with respect to creative cores is more than with respect to creative professionals). The creative
class theory identifies the creative core and creative professionals to be university graduates
for whom the creative core work in areas of hard science, engineering, research and teaching
activities while the creative professionals are engaged in other occupations as associate
innovators. Since science and related areas happen to be of high significance for growth our
estimation result that the creative core is superior to creative professionals in explaining
regional GDP and of regional economy clearly corroborates the theory. However, contrary to
the contribution of Florida the impacts of the share of Bohemians on regional GDP growth are
not only negative but also significant at 1%. One may infer that professions of music, culture,
promotions, film, designs and the related have discouraging effect on economic performance.
Employment (LEMP) and industry size (LIND)-as control variables-have contributed
immense to regional growth. An increase in the number of the labor force tends to boost
growth of regions by about 0.11%. The result is an indication of the condition that increases in
employment is followed by a higher level of productivity growth. Growth of firm size should
also have a much higher effect on regional productivity to have a robust impact on regional
growth. On the contrary, the effects of population density have a negative and considerable
25
impact on the economic growth6 of regions. This is consistent with economic theory that an
increase in population density discourages growth and overall development when aggregate
population growth emanates from growth of inactive labor force, particularly, young and old.
In the second column the effects of human capital and control variables on regional GDP
growth are presented. As expected, the share of human capital 1 (HC1), that is, the share of the
aggregates of lower, junior and upper secondary graduates without vocational trainings have
negative impacts on regional growth. Nevertheless, the level of the impact is not considerable.
Indeed, in Germany a graduate with neither a vocational training nor a university qualification
will have a hard time in getting a job. Still worse even if a graduate without a vocational
training gets employed it would be so in a low paid job on a temporary basis. It would not,
therefore, be a surprise if the impact of human capital with low education or qualification
without vocational certificate brought negative impact on GDP growth.
On the contrary, the role of human capital 2 (HC2), that is, the share of lower, intermediate
and upper secondary school graduates and who has vocational training have had not only
positive but also substantial impacts on regional GDP growth, hence, confirming the
importance of vocational training in Germany. A unit percent increase in the share of HC2 is
followed by a 0.18 % growth in regional GDP over the years 1998-2008. In the same pattern,
the impact of HC3 (the share of University of applied science and University graduates) has
affected the economic growth of regions positively at 1% level. This is consistent with the
studies of Mincer (1958), Fabricant (1959), Becker (1960; 1993) and Shultz (1963) who
identified that tertiary education does contribute to economic growth substantially. The
elasticity of regional GDP growth with respect to HC 3 is found to be large enough in that a
1% increase in the share of university graduates increases performance of GDP growth of a
region by a 1.28%. This effect is more than what the creative core or creative professional
impacted GDP.
6 In standard economic literature, economic growth or just growth is expressed in terms of GDP. In this paper we
may interchangeably use GDP growth, economic growth as growth
26
We also learn that employment and firm size have considerable impacts on GDP growth.
However, the theory that creative class is superior to human capital in explaining regional
economic growth appears to be not supported by our empirical study. This is because we find
in the creative class and human capital driven GDP growth estimations almost equivalent in
which while the creative core and creative professional have positive and robust impacts on
regional GDP growth we also obtain that the impact of the share of university graduates on
GDP growth to be positive and substantial at 1% level. In fact, elasticity of GDP growth with
respect to HC3 is more than with respect to creative core or creative professional.
An important aspect here is whether the above interpretations are based on a properly
specified model. We have already shown that the two-step system GMM model is consistent
and unbiased as it’s the sum of the coefficients of the lags are in between pooled OLS and
within estimator. Further, a test of the specification of the regional GDP growth model using
the Arellano-Bond test of first order AR (1) and second order AR (2) that error terms are not
serially correlated and that there is no is endogeneity problem. This is proved by the results
were in the first order AR (1) we obtain p=0.000 which is far less than the threshold of p<0.05
and in the second order of the Arellano-Bond AR (2) we obtain p=0.289 when creative class is
used as explanatory variable and p=0.943 when human capital is used as independent variable
in which case both figures well above the required value of p>0.05. Besides, the Hansen over-
identification test p=0.347 when creative class is used as explanatory variable and p=0.193
when human capital is used as regressor show that the GDP growth model is not over-
identified. Therefore, we conclude that the estimated GDP growth model properly specified.
27
Table 6: Two-step system GMM estimates for regional log GDP
Creative class Human capital
LGDP β(t-stat) LGDP β(t-stat)
L1.LGDP .814 (20.05)*** L1.LGDP .863 (28.99)***
L2.LGDP .119 (3.59)*** L2.LGDP .124 (3.90)***
L3.LGDP -.048 (-1.73)* L3.LGDP -.055 (-2.50)**
CCO .578 (3.66)*** HC1 -.012 (-0.74)
CPR .230 (3.48)*** HC2 .185 (3.38)***
BOH -.942 (-4.05)*** HC3 1.282 (9.31)***
LEMP .116 (3.83)*** LEMP .018 (4.44)***
LIND .082 (1.99)** LIND .114 (5.93)***
LDEN -.150 (-3.78)*** LDEN -.193 (-3.87)**
Year dummies included Year dummies included
AR(1) t= -9.08 Pr>t=0.000 AR(1) t= -9.71 Pr>t=0.000
AR(2) t= -1.06 Pr>t=0.289 AR(2) t= -0.07 Pr>t=0.943
Hansen over-id. χ² (24) = 26.12 Pr > χ² = .347 Hansen over-id. χ² (16) = 20.65 Pr > χ² = 0.193
Observations 3152 Observations 3152
Regions 394 Regions 394
*p<0.1, **p<0.05, ***p<0.01;Note t-statistic in brackets
Creative class, human capital and regional employment: We know that GDP7 as indicator
of economic performance has long been criticized by scholars since it measures only monetary
transactions related to the production of goods and services making the precision of
measurement incomplete picture of the system within which the human economy operates
(Costanza et al., 2009). We, therefore, in addition to analyzing regional economic performance
through GDP growth estimate the regional employment growth effects of creative class and
human capital. This is not to substitute GDP growth based evaluation of economic
performance but to examine regional economic performance analysis through other indicator
as a complement. It also aims in estimating and comparing whether creative class is superior
to human capital in explaining employment growth in Germany over years 1998-2008. To this
end we determine-as a first step- the lag length of the dependent variable employment growth
using autoregressive estimation. The autoregressive estimation shows that only the first two
7 GDP is an estimate of market throughput, adding together the value of all final goods and services that are
produced and traded for money within a given period of time. Costanza et al. (2009) - like other scholars- argue
that GDP is typically measured by adding together a nation’s personal consumption expenditures (payments by
households for goods and services), government expenditures (public spending on the provision of goods and
services, infrastructure, debt payments, etc.), net exports (the value of a country’s exports minus the value of
imports), and net capital formation (the increase in value of a nation’s total stock of monetized capital goods).
28
lags of employment have robust impacts on employment growth and, therefore, we take the
first two lags length of employment for our analysis.
While the first-step system GMM is found to be appropriate for the creative class driven
employment growth model, for the human capital driven employment growth model two-step
GMM is identified to be suitable. In the creative class driven employment growth model a test
of the bias-free and consistency of the one-step system GMM shows that the sum of the
coefficients of the lag of log of employment is 0.900 in one-step GMM, it is 0.945 in pooled
OLS and 0.385. In this case 0.900 is in between the pooled OLS and fixed effects. Similarly,
in the human capital driven employment growth model the sum of the coefficients of the lag
dependent variable employment has 0.930 which is in between the coefficients in the pooled
OLS with 0.950 and that of the fixed effects (within) estimator with 0.407 (Table 7 in
Appendix). Therefore, we take the one-step (when creative class is used) and two step-system
(when human capital is used) GMM model in order to examine the extent to which creative
class and human capital may affect the performance (growth) employment in regions.
The results of the estimation are presented in Table 8. As anticipated, the first lag of
employment appeared to have positive and strong feedback on current employment in both the
creative class and human capital driven employment growth models. This does not, however,
has the same effect in both models because while a 1% increase in the first lag of employment
has contributed to a 1.14% growth of contemporary employment when the creative class is
used as regressor, same amount of increase (1% increase in the first lag of) employment is
followed by a 0.88% current employment growth when human capital is included as
explanatory variable. Moreover, it is interesting to observe a difference in the directions and
magnitudes of the employment growth impact of the second lag of employment while creative
class and human capital are used as explanatory variables. To be more specific, we observe
that while the second lag of employment has a negative and significant effect on the increase
of current employment in when creative class is included as explanatory variable the effect of
the second lag of employment on contemporary employment growth is positive but not robust
where human capital is taken as regressor. The difference could indicate that the share of the
creative class may contribute to positive employment growth only at a time when the creative
29
class are employed or just in the next immediate year. After that the creative class may rather
be not as productive as their first time employment or just in the following years to have
positive impact and consequently may discourage the growth of employment in two years. Or
it may be possible that the persistence of previous year employment in affecting present year
employment could be weak or even rather negative when creative classes are included.
The share of creative core and creative professionals has boosted regional employment at
p<1% level. One would argue that since the creative core are engaged in scientific,
engineering, research and teaching activities which all of such works tend to provide new
ideas, innovations and technology such will have a reinforcing effect in increasing output and
productivity of a region. The increase in output of a region tends to scale up the likelihood of
demand for and supply of labor. When the labor market is able to take up a significant share of
applicants there is a natural tendency to increase employment. The same applies to the case of
creative professionals where the presence of innovative labor force- whom Florida consider as
problem solvers and generators of new ideas- tends to increase the competency of knowledge
economy as well as competitiveness of a region. A region with well-functioning knowledge
economy provides tick labor market- a market resilient to even shocks where the employment
conditions tend to increase on a sustainable manner. Therefore, the argument that the creative
class (creative core and creative professional) play immense in regional economy performance
through employment growth is supported by our empirical evidence. However, if one would
compare the magnitude of the impact by the creative core and creative professional still
creative core has a greater effect. Moreover, the view that Bohemians- like the creative class-
affect regional labor market is not supported in this study. On the contrary Bohemians
contribute negatively to employment growth where the effect is found to be robust at 1% level.
Regarding the effect of conventional human capital on employment growth our result does
support the human capital theory underpinning that a tertiary level qualification promotes
employment growth by making the labor market so strong. As expected the share of lower,
intermediate and upper secondary school graduates without vocational training (HC1) have
negatively affected employment growth at 1% level. The presence of a large share of these
groups of people in a particular region would retard the economic performance of the region
30
because these people do not have the knowledge and capability to generate new ideas, to
innovate and to provide mechanisms that will solve socioeconomic problems. These
conditions constrain labor market-the demand for and supply of labor and of employment.
However, if lower, junior or secondary school qualification is complemented with vocational
training then the impact of human capital on employment growth is positive although the level
of impact is not significant. The share of university of applied sciences holders and university
graduates-like in the case of the GDP growth model we have seen before- has contributed to
employment growth of regions significantly at 1% level. It appears that the share of university
graduates; creative core and creative professionals have all significant impacts on enhancing
employment growth of regions. However, the elasticity of employment growth with respect to
the share of tertiary level graduates, creative core and creative professionals is not the same.
The creative core is superior to the creative professional and university graduates in increasing
employment growth for the reason that the beta of creative core is more than that of beta of
creative professionals and university graduates.
In addition to the creative class and human capital we include wage (LWAGE), years of work
experience (LEXPM), firm size (LIND) and population density (LDEN) as control variables in
the estimation of regional employment growth. There are, indeed, huge wage variations
among regions with the highest being in Stuttgart and Munich and the lowest in some eastern
parts of the country. The reason for the inclusion of wage as control variable emanates from
the observation that some regions with good wage have good labor market and employment
because these regions are rich and are able to hire a good number of employees. On the
contrary poor regions with low wage will have a discouraging effect on employment growth
because naturally people would like to be employed in regions where wage is better. We also
include experience as a relevant control variable with the expectation that having had proven
work experience tends to have an encouraging effect on employment growth since the more
people have good experience the high is the likelihood that these people will have a greater
productivity effect as they could work with efficient and with minimal supervision the
eventual phenomena could result in increasing the employability condition of a region.
31
Against our expectation, the regional employment growth impact of wage is found to be
negative when creative class is used as explanatory variable. This result, although not
significant, is consistent with economic theory that an increase in the wage level should be
reflected in a decrease in the employment condition (Flinn, 2011 and 2006; Even and
Macpherson, 2003). The theory argues that if more are employed, wage should go down in
order to accommodate as many employees as possible. However, the impact of wage on
employment growth-when human capital is used as explanatory variable- appears to be
positive and significant at 1% level. This does not only reject the classical view that wage and
employment go in opposite directions but also indicate that the inclusion of human capital
instead of creative class could change the direction of the effect from the conventional into the
unconventional one. Moreover, as expected, mean years of experience of an employee has
positive influence on employment growth when creative class and human capital are used as
covariates. However, while the influence is significant at 1% level when human capital is used
as covariate the effect is not robust when creative class is employed as explanatory variable.
Firm size has negative and robust impact on employment growth when creative class is used
and positive and insignificant effect when human capital is used. Population density, as
anticipated, has a discouraging and significant effect on employment growth in the human
capital driven employment growth model but has a positive and robust impact in the creative
class based regional employment growth model.
A final point for the creative class and human capital driven regional employment growth
model is to make sure that the discussions made above are on the basis of a properly specified
model. We know that 0)cov( ,, ktiit for K=1, 2, 3 is rejected at a level of 0.05 if
p<0.05. If ti, are serially uncorrelated we expect to reject at order 1 but not at higher orders
Cameron and Trivedi, 2009). This is, indeed, the case in our estimation of employment growth
using creative class and human capital where we reject absence of serial correlation at AR (1)
or order 1 because p=0.000. At order two AR (2) 2, titi and are serially uncorrelated
because we find p=0.587 when creative class is used as covariates and p=0.062 when human
capital is used as driver of employment to which in both cases p>0.05. Moreover, the Hansen
over-identification test of p=0.447 when employment growth is estimated using creative class
and is p=0.984 when human capital is used shows that the number of variables used as
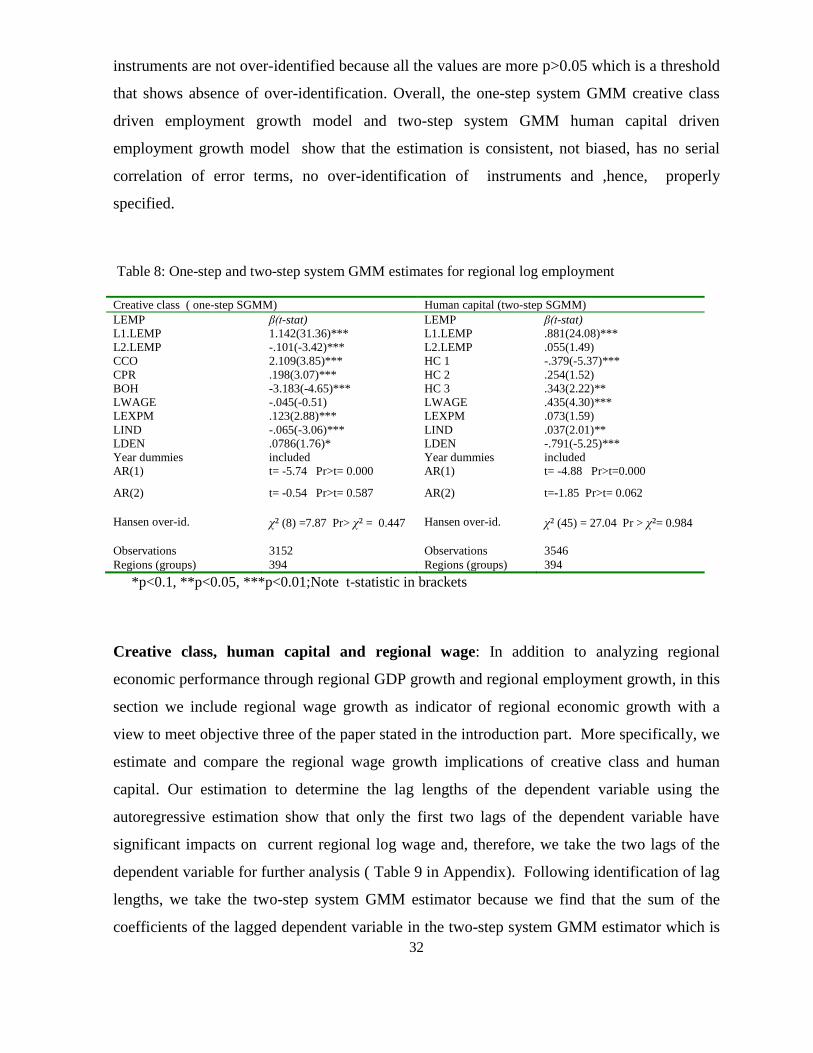
32
instruments are not over-identified because all the values are more p>0.05 which is a threshold
that shows absence of over-identification. Overall, the one-step system GMM creative class
driven employment growth model and two-step system GMM human capital driven
employment growth model show that the estimation is consistent, not biased, has no serial
correlation of error terms, no over-identification of instruments and ,hence, properly
specified.
Table 8: One-step and two-step system GMM estimates for regional log employment
Creative class ( one-step SGMM) Human capital (two-step SGMM)
LEMP β(t-stat) LEMP β(t-stat)
L1.LEMP 1.142(31.36)*** L1.LEMP .881(24.08)***
L2.LEMP -.101(-3.42)*** L2.LEMP .055(1.49)
CCO 2.109(3.85)*** HC 1 -.379(-5.37)***
CPR .198(3.07)*** HC 2 .254(1.52)
BOH -3.183(-4.65)*** HC 3 .343(2.22)**
LWAGE -.045(-0.51) LWAGE .435(4.30)***
LEXPM .123(2.88)*** LEXPM .073(1.59)
LIND -.065(-3.06)*** LIND .037(2.01)**
LDEN .0786(1.76)* LDEN -.791(-5.25)***
Year dummies included Year dummies included
AR(1) t= -5.74 Pr>t= 0.000 AR(1) t= -4.88 Pr>t=0.000
AR(2) t= -0.54 Pr>t= 0.587 AR(2) t=-1.85 Pr>t= 0.062
Hansen over-id. χ² (8) =7.87 Pr> χ² = 0.447 Hansen over-id. χ² (45) = 27.04 Pr > χ²= 0.984
Observations 3152 Observations 3546
Regions (groups) 394 Regions (groups) 394
*p<0.1, **p<0.05, ***p<0.01;Note t-statistic in brackets
Creative class, human capital and regional wage: In addition to analyzing regional
economic performance through regional GDP growth and regional employment growth, in this
section we include regional wage growth as indicator of regional economic growth with a
view to meet objective three of the paper stated in the introduction part. More specifically, we
estimate and compare the regional wage growth implications of creative class and human
capital. Our estimation to determine the lag lengths of the dependent variable using the
autoregressive estimation show that only the first two lags of the dependent variable have
significant impacts on current regional log wage and, therefore, we take the two lags of the
dependent variable for further analysis ( Table 9 in Appendix). Following identification of lag
lengths, we take the two-step system GMM estimator because we find that the sum of the
coefficients of the lagged dependent variable in the two-step system GMM estimator which is
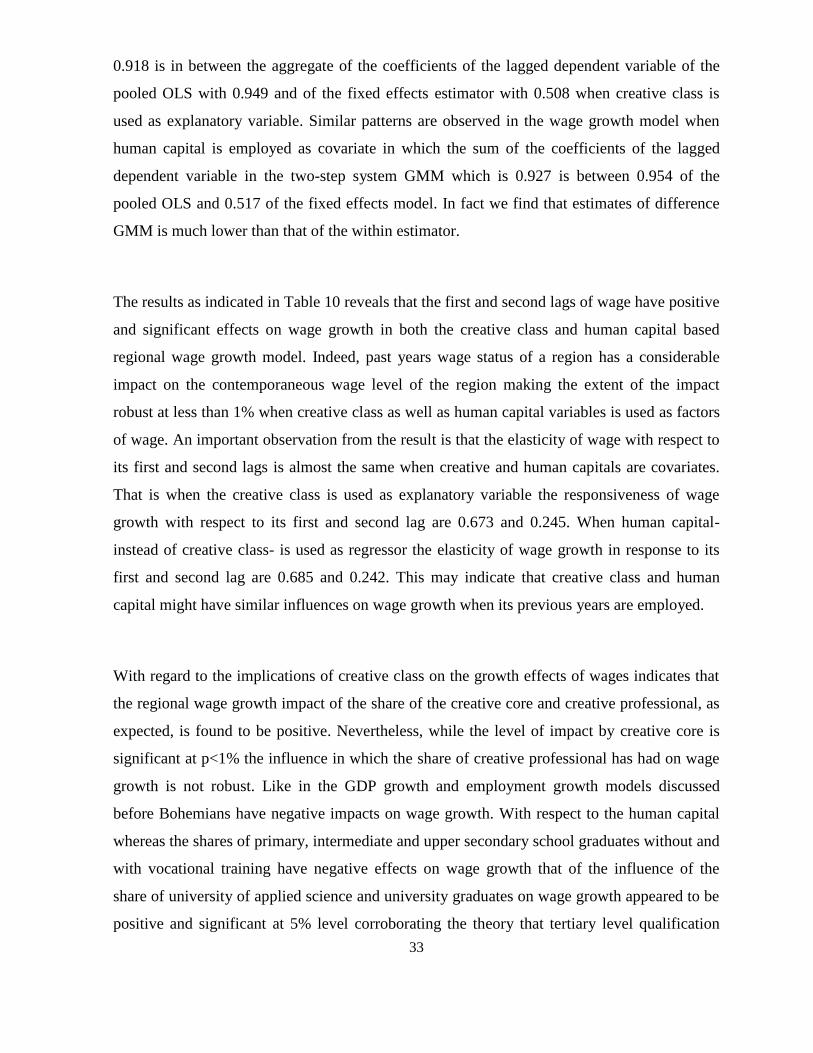
33
0.918 is in between the aggregate of the coefficients of the lagged dependent variable of the
pooled OLS with 0.949 and of the fixed effects estimator with 0.508 when creative class is
used as explanatory variable. Similar patterns are observed in the wage growth model when
human capital is employed as covariate in which the sum of the coefficients of the lagged
dependent variable in the two-step system GMM which is 0.927 is between 0.954 of the
pooled OLS and 0.517 of the fixed effects model. In fact we find that estimates of difference
GMM is much lower than that of the within estimator.
The results as indicated in Table 10 reveals that the first and second lags of wage have positive
and significant effects on wage growth in both the creative class and human capital based
regional wage growth model. Indeed, past years wage status of a region has a considerable
impact on the contemporaneous wage level of the region making the extent of the impact
robust at less than 1% when creative class as well as human capital variables is used as factors
of wage. An important observation from the result is that the elasticity of wage with respect to
its first and second lags is almost the same when creative and human capitals are covariates.
That is when the creative class is used as explanatory variable the responsiveness of wage
growth with respect to its first and second lag are 0.673 and 0.245. When human capital-
instead of creative class- is used as regressor the elasticity of wage growth in response to its
first and second lag are 0.685 and 0.242. This may indicate that creative class and human
capital might have similar influences on wage growth when its previous years are employed.
With regard to the implications of creative class on the growth effects of wages indicates that
the regional wage growth impact of the share of the creative core and creative professional, as
expected, is found to be positive. Nevertheless, while the level of impact by creative core is
significant at p<1% the influence in which the share of creative professional has had on wage
growth is not robust. Like in the GDP growth and employment growth models discussed
before Bohemians have negative impacts on wage growth. With respect to the human capital
whereas the shares of primary, intermediate and upper secondary school graduates without and
with vocational training have negative effects on wage growth that of the influence of the
share of university of applied science and university graduates on wage growth appeared to be
positive and significant at 5% level corroborating the theory that tertiary level qualification
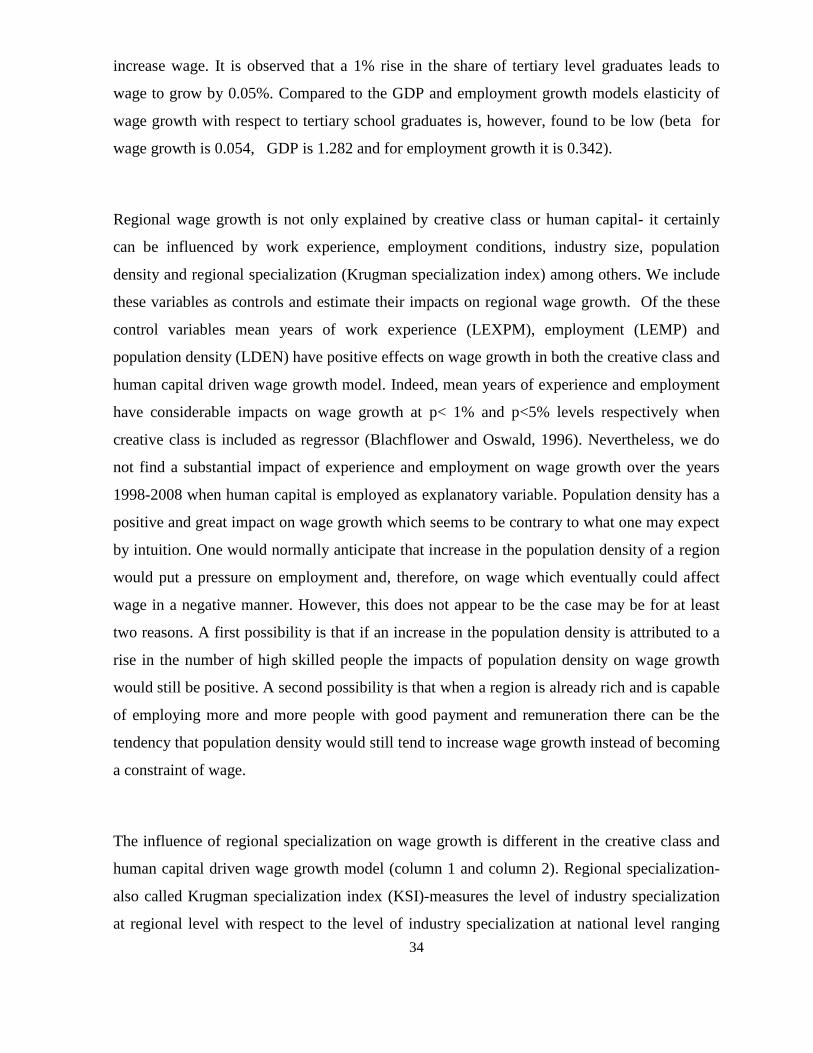
34
increase wage. It is observed that a 1% rise in the share of tertiary level graduates leads to
wage to grow by 0.05%. Compared to the GDP and employment growth models elasticity of
wage growth with respect to tertiary school graduates is, however, found to be low (beta for
wage growth is 0.054, GDP is 1.282 and for employment growth it is 0.342).
Regional wage growth is not only explained by creative class or human capital- it certainly
can be influenced by work experience, employment conditions, industry size, population
density and regional specialization (Krugman specialization index) among others. We include
these variables as controls and estimate their impacts on regional wage growth. Of the these
control variables mean years of work experience (LEXPM), employment (LEMP) and
population density (LDEN) have positive effects on wage growth in both the creative class and
human capital driven wage growth model. Indeed, mean years of experience and employment
have considerable impacts on wage growth at p< 1% and p<5% levels respectively when
creative class is included as regressor (Blachflower and Oswald, 1996). Nevertheless, we do
not find a substantial impact of experience and employment on wage growth over the years
1998-2008 when human capital is employed as explanatory variable. Population density has a
positive and great impact on wage growth which seems to be contrary to what one may expect
by intuition. One would normally anticipate that increase in the population density of a region
would put a pressure on employment and, therefore, on wage which eventually could affect
wage in a negative manner. However, this does not appear to be the case may be for at least
two reasons. A first possibility is that if an increase in the population density is attributed to a
rise in the number of high skilled people the impacts of population density on wage growth
would still be positive. A second possibility is that when a region is already rich and is capable
of employing more and more people with good payment and remuneration there can be the
tendency that population density would still tend to increase wage growth instead of becoming
a constraint of wage.
The influence of regional specialization on wage growth is different in the creative class and
human capital driven wage growth model (column 1 and column 2). Regional specialization-
also called Krugman specialization index (KSI)-measures the level of industry specialization
at regional level with respect to the level of industry specialization at national level ranging
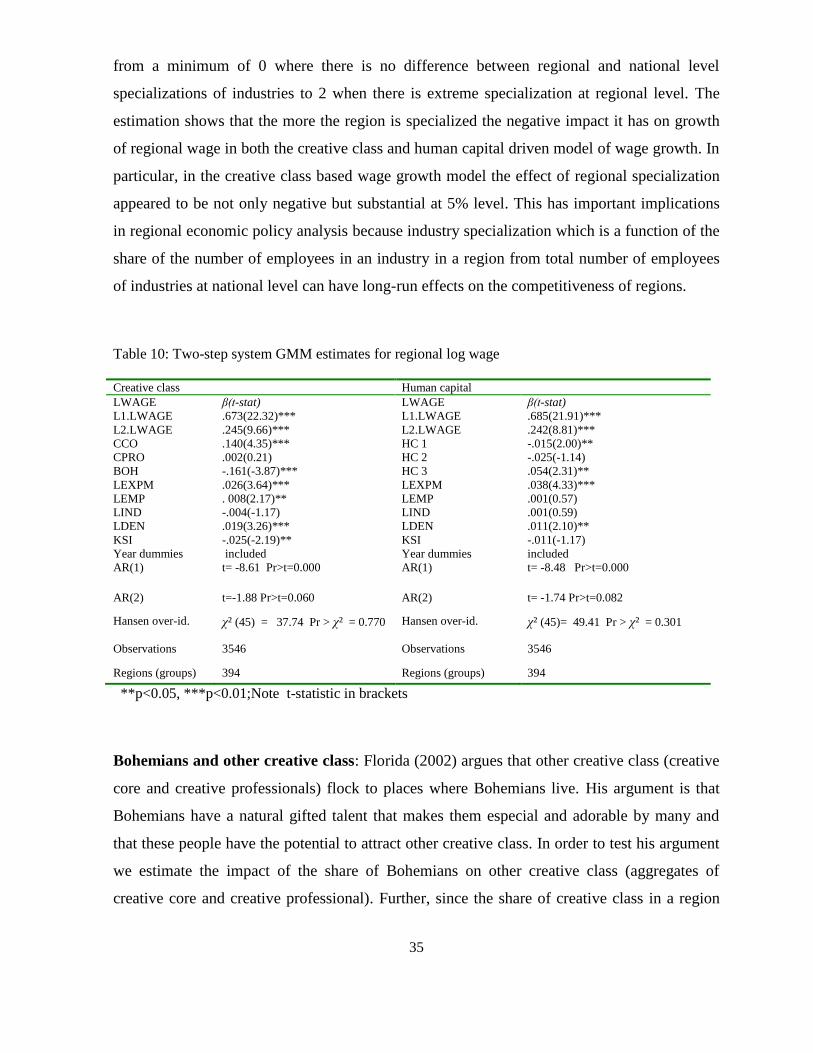
35
from a minimum of 0 where there is no difference between regional and national level
specializations of industries to 2 when there is extreme specialization at regional level. The
estimation shows that the more the region is specialized the negative impact it has on growth
of regional wage in both the creative class and human capital driven model of wage growth. In
particular, in the creative class based wage growth model the effect of regional specialization
appeared to be not only negative but substantial at 5% level. This has important implications
in regional economic policy analysis because industry specialization which is a function of the
share of the number of employees in an industry in a region from total number of employees
of industries at national level can have long-run effects on the competitiveness of regions.
Table 10: Two-step system GMM estimates for regional log wage
Creative class Human capital
LWAGE β(t-stat) LWAGE β(t-stat)
L1.LWAGE .673(22.32)*** L1.LWAGE .685(21.91)***
L2.LWAGE .245(9.66)*** L2.LWAGE .242(8.81)***
CCO .140(4.35)*** HC 1 -.015(2.00)**
CPRO .002(0.21) HC 2 -.025(-1.14)
BOH -.161(-3.87)*** HC 3 .054(2.31)**
LEXPM .026(3.64)*** LEXPM .038(4.33)***
LEMP . 008(2.17)** LEMP .001(0.57)
LIND -.004(-1.17) LIND .001(0.59)
LDEN .019(3.26)*** LDEN .011(2.10)**
KSI -.025(-2.19)** KSI -.011(-1.17)
Year dummies included Year dummies included
AR(1) t= -8.61 Pr>t=0.000 AR(1) t= -8.48 Pr>t=0.000
AR(2) t=-1.88 Pr>t=0.060 AR(2) t= -1.74 Pr>t=0.082
Hansen over-id. χ² (45) = 37.74 Pr > χ² = 0.770 Hansen over-id. χ² (45)= 49.41 Pr > χ² = 0.301
Observations 3546 Observations 3546
Regions (groups) 394 Regions (groups) 394
**p<0.05, ***p<0.01;Note t-statistic in brackets
Bohemians and other creative class: Florida (2002) argues that other creative class (creative
core and creative professionals) flock to places where Bohemians live. His argument is that
Bohemians have a natural gifted talent that makes them especial and adorable by many and
that these people have the potential to attract other creative class. In order to test his argument
we estimate the impact of the share of Bohemians on other creative class (aggregates of
creative core and creative professional). Further, since the share of creative class in a region
36
can certainly be explained by a number of factors other than just Bohemians we include
employment, economic growth, industry size, and population density as controls.
The determination of lag lengths using the autoregressive estimation reveals that the first two
lags of the share of the creative class have robust impacts on the share of the creative class.
Beyond the second lag the effect is found to be insignificant and, therefore, we take only the
first two lags for analysis. This leads us to identify the kind of the dynamic panel model that
fits to the data where we find one-step forward orthogonal or system GMM estimator to be
appropriate. The system GMM is suitable because, the sum of the coefficients of the lagged
dependent variables of the creative class in the one-step system GMM estimator which is
0.654 is in between the coefficients of the pooled OLS with 0.903 and fixed effects with
0.409, a requirement for consistent and efficient estimation in dynamic panel (Table 11 in
Appendix). The first lag of the share of creative class has, indeed, positive and commendable
impact on the share of current creative class. In particular, it is identified that a 1% increase in
the share of the first lag of creative class (creative core and creative professional) appears to
increase current share of creative class (CCL) by about 0.64 %. Contrary to this the second
lag has a negative effect on creative class with the level of impact being robust at 10% level.
It is interesting to observe from the estimation result that Florida’s (2002) creative class theory
that Bohemians attract other creative class (creative core and creative professionals) is
supported because the effect of the share of Bohemians on the distribution of the share of the
creative class is found to be positive and robust at 1% level. This is consistent with the results
of Boschma and Fritsch (2009) who find strong relationships between Bbohemians and the
creative class at regional level in a study that covered six European countries. They also
indicate that Bohemians have positive influence on the geography of creative people. A high
proportion of bohemians tend to indicate dense local culture, lifestyle, and set of values that
are different from those of mainstream. Bohemians, being artistically creative, could add a
sense of liveliness to a location as well as openness to different lifestyles and values which
would then make the region attractive to creative class. Nevertheless, our result is at odds with
the contributions of Moller and Tubadji (2009) who find that the influence of Bohemians on
37
creative class is not significant. However, their estimation is limited to West Germany for 323
regions with periods spanning from 1975 to 2004 by collapsing the thirty years into six panels.
All control variables-logs of employment, logs of GDP, logs of firm size and population
density have positive impacts on the share of the creative class. Existence of good labor
market (employment with good pay) in a region has a natural tendency to attract a significant
share of the creative class because employment is after all life and life without employment is
hard. For a 1% increase in the logs of employment in a region tends to, keeping all other
things constant, increase the share of creative class by 0.50% in a corresponding region.
Similarly, we observe that regions with commendable GDP records attract considerable
number of creative class because such rich regions have the capacity to employee as many
innovative people as possible to further continue as being competent. The elasticity of the
share of creative class with respect to logs of GDP is 0.08 a figure less than the elasticity of
creative class when employment is used. Overall, the conditions of employment of a region as
well as the GDP level of a region do impact the distribution of creative class at 1% level.
Regarding the specification of the creative class model we find that the Arellano-Bond test of
the first order AR (1) proves that there is no autocorrelations of the idiosyncratic error terms as
the p=0.000 is well less than the required threshold of 0.05. The second order AR (2) value
which is p=0.593 well above the required p>0.05 also confirms that the estimated model does
not have any serial correlation problem which further indicates that there is no problem of
endogeneity. Besides, the Hansen (robust) test of over-identifications with p= 0.204>0.05
rejects the null hypothesis that the model is over-identified. Therefore, we conclude that the
bohemian driven creative class model maintains the requirements of the dynamic panel and
that it is correctly specified.
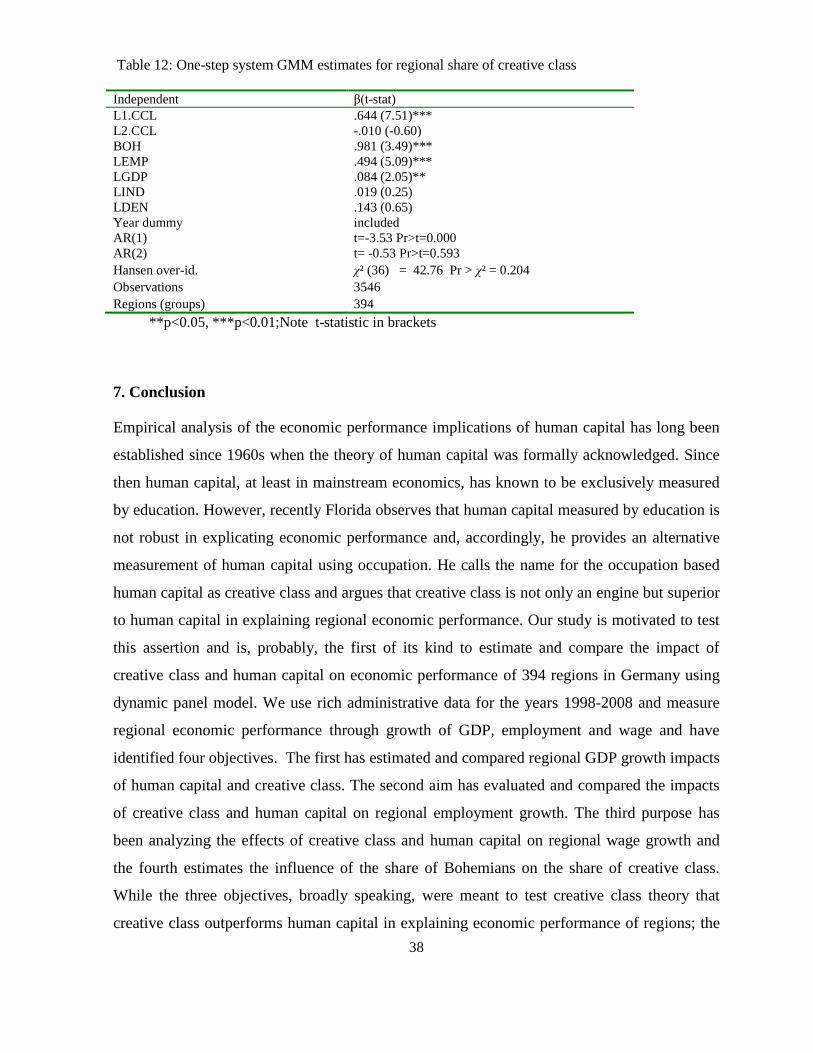
38
Table 12: One-step system GMM estimates for regional share of creative class
Independent β(t-stat)
L1.CCL .644 (7.51)***
L2.CCL -.010 (-0.60)
BOH .981 (3.49)***
LEMP .494 (5.09)***
LGDP .084 (2.05)**
LIND .019 (0.25)
LDEN .143 (0.65)
Year dummy included
AR(1) t=-3.53 Pr>t=0.000
AR(2) t= -0.53 Pr>t=0.593
Hansen over-id. χ² (36) = 42.76 Pr > χ² = 0.204
Observations 3546
Regions (groups) 394
**p<0.05, ***p<0.01;Note t-statistic in brackets
7. Conclusion
Empirical analysis of the economic performance implications of human capital has long been
established since 1960s when the theory of human capital was formally acknowledged. Since
then human capital, at least in mainstream economics, has known to be exclusively measured
by education. However, recently Florida observes that human capital measured by education is
not robust in explicating economic performance and, accordingly, he provides an alternative
measurement of human capital using occupation. He calls the name for the occupation based
human capital as creative class and argues that creative class is not only an engine but superior
to human capital in explaining regional economic performance. Our study is motivated to test
this assertion and is, probably, the first of its kind to estimate and compare the impact of
creative class and human capital on economic performance of 394 regions in Germany using
dynamic panel model. We use rich administrative data for the years 1998-2008 and measure
regional economic performance through growth of GDP, employment and wage and have
identified four objectives. The first has estimated and compared regional GDP growth impacts
of human capital and creative class. The second aim has evaluated and compared the impacts
of creative class and human capital on regional employment growth. The third purpose has
been analyzing the effects of creative class and human capital on regional wage growth and
the fourth estimates the influence of the share of Bohemians on the share of creative class.
While the three objectives, broadly speaking, were meant to test creative class theory that
creative class outperforms human capital in explaining economic performance of regions; the
39
fourth objective was meant for testing creative class theory that Bohemians has a positive
impact on the distribution of creative class (creative core and creative professionals).
The impact of the share of creative core and creative professionals on regional GDP growth is
positive and significant at 1% level confirming creative class theory that creative capital plays
a significant role in enhancing economic performance of regions through GDP growth. By the
same token, regional GDP growth effects of the share of university graduates is also found to
be positive and robust at 1% level supporting the conventional human capital theory that
higher level education does have a positive role in economic growth. It is, therefore, vivid that
the contemporary creative class and the conventional human capital approaches have both
relevant explanatory potential in the betterment of regional economic growth. Nevertheless,
Florida’s theory that creative class is superior to human capital (share of university graduates)
in explaining regional GDP growth is not supported because the elasticity of regional GDP
growth with respect to human capital (share of university graduates) is greater than that of the
elasticity of GDP growth with respect to creative core or creative professionals.
On the other hand, while employment growth effects of creative core and creative professional
are robust at p<0.01 the impact human capital (share of tertiary school graduates) has on
employment growth is robust at p<0.05. This corroborates Florida’s thesis that creative class
outperforms human capital in explicating regional employment growth which is one of the
indicators of regional economic performance. This is contrary to what we get in the GDP
growth model where the role of human capital is identified to have a greater influence on GDP
growth than the creative class has. Moreover, in the regional growth model the share of the
creative core and university graduates have substantial roles in enhancing growth of regional
wage. That the presence of scientists, engineers, researchers and faculty members in a region
has positive impact in increasing wage level because these people have the tendency to boost
the economy of the specific territory and eventually of wage conditions of a region.
We also learn that although the implications of the share of creative cores and of the share of
university graduates have great influences on growth of wage it is the creative core that has
40
impressive impact subscribing the views of Florida. However, unlike the previous two models,
the effect that creative professionals have on growth of wage is not robust. Moreover, albeit
the effects of bohemians on GDP growth, employment growth and wage growth are found to
be negative we confirm one of the creative class theories that Bohemians have robust impact
on the distribution of creative class. Overall, our empirical evidence reveals that analysis of
regional economy through creative class in place of conventional human capital could serve as
an innovative approach yet creative class, as argued by Florida, is not all the time superior to
human capital in explaining regional economy. Indeed, even if the share of creative core,
creative professionals and tertiary level graduates have robust impacts on GDP growth it is by
no means the share of tertiary level graduates that have a far greater impact on economic
growth. The reverse holds for employment growth and is inconclusive for wage growth.
Acknowledgements
We would like to thank the Institute for Employment Research (IAB) of the Federal
Employment Agency of Germany for the permission to use the Sample of Integrated Labor
Market Biographies (SIAB 1975-2008) panel data. We are highly indebted and truly thankful
to the great facilities we got at the IAB data center and for the genuine assistances we received
from Dana Muller, Dr. Jorg Heining, Philipp vom Berge, Dr. Udo Brixy, and Matthias Dorner.
We are also grateful for the very constructive technical and/or methodological comments we
benefited from Prof. Dr. Joachim Moller, Dr. Katja Wolf, and Dr. Annie Tubadji,
41
References
Ahn, S and Schmidt, P (1995). Efficient estimation of models for dynamic panel data. Journal of
Econometrics 68 (1):5-27
Almeida, P. and Kogut, B (1999). Localization of knowledge and the mobility of engineers in regional
networks. Management Science 45(7): 905-917
Andersen, K., Hansen, H., Isaksen, A and Raunio, M (2010). Nordic city regions in the creative class
debate-putting the creative class thesis to a test. Industry and Innovation 17(2):215-240
Anderson, T and Hasio, C (1981). Estimation of dynamic models with error components. Journal of the
American Statistical Association 76(375):598-606
Arellano, M (2003). Panel data econometrics: Advanced texts in econometrics. First Edition, Oxford
University Press
Arellano, M and Bond, S (1991). Some tests of specification for panel data: Monte Carlo evidence and
an application to employment equations. The Review of Economic Studies 58(2):277-297
Arellano, M and Bover, O (1995). Another look at the instrumental variable estimation of error-
components models. Journal of Econometrics 68(1):29-51
Asheim ,B and Hansen, H (2009). Knowledge bases, talents and contexts: On the usefulness of the
creative class approach in Sweden. Journal of Economic Geography 85(4):425-442
Baltagi, B (2008). Econometric analysis of panel data. Fourth Edition, John Wiley and Sons Ltd, UK
Becker, G.(1993). Human capital: A theoretical and empirical analysis with special reference to
education. 3rd
edition. The University of Chicago Press, Chicago 60637
………….(1960). Underinvestment in college education? The American Economic Review 50(2):346-
354
Blanchflower, D and Oswald, A (1996). The wage curve. Cambridge, MA, MIT Press
Blundell , R., Griffith, R. and Wedmeijer, F (2002). Individual effects and dynamics in count
data models. Journal of Econometrics 108 (1):113-131
Blundell, R and Bond, S (1998). Initial conditions and moment restrictions in dynamic panel data
models. Journal of Econometrics 87(1):115-143
Boschma, R and Fritsch, M (2009). Creative class and regional growth. Empirical evidence from seven
European Countries. Journal of Economic Geography 85 (4):391-423
Borgaza, C. and Defourny, J. (2001) The emergence of social enterprise. New York: Routledge
Cameron, A and Trivedi, P. (2009). Microeconometrics using stata. College Station, Texas
Costanza, R., Hart, M., Posner, S. and Talberth , J (2009). Beyond GDP: The need for new measure of
progress. The Pardee Papers #4
European Union (2013) Social innovation research in the European Union. Approaches, findings and
future directions. Directorate-General for Research and Innovation, Socio-economic Sciences
and Humanities. Luxembourg: Publications Office of the European Union, 2013.
Even, W. and Macpherson, D. (2003). The wage and employment dynamics of minimum wage workers.
Southern Economic Journal 69 (3):676-690
42
Fabricant, S. (1959). Basic facts on productivity change. New York: National Bureau of Economic
Research # 63.
Flinn, C. (2011). The minimum wage and labor market outcomes. Cambridge: The MIT Press
----------(2006). Minimum wage effects on labor market outcomes under search, matching, and
endogenous contact rates. Econometrica 74(4):1013-1062
Fukuyama, F. (1995). Trust: The social virtues and the creation of prosperity. New York: Free Press.
Florida, R.(2005) . The flight of the creative class: The global competition for talent. Collins
…….. (2004). Cities and the creative class. Routledge. London
……….(2002a). Bohemia and economic geography. Journal of Economic Geography 2(1):55-71
………..(2002). The rise of the creative class: And how it's transforming work, leisure, community and
everyday life. Basic Books. First Edition
Florida, R and Mellander, C (2009). Human capital, the creative class and tolerance: Effects on regional
wages and income. The Annals of Regional Sciences 10: 1-24
Florida, R., Mellander, C., and Stolarick, K (2010). Talent, technology and tolerance in Canadian
regional development. The Canadian Geographer 54(3):277-304
Florida, R., Mellander. C, and Stolarick, K (2008). Inside the black box of regional development-human
capital, the creative class and tolerance. Journal of Economic Geography 8(5):615-649
Fritsch, M and Stutzer, M (2008). The geography of creative people in Germany. MPRA.
Glaeser, E., Kallal, H., Scheinkman, J, and Shleifer, A (1992). Growth in cities. Journal of Political
Economy 100(6):1126-1152
Glaeser, E(2005). Review of Richard Florida’s “The rise of the creative class”. Regional Science and
Urban Economics 35(5):593-596
Hansen, H and Niedomysl, T (2009). Migration of the creative class: Evidence from Sweden. Journal of
Economic Geography 9(2):191-206
Holtz-Eakin, D., Newey, W., Rosen, H (1988). Estimating vector autoregressions with panel data.
Econometrica 56 (6):1371-1395
Hsiao, C (2003). Analysis of panel data. Second Edition. University of Southern California
ILO (1993). The revised international standard classification of occupation. Bureau of Statistics,
Geneva
Isard, W. (1960). Methods of regional analysis: An introduction to regional science.
Cambridge: Massachusetts Institute of Technology and Wiley, New York
Koo, J (2005). How to analyze the regional economy with occupation data. Economic Development
Quarterly 19(4):356-372
Krugman, P. (1990). The Age of Diminished Expectations. Washington: Washington Post Company.
Lengyel, B and Sagvari, B (2011). Creative occupations and regional development in Hungary: Mobility
of talent in a one-centered transition economy. European Planning Studies 19(12): 2073-2093
Malanga, S (2004). The curse of the creative class. Opinion Journal. Available at: Accessed 08/11/2011
from: www.opinionjournal.com
Markusen, A (2006).Urban development and the politics of a creative class: Evidence from a study of
Artists. Environment and Planning 38(10):1921-1940
43
……….. (2004). Targeting occupations in regional and community economic development. Journal of
the American Planning Association 70(3):253-268
Markusen, A., Wassall, G., DeNatale, D and Cohen, R (2008). Defining the creative economy industry
and occupational approaches. Economic Development Quarterly 22(1): 24-45
Marlet, G and van Woerkens, C (2004).Skills and creativity in a cross-section of Dutch Cities. Tjalling
C. Koopmans Research Institute. Discussion Paper Series 04-29
Mathur, V (1999). Human capital-based strategy for regional economic development. Economic
Development Quarterly 13(3):203-216
Mellander, C and Florida, R (2011). Creativity, talent and regional wages in Sweden. Annals of
Regional Science 46:637–660
…………..(2007). The creative class or human capital? CESIS Working Paper Series # 79
Mincer, J. (1958). Investment in human capital and personal income distribution. The Journal of
Political Economy 66 (4): 281-302
Moller, J and Tubadji, A (2009). The creative class, Bohemians and local labor performance: A micro-
data panel study of Germany 1975-2004. ZEW Discussion Paper No 08-135
Nickell, S. (1981). Biases in dynamic models with fixed effects. Econometrica 49 (6):1417-
1426
OECD (1993)Industrial policy in OECD Countries. Annual Review. Paris: OECD.
OECD (1996) Science, Technology and Industry Outlook, Paris: OECD.
Peck, J (2005). Struggling with creative class. International Journal of Urban and Regional Research
29(4):740–770
Putnam, R. D. (1993). Making democracy work: Civic traditions in modern Italy. Princeton: Princeton
University Press.
Roodman, D. (2009). How to do xtabond2: An introduction to difference and system GMM in
Stata. The Stata Journal 9 (1):86-136
Sacchetti, S. and Sugden, R. (2009) The organization of production and its publics: Mental proximity,
markets and hierarchies. Review of Social Economy, LXVII: 289-311.
Sacchetti, F., Sacchetti, S. and Sugden, R. (2009) Creativity and socio-economic development: space for
the interests of publics, International Review of Applied Economics, 23(6): 653-672.
Sacchetti, S. and Tortia, E. (2013). Satisfaction with creativity: A study of organizational characteristics
and individual motivation. Journal of Happiness Studies DOI: 10.1007/s10902-012-9410-y
Schultz, T. (1963). The economic value of education. New York: Columbia University Press.
………….. (1961). Investment in human capital. The American Economic Review 51(1):1-17
Scott, A (2006). Creative cities: Conceptual issues and policy questions. Journal of Urban Affair
28(1):1–17
Sen, A. (2002). Rationality and freedom, Cambridge (Mass.) Harvard University Press.
Stolarick, K and Florida, R (2006). Creativity, connections and innovation: A study of linkages in the
Montreal region. Environment and Planning A 38(10):1799-1817
Theodore, N., and Carlson. V. (1998). Targeting job opportunities: Developing measures of
local employment. Economic Development Quarterly 12 (2):137-49
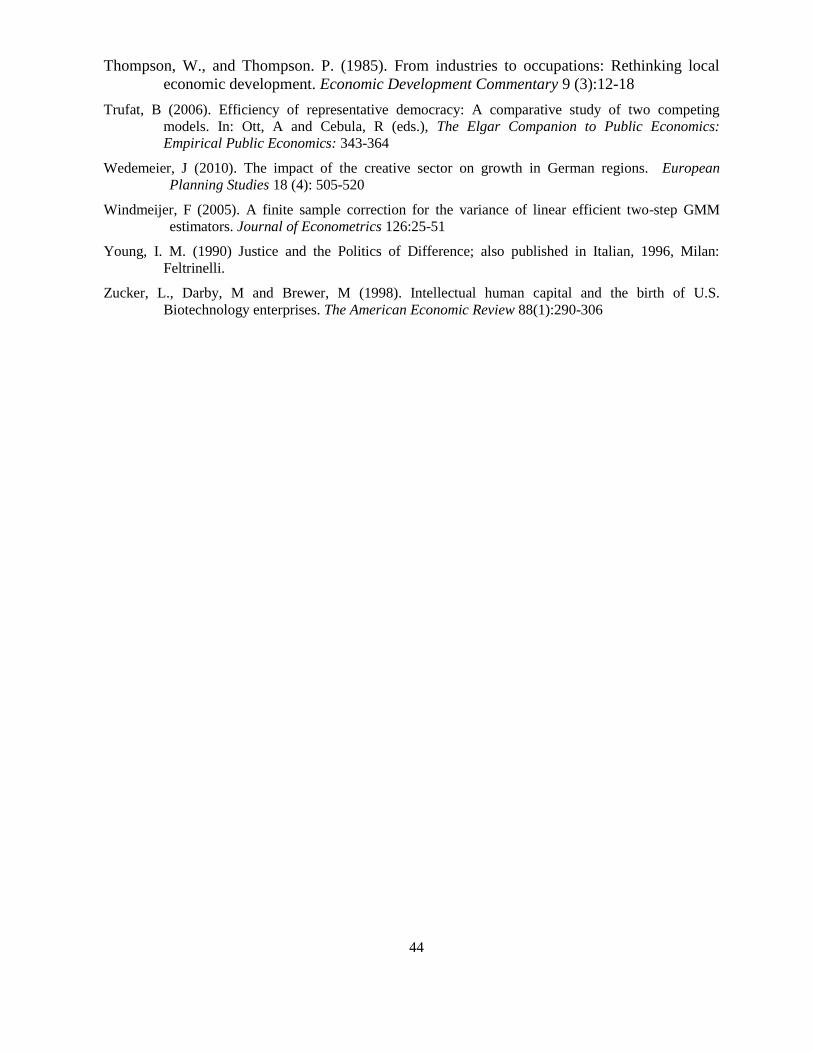
44
Thompson, W., and Thompson. P. (1985). From industries to occupations: Rethinking local
economic development. Economic Development Commentary 9 (3):12-18
Trufat, B (2006). Efficiency of representative democracy: A comparative study of two competing
models. In: Ott, A and Cebula, R (eds.), The Elgar Companion to Public Economics:
Empirical Public Economics: 343-364
Wedemeier, J (2010). The impact of the creative sector on growth in German regions. European
Planning Studies 18 (4): 505-520
Windmeijer, F (2005). A finite sample correction for the variance of linear efficient two-step GMM
estimators. Journal of Econometrics 126:25-51
Young, I. M. (1990) Justice and the Politics of Difference; also published in Italian, 1996, Milan:
Feltrinelli.
Zucker, L., Darby, M and Brewer, M (1998). Intellectual human capital and the birth of U.S.
Biotechnology enterprises. The American Economic Review 88(1):290-306

45
Appendix
Table 2: Creative class and Bohemia identification using IAB database, Germany
Occupational category IAB occupation code
Creative core
Engineers
601: Engineers of machine, vehicle & construction
602: Electrical engineers
603 Architects
604: Surveyors
605: Mining, metallurgical and foundry engineers
606: Other Manufacturing Engineers
607: Other engineers
611: Chemists, chemical engineers
612: Physicists, physics engineers, mathematicians
52: Gardening Architects
Scientists, think-thank researchers 881: Social scientists and statisticians
883:Other scientists
Professors and faculty members 871: University professors, faculty members and lecturers at higher
vocational schools and academies
Analysts, entrepreneurs, leading
administrators
751: Entrepreneurs, CEO
Head of business unit 752: Management Consultant, organizers
762: Senior administrative and decisive
Opinion makers: dispersed in other
categories
774: Software programmers / engineers, data processing professionals
Creative professionals

46
High-tech services sectors and technicians 621: Mechanical Engineers
622:Electric technicians
623: General technicians
624: Surveyors
625: Mining, metallurgical, foundry technicians
626: Chemical engineers, physical science
627: Other manufacturing technicians
628 :Other technicians
629: Foreman, foreman
631: Biological and special technical professionals
632: Physical and mathematical and technical
633: Chemical laboratory
634: Photo lab technicians
635 :Draftsmen
Financial services 691: Bankers
753: Auditors and tax advisers
Legal services 813: legal services and legal consultants
Business services
703: Business consultancy experts
822: Business analysts
Humanities
882: Humanity experts
Bohemians
Creative writers and performing artists
821: Publicity workers, promoters and advertisers
823: Librarians, archivists, museum professionals
831: Musicians
832: Performing Artists
833: Artistic graphic makers
Photographers, image and sound recording
equipment operators, and other fashion
models
837: Photographers
835: Artistic and associated professions of stage, screen and sound
Artistic, entertainment and sports associate
professionals
838: artists, professional athletes, artistic paramedics
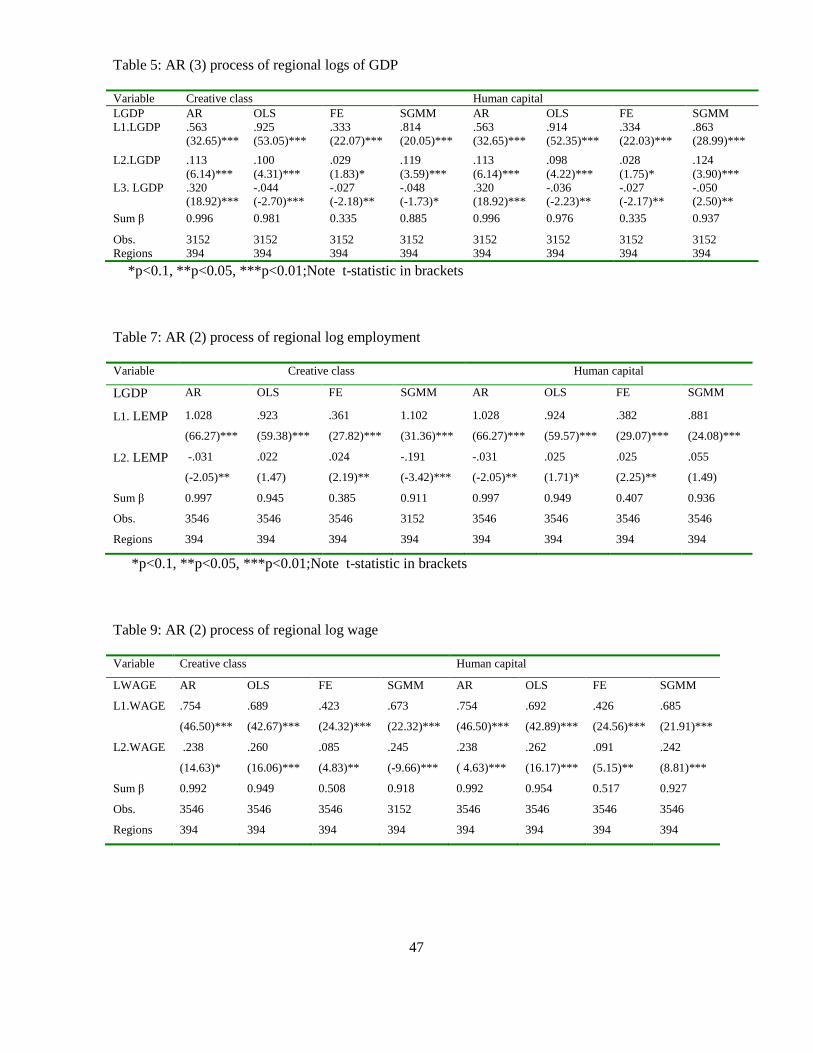
47
Table 5: AR (3) process of regional logs of GDP
Variable Creative class Human capital
LGDP AR OLS FE SGMM AR OLS FE SGMM
L1.LGDP .563
(32.65)***
.925
(53.05)***
.333
(22.07)***
.814
(20.05)***
.563
(32.65)***
.914
(52.35)***
.334
(22.03)***
.863
(28.99)***
L2.LGDP .113
(6.14)***
.100
(4.31)***
.029
(1.83)*
.119
(3.59)***
.113
(6.14)***
.098
(4.22)***
.028
(1.75)*
.124
(3.90)***
L3. LGDP .320
(18.92)***
-.044
(-2.70)***
-.027
(-2.18)**
-.048
(-1.73)*
.320
(18.92)***
-.036
(-2.23)**
-.027
(-2.17)**
-.050
(2.50)**
Sum β 0.996 0.981 0.335 0.885 0.996 0.976 0.335 0.937
Obs. 3152 3152 3152 3152 3152 3152 3152 3152
Regions 394 394 394 394 394 394 394 394
*p<0.1, **p<0.05, ***p<0.01;Note t-statistic in brackets
Table 7: AR (2) process of regional log employment
Variable Creative class Human capital
LGDP AR OLS FE SGMM AR OLS FE SGMM
L1. LEMP 1.028
(66.27)***
.923
(59.38)***
.361
(27.82)***
1.102
(31.36)***
1.028
(66.27)***
.924
(59.57)***
.382
(29.07)***
.881
(24.08)***
L2. LEMP -.031
(-2.05)**
.022
(1.47)
.024
(2.19)**
-.191
(-3.42)***
-.031
(-2.05)**
.025
(1.71)*
.025
(2.25)**
.055
(1.49)
Sum β 0.997 0.945 0.385 0.911 0.997 0.949 0.407 0.936
Obs. 3546 3546 3546 3152 3546 3546 3546 3546
Regions 394 394 394 394 394 394 394 394
*p<0.1, **p<0.05, ***p<0.01;Note t-statistic in brackets
Table 9: AR (2) process of regional log wage
Variable Creative class Human capital
LWAGE AR OLS FE SGMM AR OLS FE SGMM
L1.WAGE .754
(46.50)***
.689
(42.67)***
.423
(24.32)***
.673
(22.32)***
.754
(46.50)***
.692
(42.89)***
.426
(24.56)***
.685
(21.91)***
L2.WAGE .238
(14.63)*
.260
(16.06)***
.085
(4.83)**
.245
(-9.66)***
.238
( 4.63)***
.262
(16.17)***
.091
(5.15)**
.242
(8.81)***
Sum β 0.992 0.949 0.508 0.918 0.992 0.954 0.517 0.927
Obs. 3546 3546 3546 3152 3546 3546 3546 3546
Regions 394 394 394 394 394 394 394 394
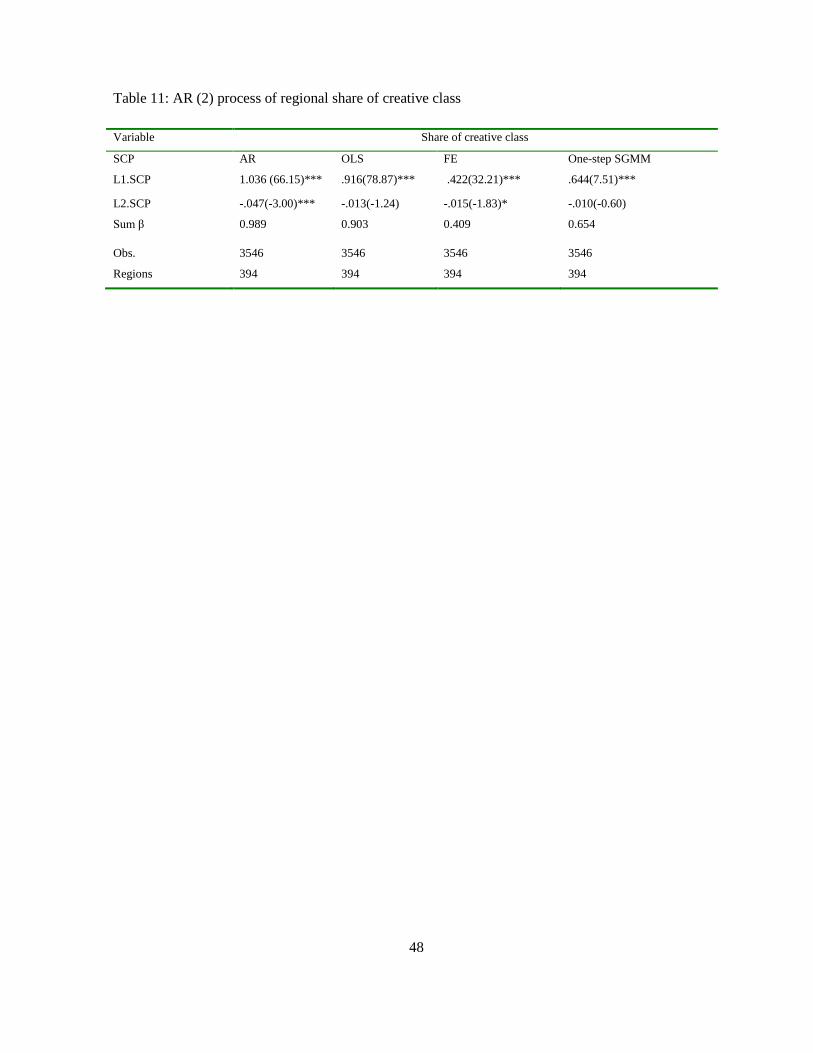
48
Table 11: AR (2) process of regional share of creative class
Variable Share of creative class
SCP AR OLS FE One-step SGMM
L1.SCP 1.036 (66.15)*** .916(78.87)*** .422(32.21)*** .644(7.51)***
L2.SCP -.047(-3.00)*** -.013(-1.24) -.015(-1.83)* -.010(-0.60)
Sum β 0.989 0.903 0.409 0.654
Obs. 3546 3546 3546 3546
Regions 394 394 394 394