human capital accumulation and endogenous public expenditures
TRANSCRIPT

Human Capital Accumulation and Endogenous Public ExpendituresAuthor(s): Gerhard Glomm and B. RavikumarSource: The Canadian Journal of Economics / Revue canadienne d'Economique, Vol. 34, No. 3(Aug., 2001), pp. 807-826Published by: Wiley on behalf of the Canadian Economics AssociationStable URL: http://www.jstor.org/stable/3131896 .
Accessed: 17/06/2014 21:08
Your use of the JSTOR archive indicates your acceptance of the Terms & Conditions of Use, available at .http://www.jstor.org/page/info/about/policies/terms.jsp
.JSTOR is a not-for-profit service that helps scholars, researchers, and students discover, use, and build upon a wide range ofcontent in a trusted digital archive. We use information technology and tools to increase productivity and facilitate new formsof scholarship. For more information about JSTOR, please contact [email protected].
.
Wiley and Canadian Economics Association are collaborating with JSTOR to digitize, preserve and extendaccess to The Canadian Journal of Economics / Revue canadienne d'Economique.
http://www.jstor.org
This content downloaded from 185.44.77.110 on Tue, 17 Jun 2014 21:08:23 PMAll use subject to JSTOR Terms and Conditions
Human capital accumulation and endogenous public expenditures Gerhard Glomm Department of Economics, Indiana University B. Ravikumar Department of Economics, Pennsylvania State
University
Abstract. In this paper, we present an overlapping-generations model, where individuals accu- mulate human capital through formal schooling. We model the role of the public sector in schooling as one of collecting taxes from households and providing inputs to the learning technology. Public expenditures on schools are determined endogenously. Under plausible restrictions, our model's predictions qualitatively match the observations on schooling, pub- lic expenditures on education, and student-teacher ratios. JEL Classification: El 3, E62.
Accumulation de capital humain et depenses publiques endogenes. Dans ce memoire, les auteurs presentent un modele de generations qui se chevauchent ofu les individus accumulent du capital humain via l'education formelle. Le r6le du secteur public dans l' education est defini comme celui de collecteur d'imp6ts aupres des menages et de fournisseur d'intrants dans la technologie d'apprentissage. Les depenses publiques en education sont determinees de maniere endogene. A partir de restrictions plausibles, les predictions du modele s'arriment qualitativement aux observations sur le monde scolaire, aux depenses publiques en educa- tion, et aux ratios 6leves/enseignants.
1. Introduction
Recent models of growth, such as Romer (1986) and Lucas (1988), following Arrow (1962), Razin (1972), and Uzawa (1965), emphasize human capital investment as an important factor contributing to long-run growth. In this literature, human cap- ital investment takes several forms. For instance, in Azariadis and Drazen (1990)
This paper was written in part while Glomm was visiting at CERGE in Prague, Czech Republic, and while Ravikumar was at the University of Virginia. We would like to thank two anonymous referees for helpful comments, Anne Gulati and Melody Pan for excellent research assistance, and the Bankard Fund for Political Economy at the University of Virginia for financial support. Email: [email protected]
Canadian Journal of Economics / Revue canadienne d'Economique, Vol. 34, No. 3 August / aouit 2001. Printed in Canada / Imprime au Canada
0008-4085 / 01 / 807-826 / ? Canadian Economics Association
This content downloaded from 185.44.77.110 on Tue, 17 Jun 2014 21:08:23 PMAll use subject to JSTOR Terms and Conditions
808 G. Glomm and B. Ravikumar
the investment is in the form of educational attainment; in Stokey (1988) and Young (1991) human capital is accumulated through learning by doing.
Our focus in this paper is on human capital accumulation through formal school- ing. We are motivated by the observation that formal schooling is an important determinant of productivity levels. Mankiw, Romer, and Weil (1992) find that school enrolment is positively correlated with GDP per working age person. Hall and Jones (1996) find that infrastructure is an important source of variation in output per worker across countries and that infrastructure helps a country by stimulating the accumulation of human capital.
Historically, the public sector has been a significant player in providing formal education. In Canada, for instance, during this century the fraction of students at the elementary and secondary level who attend public schools has been above 95 per cent; in the United States, the fraction has been above 86 per cent (sources: Statistics Canada and Digest of Education Statistics, United States). Our purpose here is to understand three stylized facts of formal education along the growth path in Canada and the United States: (i) time allocated to schooling has been increasing over time, (ii) share of public expenditures on education as a fraction of GNP has been increasing over time, and (iii) quality of education has been increasing over time. We describe the evidence in section 2.
It is our thesis that the above three facts are related. Suppose, for the moment, that facts (ii) and (iii) were given exogenously. Fact (iii) increases the return to human capital investment; assuming that the fixed costs of schooling are not too large, this delivers fact (i).' Fact (ii), however, imposes a higher (distortionary) tax rate on the individual's income and makes human capital accumulation relatively unattractive; this contradicts fact (i).2 In this paper, we do not assume facts (ii) and (iii). Instead, we deliver facts (i), (ii), and (iii) as part of a dynamic general equi- librium sequence. Our model thus complements the set of models in which public policies on education are determined endogenously. Examples in this set include Benabou (1996), Boldrin (1993), and Glomm and Ravikumar (1992). In contrast to the above models, we attempt to explain the stylized facts associated with time input to learning, quality of public education, and the share of income allocated to public expenditures on education.
In section 3, we develop an overlapping-generations economy where human cap- ital investment and public policy are endogenous. The human capital of each agent depends on time spent in schools, quality of schools, and the stock of human capital of the agent's parents. Human capital investment by the young affects their earnings when they are old. All agents have a bequest motive: they value the quality of
I At the aggregate level, there are many margins along which schooling time can change: enrolment, years of schooling, days per year, and so on. It is unlikely that fixed costs prevent changes in schooling along all margins.
2 It is theoretically conceivable that the increased share of public expenditures on education does not impose a higher tax rate on the individual but is merely a result of reallocation of government expenditures, holding total government spending fixed. In our view, this is not empirically relevant: in both Canada and the United States, total government spending as a fraction of GNP has also been increasing over time.
This content downloaded from 185.44.77.110 on Tue, 17 Jun 2014 21:08:23 PMAll use subject to JSTOR Terms and Conditions
Human capital accumulation 809
education of their offspring. Tax revenues from a uniform tax on earnings are used to provide one of the inputs to the learning technology, namely, quality of schools. Individuals take public policies as given when making human capital investment decisions. The income tax rate chosen in each period is the one that maximizes the welfare of old agents in the period. To keep the model tractable, we use specific functional forms for preferences, learning technology, and earnings. In section 4, we determine the human capital investment decisions, endogenize the public expen- ditures on education, and provide conditions under which there is a unique equilibrium.
We restrict preference parameters using micro evidence on schooling and expen- ditures on schooling. The restrictions imply that (a) the substitution effect due to a change in the opportunity cost of time spent in school dominates the income effect and (b) the income elasticity of demand for educational expenditures exceeds 1. With these restrictions, we show that the implications of our model qualitatively match the facts (i), (ii), and (iii). Our explanation combines a channel for rising return to schooling with a hypothesis due to Wagner (1893). In our model, an increase in the public expenditures on education, among others, raises the return to schooling. An increase in income raises the share of public expenditures on educa- tion. Through numerical examples, we show that despite the consequent rise in distortionary taxes, the incentive to accumulate human capital remains strong and, hence, schooling increases.
There are well known competing explanations for the rise in schooling. Techno- logical change and/or capital-skill complementarity raise the return to human cap- ital investment and, hence, the time allocated to schooling increases. Such explanations cannot account for fact (ii). Furthermore, such explanations assume that the distortion due to a rising tax rate (implied by fact (ii)) is negligible.
There are also competing theories for the rise in government size (government spending as a fraction of GDP). North (1985) and Lindbeck (1985) appeal to changes in preferences, precipitated by events like the Great Depression, as explanations for the rising size in government observed over this century. Meltzer and Richard (1978, 1981) and Mueller (1989) attribute the change in government size to redistributive activity. A rise in income inequality, in their view, will induce the economy to have a larger redistribution, that is, a larger government size. Such a theory may be able to deliver the rise in schooling along with higher public spending on education in a model where public funding for education is redistributive. A problem with the theory is that it relies crucially on the rise in income inequality to account for the rise in the ratio of public educational expenditures to GDP. For instance, in the United States, the ratio seems to be relatively stable precisely during the period when income inequality has been rising. Similar to the above theories, our analysis relies on restrictions on preferences. Unlike the above theorists, we use micro data to restrict the parameters of the utility function. We then use this utility function to obtain predictions about economic aggregates. Our model is capable of explaining the rise in public expenditures on education relative to real GDP and the rise in time allocated to learning without appealing to changes in income inequality or changes in preferences.
This content downloaded from 185.44.77.110 on Tue, 17 Jun 2014 21:08:23 PMAll use subject to JSTOR Terms and Conditions
810 G. Glomm and B. Ravikumar
14
12
It
10 CU
7-
t900 1910 gD16 li 1929 193 1940 1959 19 4D 1901B 99'0 ysr
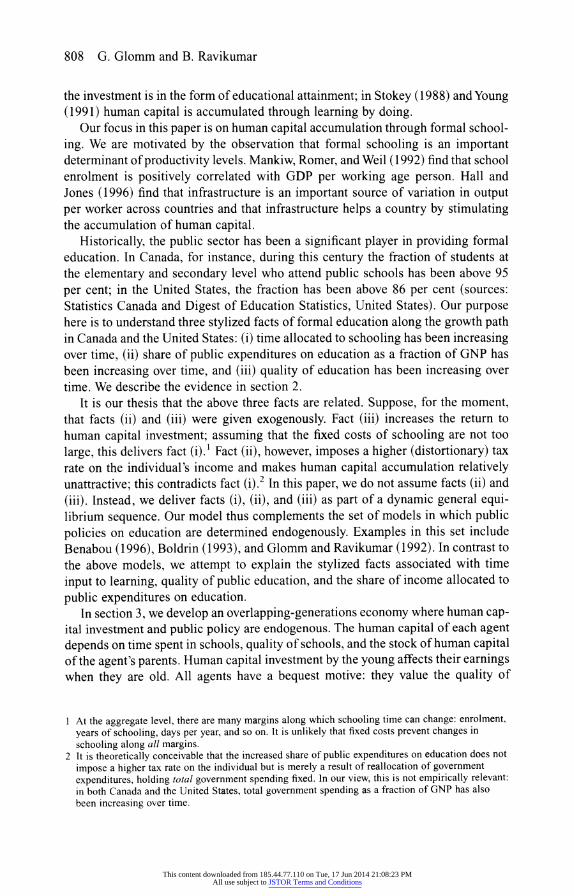
FIGURE 1 Median years of schooling
2. The facts
In this section, we describe the three facts noted earlier. In figure 1, we illustrate the time series for median years of schooling. For the U.S. data, the median is for the age group 25 years and over; for Canada, the age group is 25-44. In the case of Canada, we used cross-sectional data from various years to construct the time series. For example, the median years of schooling for the 45-64 age group in 1991 is 11.7 years. We use this to set median years of schooling for the 25-44 age group in 1971 to be 11.7 years.
For Canada, median years of schooling has increased from less than 9 years in 1930 to more than 13 years in 1990; for the United States, the increase in schooling is similar. Other measures of formal schooling yield similar patterns. During the early part of this century, less than 10 per cent of the 17-year old population in the United States were high-school graduates, while the corresponding number in the 1980s is more than 70 per cent; in Canada, college enrolment as a fraction of the population 20-24 years old, has increased from nearly zero at the beginning of this century to more than 25 per cent now.
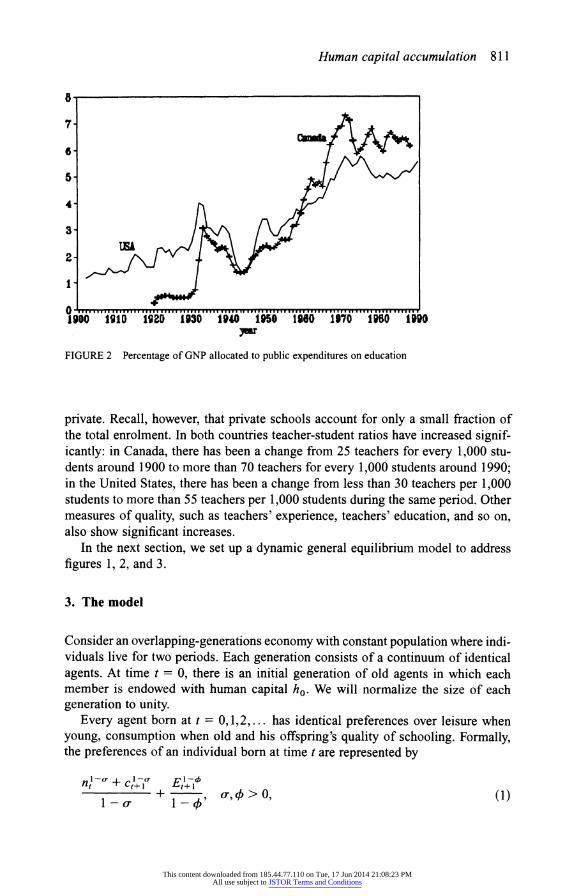
In figure 2, we illustrate the time series for the share of GNP allocated to public expenditures on education.3 In both countries the share has increased substantially during 1945-70 but has been relatively stable over the last two decades.
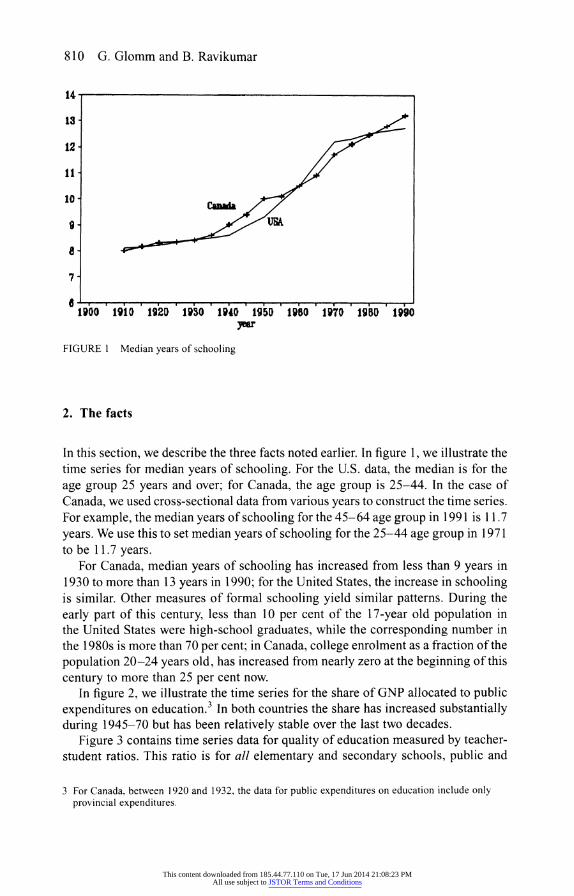
Figure 3 contains time series data for quality of education measured by teacher- student ratios. This ratio is for all elementary and secondary schools, public and
3 For Canada, between 1920 and 1932, the data for public expenditures on education include only provincial expenditures.
This content downloaded from 185.44.77.110 on Tue, 17 Jun 2014 21:08:23 PMAll use subject to JSTOR Terms and Conditions
Human capital accumulation 81 1
8
7-
6-
5-
4-
3-
2-
1900 119 2 1 3 194 1950 1980 1970 1950 1990
FIGURE 2 Percentage of GNP allocated to public expenditures on education
private. Recall, however, that private schools account for only a small fraction of the total enrolment. In both countries teacher-student ratios have increased signif- icantly: in Canada, there has been a change from 25 teachers for every 1,000 stu- dents around 1900 to more than 70 teachers for every 1,000 students around 1990; in the United States, there has been a change from less than 30 teachers per 1,000 students to more than 55 teachers per 1,000 students during the same period. Other measures of quality, such as teachers' experience, teachers' education, and so on, also show significant increases.
In the next section, we set up a dynamic general equilibrium model to address figures 1, 2, and 3.
3. The model
Consider an overlapping-generations economy with constant population where indi- viduals live for two periods. Each generation consists of a continuum of identical agents. At time t = 0, there is an initial generation of old agents in which each member is endowed with human capital ho. We will normalize the size of each generation to unity.
Every agent born at t = 0,1,2,... has identical preferences over leisure when young, consumption when old and his offspring's quality of schooling. Formally, the preferences of an individual born at time t are represented by
nt- + ctl+-l tl n~ + c14 + oo,4>O, (1)
This content downloaded from 185.44.77.110 on Tue, 17 Jun 2014 21:08:23 PMAll use subject to JSTOR Terms and Conditions

812 G. Glomm and B. Ravikumar
so -
70 -
50-
50-
40 -~~~~~~~ya
FIGURE 3 Quality of education: teachers per 1,000 students
where nt is leisure at time t, c,+ l is consumption at time t -1 1, and Et+ l is quality of public school that his offspring attends at time t + 1. As usual, if o- or 4) equals unity, then the corresponding component of the utility function is assumed to be logarithmic.
Individuals are endowed with one divisible unit of time in their youth. Young individuals at time t allocate nt units of their endowment towards leisure at timet and devote the remaining 1 - nt units towards accumulating human capital accord- ing to
where h, is the stock of human capital of the corresponding parent. We have assumed that the learning technology is linear in the time input purely for convenience; it helps us to solve for human capital investment analytically. Both parental human capital and quality of public education exhibit diminishing returns to learning, since y and 8 are less than one. The restriction y + 8 < 1 is important for obtaining a steady state, as we shall see later. Note that the average stock of human capital is not directly productive in human capital accumulation or in final output. However, there is a spillover through taxes and public expenditures on education.
Our assumption that quality of schools is an argument in the learning technology is consistent with Heyneman's (1984) cross-country evidence that school-specific factors are positively related to various educational output measures. The use of parental human capital as an input in the learning function is consistent with a number of studies. Coleman et al. (1966), for instance, found a positive correlation between parental education and performance on standardized tests in U.S. data. (See also Lillard and Willis 1994; Altonji and Dunn 1996; Barro and Lee 1996.)
This content downloaded from 185.44.77.110 on Tue, 17 Jun 2014 21:08:23 PMAll use subject to JSTOR Terms and Conditions

Human capital accumulation 813
At time t + 1, each individual's income is assumed to be a linear function of his human capital:
Yt+I = ht+.1 (3)
The individual's earnings at time t + 1 are taxed at the rate rt, 1. Thus,
Ct+ = (1 - t+i)Yt+I (4)
We model the role of the public sector as one of collecting taxes from house- holds and providing inputs to the learning technology at zero price. Further, all agents have access to the same quality of education, which is beyond the control of any one agent. Tax revenues determine the quality of public schools at time t + 1 according to
Et+ I = rt+ I Yt+ 1 ,
where Yt+ 1 is average income at time t + 1. Note that both quality of public schools and human capital are augmentable factors in our model.
3.]. Individual choices The young agent's problem at time t is essentially one of choosing nt. Given the tax rate, parental human capital and the quality of public education, the choice of nt pins down ht+ 1 9 yt+ I' and ct+ 1. Formally, the individual's problem is to choose nt E [0, 1 ] to maximize (1) subject to (2), (3), and (4), given Et, ht, Et+ 1, and -rt+ 1. In this maximization problem Et and ht are determined by the previous generation, whereas Et+ I and rt+ 1 are chosen only in old age. It can be easily verified that the objective function in the young agent's problem is strictly concave in nt and the feasible set is compact and convex. Hence, there exists a unique solution to the young agent's problem. We can solve for the young agent's time input to learning as
1- = {(1 -T r+)E7h6}(l-ff)/U 1 + {(1-rt+1)OEtYh`(`-ff)
We characterize the young agent's schooling choice in lemma 1 below. We have suppressed the time subscript for convenience.
LEMMA 1. (i) If o- < 1 (> 1), then 1 - n is decreasing (increasing) in r; (ii) If u- < 1 (> 1), then 1 - n is an increasing (decreasing) function of the quality of public education E; (iii) If o < 1 (> 1), then 1 - n is increasing (decreasing) in the parental human capital h.
Proof: To get the results (i), (ii), and (iii), differentiate (5) implicitly with respect to r, E, and h, respectively. U
The intuition for lemma 1 is as follows. Any change in r, E, or h not only changes the individual's net income but also alters the relative price of leisure. The condition o- < 1 restricts the curvature of the utility function and ensures that the
This content downloaded from 185.44.77.110 on Tue, 17 Jun 2014 21:08:23 PMAll use subject to JSTOR Terms and Conditions
814 G. Glomm and B. Ravikumar
substitution effect dominates the income effect. The result in this case is intuitive - a higher tax rate reduces the time devoted to human capital accumulation; higher- quality public schools and higher parental human capital increase the time input to learning.
While we do not have an a priori reason to restrict uT, we can bring some micro evidence to bear on the implications for earnings through the time input to learning. Card and Krueger (1992) find that, for the United States, men educated in states with high average school quality have a higher return to additional years of school- ing. Using data from Panama, Heckman and Hotz (1986) report that parental back- ground is positively related to schooling returns. To be consistent with this evidence we restrict 0T to be less than one.
It is important to note that although lemma 1 makes no explicit assumptions about the learning technology, our specification does play a role in parts (ii) and (iii) of the lemma. For instance, if quality of public schools and time input of the young agent are perfect substitutes in the learning technology, then an increase in quality generates only income effects, which leads to an increase in the amount of leisure (a decrease in 1 - n). With our specification, the return to time spent in learning is increasing with the quality of public schools and the parental stock of human capital.
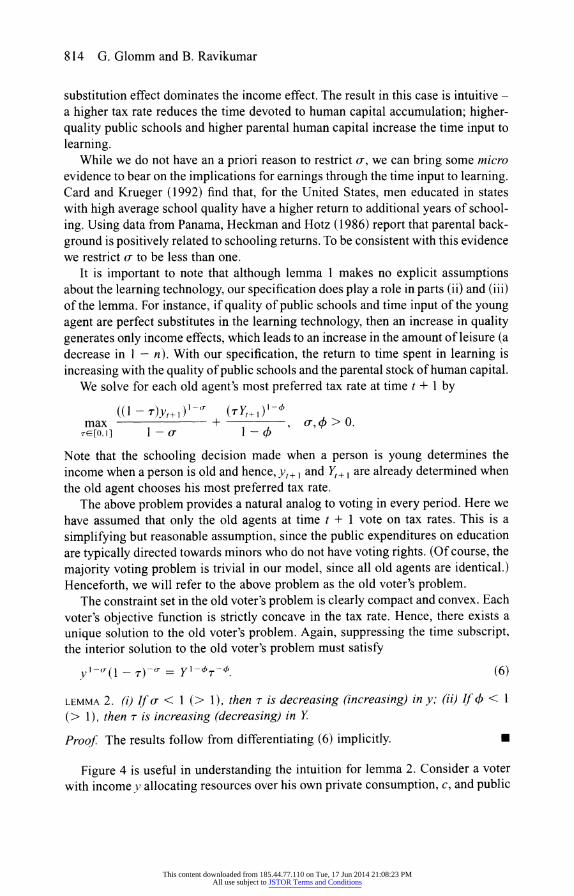
We solve for each old agent's most preferred tax rate at time t + 1 by
( ( r)Yt+ X) 'r ( T Yt+ 1)I ) -( max + I, a > O.
re[O,1] I-o 1-Ak
Note that the schooling decision made when a person is young determines the income when a person is old and hence, yt+ 1 and Yt+ I are already determined when the old agent chooses his most preferred tax rate.
The above problem provides a natural analog to voting in every period. Here we have assumed that only the old agents at time t + 1 vote on tax rates. This is a simplifying but reasonable assumption, since the public expenditures on education are typically directed towards minors who do not have voting rights. (Of course, the majority voting problem is trivial in our model, since all old agents are identical.) Henceforth, we will refer to the above problem as the old voter's problem.
The constraint set in the old voter's problem is clearly compact and convex. Each voter's objective function is strictly concave in the tax rate. Hence, there exists a unique solution to the old voter's problem. Again, suppressing the time subscript, the interior solution to the old voter's problem must satisfy
y l-tr ( 1 - r)-(r = 1~T~. y l-(6)
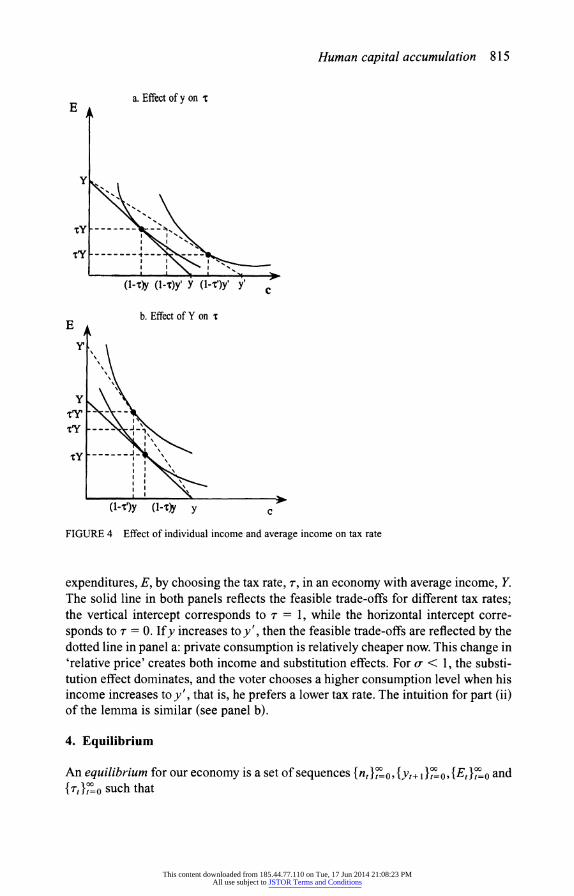
LEMMA 2. (i) If or < 1 (> 1), then r is decreasing (increasing) in y; (ii) If 4 < 1 (> 1), then r is increasing (decreasing) in Y
Proof. The results follow from differentiating (6) implicitly. U
Figure 4 is useful in understanding the intuition for lemma 2. Consider a voter with income y allocating resources over his own private consumption, c, and public
This content downloaded from 185.44.77.110 on Tue, 17 Jun 2014 21:08:23 PMAll use subject to JSTOR Terms and Conditions
Human capital accumulation 815
a. Effect of y on X
E
.r -----
-b(l-T)y' Y (l-'V)Yy Yc
b. Effect of Y on X E
TY
I'I
(l-,r,)y (1-Ow y c
FIGURE 4 Effect of individual income and average income on tax rate
expenditures, E, by choosing the tax rate, -, in an economy with average income, Y. The solid line in both panels reflects the feasible trade-offs for different tax rates; the vertical intercept corresponds to r = 1, while the horizontal intercept corre- sponds to r = 0. If y increases to y', then the feasible trade-offs are reflected by the dotted line in panel a: private consumption is relatively cheaper now. This change in 'relative price' creates both income and substitution effects. For u- < 1, the substi- tution effect dominates, and the voter chooses a higher consumption level when his income increases to y', that is, he prefers a lower tax rate. The intuition for part (ii) of the lemma is similar (see panel b).
4. Equilibrium
An equilibrium for our economy is a set of sequences {n,}1%,{y,X},=o,{E,},o and {rt},'0 such that
This content downloaded from 185.44.77.110 on Tue, 17 Jun 2014 21:08:23 PMAll use subject to JSTOR Terms and Conditions
816 G. Glomm and B. Ravikumar
(i) n1 solves the young agent's problem in period t, and y1, 1 is the corresponding income when old;
(ii) Tt is the tax rate most preferred by all the old agents at time t; and
(iii) the quality of public education at time t, Et Ttyt.
The sequences {ht?1}=o' {c}t=', and {Yt+?}%=' will be determined by the equi-
librium sequence. Substituting the schooling choice from (5) into the learning tech- nology (2) yields the human capital of each agent as
{( 1-'T ) 1 - ff f9E 7 h 6 /'J 1h{1 tI)Eht(U)((7)
t+ 1+ {(I -T, 71 ) O}E, h6}(l-T/
Since income is linear in human capital, equation (7) also specifies each old agent's pre-tax income at time t + 1.
The equilibrium tax rate must satisfy the following condition:
t +l Yto+l = (1 - 7-t) (8)
Equation (8) is a restatement of (6) with the equilibrium restriction: Yt+ I = Yt+ I.
4.1. Existence and uniqueness To establish existence and uniqueness of equilibrium, we have to ensure that the
agents' incomes implied by (7) are consistent with the tax rates implied by (8). We do this in the following proposition.
PROPOSITION 1. If 0 < o- < 1, there exists a unique interior equilibrium.4
Proof For period 0, there exists a unique r0 that solves (8). There is no consistency problem for period 0, since the income in that period is exogenous.
Using (7), we can write the law of motion for aggregate income as
_ {(1 -,+)-fEY6l =t I(9)
+ 1 + {(1 -t+I)OEt7Yt6}( )
Any tax-income pair {T+ 1, Yt+ I } that simultaneously solves (8) and (9) is clearly an
equilibrium. In both equations, Et and Yt are predetermined at time t + 1 and each equation describes Yt+I as a function of Tt+ I. In the tax-income space, equation (9) describes a decreasing function that is positive for T = 0 and is 0 for T = 1. Equation (8), on the other hand, describes an increasing function that is 0 for T = 0 and explodes off to so as T gets close to 1. Thus, B a unique solution to (8) and (9). -
4 There is a unique interior equilibrium for f = o- < 1 as well, but we focus on f < o < I for rea- sons discussed below. There is also a corner equilibrium where r = 0 and y, E, and 1 - n all are equal to zero.
This content downloaded from 185.44.77.110 on Tue, 17 Jun 2014 21:08:23 PMAll use subject to JSTOR Terms and Conditions
Human capital accumulation 817
The restriction that 4 < Kr implies that the income elasticity of demand for quality of education exceeds unity. Alternatively, the restriction implies that the share of income allocated to educational expenditures increases with income. Cross- country evidence as well as evidence from the American states are consistent with this implication. Across countries in 1992 the fraction of GNP allocated to public expenditures on education is positively correlated with the level of per capita GNP, with a correlation coefficient 0.35; across the fifty states, the ratio of public expen- ditures on education per pupil to per capita personal income is positively correlated with per capita personal income with a correlation coefficient 0.33. Henceforth, we restrict attention to Sb < o- < 1. (See Bergstrom, Rubinfeld, and Shapiro 1982 for a survey of the evidence on income elasticity of demand for public expenditures on education.)
4.2. Constructing the equilibrium We can find the equilibrium recursively. We determine ro as the solution to
' Yo-. = (1 O
Using ro and YO, we can determine Eo. Using (8) and (9), we can determine rl and Y, simultaneously. Repeating this procedure yields (r2, Y2), (Cr3, Y3) and so on. The time input to learning and the stock of human capital can be determined from equations (5) and (7) respectively. The after-tax income determines equilibrium consumption. Clearly, we cannot find an analytical solution to our model for arbi- trary Sb and o- that satisfies the condition in proposition 1. However, we can compute the equilibrium tax-income sequence numerically using the above procedure. We can then use the tax-income sequence to determine the other endogenous variables.
(As a theoretical matter, there may be multiple equilibria when 4 > o-. A careful investigation of these issues is beyond the scope of this paper.)
PROPOSITION 2. For b < Ku < 1 and 0 sufficiently large, the equilibrium sequence of tax rate, per capita income, and public expenditures on education, {rt,Yt, Et }, increases monotonically to a steady-state level (r*, Y* E*).
Proof. Starting with an exogenous YO, we can find T0 and Eo using (8). For 6 suf- ficiently large, we can ensure that Y, exceeds YO for all interior T, (see equation (9)). Then, from equation (8), it is clear that YI > YO implies Tl > T0. Hence, El > Eo. Now, consider the function Y2(r2) described by equation (9). This function must lie above the function Y1(Tr) in the tax-income space (for interior r). Therefore, the equilibrium tax-income pair (T2, Y2) exceeds (Tr, YI). Repeating this procedure, we can see that the equilibrium sequence of tax-income pairs {(t, Yt)} is increasing. Thus, the sequence {Et} is increasing. Since the tax rate, t , is bounded above by 1, it must converge to a steady state. Since y + 8 < 1, the learning technology (2) implies that per capita income is bounded above. Thus, both Yt and Et converge to a steady state. U
This content downloaded from 185.44.77.110 on Tue, 17 Jun 2014 21:08:23 PMAll use subject to JSTOR Terms and Conditions
818 G. Glomm and B. Ravikumar
0.95 .
0.85 - - --- 0.85 -
0.8 -
0.75 -
0.7K
0.65 -
0. 6
0.55
0 2 4 6 8 i10 1,2 14 Time
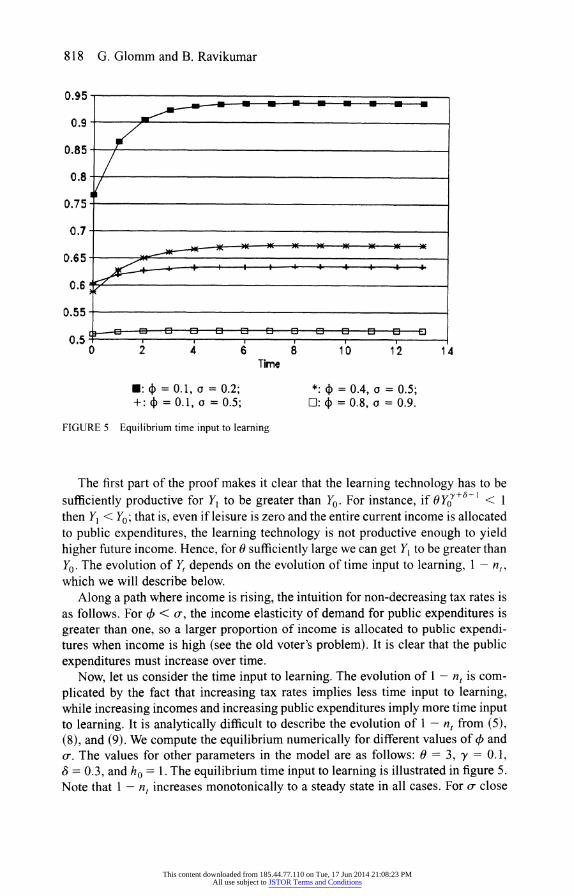
: =O.1, a = .2; *:?= 0.4, o = 0.5; +: =0.1, o= 0.5; 0: 4= 0.8, a = 0.9.
FIGURE 5 Equilibrium time input to learning
The first part of the proof makes it clear that the learning technology has to be sufficiently productive for Y, to be greater than Y0. For instance, if 6Yjo+"-' < 1 then Y, < Y0; that is, even if leisure is zero and the entire current income is allocated to public expenditures, the learning technology is not productive enough to yield higher future income. Hence, for 0 sufficiently large we can get Y1 to be greater than Y0. The evolution of Y1 depends on the evolution of time input to learning, 1 - n, which we will describe below.
Along a path where income is rising, the intuition for non-decreasing tax rates is as follows. For 0 < u,, the income elasticity of demand for public expenditures is greater than one, so a larger proportion of income is allocated to public expendi- tures when income is high (see the old voter's problem). It is clear that the public expenditures must increase over time.
Now, let us consider the time input to learning. The evolution of -nt is com- plicated by the fact that increasing tax rates implies less time input to learning, while increasing incomes and increasing public expenditures imply more time input to learning. It is analytically difficult to describe the evolution of 1 - n, from (5), (8), and (9). We compute the equilibrium numerically for different values of 0 and o-. The values for other parameters in the model are as follows: 0 = 3, y 0. 1, 8 = 0.3, and ho = 1. The equilibrium time input to learning is illustrated in figure 5. Note that 1 - n, increases monotonically to a steady state in all cases. For o- close
This content downloaded from 185.44.77.110 on Tue, 17 Jun 2014 21:08:23 PMAll use subject to JSTOR Terms and Conditions
Human capital accumulation 819
to 1, the time input to learning is essentially flat and insensitive to the value of 4. This is because the utility over consumption and leisure is logarithmic for o- close to 1. In general, the effect of higher o-, for given 4, is to make the 1 - nt profile flatter. The effect of higher 4, for given o-, makes the 1 - n, profile steeper. This is because, for higher 4, the tax rate is more sensitive to changes in income; the sensitivity of tax rates, in turn, makes the profile of time input to learning steeper.
4.3. Time series implications So far we have imposed the following restrictions on the parameters of our model: (i) 0 > 0, y,6 E (0,1), and y + 6 < 1; and (ii) 0 < K < Ku < 1. Under these restrictions, our model yields a unique equilibrium path starting from an initial condition ho. Our model has joint time series implications for (i) time allocated to formal schooling, 1 - n, (ii) public expenditures on education as a share of income, r, and (iii) quality of schools, E.
Our model implies that time allocated to schooling, 1 - n,, is increasing over time, which is consistent with the data in figure 1. We hold lifetime fixed in the model, but for the data period in figure 1 life expectancy has increased as well. A more appropriate variable to match, in the context of our model, is the fraction of lifetime spent in school. Between 1900 and 1980 the life expectancy in the United States (conditional on reaching age 5) has increased from 59.4 to 71.8 years, an increase of roughly 21 per cent. The increase in years of schooling, however, for a similar time period is more than 63 per cent, three times the increase in life expec- tancy. Hence, the fraction of lifetime spent in school is increasing over time.
A few remarks regarding our results on time input to learning are in order here. First, in the data, the opportunity cost of learning may be lost wages instead of leisure. If so, our model has to be modified to allow for agents to work in both periods of their lives.5 In such a model, the effect of public expenditures and paren- tal human capital on young agents' learning is likely to be equally strong, so the above implications for time input to learning will not necessarily be reversed. Sec- ond, if the opportunity cost in the data was both leisure and lost wages, then the learning decision will depend upon the marginal utility of leisure as in our analysis. Third, our model does not distinguish between young agents who enjoy leisure first and learn later versus young agents who are learning part time and enjoying leisure part time. A richer model may be helpful in examining the nature of the increase in time input to learning, whether it is on the 'extensive' margin where more agents are learning or on the 'intensive' margin where agents are spending more time learning.
For X < o-, our model implies that the share of income allocated to public expenditures on education, t,, increases over time. This is consistent with the pat-
5 For instance, suppose that the preferences are [(c,- + c;I--)/(1 - a)] + [E,'Y1/(1-)], where c, is consumption while young. Let the young agent's labour income be y, = n,. In the absence of any other form of savings, c, would equal y,, and the time series implications for 1 - n, would be the same as those of our model.
This content downloaded from 185.44.77.110 on Tue, 17 Jun 2014 21:08:23 PMAll use subject to JSTOR Terms and Conditions

820 G. Glomm and B. Ravikumar
tern in figure 2. The assumption k < Ku is crucial for generating this result, since the assumption implies that the income elasticity of demand for quality of education is greater than 1. Thus, as the economy grows, expenditures on education grow faster than income and constitute an increasing share of income.
In our model, the implications for quality of public education is the same as those for public expenditures on education. If one uses student-teacher ratio as a measure of quality, then one may use the following interpretation of our model. For the old agents, wage per unit of human capital is 1, since their earnings y = h. As aggregate income increases, the public expenditures (irY) increase in our model, so a higher fraction of the labour force is employed by the public education sector. We could label those employed by the education sector as 'teachers' and the measure of teachers is r. Since the measure of students is 1 by assumption, our model implies that the teacher-student ratio increases over time (see figure 3).
5. Robustness
In this section, we discuss whether the time series implications of the previous section are robust to human capital externalities and long-run growth.
5.1. Human capital spillovers In our model in section 3, average human capital is not directly useful in the accu- mulation of human capital or in goods production. Suppose, for instance, that the learning technology in section 3 is modified to
t+ I :OE7Y h"' H,'H ( 1-n t
where Ht is the average human capital of the previous generation. The young agent in period t will now choose
1 -n= - -t+j)0E,Yh"Ha }(l-f) (10) t 1 + {(1 + l 7 h,6 H,a} (I -`J)(
In equilibrium, h, must equal Ht, so equations (5) and (10) are identical when 8' + a' = 8. Furthermore, the voting problem for the old remains the same as it does in section 3. Thus, the above modification does not alter the equilibrium implications of our model.
Alternatively, consider a human capital externality in production as given in Romer (1986). Suppose that the production technology is modified to
Yt = ha H-
Again, using the first-order condition for the young agent's choice of learning time and imposing ht = H,, we get
1al/o{(1 - r(+1)0E1Yh)?-f)1 1+a' 1/J( 1-7X,+ I ) OE,y h, }( / (1
This content downloaded from 185.44.77.110 on Tue, 17 Jun 2014 21:08:23 PMAll use subject to JSTOR Terms and Conditions

Human capital accumulation 821
Comparing equations (11) and (5), it is easy to see that they differ only by a multi- plicative constant in the learning technology. That is, if we had used Oa 1/(0 -0) instead of 0 in our learning technology in section 3, we would have ended up with (11) instead of (5). It is also easy to see that the voting problem is not altered by the externality, so the equilibrium implications of our model remain the same.
5.2. Long-run growth There has been some recent evidence linking formal schooling to long-run growth. Barro (1991) and Barro and Sala-i-Martin (1995) find that school enrolment is positively correlated with growth. Levine and Renelt (1992) find that the effect of initial secondary school enrolment rate on growth is positive and robust.6 In sec- tion 3, we assumed that the learning technology exhibits decreasing returns to aug- mentable factors, so that the equilibrium trajectory converges to a steady state in levels. We will show in the remainder of this section that our qualitative results survive along the transition path even if the economy exhibits sustained growth.
Suppose that there is exogenous technological progress in the production tech- nology (3). That is, let
Yt+l = At+I ht+I
and let A grow at a constant rate. (Alternatively, we could assume that there is technological progress in the learning technology.) Both lemma 1 and lemma 2 continue to hold under this modification of the production technology. Moreover, the existence and uniqueness theorem (proposition 1) survives the above modifi- cation. We can now state a variant of proposition 2; the proof is essentially the same as that of proposition 2.
PROPOSITION 3. Suppose that there is a constant rate of exogenous technological progress. For 4 < Ku < 1 and sufficiently high technological progress (or 0 suffi- ciently large), the equilibrium sequence of tax rate, per capita income, public expen- ditures on education and time allocated to learning is monotonically increasing.
Instead of exogenous technological progress, long-run growth in the model could be endogenous. For instance, if y + 6 = 1, the learning technology exhibits constant returns to augmentable factors, and hence, per capita income and public expendi- tures on education exhibit long-run growth. Lemmas 1 and 2 and propositions 1 and 2 hold in such an endogenous growth model as well. Thus, the time series implica- tions in subsection 4.3 are not altered when the model economy exhibits positive long-run growth.
6 Benhabib and Spiegel (1994) and Bils and Klenow (2000) find that the effect of human capital on per capita income growth is fairly small; Krueger and Lindahl (2000) attribute the finding to mea- surement error. Lucas (1993) argues that the differences in formal schooling between the Philip- pines and South Korea are too small to be consistent with the persistent differences in their growth rates.
This content downloaded from 185.44.77.110 on Tue, 17 Jun 2014 21:08:23 PMAll use subject to JSTOR Terms and Conditions
822 G. Glomm and B. Ravikumar
The economy with positive long-run growth (exogenous or endogenous) does not have a balanced growth path. That is, along the equilibrium path of the econ- omy, c and y do not grow at a constant rate and r and 1 - n are not constant. As is evident from equation (8), income growth (and finite Y) implies changing r and, hence, changing 1 - n. However, variables such as r or 1 - n do converge, since they are monotonically increasing and are bounded above. In this paper we do not focus on balanced growth; rather, we model growth as a long transition. This is consistent with Cordoba (2000), who documents that 'international evidence from ... currently developed and developing countries gives little support to Kaldor facts maintaining a constant capital-output ratio and a constant growth rate.'
6. Concluding remarks
In this paper we have presented a simple model of human capital accumulation through formal schooling. Our model takes into account the involvement of the public sector in education by including a publicly provided input in the learning technology. We have established sufficient conditions for the existence and unique- ness of an equilibrium with endogenous public expenditures on schools. For plau- sible restrictions on the parameters of the learning technology and preferences, we have shown that the predictions of our model are roughly consistent with observa- tions on years of schooling, share of income allocated to public expenditures on education, and school quality.
To keep the exposition simple, we did not include physical capital in the model. One can modify our model to let the young choose labour supply and learning time and then determine their savings. The savings, in turn, determine the level of phys- ical capital. Such a model complicates our story without providing any new insights. For instance, to explain fact (ii) we need the income elasticity of demand for public expenditures on education to be greater than one even in the presence of physical capital.
We have abstracted from a few features of education in the United States and Canada. For instance, in both countries there is a private alternative to public edu- cation; public education finance is not centralized, as we have assumed. It would be interesting to incorporate heterogeneity into our model and study the households' decisions to opt out of the public sector for the private alternative. If the initial old are differentiated by their endowment of human capital, political mechanisms such as majority voting could be used to determine funding for public education. Such a model would yield joint predictions on public expenditures, enrolment in public and private schools, years of schooling, and the evolution of income inequality.
The degree of decentralization in financing public education may have interest- ing consequences for the level of funding for public education and human capital accumulation. The issue of decentralization is addressed by Fernandez and Roger- son (1998) and Benabou (1996). Fernandez and Rogerson provide a quantitative evaluation of switching from local to centralized financing and find substantial welfare gains from switching. In Benabou's model, state financing increases the
This content downloaded from 185.44.77.110 on Tue, 17 Jun 2014 21:08:23 PMAll use subject to JSTOR Terms and Conditions

Human capital accumulation 823
long-run growth rate relative to local financing; however, he does not provide a quantitative estimate of this growth effect. We know from related work (Glomm and Ravikumar 1995) that differences in funding levels for education do not necessarily translate into significant effects on human capital investment or growth. For instance, changing from pure public education to one with the opting out feature changes the level of funding for public education but has a negligible effect on growth. The same holds true when we change to a voucher system.
Appendix: Data sources
The sources for the data in section 2 are as follows.
Canada
Enrolment in public schools 1920-75. Leacy, EH. ed. (1993) Historical Statistics of Canada (Ottawa: Statistics
Canada) 1980-90. Education in Canada: A Statistical Review (Ottawa: Statistics Canada) 1982,
1987-88, 1991-92
GNP 1920-29. The Canada Year Book (Ottawa: Statistics Canada) 1922-23, 1929, 1933 1930-88. Mitchell, B.R. (1993) International Historical Statistics: The Americas, 1750-
1988 (New York: Stockton Press)
Public expenditures 1920-32. The Canada Year Book, 1925, 1927-28, 1933 1933-69. Leacy, EH. ed. (1993) Historical Statistics of Canada (Ottawa: Statistics
Canada) 1970-89. The Canada Year Book (Ottawa: Statistics Canada) 1976-77, 1980-81, 1990,
1992
Population 1900-80. Mitchell, B.R. (1983) International Historical Statistics of the Americas and
Australia (Detroit: Gale Research Company) 1985-90. The Canada Year Book (Ottawa: Statistics Canada)
Years of schooling 1911-30. Census of Canada 1941, vol. 1: General Review and Summary Tables (Ottawa:
Dominion Bureau of Statistics) 1950 1935-90. Education in Canada: A Statistical Review (Ottawa: Statistics Canada) 1991-92
University enrolment 1915. The Canada Year Book (Ottawa: Statistics Canada) 1915 1920-75. Leacy, F.H. ed. (1983) Historical Statistics of Canada (Ottawa: Statistics
Canada)
This content downloaded from 185.44.77.110 on Tue, 17 Jun 2014 21:08:23 PMAll use subject to JSTOR Terms and Conditions

824 G. Glomm and B. Ravikumar
1980-90. Education in Canada: A Statistical Review (Ottawa: Statistics Canada) 1982, 1987-88, 1991-92
Teacher-student ratios 1900-88. Mitchell, B.R. (1993) International Historical Statistics: The Americas, 1 750-
1988 (New York: Stockton Press)
United States
Enrolment in public schools 1900-60. U.S. Bureau of the Census (1975) Historical Statistics of the United States:
Colonial Times to 1970 (Washington DC: U.S. Department of Commerce) 1965-90. National Center for Education Statistics (1993) Digest of Education Statistics
(Washington DC: U.S. Government Printing Office)
GNP 1902-29. Mitchell, B.R. (1983) International Historical Statistics of the Americas and
Australia (Detroit: Gale Research Company) 1930-90. Economic Report of the President (Washington DC: U.S. Government Printing
Office) 1970, 1995
Public expenditures 1902-70. U.S. Bureau of the Census (1975) Historical Statistics of the United States:
Colonial Times to 1970 (Washington DC: U.S. Department of Commerce) 1971-90. National Center for Education Statistics (1993) Digest of Education Statistics
(Washington DC: U.S. Government Printing Office)
Population 1900-70. U.S. Bureau of the Census (1975) Historical Statistics of the United States:
Colonial Times to 1970 (Washington DC: U.S. Department of Commerce) 1975-90. Statistical Abstract of the United States, 1994
Years of schooling 1910-90. National Center for Education Statistics (1993) Digest of Education Statistics
(Washington DC: U.S. Government Printing Office)
High school graduates 1900-90. National Center for Education Statistics (1993) Digest of Education Statistics
(Washington DC: U.S. Government Printing Office)
Teacher-student ratios 1900-88. Mitchell, B.R. (1993) International Historical Statistics: The Americas, 1750-
1988 (New York: Stockton Press)
This content downloaded from 185.44.77.110 on Tue, 17 Jun 2014 21:08:23 PMAll use subject to JSTOR Terms and Conditions

Human capital accumulation 825
References
Altonji, J.G., and T.A. Dunn (1996) 'The effects of family characteristics on the return to education,' Review of Economics and Statistics 78, 692-704
Arrow, K.J. (1962) 'The economic implications of learning by doing,' Review of Economic Studies 29, 155-73
Azariadis, C., and A. Drazen (1990) 'Threshold externalities in economic development,' Quarterly Journal of Economics 105, 501-26
Barro, R.J. (1991) 'Economic growth in a cross section of countries,' Quarterly Journal of Economics 106, 407-43
Barro, R.J., and J.-W Lee (1996) 'International measures of schooling years and schooling quality,' AER Papers and Proceedings 86, 218-23
Barro, R.J., and X. Sala-i-Martin (1995) Economic Growth (New York: McGraw Hill) Benabou, R. (1996) 'Heterogeneity, stratification, and growth: macroeconomic implications
of community structure and school finance,' American Economic Review 86, 584-609 Benhabib, J., and M. Spiegel (1994) 'The role of human capital in economic development:
evidence from aggregate cross-country data,' Journal of Monetary Economics 34, 143-73
Bergstrom, T.C., D.L. Rubinfeld, and P. Shapiro (1982) 'Micro-based estimates of demand functions for local school expenditures,' Econometrica 50, 1183-205
Bils, M., and P.J. Klenow (2000) 'Does schooling cause growth?' American Economic Review 90, 1160-83
Boldrin, M. (1993) 'Public education and capital accumulation,' Discussion Paper No. 1017, Northwestern University
Card, D., and A. Krueger (1992) 'Does school quality matter? Returns to education and the characteristics of public schools in the United States,' Journal of Political Economy 100, 1-40
Coleman, J., et al. (1966) Equality of Educational Opportunity (Washington DC: U.S. Government Printing Office)
Cordoba, J.C. (2000) 'Supply side structural change,' manuscript, University of Rochester Fernandez, R., and R. Rogerson (1998) 'Public education and income distribution: a
dynamic quantitative evaluation of education-finance reform,' American Economic Review 88, 813-33
Glomm, G., and B. Ravikumar (1992) 'Public versus private investment in human capital: endogenous growth and income inequality,' Journal of Political Economy 100, 818-34 (1995) 'Vouchers, public and private education, and income distribution,' manuscript, Michigan State University
Hall, R.E., and C.I. Jones (1996) 'The productivity of nations,' NBER Working Paper No. 5812
Heckman, J.J., and VJ. Hotz (1986) 'An investigation of the labor market earnings of Pan- amanian males: evaluating sources of inequality,' Journal of Human Resources 21, 507-42
Heyneman, S. (1984) 'Research on education in developing countries,' International Jour- nal of Educational Development 4, 293-304
Krueger, A.B., and M. Lindahl (2000) 'Education for growth: why and for whom,' NBER Working Paper No. 7591
Levine, R., and D. Renelt (1992) 'A sensitivity analysis of cross-country growth regres- sions,' American Economic Review 82, 942-63
Lillard, L.A., and R.J. Willis (1994) 'Intergenerational educational mobility: effects of family and state in Malaysia,' Journal of Human Resources 29, 1126-66
Lindbeck, A. (1985) 'Redistribution policy and expansion of the public sector,' Journal of Public Economics 28, 309-28
This content downloaded from 185.44.77.110 on Tue, 17 Jun 2014 21:08:23 PMAll use subject to JSTOR Terms and Conditions
826 G. Glomm and B. Ravikumar
Lucas, R.E., Jr (1988) 'On the mechanics of economic development,' Journal of Monetarv Economics 22, 3-42 (1993) 'Making a miracle,' Econometrica 61, 251-72
Mankiw, N.G., D. Romer, and D.N. Weil (1992) 'A contribution to the empirics of eco- nomic growth,' Quarterly Journal of Economics 107, 407-37
Meltzer, A.H., and S.F. Richard (1978) 'Why government grows (and grows) in a democ- racy,' Public Interest 52, 111-18 (1981) 'A rational theory of the size of the government,' Journal of Political Economy 89, 914-27
Mueller, D.C. (1989) Public Choice II (Cambridge: Cambridge University Press) North, D.C. (1985) 'The growth of government in the United States: an economic histori-
an's perspective,' Journal of Public Economics 28, 383-99 Razin, A. (1972) 'Investment in human capital and economic growth,' Metroeconomica 24,
101-16 Romer, P. (1986) 'Increasing returns and long-run growth,' Journal of Political Economy
94, 1002-37 Stokey, N.L. (1988) 'Learning by doing and the introduction of new goods,' Journal of
Political Economy 96, 701-17 Uzawa, H. (1965) 'Optimum technical change in an aggregative model of economic
growth,' International Economic Review 6, 18-31 Wagner, A. (1893) Grundlegungder Politischen Oekonomic. 3d ed. Erster Theil, Leipzig:
Winter. Grundlagen der Volkswirtschaft, Zweiter Halbband, Buch 4-6, 893-908, Leipzig: Winter
Young, A. (1991) 'Learning by doing and the dynamic effects of international trade,' Quar- terly Journal of Economics 106, 369-406
This content downloaded from 185.44.77.110 on Tue, 17 Jun 2014 21:08:23 PMAll use subject to JSTOR Terms and Conditions