hullrmfi3rdedch23
DESCRIPTION
FRM hullTRANSCRIPT
Risk Management and Financial Institutions 3e, Chapter 23, Copyright © John C. Hull 2012
Economic Capital and RAROC
Chapter 23
1

Risk Management and Financial Institutions 3e, Chapter 23, Copyright © John C. Hull 2012
Economic Capital
A bank’s own assessment of the capital it requires
2
Risk Management and Financial Institutions 3e, Chapter 23, Copyright © John C. Hull 2012
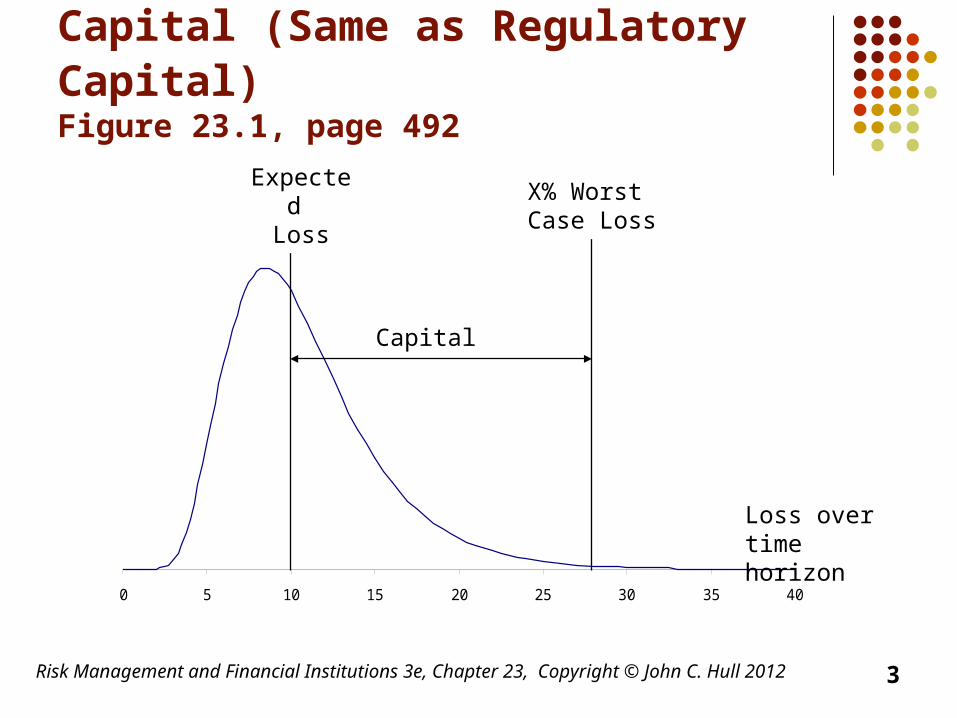
Model Used for Economic and Capital (Same as Regulatory Capital) Figure 23.1, page 492
-0.2
0
0.2
0.4
0.6
0.8
1
1.2
0 5 10 15 20 25 30 35 40
Loss over time horizon
Expected Loss
X% Worst Case Loss
Capital
3

Risk Management and Financial Institutions 3e, Chapter 23, Copyright © John C. Hull 2012
Choice of Parameters
For a bank wishing to maintain a AA-rating, capital is chosen so that X is about 99.95% and time horizon is one year
This is because statistics from rating agencies show that an AA-rated company should have a probability of only about 0.05% of defaulting in one year
4
Risk Management and Financial Institutions 3e, Chapter 23, Copyright © John C. Hull 2012
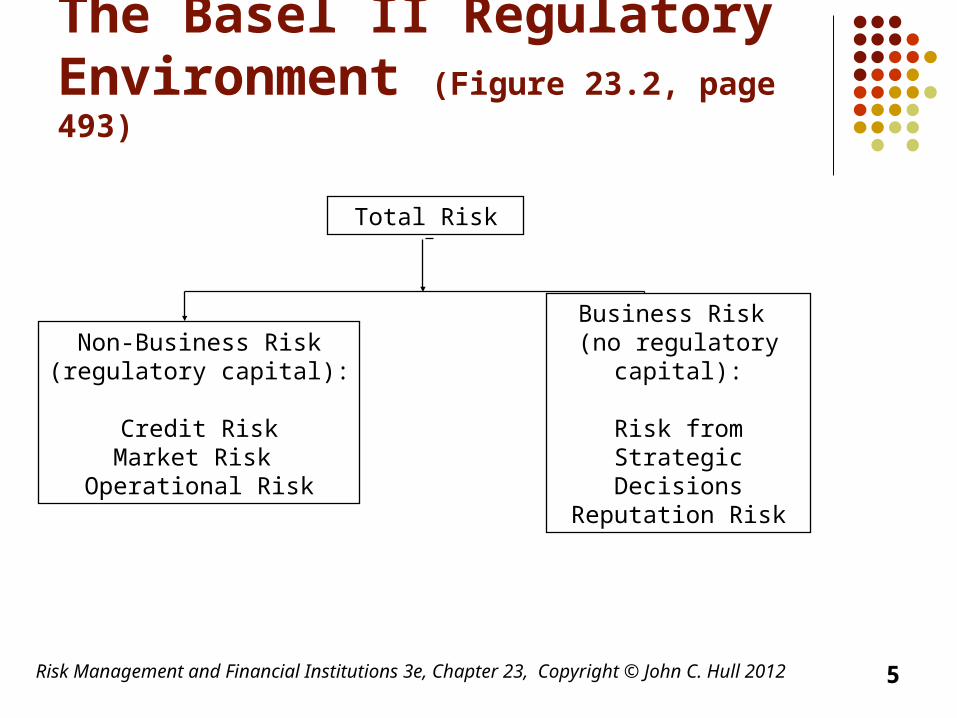
The Basel II Regulatory Environment (Figure 23.2, page 493)
Total Risk
Business Risk (no regulatory capital):
Risk from Strategic Decisions
Reputation Risk
Non-Business Risk(regulatory capital):
Credit RiskMarket Risk
Operational Risk
5

Risk Management and Financial Institutions 3e, Chapter 23, Copyright © John C. Hull 2012
One-year Market Risk Gains/Loss Distribution (Figure 23.3, page 496)
00.050.1
0.150.2
0.250.3
0.350.4
0.45
-6 -4 -2 0 2 4 6LossGain
6

Risk Management and Financial Institutions 3e, Chapter 23, Copyright © John C. Hull 2012
One-year Credit Risk Loss Distribution (Figure 23.4, page 496)
0
0.1
0.2
0.3
0.4
0.5
0.6
0 5 10 15 20Loss
7

Risk Management and Financial Institutions 3e, Chapter 23, Copyright © John C. Hull 2012
One Year Operational Risk Loss Distribution (Figure 23.5, page 496)
Loss
8

Risk Management and Financial Institutions 3e, Chapter 23, Copyright © John C. Hull 2012
Characteristics of Distributions (Table 23.1, page 497)
Second Moment
(Variance)
Third Moment
(Skewness)
Fourth Moment
(Kurtosis)
Market Risk High Zero Low
Credit Risk Moderate Moderate Moderate
Operational Risk
Low High High
9
Risk Management and Financial Institutions 3e, Chapter 23, Copyright © John C. Hull 2012
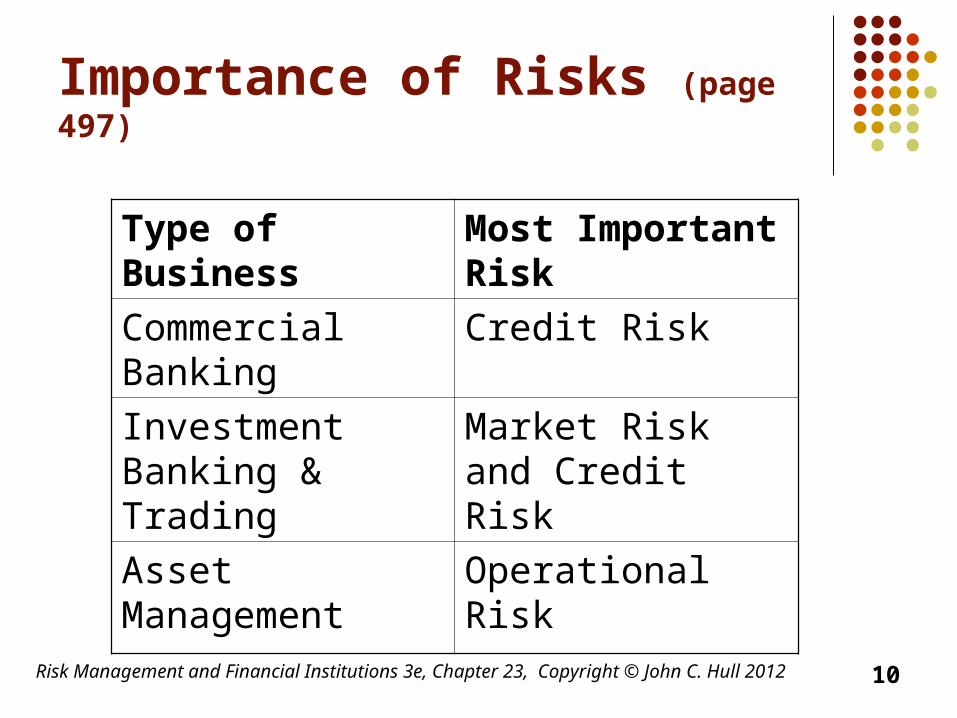
Importance of Risks (page 497)
Type of Business Most Important Risk
Commercial Banking
Credit Risk
Investment Banking & Trading
Market Risk and Credit Risk
Asset Management Operational Risk
10

Risk Management and Financial Institutions 3e, Chapter 23, Copyright © John C. Hull 2012
European Growth Trust (Example of Operational Risk in Asset Management) See Business Snapshot 23.1
No more than 10% of EGT could be invested in unlisted securities
Peter Young the fund manager violated this rule
The cost to Deutsche Bank was about $200 million
11
Risk Management and Financial Institutions 3e, Chapter 23, Copyright © John C. Hull 2012
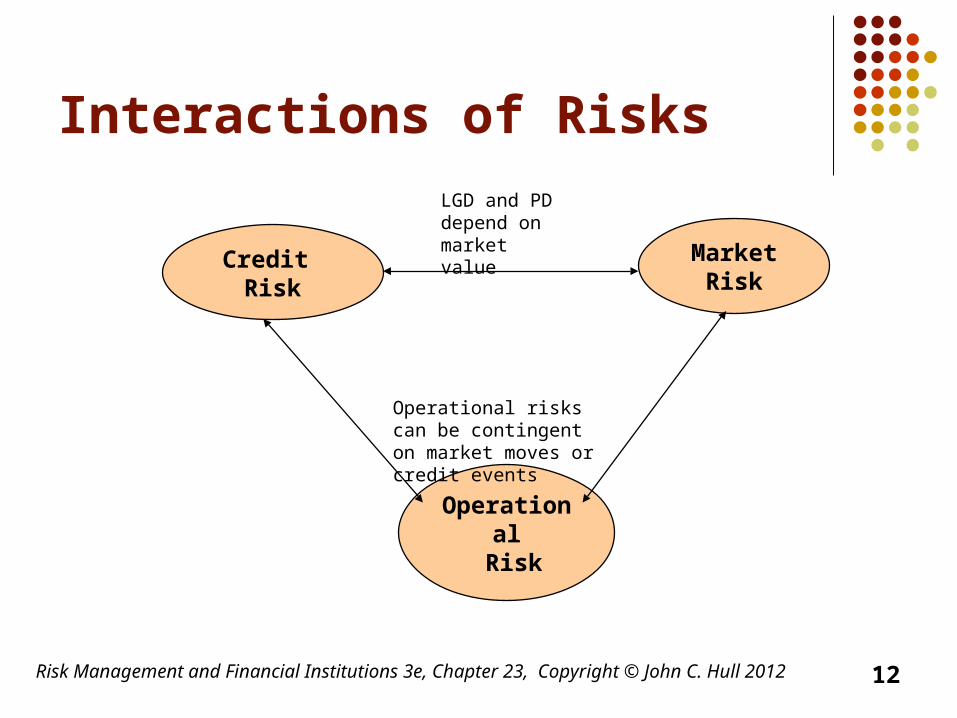
Interactions of Risks
Credit Risk
Market Risk
Operational
Risk
LGD and PD depend on market value
Operational risks can be contingent on market moves or credit events
12

Risk Management and Financial Institutions 3e, Chapter 23, Copyright © John C. Hull 2012
Integrated Risk Management
Typically a bank calculates economic capital for different types of risk and different units
It is then faced with the problem of aggregating the risks
13

Risk Management and Financial Institutions 3e, Chapter 23, Copyright © John C. Hull 2012
Combining the Distributions
Assume perfect correlation: overstates capital by about 40%
Assume distributions are normal for the purposes of aggregation: understates capital by about 40%
Hybrid approach:
seems to work reasonable well
n
i
n
jjiijtotal EEE
1 1
14
Risk Management and Financial Institutions 3e, Chapter 23, Copyright © John C. Hull 2012
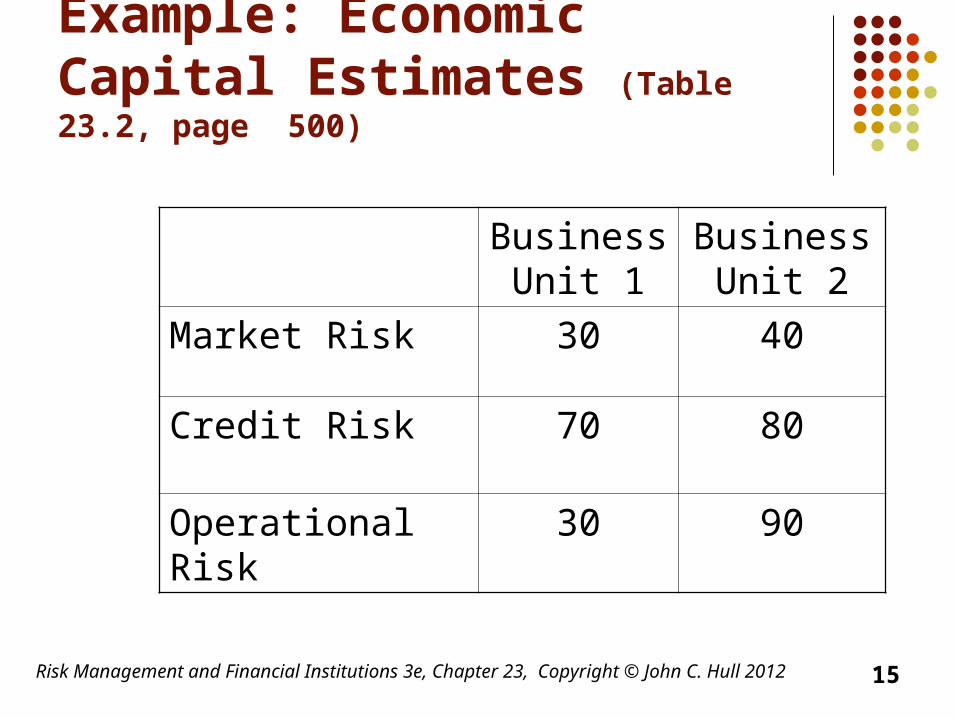
Example: Economic Capital Estimates (Table 23.2, page 500)
Business
Unit 1Business
Unit 2
Market Risk 30 40
Credit Risk 70 80
Operational Risk 30 90
15
Risk Management and Financial Institutions 3e, Chapter 23, Copyright © John C. Hull 2012
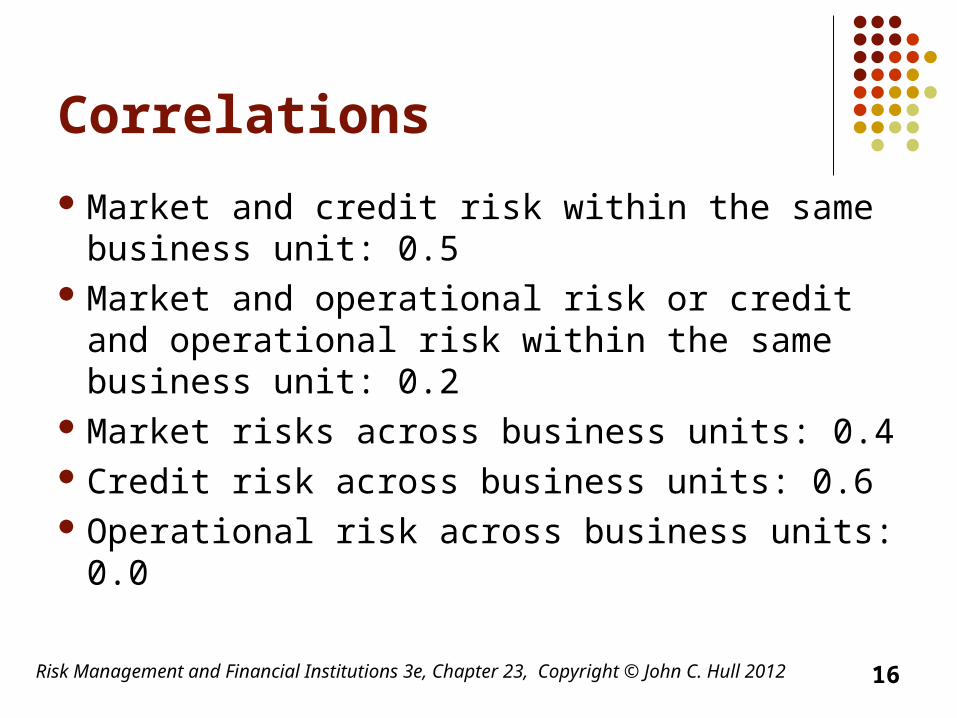
Correlations
Market and credit risk within the same business unit: 0.5
Market and operational risk or credit and operational risk within the same business unit: 0.2
Market risks across business units: 0.4 Credit risk across business units: 0.6 Operational risk across business units: 0.0
16

Risk Management and Financial Institutions 3e, Chapter 23, Copyright © John C. Hull 2012
Total Economic Capital
Business Unit 1: 100.0 Business Unit 2: 153.7 Whole bank: 203.2
Diversification benefit is 253.7 – 203.2 = 50.5How should this be allocated to the business units?Equivalently how should the total economic capital of 203.2 be allocated?
17

Risk Management and Financial Institutions 3e, Chapter 23, Copyright © John C. Hull 2012
Alternatives
Allocate economic capital in proportion to the stand alone economic capitals
Allocate economic capital in proportion to marginal contribution of business units to total economic capital
Set economic capital for business unit i equal to where xi is the size of business unit i
ii x
Ex
18

Risk Management and Financial Institutions 3e, Chapter 23, Copyright © John C. Hull 2012
Deutsche Bank Economic Capital (millions of Euros) Table 23.4, page 503
19
Credit Risk 12,785
Market Risk 13,160
Operational Risk 3,682
Diversification benefits (3,534)
Business Risk 1,085
Total economic capital 27,178
Total risk-weighted assets 346,204
Core Tier 1 Capital (% of RWA) 8.7%
Core plus Additional Tier 1 Capital (% of RWA) 12.3%
Tier 1 plus Tier 2 capital (% of RWA) 14.1%

Allocation of Deutsche Bank Capital
Risk Management and Financial Institutions 3e, Chapter 23, Copyright © John C. Hull 2012 20
Corporate banking and securities 14,828
Global transaction banking 1,291
Asset and wealth management 2,717
Private business clients 6,677
Corporate investments 902
Consolidation and adjustments 762
Total 27,178
Risk Management and Financial Institutions 3e, Chapter 23, Copyright © John C. Hull 2012
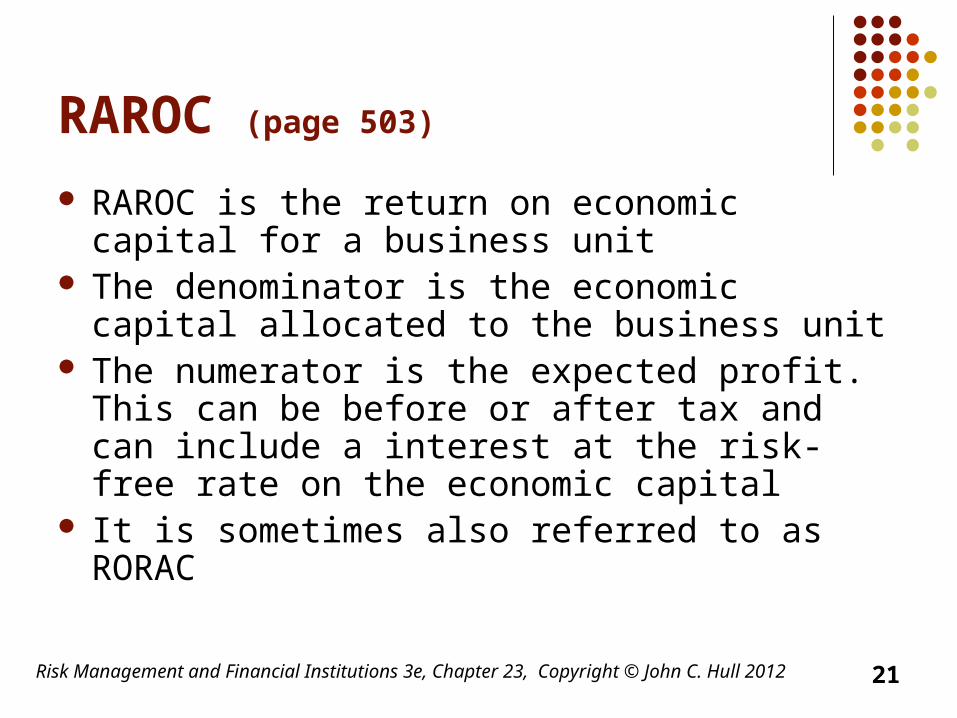
RAROC (page 503)
RAROC is the return on economic capital for a business unit
The denominator is the economic capital allocated to the business unit
The numerator is the expected profit. This can be before or after tax and can include a interest at the risk-free rate on the economic capital
It is sometimes also referred to as RORAC
21

Risk Management and Financial Institutions 3e, Chapter 23, Copyright © John C. Hull 2012
Example 23.5 (page 504)
When lending in a certain region of the world an AA-rated bank estimates its average losses from defaults as 1% of outstanding loans per year
The 99.9% worst case loss is 5% of outstanding loans
Economic capital per $100 of loans is therefore $4
22
Risk Management and Financial Institutions 3e, Chapter 23, Copyright © John C. Hull 2012
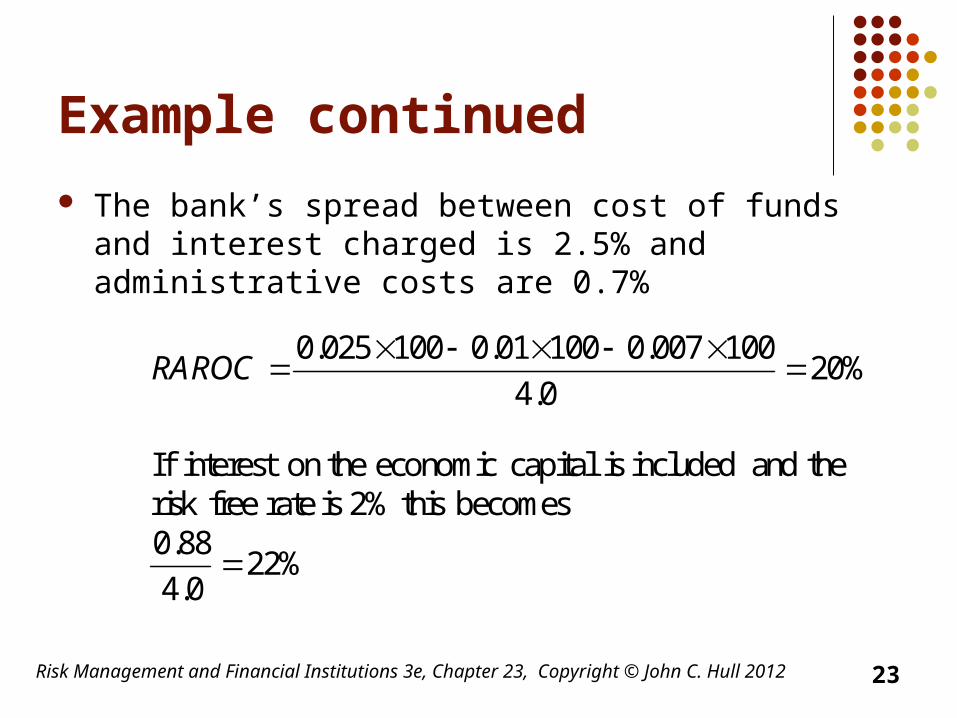
Example continued
The bank’s spread between cost of funds and interest charged is 2.5% and administrative costs are 0.7%
%220.4
88.0becomes this2% is rate freerisk
theand included is capital economic on theinterest If
%200.4
100007.010001.0100025.0
RAROC
23
Risk Management and Financial Institutions 3e, Chapter 23, Copyright © John C. Hull 2012
Ex-ante vs Ex-post
RAROC was originally suggested as a tool to be used on an ex-ante basis. This means that we have to forecast the expected loss
It is then used as a tool to allocate capital to the most profitable parts of the business
It is also sometimes used on an ex-post basis for performance evaluation. Realized loss then replaces expected loss
24