hull moving average
TRANSCRIPT

ActiveTrading
Course Notesby Alan Hull
Revision 0409

2
ActiveTrading
Course NotesDisclaimer
The content of this document is not intended to be advice and should not be interpreted assuch. This document contains comment and opinion and should be accepted or disregardedon this basis only. Neither ActVest Pty. Ltd. nor Alan Hull are licenced Financial Advisorsand an individual or persons seeking financial advice should contact a professional advisor.Any decision to trade or invest in financial markets and the method to be employed is theresponsibility of each and every individual or company. ActVest Pty. Ltd. and Alan Hullexpressly disclaim any and all liability arising from the use of this document, in part orwhole, by any individual, group of individuals or company that are in legal possession, ornot, of this document. The nature of any and all liability can include anything, theconsequences of anything done or omitted to be done by any individual, group of individualsor company.
The information contained in this document should be employed on a hypotheticalbasis, in real time, until satisfactory results of statistical significance are achieved.
©Copyright Alan Hull 2004
This document is copyright. This document, in part or whole, may not be reproduced ortransmitted in any form or by any means, electronic, mechanical, photocopying, recording,scanning or otherwise without prior written permission. Evaluation copies of this documentshould only be obtained from the author and third party distribution is an infringement ofcopyright. Further enquiries can be made to Alan Hull, the author, on 061-03-9778 7061.
Correspondence can be forwarded to ActVest Pty. Ltd. ACN 101 040 939 at 85 AllisterAvenue, Knoxfield, Victoria, 3180, Australia or via our website at http://www.alanhull.com

3
Contents........
Introduction 4Buy a rising share - sell a falling share 4Always use a stop loss that moves up with price activity 4Never risk more than 2% of total capital on any individual trade 4The 'Rate of Return' Indicator 5Multiple Moving Averages 6The Range Indicator 7
The Trading Strategy 8‘Rate of Return’ Searches 8Verifying & evaluating the Trend 9Using the ActTrade Newsletter MMA Charts 10Market entry 11Holding and Profit Taking 12Selling 13
Risk Management 14Position Risk 14Sector Risk 14Portfolio Risk 14
The Broad Market 15
Using the ActTrade Newsletter for the first time 16
General Considerations 18Don't commit all of your trading capital to the Market at once 18Don't buy into Market rallies 18Don't 'Make the Market' 18Capital Allocation 18Fundamentals 18Sectors 18
ActTrade Newsletter subscription form 19

4
IntroductionThere are 3 simple rules when it comes to successful share trading;
1 Buy a rising share - sell a falling share2 Always use a stop loss that moves up with price activity3 Never risk more than 2% of total capital on any individual trade
Buy a rising share - sell a falling shareThis rule is often confused with 'buy low - sell high' which has 85% of share traders buyingshares that are going down in price in the hope that they will immediately turn around andstart going up. This mistake leads to the sad statistic that 85% of share traders lose money.
'Buy a rising share - sell a falling share' is all about buying into markets that are alreadyrising, which is so painfully obvious that the majority of share traders, ie. 85% of them, don'tdo it. The reason for this is simple and psychological; human beings are counter-intuitive bynature. So in order to be successful we must be prepared to stop thinking like everybody else.
Always use a stop loss that moves up with price activityAn initial stop loss is a price level that defines the point at which we are ready to admit thatthe market is not behaving as we would expect and we are prepared to sell. In other wordsthis is the point where we admit that the trade is a failure. All share traders have losing tradesand the only fatal failure in the marketplace is the failure to execute one's stop losses.
When the market moves in the direction we expect it to then the price at which we areprepared to sell should move with it, locking in profits. If our stop loss has moved beyondour entry price (the point at which we bought into the market) and we fail to sell if it istriggered, then we are being greedy; this will also prove fatal.
Never risk more than 2% of total capital on any individual tradeThe game of coin toss is a fair game of chance where no participant should expect to win orlose over the long term. As global equity markets have risen by an average of 9% per annumfor the past 100 years, all share traders should expect to profit by an average of 9% perannum. So why do only 15% of share traders make money? Answer…the ability to survive.
If a participant wishes to remain in a game of coin toss for the long term then they wouldhave to be able to sustain a string of up to 8 consecutive losses. This is because a string of 8consecutive losses is likely to occur in a game where there are 2 equally possible outcomes.
The same logic applies to the Stockmarket where the majority of share traders in the U.S. inthe 1990s had an average life expectancy of only 8 trades. So in order to survive in themarketplace long enough to enjoy the average return of 9% per annum over the long term, itis essential that share traders can sustain an extended string of losses. By only risking 2% oftotal capital on any individual trade, a share trader can sustain up to 194 consecutive losses.
Active Trading is based on the 3 simple rules of successful share trading

5
The ‘Rate of Annual Return’ Indicator
The ‘Rate of Annual Return’ (ROAR) indicator is used to calculate the annual rate of returnof a share given its current rate of climb or fall. It achieves this by calculating the annualincrease in price activity and then dividing it by the current share price. The result is thenmultiplied by 100 to convert it to a percentage.
Example
• Lets assume that a share is climbing at a rate of $2 per year.• The current price of the share is $1.• The ‘Rate of Annual Return’ would be 2.0 ($2 divided by $1).• Converting this to a percentage we get 2.0 x 100 = 200%.
The ‘Rate of Annual Return’ (ROAR) indicator can be seen in the chart below. The ROARindicator uses linear regression for measuring price activity as opposed to moving averages.
Amadeus is enjoying a rate of annual return of 212% according to the above chart. Thehorizontal bar placed at 80% is a cutoff level. Searches can be performed using the ‘Rate ofAnnual Return’ indicator to sift out shares that only have a rate of annual return higher thanthe 80% cutoff. The ROAR indicator switches itself 'On' when it detects a trend of at least80% per annum and money flow of at least $3.5 Million/4 weeks (Money Flow = Volume xAvg. Price). It automatically switches itself 'Off' if the rate of annual return falls below 80%or the money flow falls below $5 Million/8 weeks. By using a search indicator that can alsotest for adequate liquidity (money flow), we avoid having to manually check it later on.
The ROAR indicator is used to generate the values in the weekly ActTrade newsletter.
6
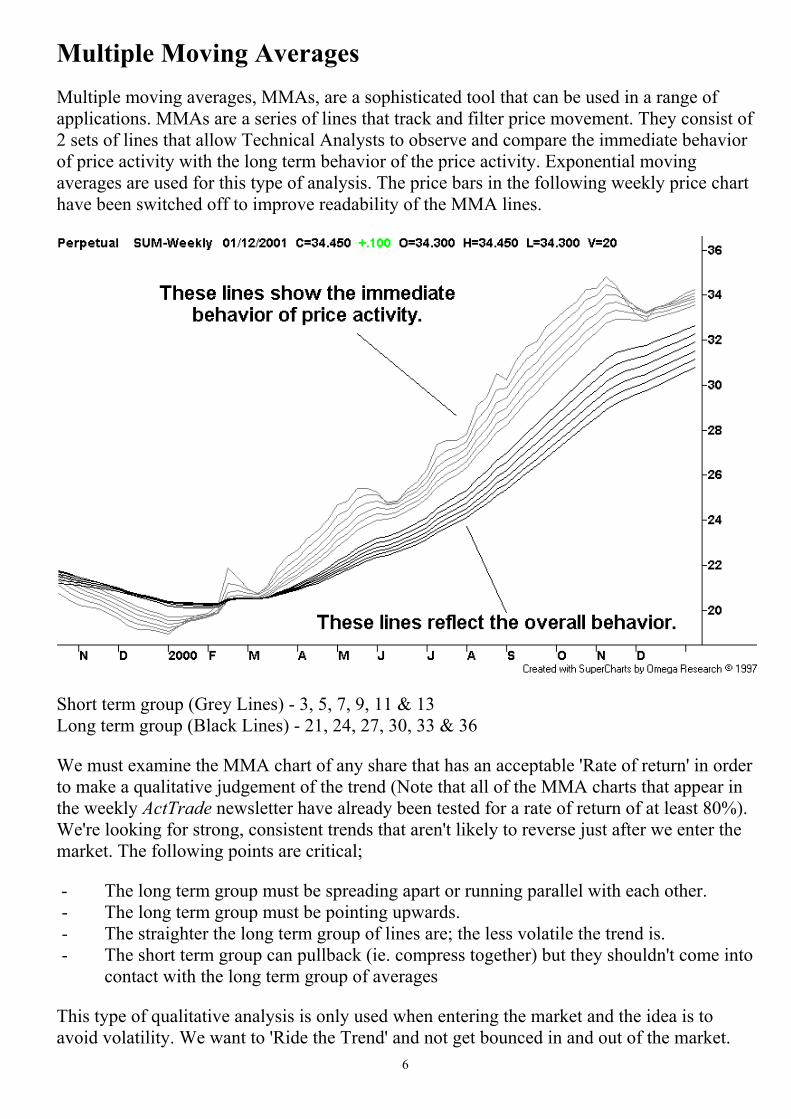
Multiple Moving AveragesMultiple moving averages, MMAs, are a sophisticated tool that can be used in a range ofapplications. MMAs are a series of lines that track and filter price movement. They consist of2 sets of lines that allow Technical Analysts to observe and compare the immediate behaviorof price activity with the long term behavior of the price activity. Exponential movingaverages are used for this type of analysis. The price bars in the following weekly price charthave been switched off to improve readability of the MMA lines.
Short term group (Grey Lines) - 3, 5, 7, 9, 11 & 13Long term group (Black Lines) - 21, 24, 27, 30, 33 & 36
We must examine the MMA chart of any share that has an acceptable 'Rate of return' in orderto make a qualitative judgement of the trend (Note that all of the MMA charts that appear inthe weekly ActTrade newsletter have already been tested for a rate of return of at least 80%).We're looking for strong, consistent trends that aren't likely to reverse just after we enter themarket. The following points are critical;
- The long term group must be spreading apart or running parallel with each other.- The long term group must be pointing upwards.- The straighter the long term group of lines are; the less volatile the trend is.- The short term group can pullback (ie. compress together) but they shouldn't come into
contact with the long term group of averages
This type of qualitative analysis is only used when entering the market and the idea is toavoid volatility. We want to 'Ride the Trend' and not get bounced in and out of the market.

7
The Range IndicatorThe Range indicator provides us with a series of price ranges that tell us when to buy, sell,hold or profit take. Although simple in construction, it tells us when the price activity ispulling back, rallying up or the trend is reversing. Its construction is based on anelectronically generated line that tracks price activity, known henceforth as the central cord.A function called 'Average true range' that measures price volatility is then used to positionupper and lower lines based on the central cord. These lines are referred to as the upperdeviation line and lower deviation line. These two lines create an envelope that defines ourtolerance towards price activity. The central cord, upper deviation and lower deviation linescreate four distinct price zones that tell us when to buy, hold, take profit or sell.
The following chart illustrates how the Range indicator is used to set buy, hold & sell zones.
When price trends either up or down it moves in a sawtooth pattern and not a straight line. Inan upward trend this behavior is caused by the repetition of a rally/profit-take cycle. As longas the buying force behind the rallies is greater than the selling force behind the profit-takingthe trend will continue. Upward trends end when the buying force is exhausted which is aninevitable occurrence. Share Traders often forget that all trends must ultimately end.
By using the range indicator to control our entry and exits we can avoid buying overpricedshares and sell when a trend reversal occurs. Although the Range Indicator is applied toweekly charts, the buy and sell signals are applied primarily on a day-to-day basis.
If price rallies beyond the upper deviation line then there is a heightened probability that itwill then fall past the lower deviation line. At this point it is prudent to sell and lock in profit.
Range indicator values, ie. upper, lower and central lines, are provided in the newsletter.

8
The Trading StrategyWe want to put a minimum amount of effort into locating and trading shares that are instable, upward trends. Whilst the analysis is done on a weekly basis, the trading strategymust be implemented on a day to day basis. As Active Traders we need to be prepared tomonitor the market on a daily basis or rapid intraweek price movements could prove fatal.
‘Rate of Annual Return’ SearchesWe begin by searching the entire Stockmarket with the ROAR indicator. We hold shareswith a rate of annual return of at least 80% per annum but we only buy when the rate ofannual return is at least 120%, reducing unwanted whipsawing. (Average ROAR = 100%)
The best point to have entered the above trend was soon after July when it had a rate ofreturn of at least 120% (Our 'Entry' level). As the trend has worn on, the rate of return hasdropped due to the rising share price and slowing trend. (The indicator uses the current priceto calculate the rate of annual return). By late December it was still acceptable to hold thisposition (Our 'Hold' level is 80%) but an entry into the market was no longer permissible.
Rule Only enter shares with a ROAR of at least 120%. If a share's ROAR dropsbelow 80% or its money flow drops below $5 Million/8 weeks then it willdisappear from the rising equities list. This is a stop loss (sell) condition andthe share must be sold during the next 3 trading days.
This 120%-plus entry criteria ensures that we are using our capital efficiently and it preventsus from entering worn out trends. Don't fall for the common trap of judging the profitabilityof a trend by the current share price, 'Rate of Return' is a proportional measurement.
9
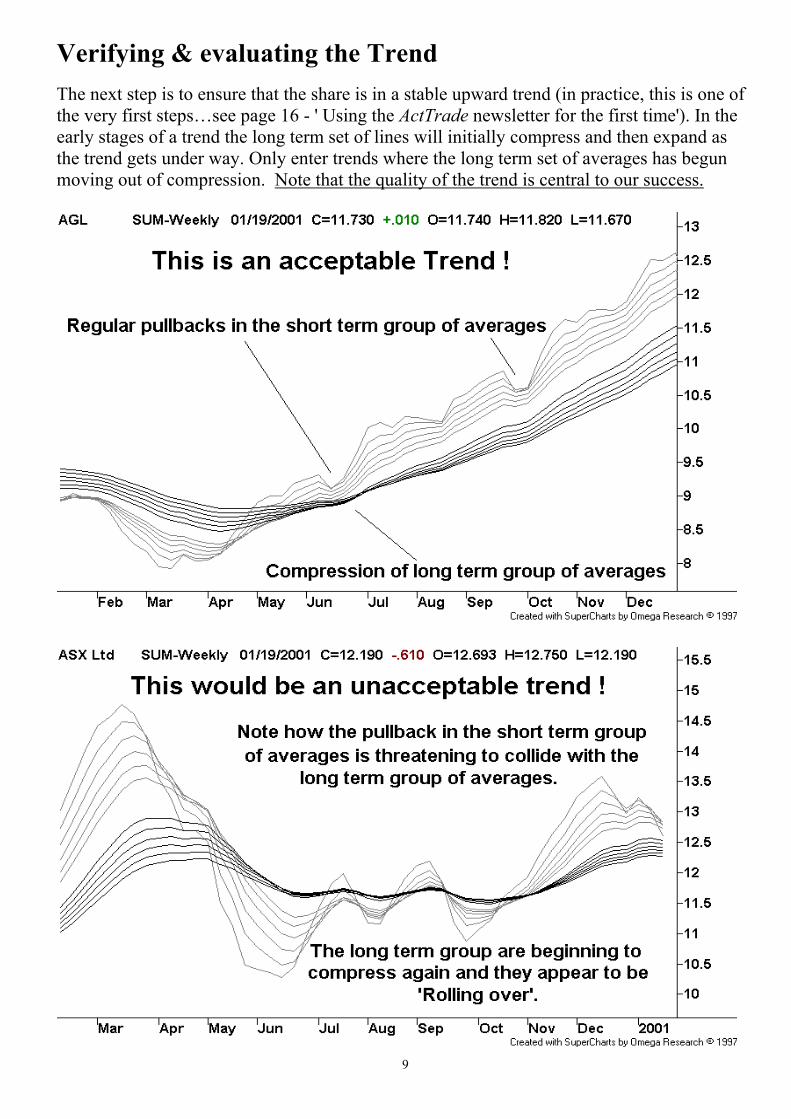
Verifying & evaluating the TrendThe next step is to ensure that the share is in a stable upward trend (in practice, this is one ofthe very first steps…see page 16 - ' Using the ActTrade newsletter for the first time'). In theearly stages of a trend the long term set of lines will initially compress and then expand asthe trend gets under way. Only enter trends where the long term set of averages has begunmoving out of compression. Note that the quality of the trend is central to our success.

10
Using the ActTrade Newsletter MMA Charts
The ActTrade Newsletter is available in PDF file format and is viewed using the AdobeAcrobat Reader which is freely available on the Internet. There are 8 MMA charts per A4page… making them quite small. You can use the 'Zoom' function in the Adobe AcrobatReader to enlarge the charts. Using the 'View' pulldown menu at the top of the screen; select'Zoom to...' and type '250' into the box that appears in the middle of the screen. Thismagnification level will increase the size of an MMA chart to the point where it almost fillsthe entire screen as shown below. Having the newsletter means not having to buy expensiveand complex charting software nor having to pay for an ongoing data feed from the ASX.
You can then use the slide bars situated on the right hand side and right hand bottom of thescreen to navigate around the charts. To zoom out again simply go back to 'Zoom to…' andtype '125' into the magnification box. This will return you to the full page width display.
Identifying a good trend using the MMA charts is a matter of opinion and there is no rightand wrong answer. Your ability to interpret MMA charts will improve with practice and yourhip pocket nerves will guide you better than any external guidance can. However I can sharemy opinion on the above MMA chart of Sonic Healthcare which shows a consistent trend upuntil the last few weeks where it has begun to go sideways. It would pay to wait until SHLbegins to rise in price again, which will be seen in the short term group of averages. I oftenrefer to the above type of chart pattern as a 'Flat top' situation.

11
Market entryOnce we have found a share with an acceptable trend and a ROAR greater than 120% wemust fine tune the entry. Although we want to jump on board a trend when the price is in adip it is important not to enter the market whilst the price activity is 'Gunning the stop loss'.We need to wait for the market to reverse and show evidence of buyer support. This isevidenced by a rising day where the closing price is higher than the opening price of thesame day and higher than the previous closing price. In order to identify a rising day you willneed to have access to daily bar charts like the one below. Online Brokers often provide thistype of chart as does www.asx.com.au and www.sharesmag.com.au (look under 'Tools')
Using the values for the central cord and the lower deviation from the ActTrade newsletter,determine that a rising day has occurred in the 'Buy/Hold' zone (see diagram on page 7 for anexplanation of the 'Buy/Hold' zone). You must then purchase the share on the dayimmediately following the rising day, ensuring that your purchase price is not greater thanthe central cord value. Hence the rising day must have closed in the 'Buy/Hold' zone and thepurchase price must also be between the central cord and lower deviation, inclusive.
Rule Only enter the market in the 'Buy/Hold' zone during the day immediatelyfollowing a rising day, which must have closed in the 'Buy/Hold' zone.(A rising day is where the closing price is greater than the opening price ofthe same day and higher than the closing price of the previous day)
We won't always be able to purchase the shares we want immediately because many of thethem won't be in the buy/hold zone . It is normal to have to wait several weeks for an entry.
The ActTrade Newsletter contains the Central Cord and Lower Deviation values for all ofthe shares that appear on the rising equities list. These values are updated every week.

12
Holding and Profit TakingAlthough holding or profit taking are often conceived by market newcomers to be the easiestaspects of trading they are in fact one of the few areas of trading that require the use ofhuman discretion. The range indicator as shown in the following chart dictates, as much aspossible, the boundaries for holding and profit taking.
Active trading is a trend following strategy and, providing price activity remains between theupper and lower lines of deviation, there is no need to close a position. If, however, the priceactivity overheats and closes at the end of the week in the 'Profit Take' zone then selling ismandatory. A true cliché is 'You will never go broke by taking profit'.
The reason for selling when the price activity exceeds the upper deviation line is because thenext stop, on the balance of probability, is the 'Stop Loss' zone. As mentioned earlier, priceactivity moves in a sawtooth pattern and a weekly close outside our trading range is apowerful indication that the volatility has reached a critical level. The fact that the tradingrange has initially been breached to the upside is fortuitous as we can make a timely andprofitable exit. Our actions as share traders should be driven by the balance of probabilityand if our upside exit proves to be premature then we can always re-enter the ongoing trend.Re-entering trends that have recovered after 'Stopping out' is also a common occurrence .
Rule If the market closes at the end of the week above the Upper Deviationthen the share must be sold during the next 3 trading days. If it closes at theend of the day above the Upper Deviation then profit taking is optional.
The ActTrade Newsletter contains the Upper Deviation value for all of the shares thatappear on the rising equities list. These values are updated every week.

13
Selling
This is the most critical aspect of any strategy and the decision to sell must be mechanicaland carried out with total discipline. The stop loss must always be monitored on a dailybasis; if the price closes at the end of the day below the lower deviation then you must sellthe position during the next 3 days . Daily monitoring of your portfolio and daily stop lossexecution is critical in fast moving markets when it comes to protecting your trading capital.
The easiest way of monitoring your daily stop losses is to setup a daily chart for each of youropen positions and place a horizontal bar (often referred to as a support/resistance bar inmany charting programs) at the lower deviation value. This technique is shown in thefollowing chart.
The above daily price chart of Acclaim (AEX) illustrates the simplicity of monitoring a stoploss. It is a far simpler process than either entering the market or taking profits. It should alsobe noted that you must complete the sale of the position within 3 days of a stop loss beingbreached. If you wish to re-enter the market, having just executed a stop loss, then you mustabide by the normal 'Market entry' rules as explained on page 11. (Re-entry is quite common)
Rule If the price closes at the end of the day below the Lower Deviation then theshare must be sold during the next 3 trading days. This is a sell condition.
As mentioned earlier, the ROAR indicator can also signal an exit if it drops below 80% orthe money flow drops below $5 Million/8 weeks. If so, the share will disappear from the list.
The ActTrade Newsletter contains the Lower Deviation value for all of the shares thatappear on the rising equities list. These values are updated every week.

14
Risk ManagementShare Traders can only manage the risks involved in share trading if they use clearly definedentry and exit prices. As Active Traders these are defined for us by the Range Indicator.
Position RiskThe potential loss in owning each share is referred to as position risk. Traders normally usethe 2% risk rule that states;
‘The total loss for any single trade must not exceed 2% of total capital’Your total capital is the current value of all shares held plus the total amount of cash on hand.By risking only 2% of our total capital on each trade it would take well in excess of 150consecutive losses to lose all of our money. Statistics from the U.S indicate that 20% ofTraders use risk management which coincides with the fact that only 20% of Traders survive.
Example
- We are trading with $20,000 total capital and using the 2% risk rule- Assume that the closing price of a share is 12 cents & the stop loss is set at 10 cents.
(It is assumed in this example that the closing price is the probable entry price.)- The potential loss per share is 12 - 10 = 2 cents and 2% of $20,000 = $400- Divide $400 by 2 cents to get the number of shares we can buy = 20,000 shares- Multiply 20,000 by the closing price of 12 cents to get the position size = $2,400- Divide $2,400 by $20,000 and multiply by 100 to get the percentage of total capital
that can be spent on this position = 12% (This is the maximum position size)
Sector Risk (Also referred to as Industry Risk)
We want to be able to capitalize on strong sectors without being overly exposed to sector'Fads'. To limit our exposure we will only allocate a maximum of 30% of our total capital persector and a maximum of 6% position risk per sector, ie. 3 positions/sector (3 x 2% = 6%).(GICS Industry Group information can be found at the ASX Website - www.asx.com.au)
Portfolio RiskPortfolio risk is the sum total of our position risk. Therefore we must limit our maximumnumber of positions at any given time in order to control our total exposure to the market. Amaximum of 20% portfolio risk will yield a maximum of 10 positions (10 x 2%). In fact it isa good idea to operate well within this limit at say a total of 5 positions. This is because mostof us will find even just 5 positions difficult to manage on a day to day basis if the marketsuddenly turns volatile. An example of such an event was the impact on markets by S11.
The '2% Risk Rule for T.C.(%)' column in the ActTrade Newsletter is calculated using thecentral cord and the lower deviation values. The amounts shown are the maximumweightings for total capital, ie. a 10 in this column means 10% of your total capital. Thiscolumn will display a maximum value of 20 because the largest allowable position is 20%.

15
The Broad MarketMid to small capitalization shares are part of a market segment that has a high positivecorrelation with the S&P/ASX Small Ordinaries Index. It is therefore very prudent to onlytrade this market segment when the Index is performing well, otherwise you will often findyourself working hard for little profit. The Index is performing well when its MMA chart (asshown below) is trending up, in much the same way as an MMA chart of an individual sharetrends up. In short…if you wouldn't buy the Index, then don't buy a share within the Index.
We can take this approach a step further by using a 'Crossover' chart as seen below. Thischart contains a 9 day (Grey) simple moving average and a 21 day (Black) simple movingaverage. When the Grey line is below the Black line then the Index is in retreat and headingdown and when the Grey line is above the Black line then the Index is trending upwards.
If the grey line is above the black line at the right hand leading edge of the chart then it is OKto enter the market, ie. buy shares during the forthcoming week. But if the grey line is notabove the black line then no new positions should be opened during the forthcoming week.The Crossovr chart will prevent us from buying into the market the moment it starts to retreatwhile the MMA chart will keep us out of the market until the overall situation improves.
The newsletter includes an MMA & crossover chart of the S&P/ASX Small Ordinaries Index.

16
Using the ActTrade Newsletter for the first timeLets assume that you are now studying your very first ActTrade Newsletter. Having checkedthat the Broad Market conditions are O.K. (both the MMA and Crossover charts of the SmallOrdinaries Index are acceptable), the next step is to go to the MMA charts and make a shortlist of the shares that you believe have the least amount of volatility and that are trendingupwards in the strongest possible manner. The following charts are indicative of those shownin the weekly ActTrade Newsletter and show 30 weeks (just over 6 months) of price activity.
ABC (top left) is showing some volatility in the short term group of averages and is 'Rollingover' on the right hand leading edge of the chart. This 'rolling over' indicates that the trend isstarting to soften. What's more this softening can be seen in the long term group of averages.
DEF (top right) is a less pronounced version of ABC. Whilst the situation with ABC looksterminal, I would be prepared to enter DEF if I saw the MMA chart begin to turn upwards.
UVW (below left) is near perfect and I would have no hesitation in buying into this market.
XYZ (below right) isn't a trend at all. It ran up sharply in December but has fallen ever since.
Your ability to read MMA charts will improve with time and practice. Avoid volatility andyou will be more profitable, with less work, over the long term. Remember the more criticalyou are…the better. (Expect to find only several good MMA charts each week and in a dullmarket there may be none) Having scrutinized the MMA charts you should now have a shortlist of potential trading opportunities and be ready to turn your attention to the Data Tables.

17
Weekly search results are presented in the following format.
Share Closing Central Upper($) Lower($) Rate of 2% Risk RuleCode Price($) Cord($) Deviation Deviation Ret.(%) for T.C. (%)
ADJ 0.370 0.413 0.495 0.330 180 10EHY 0.650 0.788 0.998 0.579 235 8REM 0.320 0.333 0.403 0.285 110 14
We now have to check each of the shares in our short list to see which ones have anacceptable rate of annual return. REM is the only share listed above that doesn't have anacceptable rate of annual return. (The minimum entry level rate of annual return is 120%)
Next we must take note of the share's central cord and lower deviation values as we musttranscribe these values onto a daily price chart. We then have to sit back and wait for an entrywhere an entry is signalled when a rising day occurs with a closing price between the centralcord and lower deviation, inclusive. As described earlier, a rising day is where the closingprice is higher than the opening price of the same trading period and also higher than theclosing price of the previous trading period.
Once an entry is signalled you can purchase the corresponding share with an amount of yourcapital less than or equal to, but never greater than, the percentage given in the '2% Risk Rulefor T.C.(%)' column. The entry is only valid for the forthcoming trading day…during whichtime you can 'Buy' the share providing the purchase price is between the 'Lower Deviation'and the 'Central Cord', inclusive.
As it is highly probable that you will only be able to enter maybe 1 or 2 positions each week,you will have to repeat the above process over and over again. It is in fact quite normal tospend several weeks waiting for shares to give an entry signal. Of course there are alwaysshares that 'Get away' from us by never slowing down long enough for us to get on board.
This is a perfectly normal occurrence and one that often leads novice traders into becomingoverly aggressive and ultimately breaking their trading rules so they can get into the market.Don't try to be omnipresent in the marketplace and always remember that there will be manymissed opportunities. It is an inevitable reality of share trading that whilst you are losingmoney on a trade, someone else is making money on another trade…learn to live with it!!!!
Once you have acquired positions you can write down the 'Lower Deviation' values for eachof your shares on a weekly basis using the Newsletter. At the end of each day you can checkto see if any of your shares have closed below their respective lower deviation values, thussignalling an end-of-day stop loss. This is inevitable and when it occurs you must sell theshare during the next 3 trading days. If a share that you own is removed from the risingequities list then the ROAR indicator has switched 'OFF', also signalling an exit condition.
You may also elect to monitor the upper deviation on a day to day basis. Profit taking on anend-of-day basis when the share price closes above the upper deviation is optional. But if theclosing price is above the upper deviation in the weekly newsletter then selling is mandatory.

18
General ConsiderationsThe following points, whilst not critical for success, will undoubtedly enhance yourperformance as an Active Trader.
Don't commit all of your trading capital to the Market at onceUnlike Blue Chip share trading it’s a good idea to aim to have no more than 75% of yourtotal capital allocated to the market at any given time. This way you will always have somecapital in reserve for new opportunities.
Don't buy into Market ralliesAs Active Traders we are attempting to identify upward trending shares where a trend isdefined as a series of higher highs and higher lows. In other words a trend is where priceactivity runs up for several weeks and then pauses for several weeks and then repeats thewhole process all over again.
We do not want to buy into a market rally where price activity has continued to move upweek after week. To avoid this situation it pays to overlook MMA charts where the priceactivity has been rising for less than 2 months because rallies rarely last beyond this time.
Don't 'Make the Market'The ROAR indicator tests market liquidity by testing money flow. The benchmark used bythe ROAR indicator equates to an average daily minimum of $150,000. It doesn't ensure thatyou won't 'Make the Market' by buying or selling too many shares, thus moving share pricessignificantly up or down. A good rule of thumb is to ensure that your daily transactions inany market don't exceed 10% of the total volume of shares being traded.
Capital AllocationDifferent market segments (ie. Blue Chip shares, small capitalization shares, etc) representdiffering degrees of risk and reward. They also have non-correlating performance whichmeans that while large capitalization shares are enjoying a strong rally, usually in unisonwith their offshore cousins, small capitalization shares may be suffering a general decline. Soto ensure exposure to the entire market it is a wise idea to allocate capital to several marketstrategies that are targeted at different market segments, ie. Active Trading for small tomedium capitalization shares and Active Investing for Blue Chip shares. To download freeinformation on Active Investing (PDF files) please visit our website at www.alanhull.com
FundamentalsWhilst 'Active Trading' is purely a technical approach (analysis of price activity) it certainlydoesn't hurt to analyse a company's fundamentals as well. Our overall objective is to shift thebalance of probability as far as possible in our favour and seeking good fundamentals as wellas rising share prices will only assist us in this endeavour. This added research will also helpimprove our win/lose ratio which can easily fall below 50/50 in tough market conditions.
SectorsWe can shift the balance of probability even further in our favour if we perform what iscommonly known as 'Top Down Analysis' or 'Sector Analysis'. By buying a rising sharewithin a rising Sector we will be trading in the same direction as the entire Sector, not justthe share. As with fundamentals, Sector analysis will further enhance our win/lose ratio.

19
ActTrade Newsletter Subscription FormDISCLAIMER
• All information, material and opinion given by Alan Hull or any of his servants and/or agents during anycourse or session relating to any securities, the share market, stock exchange or any associated subject matteris provided solely as a means for transmitting information and for education and/or training purposes.
• Nothing given or said in any course or session is intended to be taken as advice of a particular or of a generalnature. Any opinions given are provided merely as necessary and incidental to the relaying of information andfor the education and/or training purpose.
• Although every care is taken the nature and content of the education and/or training prevents the giving ormaking of any representations or guarantees as to the commercial or financial suitability of any of thematerial, information and opinions given.
• Alan Hull and his servants and/or agents accept no liability for any reliance upon the material, information andopinion given in the course or session and no responsibility is accepted for any losses, charges, damages orexpenses which may be sustained or incurred by any participant or otherwise by reason of any reliance uponthe materials, information or opinion given.
• Participants are responsible for making his or her own assessment of the matters discussed during the courseor session and are hereby expressly advised to verify and to obtain independent advice before acting on anyrepresentations, statements, information or opinions given.
• The course instructors and authors are not licensed securities dealers or professional financial advisers and donot operate a securities business or investment advice business.
• This disclaimer is a continuing disclaimer and applies to the primary course or session and any future supportgiven (whether on-going or otherwise) following completion of the course or session.
Acknowledgment• I, the undersigned, acknowledge that I have read and understand the above advice and disclaimer.• I acknowledge that ActVest P/L ACN 101 040 939 must retain my credit card details, as supplied below, for
the purpose of charging me $27.50 including GST on the 1st day of each month for my ActTrade Newslettersubscription and that, should I elect to discontinue my subscription, I must notify ActVest P/L in writing.
• I acknowledge that I will at all times in the future indemnify Alan Hull and his servants and/or agents againstall actions, liabilities, proceedings, claims, costs and expenses which I may suffer, incur, or sustain inconnection with, or arising in any way whatsoever in reliance upon any material, information or opinionsprovided by Alan Hull and his servants and/or agents.
• I acknowledge that any future dealings I may undertake in any securities will be entered into freely andvoluntarily and without inducement or encouragement from Alan Hull and his servants and/or agents.
Please print all details clearly, tick where appropriate, sign, date and fax or post toActVest at 85 Allister Avenue, Knoxfield, 3180. Phone-03 9778 7061 Fax-03 9778 7062
Yes, I wish to become an ActTrade Newsletter Subscriber ($49.50 joining fee plus $27.50 per month).
Please charge to my Credit Card: VISA MasterCard Bankcard
Card No. ___ ___ ___ ___ ___ ___ ___ ___ ___ ___ ___ ___ ___ ___ ___ ___ EXPIRY ____ / ____
My full Name ____________________________________________________Mailing address ____________________________________________________E-mail address ____________________________________________________Daytime Phone ____________________________________________________
Please sign here x………………………………..... ....... DATED: / /