hubbard · 2015-02-26 · hubbard ugb amount to about 26 miles (137,280 feet). hubbard currently...
TRANSCRIPT

HUBBARD Transportation System Plan
Hubbard, Oregon
Prepared For: The City of Hubbard 3720 2nd Street - P O Box 380 Hubbard, Oregon 97032 (503) 981-9633
Prepared By: Mid-Willamette Susan Wright, PE and Jessica Horning Council of Governments Kittelson & Associates, Inc 105 High Street SE 610 SW Alder, Suite 700 Salem, Oregon 97301 Portland, OR 97205 (503) 588-6177 (503) 228-5230 This project is partially funded by a grant from the Transportation and Growth Management (TGM) Program, a joint program of the Oregon Department of Transportation (ODOT) and the Oregon Department of Land Conservation (DLCD) and Development. This TGM grant is financed, in part, by federal Safe Accountable Flexible Efficient Transportation Equity Act: A Legacy for Users (SAFETEA-LU), local government, and the State of Oregon funds. The contents of this document do not necessarily reflect views or policies of the State of Oregon.
May 2012
EXHIBIT "A"
Acknowledgments
The following people are acknowledged for their contributions to the development of this Transportation System Plan:
Project Advisory Committee Lucy Astorga, Administrative Assistant, City of Hubbard Todd Chase, FCS Group Chief Dave Dryden, Hubbard Police Department Suzanne Dufner, Mid-Willamette Valley Council of Governments Jaime Estrada, Public Works Superintendent, City of Hubbard Dan Fricke, Oregon Department of Transportation (ODOT), Region 2 Michael “Swede” Hays, Rail Division, ODOT Jessica Horning, Kittelson & Associates Eliseo Lemus, Roadway Design Unit, ODOT Vickie Nogle, Director of Administration/City Recorder, City of Hubbard
Karen Odenthal, Marion County Public Works, Transportation Division Melinda Olinger, Public Works, City of Hubbard Brandon Reich, Marion County Public Works, Planning Division Dorothy J. Upton, Transportation Planning Analysis Unit, ODOT Susan Wright, P.E., Kittelson & Associates Naomi Zwerdling, Oregon Department of Transportation, TGM
City of Hubbard Planning Commission Dan Estes Glenn Holum Nathan Hurst Melodie Rice Brad Williams City of Hubbard City Council
Tom McCain, Mayor Chip Enbody Matt Kennedy Bruce Warner Angie Wheatcroft
EXHIBIT "A"

City of Hubbard TSP, 2012 ii
Table of Contents
Page Introduction............................................................................................. 8 Transportation Goals and Policies......................................................... 14 Transportation Inventory........................................................................ 20 Existing and Future Conditions.............................................................. 44 Alternatives Analysis.............................................................................. 74 Preferred Plan and Financially Constrained Alternative....................... 110 Implementation of the Transportation System Plan.............................. 134 Glossary.................................................................................................. 140 References.............................................................................................. 146
EXHIBIT "A"
City of Hubbard TSP, 2012 iii
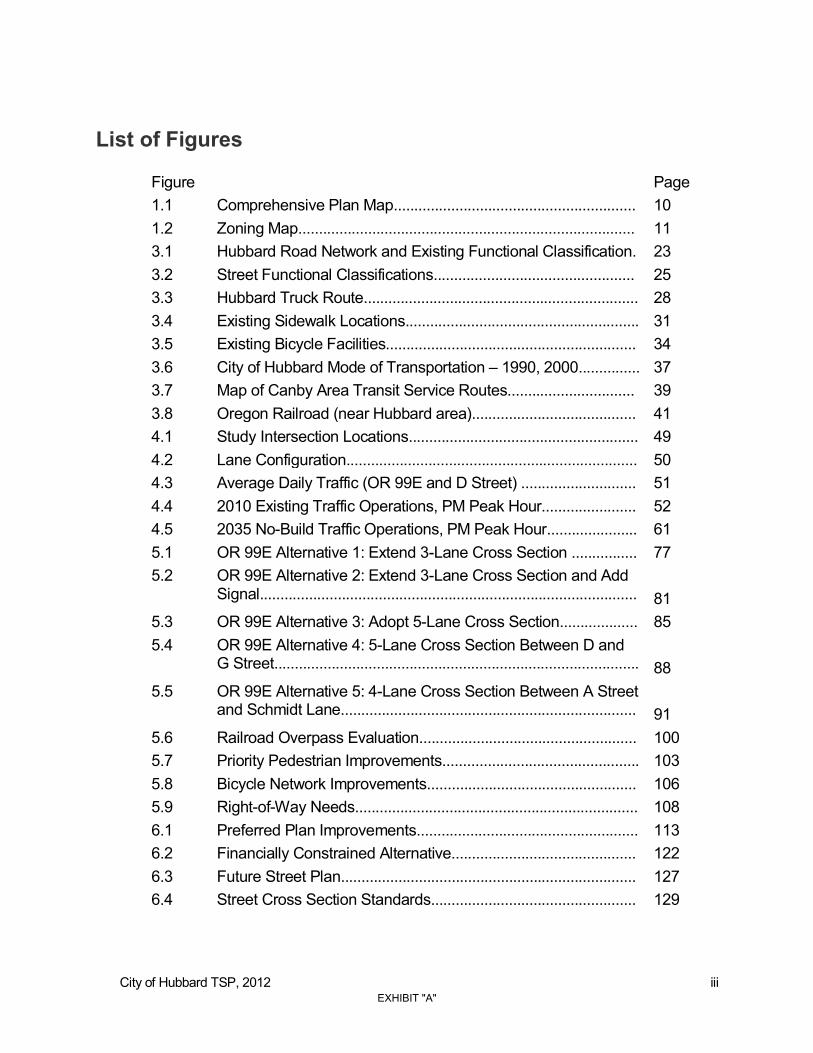
List of Figures
Figure Page 1.1 Comprehensive Plan Map........................................................... 10 1.2 Zoning Map.................................................................................. 11 3.1 Hubbard Road Network and Existing Functional Classification. 23 3.2 Street Functional Classifications................................................. 25 3.3 Hubbard Truck Route................................................................... 28 3.4 Existing Sidewalk Locations......................................................... 31 3.5 Existing Bicycle Facilities............................................................. 34 3.6 City of Hubbard Mode of Transportation – 1990, 2000............... 37 3.7 Map of Canby Area Transit Service Routes............................... 39 3.8 Oregon Railroad (near Hubbard area)........................................ 41 4.1 Study Intersection Locations........................................................ 49 4.2 Lane Configuration....................................................................... 50 4.3 Average Daily Traffic (OR 99E and D Street) ............................ 51 4.4 2010 Existing Traffic Operations, PM Peak Hour....................... 52 4.5 2035 No-Build Traffic Operations, PM Peak Hour...................... 61 5.1 OR 99E Alternative 1: Extend 3-Lane Cross Section ................ 77 5.2 OR 99E Alternative 2: Extend 3-Lane Cross Section and Add
Signal............................................................................................ 81
5.3 OR 99E Alternative 3: Adopt 5-Lane Cross Section................... 85 5.4 OR 99E Alternative 4: 5-Lane Cross Section Between D and
G Street......................................................................................... 88
5.5 OR 99E Alternative 5: 4-Lane Cross Section Between A Street and Schmidt Lane........................................................................
91
5.6 Railroad Overpass Evaluation..................................................... 100 5.7 Priority Pedestrian Improvements................................................ 103 5.8 Bicycle Network Improvements................................................... 106 5.9 Right-of-Way Needs..................................................................... 108 6.1 Preferred Plan Improvements...................................................... 113 6.2 Financially Constrained Alternative............................................. 122 6.3 Future Street Plan........................................................................ 127 6.4 Street Cross Section Standards.................................................. 129
EXHIBIT "A"

City of Hubbard TSP, 2012 iv
List of Tables
Table Page 3.1 Existing Road Network: Allocation by Functional Classification....... 26 3.2 Summary of Public Transportation Services in the Hubbard Area... 38 3.3 CARTS Fares for Route #10 (May 2011).......................................... 40 4.1 Jurisdictional Responsibilities............................................................ 46 4.2 Existing Hubbard Street Design Standards...................................... 47 4.3 Existing ODOT Rural Arterial Design Standards.............................. 47 4.4 Access Spacing Standards................................................................ 48 4.5 Weekday PM Peak Hour Intersection Operations Analysis Results 54 4.6 Queue Length analysis (2010) ......................................................... 55 4.7 Crash Analysis Summary (2005-2009) ............................................ 57 4.8 Intersection Crash Type and Severity (2005-2009).......................... 58 4.9 Employment Growth Projections (2004-2035).................................. 59 4.10 Population and Housing Growth Projections (2008-2035)............... 59 4.11 Weekday PM Peak Hour Intersection Operations Analysis Results
(2035) ................................................................................................. 62
4.12 Queue Length Analysis (2035) ......................................................... 63 4.13 Past Transportation Project Funding................................................. 71 4.14 Future Transportation Project Funding.............................................. 72 5.1 Alternative 1 (Extend 3-Lane Cross Section) Operational Analysis
Results (2035) ................................................................................... 76
5.2 Alternative 1 (Extend 3-Lane Cross Section) Queue Length Analysis (2035) .................................................................................
78
5.3 Alternative 2 (Extend 3-Lane Cross Section and Add Signal) Operational Analysis Results (2035) ................................................
79
5.4 Alternative 2 Queue Length Analysis (2035).................................... 82 5.5 Alternative 3 (5-Lane Cross Section Throughout Hubbard)
Operational Analysis Results (2035) ................................................ 84
5.6 Alternative 3 Queue Length Analysis (2035).................................... 86 5.7 Alternative 4 (5-Lane Cross Section Between D and G Street)
Operational Analysis Results (2035)................................................. 87
5.8 Alternative 4 Queue Length Analysis (2035).................................... 89
EXHIBIT "A"

City of Hubbard TSP, 2012 v
5.9 Alternative 5 (4-Lane Cross Section Between A Street and Schmidt Lane) Operational Analysis Results (2035)........................
90
5.10 Alternative 5 Queue Length Analysis (2035).................................... 92 5.11 OR 99E Improvements Planning Level Cost Estimate..................... 93 5.12 Existing Hubbard Street Design Standards...................................... 96 5.13 Existing ODOT Rural Arterial Design Standards.............................. 96 5.14 Revised Street Design Standards..................................................... 98 5.15 Pedestrian Improvements Cost Estimate.......................................... 104 5.16 Bicycle Network Improvements Cost Estimate................................. 105 5.17 Total Planning Level Transportation Improvements Costs.............. 109 5.18 Future Transportation Program Funding........................................... 109 6.1 Preferred Plan Roadway Improvements........................................... 115 6.2 Preferred Plan Pedestrian Improvements......................................... 116 6.3 Preferred Plan Bicycle Improvements............................................... 118 6.4 Preferred Plan Transit Improvements............................................... 119 6.5 Preferred Plan Railroad Improvements............................................. 119 6.6 Planning Level Transportation Improvement Costs (Preferred
Plan).................................................................................................... 120
6.7 Forecast Future Transportation Funding........................................... 120 6.8 Financially Constrained Alternative Roadway Improvements.......... 123 6.9 Financially Constrained Alternative Pedestrian Improvements....... 124 6.10 Financially Constrained Alternative Bicycle Improvements.............. 125 6.11 Financially Constrained Planning Level Transportation
Improvement Costs............................................................................ 125
6.12 Street Design Standards.................................................................... 130 6.13 Hubbard Access Management Standards........................................ 131 7.1 Forecast Future Transportation Funding.......................................... 133 7.2 Total Planning Level Transportation Improvement Costs
(Preferred Plan).................................................................................. 134
7.3 Financially Constrained Planning Level Transportation Improvement Costs............................................................................
134
7.4 Existing and Potential Transportation Funding Sources.................. 135
EXHIBIT "A"

City of Hubbard TSP, 2012 vi
Appendices
(See Appendix Document)
A. Plans, Policies and Standards Review B. Roadway Inventory C. Public Transportation Routes and Schedules D. Traffic Counts E. Methodology Memo F. 2010 Existing Operations and Queuing Analysis Worksheets G. ODOT Crash Data H. Critical Crash Rate Calculations I. 2035 No-Build Operations and Queuing Analysis Worksheets J. 2035 Preliminary Signal Warrants K. Alternative 1 Operations and Queuing Analysis Worksheets L. Alternative 2 Operations and Queuing Analysis Worksheets M. Alternative 3 Operations and Queuing Analysis Worksheets N. Alternative 4 Operations and Queuing Analysis Worksheets O. Alternative 5 Operations and Queuing Analysis Worksheets P. Cost Estimate Worksheets Q. Right-of-Way Needs R. Project Prospectus Sheets S. Existing and Potential Funding Sources Memorandum T. TSP Survey Results U. TSDC Update V. TSP Code Amendments
EXHIBIT "A"

City of Hubbard TSP, 2012 7
EXHIBIT "A"

City of Hubbard TSP, 2012 8
Section 1 Introduction
EXHIBIT "A"
City of Hubbard TSP, 2012 9
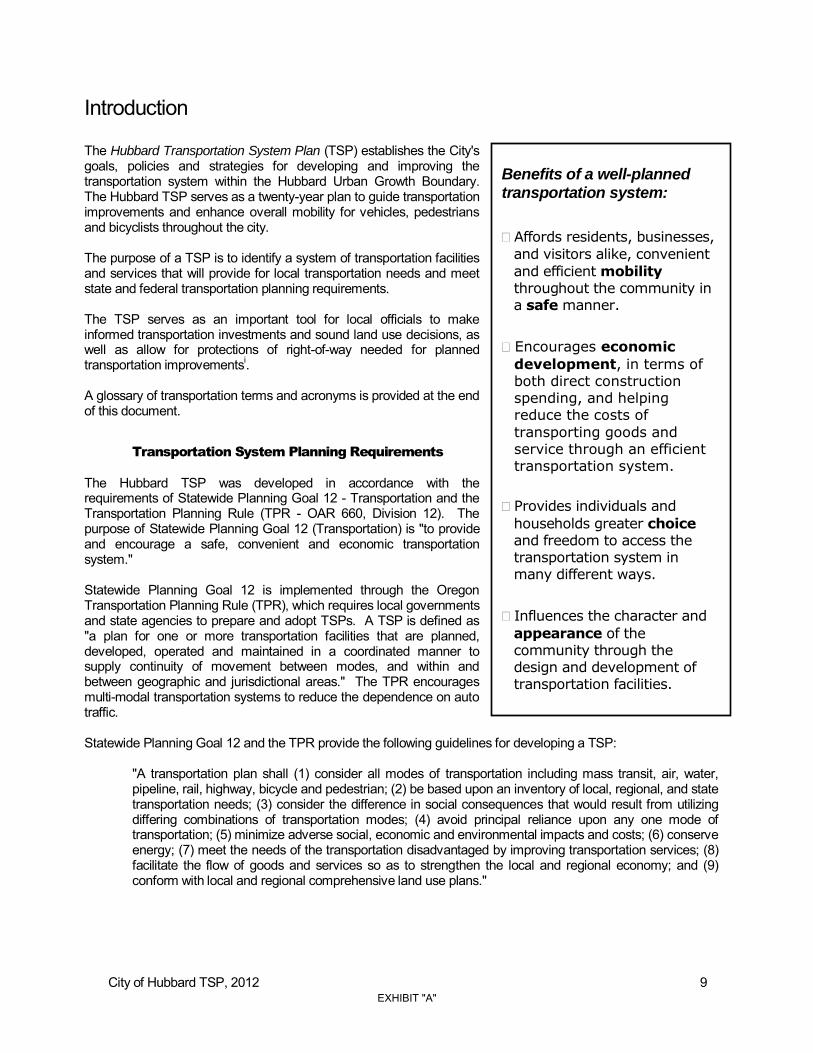
Benefits of a well-planned transportation system:
Affords residents, businesses,
and visitors alike, convenient
and efficient mobility throughout the community in a safe manner.
Encourages economic
development, in terms of both direct construction spending, and helping reduce the costs of
transporting goods and service through an efficient transportation system.
Provides individuals and
households greater choice and freedom to access the transportation system in many different ways.
Influences the character and
appearance of the community through the design and development of transportation facilities.
Introduction
The Hubbard Transportation System Plan (TSP) establishes the City's goals, policies and strategies for developing and improving the transportation system within the Hubbard Urban Growth Boundary. The Hubbard TSP serves as a twenty-year plan to guide transportation improvements and enhance overall mobility for vehicles, pedestrians and bicyclists throughout the city. The purpose of a TSP is to identify a system of transportation facilities and services that will provide for local transportation needs and meet state and federal transportation planning requirements. The TSP serves as an important tool for local officials to make informed transportation investments and sound land use decisions, as well as allow for protections of right-of-way needed for planned transportation improvementsi. A glossary of transportation terms and acronyms is provided at the end of this document.
Transportation System Planning Requirements
The Hubbard TSP was developed in accordance with the requirements of Statewide Planning Goal 12 - Transportation and the Transportation Planning Rule (TPR - OAR 660, Division 12). The purpose of Statewide Planning Goal 12 (Transportation) is "to provide and encourage a safe, convenient and economic transportation system." Statewide Planning Goal 12 is implemented through the Oregon Transportation Planning Rule (TPR), which requires local governments and state agencies to prepare and adopt TSPs. A TSP is defined as "a plan for one or more transportation facilities that are planned, developed, operated and maintained in a coordinated manner to supply continuity of movement between modes, and within and between geographic and jurisdictional areas." The TPR encourages multi-modal transportation systems to reduce the dependence on auto traffic. Statewide Planning Goal 12 and the TPR provide the following guidelines for developing a TSP:
"A transportation plan shall (1) consider all modes of transportation including mass transit, air, water, pipeline, rail, highway, bicycle and pedestrian; (2) be based upon an inventory of local, regional, and state transportation needs; (3) consider the difference in social consequences that would result from utilizing differing combinations of transportation modes; (4) avoid principal reliance upon any one mode of transportation; (5) minimize adverse social, economic and environmental impacts and costs; (6) conserve energy; (7) meet the needs of the transportation disadvantaged by improving transportation services; (8) facilitate the flow of goods and services so as to strengthen the local and regional economy; and (9) conform with local and regional comprehensive land use plans."
EXHIBIT "A"
City of Hubbard TSP, 2012 10
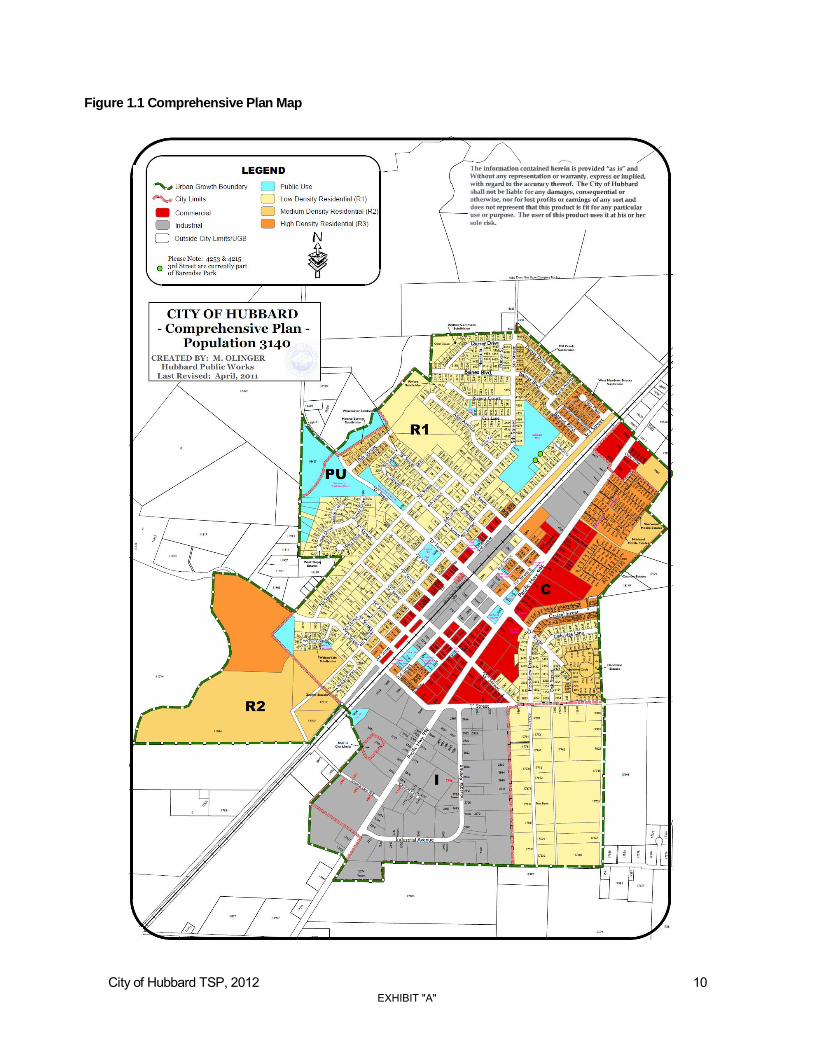
Figure 1.1 Comprehensive Plan Map
EXHIBIT "A"

City of Hubbard TSP, 2012 11
Figure 1.2 Zoning Map
EXHIBIT "A"

City of Hubbard TSP, 2012 12
Development of the Transportation System Plan
Since the TSP was adopted by the City in 1999, Hubbard has experienced significant population and employment growth, which have resulted in a number of changes to the City’s transportation system. The 2012 TSP update was initiated in response to recent population and employment changes, and to ensure the transportation system can adequately meet the City's needs through the year 2035. The 2012 TSP update was also initiated to address key transportation issues identified by the community. Key transportation issues that were identified by the community and addressed as part of the 2012 TSP update include the following:
UGB Expansion Areas – identify needed system improvements to serve these areas that provides for a safe and efficient multi-modal transportation network.
Local Street Network Plan – incorporate work done to date to provide well connected, safe and efficient local street network to serve the entire community as it continues to grow.
Street Functional Classifications and Sections – review all classifications and sections, including street
width and sidewalk requirements, to ensure they match the needs of the community and provide for adequate pedestrian facilities. Work with the ODOT to evaluate transportation improvements needed to preserve and enhance the “through movement” of OR 99E. Also work with ODOT to resolve conflicting street standards (3-lane versus 5-land section) on OR 99E to provide coordinated and consistent street improvements.
Bicycle and Pedestrian elements –identify and provide detailed project descriptions and cost estimates
for an improved system of pedestrian and bicycle routes, including the tie-in to the regional trail system.
Transportation Demand Management – identify Transportation Demand Management measures such as park and ride facilities and rideshare programs to help reduce emissions from single occupancy vehicles.
Rail Crossings – review rail crossing needs with the ODOT Rail Program and update as necessary to
improve safety of the rail crossing areas. Review the feasibility of having a rail crossing at “J” Street.
Capital Improvement Program – update and prioritize list of transportation improvement projects, including cost estimates, to guide future transportation investments. Create an effective finance program for planned improvements, including the update of the TSDC for adoption.
Consistency of TSP Update with other City Documents - Update the applicable sections of the 1999 TSP
and other applicable City documents to provide for safe, efficient and multi-modal transportation network.
Planning Area
The planning area for the Hubbard TSP update is the Hubbard Urban Growth Boundary (UGB). The City of Hubbard is located in the north central part of the Willamette Valley, a broad lowland area lying between the Coast Range and Cascade Mountains in western Oregon. According to the most recent population estimates about 3,180 people reside in the City of Hubbard (PSU, 2011). Hubbard lies less than one (1) mile north of Woodburn, about 20 miles north of Salem, and 28 miles south of Portland. Hubbard is one of the many small towns in the Willamette Valley that sprang up along the railroads built in the late 1860s and 1870s. The first platted streets in Hubbard ran parallel and perpendicular to the railroad. The surrounding diverse and productive agriculture was traditionally the mainstay of the local economy. Due in part to growing urban centers in Salem and Portland, Hubbard’s economy has become more diversified within the last ten to twenty years. The City has a small commercial core in the center of town along Pacific Highway 99E and the railroad and an industrial area in the southeast portion of the city.
EXHIBIT "A"
City of Hubbard TSP, 2012 13
Government entities with roadway jurisdiction within the Hubbard UGB include: the City of Hubbard, Marion County and the Oregon Department of Transportation (ODOT). ODOT has jurisdiction over Pacific Highway 99E, which runs in a northeast-southwest orientation through Hubbard, parallel the Union Pacific Railroad. Maps of the current Comprehensive Plan and zoning designations within the planning area are shown in Figures 1-1 and 1-2.
Planning Process
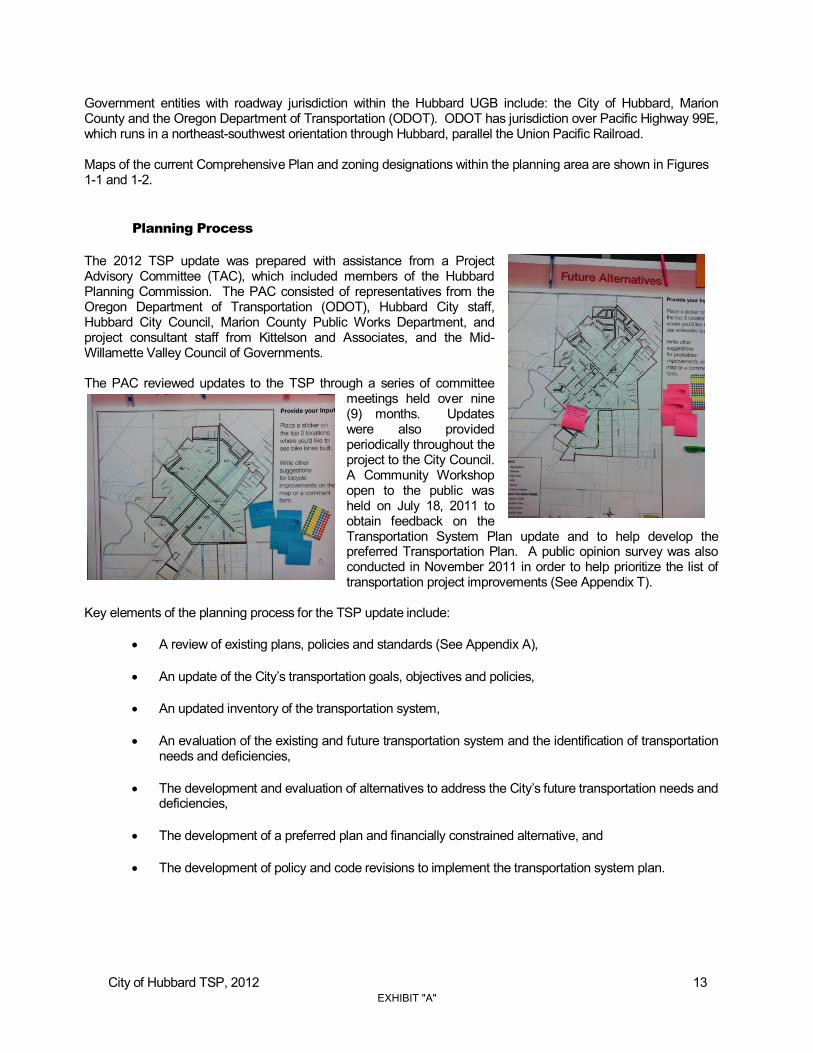
The 2012 TSP update was prepared with assistance from a Project Advisory Committee (TAC), which included members of the Hubbard Planning Commission. The PAC consisted of representatives from the Oregon Department of Transportation (ODOT), Hubbard City staff, Hubbard City Council, Marion County Public Works Department, and project consultant staff from Kittelson and Associates, and the Mid-Willamette Valley Council of Governments. The PAC reviewed updates to the TSP through a series of committee
meetings held over nine (9) months. Updates were also provided periodically throughout the project to the City Council. A Community Workshop open to the public was held on July 18, 2011 to obtain feedback on the Transportation System Plan update and to help develop the preferred Transportation Plan. A public opinion survey was also conducted in November 2011 in order to help prioritize the list of transportation project improvements (See Appendix T).
Key elements of the planning process for the TSP update include:
A review of existing plans, policies and standards (See Appendix A),
An update of the City’s transportation goals, objectives and policies,
An updated inventory of the transportation system,
An evaluation of the existing and future transportation system and the identification of transportation needs and deficiencies,
The development and evaluation of alternatives to address the City’s future transportation needs and deficiencies,
The development of a preferred plan and financially constrained alternative, and
The development of policy and code revisions to implement the transportation system plan.
EXHIBIT "A"

City of Hubbard TSP, 2012 14
Section 2 Transportation Goals
and Policies
EXHIBIT "A"

City of Hubbard TSP, 2012 15
TRANSPORTATION GOALS AND POLICIES
The Transportation Goals and Policies section of the City of Hubbard Transportation System Plan (TSP) provide the overall guidance for the future development of the transportation system. The following goals and policies were developed based upon a review and update of the 1999 City of Hubbard Transportation System Plan. The City’s transportation goals and policies address key transportation issues identified by the community and requirements of the Transportation Planning Rule (TPR). The following transportation goals and policies were also used during the TSP planning process to evaluate the transportation alternatives, select a recommended alternative and prioritize future transportation improvements. Goals and policies were developed for each of the major transportation modes found in Hubbard: 1) Street Network, 2) Rail, 3) Bicycle, 4) Pedestrian, and 5) Public Transit.
STREET NETWORK
Goals:
1) To encourage safe, efficient, convenient, and economic modes of travel that reduces reliance upon one form of transportation, minimizes energy consumption and air quality impacts.
2) To develop a safe and efficient street system which will handle the projected needs of the community and provide connections to the region.
Policies:
1) Support efforts to plan for and construct additional I-5 interchange improvements in the north Marion County region.
2) The designated existing and future major and minor arterials, and collector streets in the
Street Network Plan of the Hubbard Transportation System Plan will be used to prioritize street maintenance and guide the location and design of new streets.
3) Protect the function of the existing and planned roadways by application of appropriate
setbacks, land use regulations, exactions, and voluntary dedication.
4) All development proposals, plan amendments, or zone changes will conform with the Hubbard Transportation System Plan.
5) Consider impacts on existing or planned transportation facilities in all land use decisions.
6) Work with the Oregon Department of Transportation and property owners to maximize
safe access to Pacific Hwy. 99E.
7) Coordinate with the Oregon Department of Transportation and Marion County Public Works to implement the improvements listed in the Hubbard Transportation System Plan.
8) Continue to update the Capital Improvement Program to identify, prioritize, and
construct transportation projects. All sources of funding shall be considered.
9) Consider the future street network and the land priority system for expanding an urban growth boundary (UGB) found in Oregon Revised Statutes 197.298, when evaluating
EXHIBIT "A"

City of Hubbard TSP, 2012 16
the need to expand the UGB and the location of the expansion. Construction of the east perimeter road to improve circulation and connectivity in east Hubbard will require an expansion of the UGB in that area.
10) Support efforts to plan for and improve safety along the Pacific Hwy. 99E corridor.
11) Use information in the Transportation System Plan and other sources to evaluate the
existing System Development Charge for transportation and other sources of local, state, and federal funding.
12) Land uses authorized under Comprehensive Plan Map and Zoning Map amendments
must be consistent with the identified function, capacity, and level of service of transportation facilities.
13) Coordinate with the Oregon Department of Transportation regarding transportation
improvement projects on Pacific Highway 99E that may potentially reduce vehicle-carrying capacity of the highway to ensure compliance with Oregon Revised Statutes 366.215.
RAIL TRANSPORTATION
Goal: To minimize the rail system’s negative impacts on other components of the
transportation system, adjacent land uses, and quality of life in Hubbard. Policies:
1) Locate protected railroad crossings in a manner that maximizes efficient connection to the intra-county road network, timely response to emergencies, and efficient circulation and connectivity of the local street network.
2) Retain existing railroad crossings in Hubbard and ensure that safety measures offer the
highest level of protection.
3) Work with the railroad to develop screens that minimize the visual and sound impacts of rail traffic.
4) Support efforts to work with ODOT, the railroads, and emergency response providers to
minimize the risk of freight and passenger rail crashes and prepare for response to crashes where hazardous materials are released or large number of injuries occur.
5) Continue to zone land adjacent to the railroad for industrial or commercial use and
minimize the amount of land adjacent to the railroad zoned for residential use. 6) Work with the railroad and Oregon Department of Transportation to install pedestrian
facilities on both sides of the street across existing railroad crossings.
7) Consider conducting a study to determine the feasibility of constructing a grade-separated rail crossing in the vicinity of Schmidt Lane.
Goal: To positively encourage a land use pattern which will maximize the use of rail-
based systems or preserve the future opportunity to use rail-based systems. Policies:
1) Zone land along the railroad for more compatible lands uses, such as industrial or
EXHIBIT "A"

City of Hubbard TSP, 2012 17
commercial.
2) Notify ODOT Rail regarding development proposals located within 500 feet of a railroad track.
Goal: Support intercity travel via high speed rail while minimizing impacts to the city.
Policies:
1) Support public transportation systems that serve as feeder services connecting to high speed rail stops.
2) Support Woodburn’s efforts to locate a high speed rail stop in Woodburn or north Marion
County.
3) Work with ODOT to ensure that alternative routes located outside the city are evaluated in the high speed rail planning process.
BICYCLE TRANSPORTATION
Goal: To provide safe, accessible, and convenient bicycling facilities.
Policies:
1) Develop a bikeway system which will provide routes and facilities to allow bicyclists to travel to and from residential areas to schools, parks, places of employment, and commercial areas.
a) Action: Coordinate with ODOT to develop bike lanes along Pacific Hwy. 99E.
b) Action: Coordinate with Marion County and private landowners to develop
bikeway routes to the North Marion Schools.
c) Action: Coordinate with Woodburn and private landowners to develop bikeways in the greenway along Mill Creek if the opportunity arises.
2) All new arterials and collectors shall include the bikeway facility specified in the street
design standard.
3) All major improvements to arterial and collector streets shall include the bikeway facility specified in the street design standard.
4) When traffic volume on existing collector streets (speeds <25mph) exceeds 3,000 ADT
consider changing the bikeway type from shared roadway to bike lanes.
PEDESTRIAN TRANSPORTATION Goal: To provide safe, accessible, and convenient pedestrian facilities.
Policies:
EXHIBIT "A"
City of Hubbard TSP, 2012 18
1) All new arterial, collector, and local streets shall include the pedestrian facility specified in the street design standard.
2) All major improvements to arterial, collector, and local streets shall include the
pedestrian facility specified in the street design standard.
3) Low curb crosswalks shall be used at all intersections, consistent with ADA guidelines, to facilitate use by all pedestrians.
4) Provide safe, convenient, and attractive walking environments throughout the city with a
special emphasis in the Commercial Center.
5) As feasible, the city shall allow no physical obstruction of sidewalks such as utility poles, sign posts or guy wires (consistent with ADA guidelines).
6) Visibility and unobstructed views shall be promoted for all areas of high pedestrian use.
7) Bicycle traffic on sidewalks shall be prohibited.
8) The city will work with interested landowners to explore local funding options for
sidewalk improvements, for example Local Improvement Districts.
9) The city supports the development of a well-developed sidewalk system with street trees to link the community to downtown, local parks and the Mill Creek trail system as recommended in the 2003 Hubbard Downtown Development Resource Team Report.
PUBLIC TRANSPORTATION
Goals:
1) The City of Hubbard will seek for all its citizens the maximum level of access to
all social, work and welfare resources. 2) The City of Hubbard will seek for all its citizens the creation of a customer-based
regionally coordinated public transit system that is efficient, effective, and founded on present and future needs.
Policies:
1) The city will support and promote regional planning for public transportation services
that use innovative technology to maximize efficiency of operation, planning, and administration of public transportation.
2) The city seeks the creation of customer-based regionally coordinated public transit
system through a regional planning process that is efficient, effective, and adequate for present and future needs. The system should provide the maximum level of access to area community centers.
3) The city encourages the use of carpools and park-and-ride lots in the area and other
strategies to reduce the number of single occupant vehicle trips.
4) The city shall support existing public transportation services by improving facilities and promoting public awareness of the services.
EXHIBIT "A"

City of Hubbard TSP, 2012 19
5) The city will coordinate with other jurisdictions when the need for park-and-ride facilities or intercity connections to passenger rail services are studied.
6) The city shall coordinate with governmental and private agencies in the planning and
provision of public transportation services and shall ensure that a given level of service is adequate for the costs incurred.
Action: Periodically assess the community’s transportation needs and check with existing services regarding expansion of service into Hubbard, for example Canby Area Transit, Woodburn Transit or SMART in Wilsonville.
EXHIBIT "A"

City of Hubbard TSP, 2012 20
Section 3 Transportation
System Inventory
EXHIBIT "A"
City of Hubbard TSP, 2012 21
Transportation System Inventory
Transportation is one of the most important aspects of the economic viability and livability for a city. A city’s transportation system is the foundation on which these opportunities are built. In order to better understand constraints, challenges and opportunities associated with the existing transportation system, a comprehensive inventory of the transportation system is needed.
The following section includes an update to the transportation inventory found in the 1999 Hubbard TSP. The updated inventory addresses all modes of the transportation system including: street, pedestrian, bikeway, public transportation, rail, air, water and pipeline systems. A description of each transportation system is provided as follows. STREET SYSTEM
Local Road Network The first platted streets in the City of Hubbard were oriented to run parallel and perpendicular to the railroad (known as Union Pacific RR today) as part of the original town site that was platted in 1878. The original town plat included a series of blocks and streets laid out in a grid iron pattern around the railroad and west of Pacific Highway 99E. Block lengths were typically 200-220 feet and mid-block alleys were common. The major highway that connects the City of Hubbard to surrounding communities is Pacific Highway 99E. The highway runs parallel to the railroad in a northeast-southwest orientation. Nearby communities also located along the Pacific Highway 99E Corridor include the City of Woodburn (0.8 miles south of Hubbard) and the City of Aurora (3 miles north of Hubbard). The closest accesses to Interstate 5 are in Woodburn (4 miles distance) and west of Aurora (7 miles distance). The railroad and Pacific Highway 99E cut the city into three sections and limit east-west travel through the community relative to north-south travel. The city is bounded by Mill Creek to the west, which also runs parallel to the railroad. The City completed a Local Wetland Inventory in 2001, which identifies the presence of wetlands in the vicinity of Mill Creek. Areas located adjacent to Mill Creek are also located within the floodplain as identified on the Federal Emergency Management Agency (FEMA) flood insurance rate maps (FIRMS). Since 1999, expansions to the city street network have primarily been the result of residential subdivision development located in the northwest section of Hubbard west of 3rd Street and north of A Street. In 2009, the City of Hubbard expanded its UGB to include additional land for commercial and industrial use in the southwest portion of the city, along Pacific Highway 99E and Schmidt Lane. In 2010, the City completed a second UGB expansion for residential use that included lands located south of Whiskey Hill Road and west of Painter Loop Road, in addition to land located south of Broadacres Road and northwest of Front Street. A small sliver of land was also brought into the UGB for public use along the section of Mill Creek located near the historic Mineral Springs site on Mineral Springs Road. Major transportation destinations within the city include commercial services located along Pacific Highway 99E and the historic commercial core located adjacent the railroad area (2nd and 3rd streets). Additional sites include the Hubbard Industrial Park located in south of J Street and east of Pacific Highway 99E (Industrial Avenue), Rivenes Park (“D” and 4
th streets) and Barendse Park (between 3rd and 5th streets). A majority of city streets serve as local access streets for residential areas.
EXHIBIT "A"
City of Hubbard TSP, 2012 22
Inventory
In 1999, an inventory of the existing city street, sidewalk and bikeway conditions was completed for the Hubbard Transportation System Plan (TSP). As part of the 2012 TSP update, this inventory was updated to include street and sidewalk improvements completed since 1999, in addition to information on roads located in areas included in areas recently included in the city’s urban growth boundary (UGB). Conditions described in the inventory include:
• street classification and jurisdiction • street width and right-of-way • number of travel lanes • presence of on-street parking, sidewalks, or bikeways • speed limit; and • general pavement conditions
A copy of the complete street system inventory may be found in Appendix B. A map of the existing road network may be found in Figure 3.1 (below). Street length ranged from 170 to 6,730 feet and Pacific Highway 99E is the longest continuous street inside the UGB. Third Street is the longest street entirely under the city’s jurisdiction. Speed limit on all streets in Hubbard is 25 miles per hour, except for Pacific Highway 99E where the speed limit is 35-40 mph and a segment of Mineral Springs Road with a speed limit of 55 mph. The average right-of-way (ROW) width is 60 feet, while ROW along Pacific Highway 99E average 80 feet, and ROW along D Street, between Highway 99E and 7th Street is 90 feet. Mineral Springs Road (D Street) west of city limits has a 40 foot ROW width, and 1st Street has ROW widths between 20-30 feet (south end to D Street). Pavement widths on city streets range from 18 feet to 58 feet. Widest pavement widths are associated with Pacific Highway 99E and the narrowest widths are located on A Street. Most city streets have two lanes except Pacific Highway 99E which has a center turning lane from the south UGB to the signalized intersection with D Street. The Highway narrows to two lanes north of D Street. The inventory identified certain segments of fair and poor pavement conditions in need of repair. Arterial and collector streets with fair pavement conditions include:
Pacific Highway 99E south of D Street, J Street west of 4th Street, 2nd Street, between A and J streets, 5th Street between F and I streets, and 7th Street, between G and 7th Streets.
Additional street segments in poor pavement condition were identified; however, most poor pavement conditions are located in small segments on streets otherwise in fair to good condition. Hubbard has one traffic signal with left turn arrows at the intersection of Highway 99E and D Street. Flashing yellow caution lights are located at the intersection of Highway 99E and G Street and the intersection of Highway 99E and J Street. The signal and caution lights are under the jurisdiction of ODOT. Most intersections in Hubbard do not have separate turning lanes, except for the intersection of Highway 99E and D and J Streets. Pacific Highway 99E has a center left-turn lane at both intersections. D Street had a left turn lane for traffic approaching Pacific Highway 99E from the east.
EXHIBIT "A"

D ST
3RD ST
5TH STG ST
HIGHW
AY 99
E HY
4TH ST
J ST
A ST
E ST7TH ST
1ST ST
C ST
2ND ST
NE FRONT S
T
BAINES BV
I STNE J ST
NE DUNN RD
NE PA
INTE
R LPNE PUBLIC RD
INDU
STRI
AL AV
ALLAN AV
F ST
H ST
DORSEY DRNE BOONES FE
RRY RD
NE BROADACRES RD
NE WHISKEY HILL RD
10TH ST
ASH STELM ST
OAK
ST
NE M
INER
AL S
PRIN
GS R
D
SUNSET DR
6TH ST
KARI LN
RIVIERA CT
CASTEEL ST
NE 4TH ST
NE SCHMIDT LN
B ST
HOOD
VIEW
DR
OAK RIDGE LN
NINA PL
WEST PL
9TH ST
KURTH AV
WALN
UT CT
MILL ST
BEAVER CT
MAPLE ST
PARKWAY BV
PACIFIC CR
RAINBOW LP
BASILIO DR
NE LA
NDUR
A CT
NE CEDAR DR
J ST
B ST
C ST
B ST
9TH ST
Existing Roadway Network &
Functional Class 3.1Figure
NH:
\projf
ile\11
454 -
City
of H
ubba
rd TS
P Upd
ate\gi
s\mxd
s\Fig_
base
_8x1
1.mxd
Hubbard TSP Update June 2011
Functional ClassMajor ArterialMinor ArterialCollectorLocal RoadPrivate Road
RailroadHubbardTaxlotsCity LimitsUrban Growth Boundary
EXHIBIT "A"

City of Hubbard TSP, 2012 24
State Highway – Pacific Highway 99E
The City of Hubbard is served by one state highway, Pacific Highway 99E. This highway serves as the major route through town with significant commercial and industrial development focused along it. In general, Pacific Highway 99E has a three (3) lane roadway section south of D Street and a two (2) lane roadway section north of D Street with a 35 mph speed limit. The roadway has intermittent curbs and sidewalks that are primarily built as a result of recent commercial and industrial development along the Highway over the past ten years. The pavement condition for Pacific Highway 99E is generally in fair to good condition with 11-foot travel lanes and 3 to 8-foot shoulders based on the existing street system inventory found in Appendix B. There is one stop light on Pacific Highway 99E in Hubbard that is located at the D Street Intersection. The adopted 1999 Oregon Highway Plan (OHP) classifies the state highway system into five categories: Interstate Highways, Statewide Highways, Regional Highways, District Highways, and Local Interest Roads. In addition to the highway classifications, there are four special purpose designations. These special designations include special land use, freight route, Scenic Byway, and lifeline route designations. Pacific Highway 99E in Hubbard is identified as a regional highway. According to the 1999 OHP, the primary function of a regional highway is to “provide connections and links to regional centers, Statewide or Interstate Highways, or economic or activity centers of regional significance. The management objective is to provide safe and efficient, high-speed, continuous-flow operation in rural areas and moderate to high-speed operations in urban and urbanizing areas. A secondary function is to serve land uses in the vicinity of these highways. Pacific Highway 99E is designated as a statewide freight route and subject to state statutes that prohibit the permanent reduction of vehicle-carrying capacity on identified freight routes. Specific exceptions to this prohibition are allowed by statute. Transportation improvement projects that may potentially reduce vehicle-carrying capacity of the highway require further evaluation of the project design at the time of implementation to ensure compliance with Oregon Revised Statutes (ORS 366.215).
The 1999 OHP defines a performance measure for Pacific Highway 99E as a volume to capacity (v/c) ratio equal to or less than 0.85 for areas with a posted speed limit greater than or equal to 35 miles per hour (mph) and 0.80 for areas with a posted speed limit greater than 35 mph. This performance measure establishes the minimum standard of acceptable operation. A v/c ratio of 0.85 means that 85 percent of the capacity of the roadway is utilized based on an established planning level capacity and measured traffic volume.
Road Classification System
Identification of the roadway functions is the basis for planning roadway improvements and the appropriate standards (right-of-way, roadway width, design speed) that apply to each roadway facility. The purpose of classifying streets within the TSP study area is to create a balanced system that facilitates mobility for vehicles, transit, pedestrians, and cyclists, while providing access to land uses. The functional classification defines a street’s role and context in the overall transportation system and how it is used within the community. Street functional classification identifies the street’s intended purpose, the amount and character of traffic, the degree to which non-auto traffic is emphasized, and the design standards. Basic to the process of classifying streets by function and purpose, is the recognition that individual roads and streets do not serve travel independently. Rather, most travel involves movement through a hierarchical network of roads. Access tends to increase as volumes and speeds decrease, as seen in Figure 3.2 below.
EXHIBIT "A"

City of Hubbard TSP, 2012 25
Figure 3.2. Street functional classifications
Arterial
Through traffic Movement
Access to property
The functional classification designations derive from guidance in the Transportation System Planning Guidelines (2008) and comply with policies within the adopted Transportation Planning Rule (TPR), Oregon Administrative Rules (OAR) 660 Division 12 (updated 2006).
The following definitions serve as a general guide in determining city street classifications:
• Arterials – Intra- and inter-community roadways connecting community centers with major facilities. In general, arterials serve both through traffic and local traffic. Access should be partially controlled with infrequent access to abutting properties.
Major arterials should serve the major portion of trips entering and leaving the urban area, the majority of through trips, and should carry a high proportion of total urban area travel with the least mileage. On-street bicycle lanes and sidewalks should be provided. Because of the nature of the travel served by the major arterial system, access is controlled to emphasize traffic flow. Major arterials often serve intraurban and interurban bus routes. The primary function of minor arterials is to connect major activity centers and neighborhoods within the UGB and to support the major arterial system. Minor arterials serve local traffic as it enters and leaves the urban area, connecting the City of Hubbard to other urban areas and regions. Minor arterials should have a higher degree of access, and lesser traffic volumes than major arterials. Like major arterials, emphasis should be on traffic flow and pedestrian and bicycle movements. Minor arterials may carry local bus routes.
• Collectors - Streets connecting residential neighborhoods with smaller community centers and
facilities as well as access to the arterial system. Property access is generally a higher priority for collector arterials; through-traffic movements are served as a lower priority.
• Local Access Streets - Streets within residential neighborhoods connecting housing (also can be
commercial, industrial, etc.) with the arterial system. Property access is the main priority; through traffic movement is not encouraged.
Based on the 1999 Hubbard Transportation System Plan (TSP), Hubbard has one major arterial – Pacific Highway 99E and the following minor arterials:
• 3rd Street, • J Street (G Street to railroad), and • D Street (Pacific Highway to 10th Street).
Collector
Local
EXHIBIT "A"

City of Hubbard TSP, 2012 26
The following collector streets exist within Hubbard:
• D Street from Oak Ridge to Pacific Highway 99E, • 2nd Street, • 5th Street, • 7th Street, • A Street, • Baines Boulevard, • Schmidt Lane from west end to Pacific Highway 99E, • G Street from J Street to 2nd Street, and • 10th Street.
Figure 3.1 above shows a map of the existing City of Hubbard road network and the functional classification system for public streets located within the Hubbard Urban Growth Boundary (UGB). Based upon a review of the updated roadway inventory found in Appendix B, arterials and collectors comprise almost half of the existing road network (35,731 linear feet). Table 3.1 summarizes how existing streets are allocated among existing functional classes.
Table 3.1. Existing Road Network: Allocation by Functional Classification.
Functional Classification
Linear Feet Percent of Network
Arterial 16,499 22%
Collector 19,231 27%
Local 36,111 51%
Total 70,312 100%
(13.3 miles)
Functional classification is typically associated with design and mobility standards, access management and other policies. Hubbard currently has no mobility standards based on functional classification for city streets. A review of existing design and access management standards may be found in the review of existing plans, policies and standards found in Appendix A.
State and County Functional Classification Systems
The state designation of functional classification is different than the City’s designations primarily due to the difference between state and local travel function. The ODOT functional classification map shows Pacific Highway 99E as a minor arterial. The Marion County functional classification identifies the following county roadway designations in the unincorporated area of the Hubbard UGB:
• J Street – Urban Major Collector, • J Street (Industrial Avenue to railroad), and • D Street (Pacific Highway to 10th Street).
Other Road Facilities
A review of other existing road facilities including bridges, culverts, railroad crossings, and truck routes is summarized below.
EXHIBIT "A"

City of Hubbard TSP, 2012 27
Bridges: Currently there are no bridges located inside the Hubbard UGB. Culverts: There are approximately six (6) culverts located in the Hubbard area: Highway 99E
crossing of Little Bear Creek, Industrial Avenue crossing of Little Bear Creek, Railroad crossing of Little Bear Creek, 3rd Street crossing of Little Bear Creek, J Street/Broadacres Road crossing of Little Bear Creek, and D Street (Mineral Springs Road) crossing of Mill Creek. Ownership is mixed between the city, ODOT and Marion County.
Railroad Crossings: Hubbard has three, fully-protected at grade railroad crossings located on A, D and G streets.
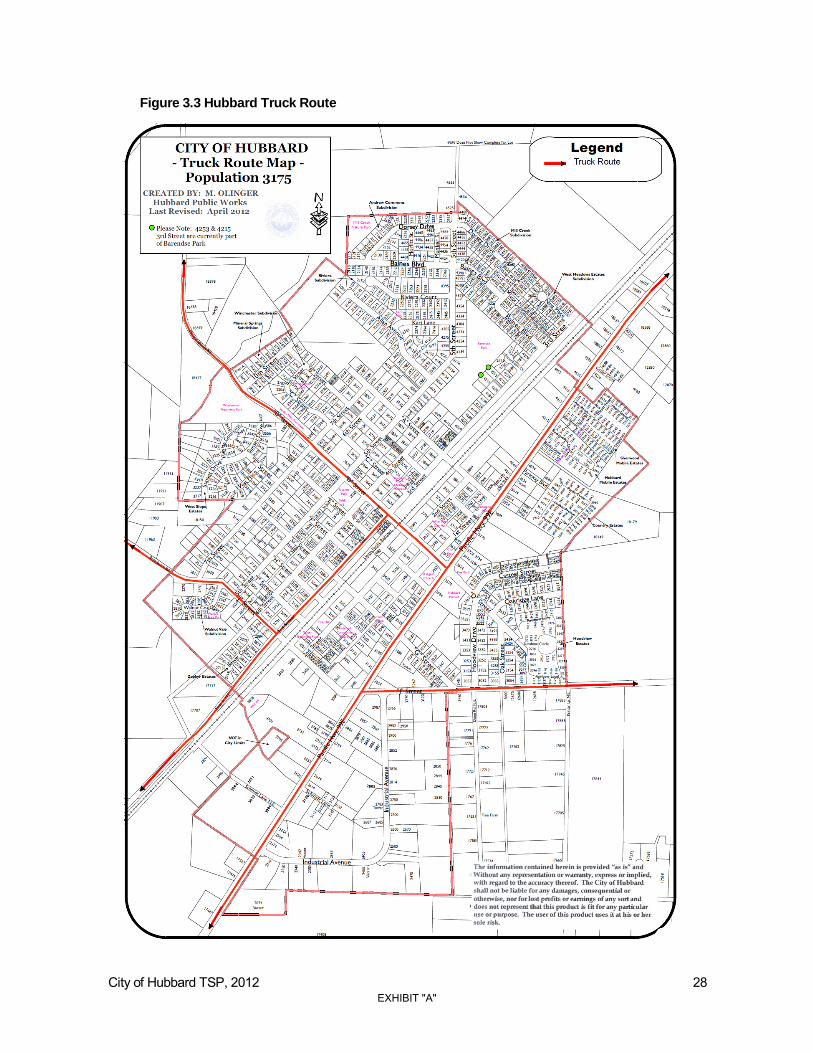
Truck Routes: As part of the 1999 TSP, the City designated a truck and hazardous materials route
to improve safety and capacity. The alignment utilizes the major and minor arterials and is located on all of Pacific Highway 99E, 3rd (Front) Street between the southern UGB and D Street, Broadacres Road/J Street between the west UGB and Front Street, Whiskey Hill Road/J Street between the east UGB and Pacific Highway 99E; and D Street/Mineral Springs Road between Pacific Highway 99E and the west UGB (see Figure 3.3).
The 1999 TSP indicate that if and when the J Street at-grade crossing of the railroad is opened, the segment of J Street between Pacific Highway 99E and Front Street would be added to the truck route. The 1999 TSP also recommended evaluating the adequacy of the existing roads beds for truck traffic and the turning geometry and turning land needs of intersection, in addition to implementing need roadway improvements and parking restrictions.
EXHIBIT "A"
City of Hubbard TSP, 2012 28
Figure 3.3 Hubbard Truck Route
EXHIBIT "A"

City of Hubbard TSP, 2012 29
PEDESTRIAN SYSTEM
The relatively small size of Hubbard indicates that walking can be employed regularly for short trips to reach a variety of destinations. Typically, a short trip taken by a pedestrian is about one-half mile. Encouraging pedestrian activities can not only decrease the use of the personal automobile but can also provide benefits for retail businesses. Where people find it safe, convenient, and pleasant to walk, they may linger and take notice of shops overlooked before.
Oregon Transportation Planning Rule requirements
Under Oregon Administrative Rules (OAR) 660-012-0020(2)(d), a TSP must include a pedestrian plan for a network of pedestrian routes throughout the planning area. The network and list of facility improvements shall be consistent with the requirements of Oregon Revised Statutes (ORS) 366.514. In order to implement the TSP, and provide for safe and convenient pedestrian circulation, local governments must adopt land use and subdivision regulations that require:
On-site facilities to accommodate safe and convenient pedestrian access from within new
development and to adjacent residential areas and transit stops, and to neighborhood activity centers (planned or existing schools, parks, shopping centers, transit stops or employment centers) within one-half mile of development.
Single family residential development to generally include streets and accessways. Pedestrian circulation through parking lots in the form of accessways. Sidewalks required along arterials, collectors and most local streets in urban areas, but not
controlled access roadways, such as freeways. Facilities accommodating convenient pedestrian travel, where off-site road improvements are
required as a condition of development approval. Internal pedestrian circulation within new office parks and commercial developments by clustering
of buildings, construction of accessways, walkways and similar techniques (OAR 660-012-0045(3)(e)).
A safe and convenient facility or improvement is reasonably free from hazards, particularly auto traffic, which would interfere with or discourage pedestrian travel for short trips; provide reasonably direct routes of travel between destinations; and meet the travel needs by considering the destination and an optimum trip length of one-quarter to one-half mile for pedestrians (OAR 660-012-0045(3)(d)). In addition, the 1992 Americans with Disabilities Act (ADA) requires both the public and private sector to provide access for all individuals, and sets minimum standards for walkways and road crossings.
Existing Pedestrian Facilities
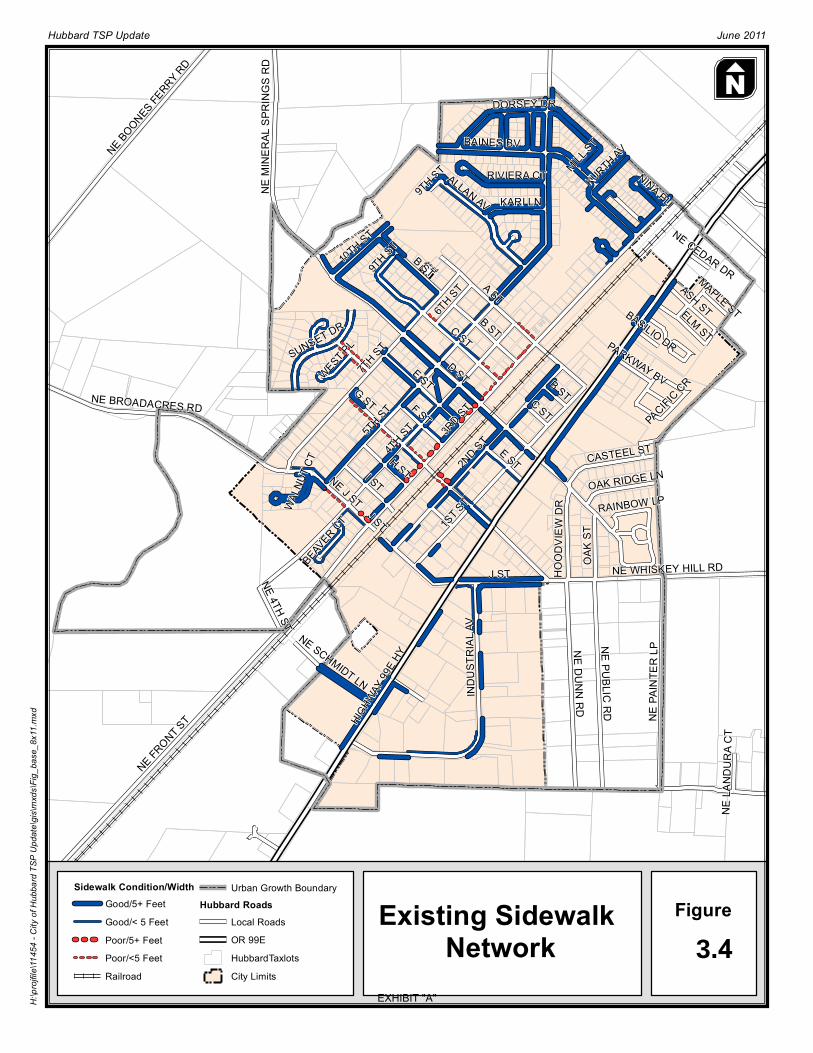
The street inventory originally completed in 1999 and updated during the 2012 TSP update includes an inventory of existing sidewalk facilities (See Appendix B). The sidewalk inventory includes information about sidewalk location, width and condition. See Figure 3.4, Existing Sidewalks in Hubbard. The inventory shows that sidewalks along both sides of local, collector and arterial streets inside the Hubbard UGB amount to about 26 miles (137,280 feet). Hubbard currently has 69,286 feet of sidewalks or 50 percent of the total requirement. The 2012 inventory of existing sidewalks represents an approximately 17 percent increase in sidewalk improvements since the last TSP inventory was completed in 1999. Arterial and collector streets lack a continuous network of sidewalks, but 3rd Street is the exception with a continuous length of sidewalk on the west side between A and J streets. The collector street with the most sidewalks is 5th Street. In general, the sidewalks are less than five (5) feet wide and tend to be in fair to bad condition. Recent residential developments in northwest Hubbard have sidewalks. Sidewalks are the most common in the central part of the city bounded by 3rd, 5th, C and H streets. Sidewalk widths of less than 5 feet or poor condition sidewalks are considered deficient.
EXHIBIT "A"

City of Hubbard TSP, 2012 30
Pacific Highway 99E has intermittent sidewalks that were primarily built as a result of recent commercial and industrial development along the Highway over the past ten (10) years. In 2010, the city received a grant from the Oregon Department of Transportation (ODOT) to install sidewalks on the east side of the highway from D Street to the city limits. Upon completion, this project will provide a continuous sidewalk network on one side of the highway north of D Street. Marked crosswalks are located at the following intersections:
3rd and I Street, west side; 3rd and H Street, west side; 3rd and G Street, north and south sides; 3rd and F Street, west side; 3rd and E Street, west side; F and West Street, west side; F and 7th Street, west side; G and 2nd Street, north and south sides; G and 1st Street, east and west sides; 4th and D Street; 4th and E Street; 5th and D Street; 5th and E Street; 5th and A Street; 5th and Barendse; and 5th and Allan Avenue.
The intersection of Pacific Highway 99E and D Street has a traffic signal and painted crosswalk. A flashing caution light is located at the intersection of Pacific Highway 99E and G Street, but lacks a painted crosswalk.
EXHIBIT "A"
D ST
3RD ST
5TH STG ST
HIGHW
AY 99
E HY
4TH ST
J ST
A ST
7TH ST
1ST ST
C ST
2ND ST
NE FRONT S
T
E ST
BAINES BV
I STNE J ST
NE DUNN RD
NE PA
INTE
R LPNE PUBLIC RD
INDU
STRI
AL AV
ALLAN AV
F ST
H ST
DORSEY DRNE BOONES FE
RRY RD
NE BROADACRES RD
NE WHISKEY HILL RD
10TH ST
ASH STELM ST
OAK
ST
NE M
INER
AL S
PRIN
GS R
D
SUNSET DR
6TH ST
KARI LN
RIVIERA CT
CASTEEL ST
NE 4TH ST
NE SCHMIDT LN
B ST
HOOD
VIEW
DR
OAK RIDGE LN
NINA PL
WEST PL
9TH ST
KURTH AV
WALN
UT CT
MILL ST
BEAVER CT
MAPLE ST
PARKWAY BV
PACIFIC CR
RAINBOW LP
BASILIO DR
NE LA
NDUR
A CT
NE CEDAR DR
J ST
B ST
C ST
E ST
B ST
9TH ST
Existing Sidewalk Network 3.4
Figure
NH:
\projf
ile\11
454 -
City
of H
ubba
rd TS
P Upd
ate\gi
s\mxd
s\Fig_
base
_8x1
1.mxd
Hubbard TSP Update June 2011
Sidewalk Condition/WidthGood/5+ FeetGood/< 5 FeetPoor/5+ FeetPoor/<5 FeetRailroad
Urban Growth BoundaryHubbard Roads
Local RoadsOR 99EHubbardTaxlotsCity Limits
EXHIBIT "A"

City of Hubbard TSP, 2012 32
BICYCLE SYSTEM
The following section includes an overview of state requirements for bicycle planning, in addition to a review of bikeway types, standards, and policies; and a description of existing bicycle facilities within the Hubbard UGB.
Oregon Transportation Planning Rule Requirements
Under OAR 660-012-0020(2)(d), a TSP must include a bicycle plan for a network of bicycle routes throughout the planning area. The network and list of facility improvements shall be consistent with the requirements of ORS 366.514. In order to implement the TSP and provide safe and convenient bicycle circulation, local governments must adopt land use and subdivision regulations that require:
Bicycle parking facilities as part of new residential development of four (4) units or more, new retail,
office, and institutional developments, all transit transfer stations, and park and ride lots. On-site facilities to accommodate safe and convenient bicycle access from within new
development to adjacent residential areas and transit stops and to neighborhood activity centers planned or existing schools, parks, shopping centers, transit stops or employment centers) within one-half mile of development.
Single family residential development shall generally include streets and accessways. Bikeways located along arterials and major collectors. Off-site road improvements, when required as a condition of development approval to include
facilities accommodating convenient bicycle travel.
A safe and convenient facility or improvement is reasonably free from hazards, particularly auto traffic, which would interfere with or discourage bicycle travel for short trips; provide reasonably direct routes of travel between destinations; and meet the travel needs by considering the destination and an optimum trip length (OAR 660-012-0045(3)(d)).
Types of Bicycle Facilities, Standards and Policies
There are a variety of bicycle facilities that are appropriate for different situations depending on traffic volumes, speeds, and whether they are located in urban or rural settings. ODOT categorizes bicycle facilities into the following four major classifications:
Shared Roadway - Bicycles and vehicles share the same roadway area under this classification.
The shared roadway facility is best used where there is minimal vehicle traffic to conflict with bicycle traffic. Shared roadway facilities are suitable in urban areas on streets with speeds less than 25 mph and low traffic volumes (less than 3,000 ADT).
Shoulder Bikeways - This bicycle facility consists of roadways with paved shoulders to
accommodate bicycle traffic. Road shoulders should be paved and four (4) to six (6) feet wide, depending on traffic volume.
Bike Lanes - Separate lane adjacent the vehicle travel lane for the exclusive use of bicyclists are
considered bike lanes. Lane is four (4) to six (6) feet wide depending on the edge type, and parking. This type of facility is appropriate for use along urban arterials and major collectors where speeds are greater than 25 mph and traffic volumes exceed 3,000 ADT.
Bike Paths - These bicycle facilities are exclusive bicycle lanes separated from the roadway. The
typical width for this type of facility is ten (10) to twelve (12) feet wide.
EXHIBIT "A"

City of Hubbard TSP, 2012 33
Existing Bicycle Facilities
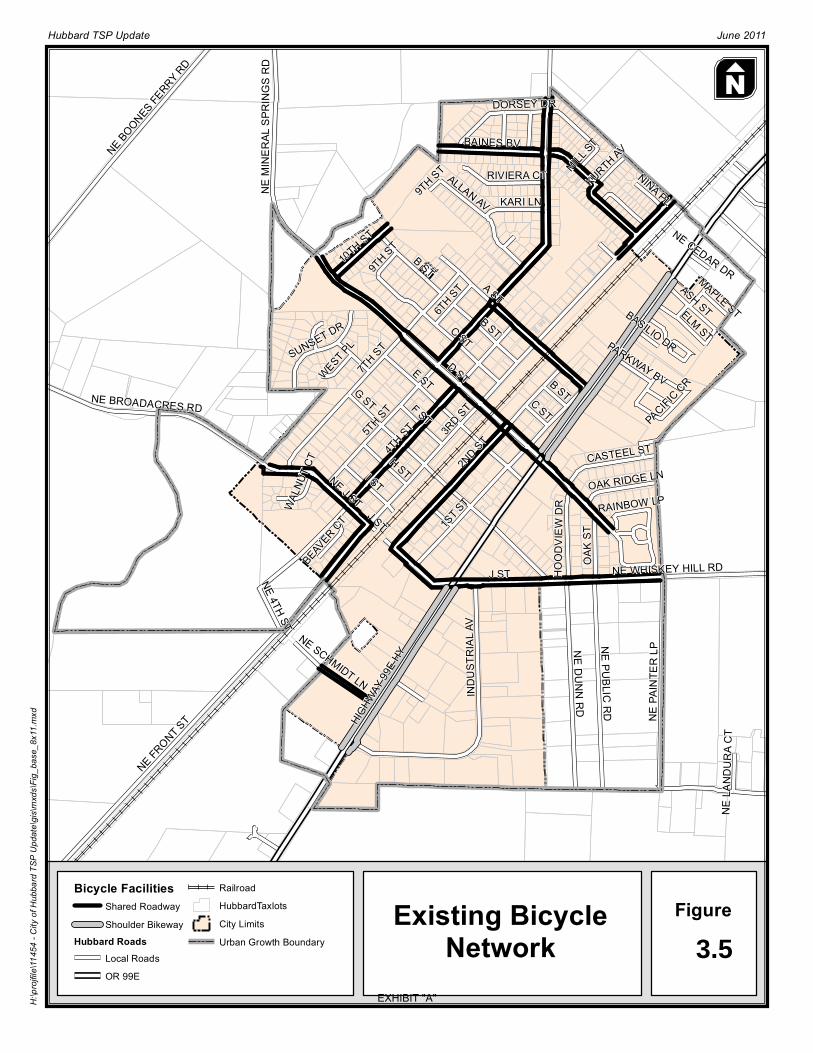
The inventory of bikeways in Hubbard is based upon the street inventory that was completed in 1999 and updated in 2012. See Appendix B. Hubbard currently has no marked bicycle facilities of any kind. There are existing shoulder roadway facilities on the following segments of Pacific Highway 99:
Pacific Highway 99E – South UGB to J Street, and Pacific Highway 99E – D Street to north UGB.
There are existing shared roadway facilities on the following streets:
J Street (Broadacres Road) – West city limits to Painter Loop Road, D Street – Mineral Springs Road to east end, Second Street – J to D Street, Fourth Street – J to D Street, Fifth Street – D Street to north city limits, Tenth Street – D Street to north end, A Street – 5th Street to Pacific Highway 99E, Baines Boulevard – 3rd Street to city limits, and Schmidt Lane – Pacific Highway 99E to west end.
Existing shared roadway facilities were identified on local roadways based upon the 1999 TSP bicycle facility inventory and Phase I collector roadways constructed since 1999, with traffic volumes that do not warrant a separate bike lane. A map of existing shared and shoulder roadway facilities may be found in Figure 3.5 below.
EXHIBIT "A"
D ST
3RD ST
5TH STG ST
HIGHW
AY 99
E HY
4TH ST
J ST
A ST
E ST7TH ST
1ST ST
C ST
2ND ST
NE FRONT S
T
BAINES BV
I STNE J ST
NE DUNN RD
NE PA
INTE
R LPNE PUBLIC RD
INDU
STRI
AL AV
ALLAN AV
F ST
H ST
DORSEY DRNE BOONES FE
RRY RD
NE BROADACRES RD
NE WHISKEY HILL RD
10TH ST
ASH STELM ST
OAK
ST
NE M
INER
AL S
PRIN
GS R
D
SUNSET DR
6TH ST
KARI LN
RIVIERA CT
CASTEEL ST
NE 4TH ST
NE SCHMIDT LN
B ST
HOOD
VIEW
DR
OAK RIDGE LN
NINA PL
WEST PL
9TH ST
KURTH AV
WALN
UT CT
MILL ST
BEAVER CT
MAPLE ST
PARKWAY BV
PACIFIC CR
RAINBOW LP
BASILIO DR
NE LA
NDUR
A CT
NE CEDAR DR
J ST
B ST
C ST
B ST
9TH ST
Existing BicycleNetwork 3.5
Figure
NH:
\projf
ile\11
454 -
City
of H
ubba
rd TS
P Upd
ate\gi
s\mxd
s\Fig_
base
_8x1
1.mxd
Hubbard TSP Update June 2011
Bicycle FacilitiesShared RoadwayShoulder Bikeway
Hubbard RoadsLocal RoadsOR 99E
RailroadHubbardTaxlotsCity LimitsUrban Growth Boundary
EXHIBIT "A"

City of Hubbard TSP, 2012 35
PUBLIC TRANSPORTATION SERVICES
The Public Transportation Services section of the TSP reviews the requirements for public transportation planning and describes the number and kind of Hubbard residents that are more likely to rely on public transportation services. This section also completes an updated inventory of public transportation facilities and services in Hubbard.
Oregon Transportation Planning Rule (TPR) Requirements
City TSPs are required to include a Public Transportation Plan that addresses the following requirements:
Describe public transportation services for the transportation disadvantaged and identify service inadequacies.
Describe inter-city bus and passenger rail service and identify the location of terminals. For areas within an UGB that have public transit service, identify existing and planned transit trunk
routes, exclusive transit ways, terminals and major transfer stations, major transit stops, and park-and-ride stations. Description of stop or station locations may allow for minor adjustments in the location of stops to provide for efficient transit or traffic operation or to provide convenient pedestrian access to adjacent or nearby uses.
For areas within an urban area containing a population greater than 25,000 people, not currently
served by transit, evaluate the feasibility of developing a public transit system at build-out.
Oregon Public Transportation Plan
The Oregon Public Transportation Plan (ODOT, 1997) identifies public transportation system needs through the year 2015. It establishes targets for types of transit service and frequencies for cities the size of Hubbard. The plan identifies minimum levels of service that provide a range of services intended to keep pace with increasing public transportation needs in the State of Oregon. Minimum level of service recommendations are based on types of services, size of community, and distance from other major intermodal centers (only Portland in Oregon) or urban central cities. The plan divides communities into large urban areas; small communities of 25,000 or more; small communities of 2,500 to 25,000; communities of 2,500 or more within 20 miles of an urban central city, and rural and frontier communities that are less than 2,500 people. Hubbard’s population was 3,180 in 2011ii and projected to be 4,718 in 2030iii. Urban central cities closest to Hubbard include the City of Salem, located 20 miles to the south, and Portland, located 28 miles to the north. The cities of Woodburn and Wilsonville, which may also function as “urban central cities,” are located approximately one (1) mile and seven (7) miles, respectively from Hubbard. Within the planning horizon, Hubbard is projected to remain a “small community of 2,500 to 25,000” located within 20 miles of an urban central city. The Oregon Public Transportation Plan recommends the following minimum levels of service for communities with populations of 2,500 to 25,000:
Coordinate intercity senior and disabled services with intercity bus and van services open to the
general public; Connect local public transportation, and senior and disabled service, to intercity bus services; Provide an accessible ride to anyone requesting service;
EXHIBIT "A"

City of Hubbard TSP, 2012 36
Provide 1.7 annual hours of public transportation service per capita with fixed route, dial-a-ride, or other service types;
Provide at least one accessible vehicle for every 40 hours of service; Provide one backup vehicle for every 3.5 vehicles; Provide daily peak hour commuter service to the core areas of the central city (Salem and possibly
Portland); Provide a guaranteed ride home program to all users of the public transportation system and
publicize it well; Provide park and ride facilities along the transit corridors to meet reasonable peak and off-peak
demand for such facilities; and Maintain vehicles and corresponding facilities in a cost-effective manner and replace vehicles when
they reach the manufacturers recommended replacement time. Hubbard Service Population
Information from the most recent Census is used to identify the number of people in Hubbard more likely to use, or be more reliant upon, non-auto transportation modes such as sidewalks, bikeways, public transportation, or paratransit services. Public transportation services are generally targeted to serve the needs of two groups:
People who are transit disadvantaged who do not have, or cannot operate, an automobile to obtain
medical, educational, social or recreational services and employment; and People who presently use a car but would use other transportation alternatives to commute to work.
People living in Hubbard characterized with mobility limitations in 2000 include:
491 people aged 5 to 14 years; 245 people greater than 60 years old; 139 non-institutionalized people with mobility limitations over the ages of 16.
The mobility limited portion of Hubbard’s population was 875 people in 2000, or 35 percent of the total population. The represents a slight increase in the city’s mobility limited population in 1990 (34%). In 2000, the Hubbard workforce included 1,143 people or about 46 percent of the population. Driving alone was the most common way to get to work (72 percent of workforce), followed by carpooling (19 percent). This represents an eight (8) percent decrease in the number of workers driving alone to work from 1990. In 2000, about 1.5 percent of the workforce walked or bicycled to work. About 63 percent of the workforce was at their place of employment within 29 minutes of travel and 30.4 percent had travel times between 30 and 59 minutes.
EXHIBIT "A"

City of Hubbard TSP, 2012 37
Figure 3.6. City of Hubbard Mode of Transportation – 1990, 2000
Inventory of Public Transportation Services and Facilities
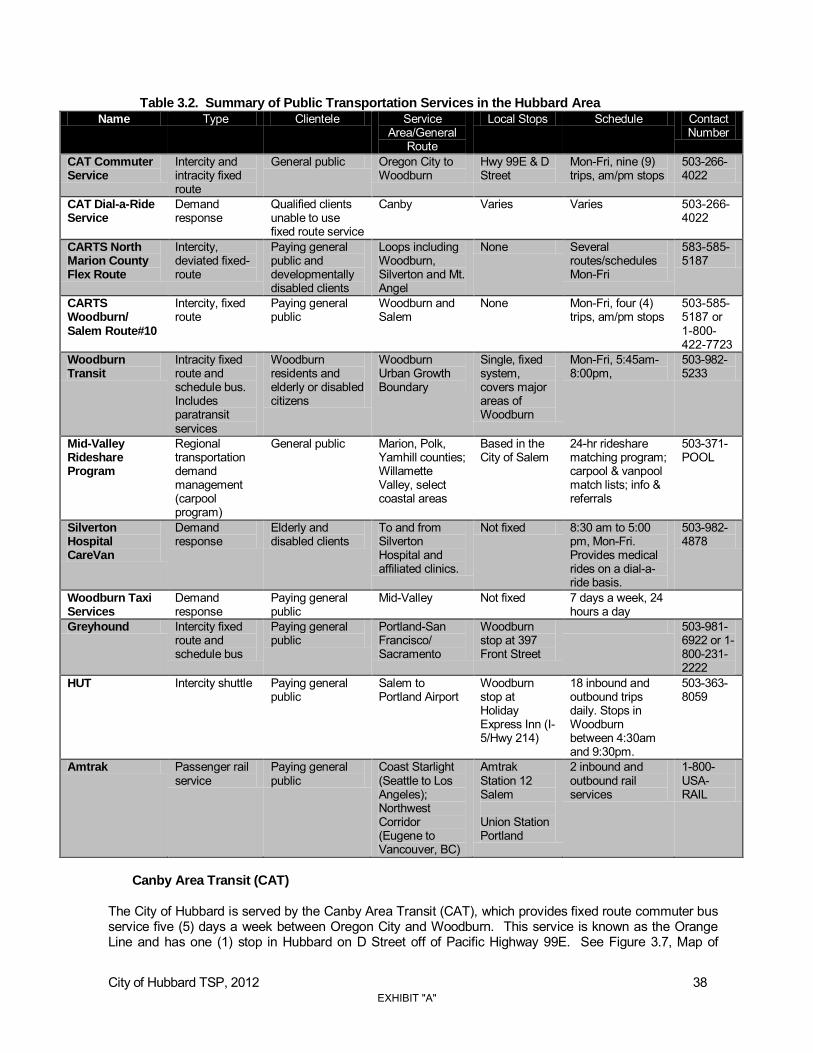
The inventory of public transportation services and facilities includes a review of existing public transit service providers, including the type, location and capacity of existing services. A summary of public transportation services in and near Hubbard is provided in Table 3.2 below.
80
14
1 5
72
19
1.5 7.5
0
10
20
30
40
50
60
70
80
90
Driving alone Carpooling Walking, bicycling Other
1990
2000
EXHIBIT "A"
City of Hubbard TSP, 2012 38
Table 3.2. Summary of Public Transportation Services in the Hubbard Area Name Type Clientele Service
Area/General Route
Local Stops Schedule Contact Number
CAT Commuter Service
Intercity and intracity fixed route
General public Oregon City to Woodburn
Hwy 99E & D Street
Mon-Fri, nine (9) trips, am/pm stops
503-266-4022
CAT Dial-a-Ride Service
Demand response
Qualified clients unable to use fixed route service
Canby Varies Varies 503-266-4022
CARTS North Marion County Flex Route
Intercity, deviated fixed-route
Paying general public and developmentally disabled clients
Loops including Woodburn, Silverton and Mt. Angel
None Several routes/schedules Mon-Fri
583-585-5187
CARTS Woodburn/ Salem Route#10
Intercity, fixed route
Paying general public
Woodburn and Salem
None Mon-Fri, four (4) trips, am/pm stops
503-585-5187 or 1-800-422-7723
Woodburn Transit
Intracity fixed route and schedule bus. Includes paratransit services
Woodburn residents and elderly or disabled citizens
Woodburn Urban Growth Boundary
Single, fixed system, covers major areas of Woodburn
Mon-Fri, 5:45am-8:00pm,
503-982-5233
Mid-Valley Rideshare Program
Regional transportation demand management (carpool program)
General public Marion, Polk, Yamhill counties; Willamette Valley, select coastal areas
Based in the City of Salem
24-hr rideshare matching program; carpool & vanpool match lists; info & referrals
503-371-POOL
Silverton Hospital CareVan
Demand response
Elderly and disabled clients
To and from Silverton Hospital and affiliated clinics.
Not fixed 8:30 am to 5:00 pm, Mon-Fri. Provides medical rides on a dial-a-ride basis.
503-982-4878
Woodburn Taxi Services
Demand response
Paying general public
Mid-Valley Not fixed 7 days a week, 24 hours a day
Greyhound Intercity fixed route and schedule bus
Paying general public
Portland-San Francisco/ Sacramento
Woodburn stop at 397 Front Street
503-981-6922 or 1-800-231-2222
HUT Intercity shuttle Paying general public
Salem to Portland Airport
Woodburn stop at Holiday Express Inn (I-5/Hwy 214)
18 inbound and outbound trips daily. Stops in Woodburn between 4:30am and 9:30pm.
503-363-8059
Amtrak Passenger rail service
Paying general public
Coast Starlight (Seattle to Los Angeles); Northwest Corridor (Eugene to Vancouver, BC)
Amtrak Station 12 Salem Union Station Portland
2 inbound and outbound rail services
1-800-USA-RAIL
Canby Area Transit (CAT)
The City of Hubbard is served by the Canby Area Transit (CAT), which provides fixed route commuter bus service five (5) days a week between Oregon City and Woodburn. This service is known as the Orange Line and has one (1) stop in Hubbard on D Street off of Pacific Highway 99E. See Figure 3.7, Map of
EXHIBIT "A"
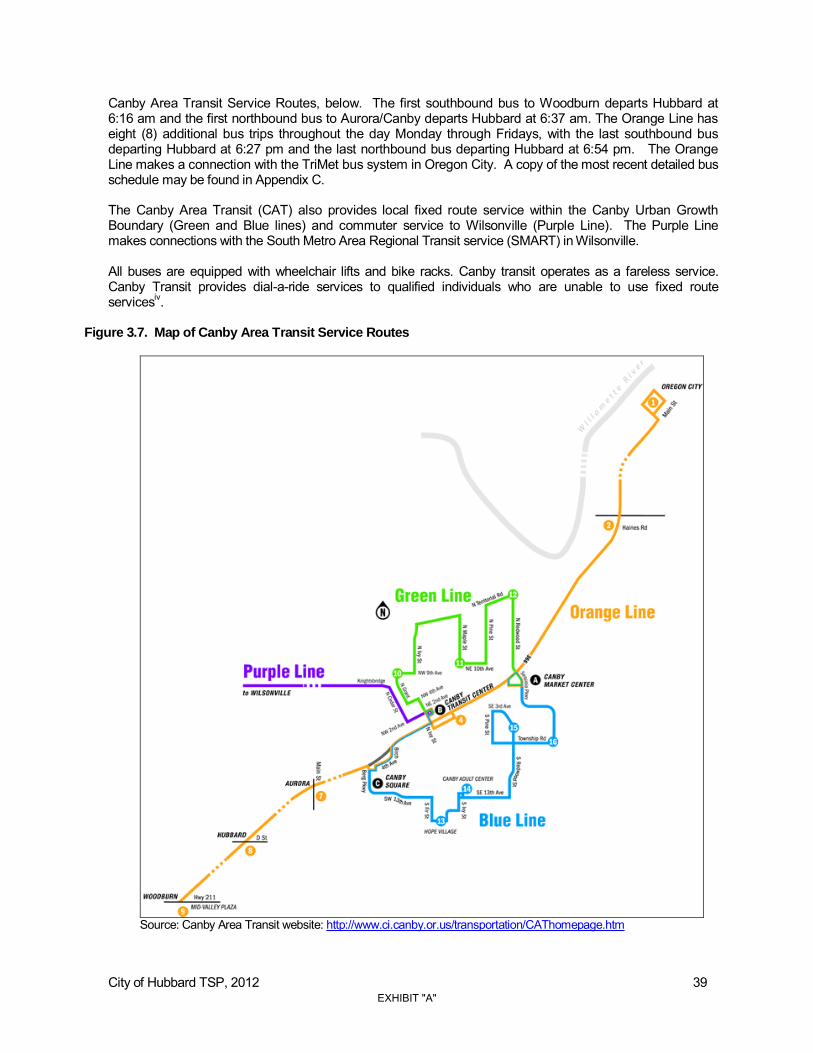
City of Hubbard TSP, 2012 39
Canby Area Transit Service Routes, below. The first southbound bus to Woodburn departs Hubbard at 6:16 am and the first northbound bus to Aurora/Canby departs Hubbard at 6:37 am. The Orange Line has eight (8) additional bus trips throughout the day Monday through Fridays, with the last southbound bus departing Hubbard at 6:27 pm and the last northbound bus departing Hubbard at 6:54 pm. The Orange Line makes a connection with the TriMet bus system in Oregon City. A copy of the most recent detailed bus schedule may be found in Appendix C. The Canby Area Transit (CAT) also provides local fixed route service within the Canby Urban Growth Boundary (Green and Blue lines) and commuter service to Wilsonville (Purple Line). The Purple Line makes connections with the South Metro Area Regional Transit service (SMART) in Wilsonville. All buses are equipped with wheelchair lifts and bike racks. Canby transit operates as a fareless service. Canby Transit provides dial-a-ride services to qualified individuals who are unable to use fixed route servicesiv.
Figure 3.7. Map of Canby Area Transit Service Routes
Source: Canby Area Transit website: http://www.ci.canby.or.us/transportation/CAThomepage.htm
EXHIBIT "A"

City of Hubbard TSP, 2012 40
Chemeketa Area Regional Transportation System (CARTS)
The Chemeketa Area Regional Transportation System (CARTS) also provides fixed-route public transit service for Marion and Polk counties. Route 10 between Woodburn and Salem includes three (3) stops in Woodburn (Woodburn Transit Station, Chemeketa Community College – Woodburn branch, and Mid-Valley Plaza). The first route departs Woodburn at 6:42 a.m. and arrives at the Salem Transit Center at 7:20 a.m. Route 10 runs three (3) additional trips throughout the day with the last route departing Woodburn at 5:10 p.m. and arriving back in Woodburn at 6:30 p.m. See Appendix C for a more detailed schedule for Route 10. All buses are wheelchair lift and bicycle rack equipped. CARTS transit fares for Route10 as of May 2011 are listed in Table 3.3 below. Discounted fares are provided for youth, seniors and disabled individuals.
Table 3.3. CARTS Fares for Route #10 (May 2011)
One-way Day Pass Monthly 10 Ticket Book 5 & under (Free) Youth 6-18 $1.25 $2.50 $35.00 $11.25 Adult 19-59 $2.00 $4.00 $55.00 $18.00 Senior 60+ $1.25 $2.50 $35.00 $11.25 Disabled $1.25 $2.50 $35.00 $11.25
Source: Cherriots Salem Keizer Transit Website: http://www.cherriots.org/index.htm
CARTS also provides flexible route service between Woodburn, Mt. Angel and Silverton. A reservation made twenty four hours in advance is required for this service.
RAIL SERVICE
The rail service section of the TSP includes a review of Oregon Transportation Planning Rule (TPR) requirements and other state plans, policies and standards for rail facility planning. This section also provides an inventory of existing rail transportation facilities and services in Hubbard.
Transportation Planning Rule (TPR) Requirements
The TPR requires transportation plans to include a Rail Transportation Plan that:
Describes the intercity bus and passenger rail service and identifies the location of terminals; and Includes an air, rail, water, and pipeline transportation plan that identifies where public use airports,
mainline and branchline railroads and railroad facilities, port facilities, and major regional pipelines and terminals are located or planned within the planning area.
Inventory of Existing Rail Facilities and Services
The Union Pacific (UP) Railroad passes through the City of Hubbard in roughly the center of the City in a northeast/southwest alignment. This UP owned railroad known as the Valley Main Line, is the primary north/south line along the West Coast and is used for both freight and passenger rail services, though neither type of service stops in Hubbard (see Figure 3.8 below). South of Portland, the line runs east of the Willamette River through the Willamette Valley and continues south to California. This line is heavily used for shipping freight and contains long freight trains that run at frequent intervals. The Federal Railroad Administration (FRA) classifies the UP rail line in Class 4 condition with a maximum freight speed of 60 mph and a maximum passenger rail speed of 80 mph. There are no weight or dimensional restrictions on
EXHIBIT "A"

City of Hubbard TSP, 2012 41
Class 4 tracksv. Since the line is used primarily for shipping freight long-distances, this reduces the feasibility of serving individual shippers along the travel route. UP recently completed the first phase of a three (3) year upgrade of the Eugene-Portland main line. Upon completion in 2013, there will be an increase in train speeds that will raise passenger train speeds to 79 mph and freight trains to 70 mph.vi Union Pacific intercity rail passenger service is currently provided by Amtrak for both their Coast Starlight long distance train and Cascades corridor trains. The Coast Starlight operates one (1) train per day in each direction between Seattle and Los Angeles. The Cascades runs three (3) times per day between Portland and Eugene in Oregon. Amtrak also runs bus service to supplement the frequency of service provided by the trains along this corridor. The scheduled travel time each way between Portland and Eugene is two (2) hours and 35 minutes. On-time performance averaged 68 percent in 2009-2010. According to the Oregon Rail Study (2010) significant investment is required to increase passenger service from two (2) to six (6) roundtrips per day, increase average speed from 42 to 65 mph, and improve reliability from 68 percent to 95 percent on-time performance.
Figure 3.8 Oregon Railroad (near Hubbard, OR)
Source: Oregon Rail Study (ODOT, 2010)
Hubbard Rail Crossings
The original town plat for the City of Hubbard was platted along either side of the railroad, which was known in 1878 as the Oregon and California Railroad. Many City streets today still run parallel to the railroad line, including 2nd and 3 Streets. Historically a siding track ran between A and D Streets and the depot was located between the lines adjacent to C Street. The City expanded around the railroad line today and is bisected by the track. Approximately 5,014 feet of single track and three (3) at-grade crossings of public roads are located inside the UGB. The three crossings are located at:
EXHIBIT "A"
City of Hubbard TSP, 2012 42
A Street, between 2nd and 3rd streets; D Street, between 2nd and 3rd streets; and G Street, between 2nd and 3rd streets.
These crossings are protected by automatic signals and gates, which provide a high level of warning atthe crossings. While automatic signals provide warnings of approaching trains, grade separated crossings provide the highest level of protection for all crossing users. East-west travel across the railroad in Hubbard is temporarily blocked when trains pass. The local fire station, located southeast of the railroad, is delayed in responding to events west of the tracks until trains pass.
AIR SERVICE
There are no private or public airports within the Hubbard UGB. The nearest airport is Lenhardt Airport, a private facility located northeast of Hubbard in Clackamas County.
The closest public airports include the Aurora State Airport in Aurora and McNary Field in Salem. McNary Field in Salem provides for both VHR and instrument flight rules (IFR) operations.
PIPELINE SERVICE
Although not often considered as transportation facilities, pipelines carry liquids and gases very efficiently. The use of pipelines can greatly reduce the number of trucks and rail cars carrying fluids such as natural gas, oil, and gasoline. There are currently no regional pipelines in Hubbard. The closest pipelines are located along the east side of I-5 and run parallel to the freeway. The pipelines distribute petroleum and natural gas. Palomar Gas Transmission, a joint venture between Portland-based Northwest (NW) Natural Gas Company and TransCanada Corp. of Calgary (Alberta, Canada) are in the planning stages of building a natural gas pipeline to serve NW Natural customers in northwest Oregon. The project started out as a 217-mile, 36-inch diameter pipeline stretching from TransCanada’s Gas Transmission Northwest Pipeline in central Oregon to a point on the Columbia River near Astoria where it could connect to a proposed liquefied natural gas terminal. The developers of the proposed project recently withdrew their permit applications with the Federal Energy Regulatory Commission citing a lack of commercial support for the project due to the recent economic recession. The companies are, therefore, not moving forward with the proposal at this time. The developers indicated their intentions to refile for a new permit. A future permit will propose a shorter pipeline focused only on the eastern portion of the initial route located between Madras and Molalla.
WATER TRANSPORTATION FACILITIES AND ACTIVITIES
There are no navigable waterways within the Hubbard UGB and, therefore, no significant water transportation services available.
EXHIBIT "A"

City of Hubbard TSP, 2012 43
EXHIBIT "A"

City of Hubbard TSP, 2012 44
Section 4 Existing and
Future Conditions
EXHIBIT "A"

City of Hubbard TSP, 2012 45
Existing and Future Conditions This section includes an overview of the existing and future transportation system conditions within the City of Hubbard. Existing and future conditions are identified for each of the following modes of transportation: roadway, pedestrian, bicycle, transit, rail, air, water, and pipeline/transmission. Each mode’s current performance and deficiencies are described. These findings are used to help identify transportation needs and deficiencies. This section concludes with an analysis of estimated funding for future transportation projects based on historic funding levels. POPULATION
The purpose of the population inventory is to identify the characteristics of the population served by the Hubbard transportation network, such as modes of transportation used and number of residents with mobility limitations. The population inventory informs the existing and future conditions analyses of the TSP update to develop future alternative scenarios that serve residents’ needs. According to the 2010 U.S. Census, 41% of Hubbard residents have minority status.vii Approximately 36% of residents are of Hispanic or Latino origin. In 2000, approximately 17% of Hubbard residents had limited English speaking abilities. Four percent of households in Hubbard had no access to a vehicle in 2000. In 2010, 28% of Hubbard residents belonged to age groups that are considered to have mobility limitations; 19% of Hubbard residents were between the ages of 5 and 14 and 9% of residents were greater than 60 years old. Information about individuals with additional mobility limitations is not available from the 2010 Census; however, in 2000, approximately 5% of non-institutionalized Hubbard residents between the ages of 14 and 60 had a disability that limited their mobility. Assuming this figure has remained consistent over the past 10 years, the total mobility limited population in Hubbard is approximately 33% of the total population. This figure has remained relatively constant over time (34% in 1990, 35% in 2000). In 2000, the Hubbard workforce included 1,143 residents, approximately 46% of the population. Driving alone was the most common means of transportation to work (72%), followed by carpooling (19%). Approximately 7.5% of workers used “other” modes such as transit, and 1.5% walked or biked to work. The percentage of Hubbard workers who drive alone decreased by 8 percentage points between 1990 and 2000, while the percentage workers who carpool, walk, bike, and take other modes increased.
ROADWAY NETWORK
The primary roadway through Hubbard is OR 99E, which passes southwest to northeast through the City. The Union Pacific railroad tracks parallel OR 99E approximately 650 feet to the northwest. These two major transportation corridors effectively divide the City into three geographical areas: 1) Northwest of the railroad tracks; 2) Between the railroad tracks and OR 99E; and 3) Southeast of OR 99E. Within each sub-area there is a relatively consistent street grid and connectivity. The remaining roadway network in the City is primarily constructed as a grid network parallel to OR 99E and the railroad. There are currently three east-west streets that cross the railroad right-of-way and connect each of the three geographical areas, including G Street, D Street, and A Street. J Street also provides east-west connectivity across OR 99E and becomes Whiskey Hill Road east of city limits, but does not cross the Union Pacific railroad tracks. MWVCOG conducted an existing street system inventory for all roadways within Hubbard. This inventory is documented in Section 3 and included:
Street classification and jurisdiction; Street width and right-of-way;
EXHIBIT "A"

City of Hubbard TSP, 2012 46
Surface type and condition; Presence of curbs, sidewalks, or bikeways; and Speed limits.
The following sub-sections provide additional discussion of jurisdictional responsibility and functional classification, as well as analysis of existing traffic operations, crash history, and future traffic operations of the roadways within the City of Hubbard.
JURISDICTION
Public roads within the study area are maintained by the City of Hubbard and the Oregon Department of Transportation (ODOT). ODOT is responsible for OR 99E within and beyond the Hubbard city limits. The City of Hubbard is responsible for all other roadways within the city limits. Within the unincorporated areas of the UGB, Marion County has jurisdictional responsibility for D Street and J Street. Table 4.1 summarizes the jurisdictional responsibilities and functional classification of the primary roadways within the City of Hubbard.
Table 4.1 Jurisdictional Responsibilities
Roadway Jurisdictional Responsibility Functional Classification
OR 99E ODOT Major Arterial/Rural Minor Arterial1
Elm Street Private Private A Street City of Hubbard Collector D Street City of Hubbard/Marion County Minor Arterial2 G Street City of Hubbard Collector3
J Street City of Hubbard/Marion County Minor Arterial Industrial Avenue City of Hubbard Local Street
Parkway Boulevard Private Private 3rd Street City of Hubbard Minor Arterial 5th Street City of Hubbard Collector
1 Hubbard classifies OR 99E as a Major Arterial; ODOT classifies OR 99E as a Rural Minor Arterial. 2 D Street is a Minor Arterial northwest of OR 99E, and a Collector southeast of OR 99E. 3 G Street is a Collector between 2nd Street and J Street, and a Local Road northwest of 2nd Street
FUNCTIONAL CLASSIFICATIONS, STREET DESIGN STANDARDS AND ACCESS SPACING STANDARDS Identifying the appropriate functional classification for roadways provides a basis for planning future improvements and establishing design standards, such as: access spacing, roadway width, right-of-way needs, design speed, and type of pedestrian and bicycle facilities. The City of Hubbard’s 1999 TSP identifies four roadway classifications: Major Arterial, Minor Arterial, Collector, and Local Street. OR 99E is classified as a Major Arterial by the City of Hubbard and as a Rural Minor Arterial by ODOT. OR 99E is also identified in the 1999 Oregon Highway Plan as a Regional Highway and a designated freight route.
Table 4.2 summarizes the street design standards corresponding to each of the functional classifications adopted in the 1999 TSP. In addition to these standards, the 2003 Hubbard Downtown Development Resource Team Report provides streetscape and cross section recommendations for OR 99E, D Street, and 3rd Street. Table 4.3 summarizes the Rural Arterial design standards in the ODOT Highway Design Manual.
EXHIBIT "A"

City of Hubbard TSP, 2012 47
Table 4.2 Existing Hubbard Street Design Standards1
Functional Classification
ROW Width
2 Paved Width
Travel Lanes
Turning Lane Parking
Parkway Strip
Sidewalk Width
Bikeway Type and Standards
Arterial Major
100 76 4 12’ lanes
1 14-16’ lane
None 2 5’ strips
2 6’
sidewalks
2 6’ bike lanes
Minor 60 483 2
11’ lanes None Both
sides of street
None 2 6’
sidewalks
2 6’ bike lanes
Collector3 Phase I
60 344 2 10’ lanes None
Both sides of street
2 4.5’ strips
2 5’
sidewalks
Shared Roadway
Phase II 60 344 2
11’ lanes None None 2 ‘4.5 strips
2 5’
sidewalks
2 6’ bike lanes
Local Local Street
50 283 1 14’ lane None
Both sides of street
2 5’ strips
2 5’
sidewalks
Shared Roadway
Cul-de-sac 50 30 1
14’ lane None Both
sides of street
2 5’ strips
2 5’
sidewalks
Shared Roadway
Cul-de-sac-bulb 46 40 None 1
5’ strip
2 5’
sidewalks
Shared Roadway
1All dimensions in table are in feet. 2 ROW = right-of-way 3 Phase I changes to Phase II when traffic volume exceeds 3,000 ADT. 4Greater widths may be required at intersections with turn lanes.
Table 4.3 Existing ODOT Rural Arterial Design Standards1
Functional Classification
# of Lanes
Design Speed
Width of Traveled
Way Shoulder
Width
Maximum Grade
(%) Maximum Curvature
Stopping Sight
Distance
Rural Arterial 2 70 mph 24’ 8’ 3 3°15’ 730 4 70 mph 2 x 24’ 8’ 3 3°15’ 730
Table 4.4 summarizes ODOT access spacing standards for Rural Regional Highways and access spacing standards corresponding to each of the functional classifications adopted in the 1999 Hubbard TSP.
EXHIBIT "A"

City of Hubbard TSP, 2012 48
Table 4.4 Access Spacing Standards
Functional Classification
Minimum Spacing (feet)
Between Public Roadways
Between Private Roadways
Between Traffic Signals
Rural Regional Highway (ODOT) 600 -7501 600 -7501 2,640
Major Arterial (City) 1,320 300 – 500 1,320 – 2,640 Minor Arterial (City) 400 150 – 300 - Collector (City) 400 100 – 150 - Local - - - “-“ Indicates a minimum access spacing was not specified in the 1999 TSP for that street type. 1 Standard is 600’ in areas with posted speed of 30-35 miles per hour, 750’ in areas with posted speed of 40-45 miles
per hour.
POTENTIAL FUNCTIONAL CLASSIFICATION, DESIGN STANDARD, AND ACCESS SPACING CHANGES
Many of the roadways within the City of Hubbard do not currently meet the design standards or access spacing standards contained in Tables 4.3 and 4.4. Most notably, OR 99E, the only major arterial in Hubbard, currently has a 2 to 3 lane cross-section as opposed to the 5-lane section currently identified in the design standards. There are also currently no marked bicycle lanes on any arterials or collectors within Hubbard and many streets do not have sidewalks, or have sidewalks narrower than the required 5 to 6 feet. As part of the TSP Update, the desire and need for these cross-sections was reviewed. In particular, the recommended cross sections for OR99E, 3rd Street, and D Street were assessed to incorporate the recommendations of the 2003 Hubbard Downtown Development Resource Team Report. In addition, the existing Roadway Network Plan in the 1999 Hubbard TSP does not address recent UGB expansion areas. The roadway needs of these areas, including functional classifications, design standards, and access requirements were addressed as part of the TSP update. The TSP update reevaluated the location(s) of and need for new or extended collector streets in these areas in order to increase accessibility and create alternative routes to OR 99E. Several areas outside of the UGB, including the agricultural area east of OR 99E and the area northwest of Hubbard near Mill Creek, were also evaluated to identify locations for future collectors that minimize impacts on prime agricultural land, wetlands, and steep slopes.
EXISTING TRAFFIC VOLUMES
Existing traffic operations were evaluated to identify current intersection deficiencies on the system in terms of delay, available capacity and/or queue lengths. Figures 4.1 and 4.2 show the locations, existing lane configurations, and traffic control devices at the study intersections that were evaluated using traffic counts obtained from ODOT. The study intersections generally represent the major intersections within the City of Hubbard.
EXHIBIT "A"

12
11
10
8
9
7
6
5
4
3
2
1
D ST
3RD ST
5TH STG ST
HIGHW
AY 99
E HY
4TH ST
J ST
A ST
E ST7TH ST
1ST ST
C ST
2ND ST
NE FRONT S
T
BAINES BV
I STNE J ST
NE DUNN RD
NE PA
INTE
R LPNE PUBLIC RD
INDU
STRI
AL AV
ALLAN AV
F ST
H ST
DORSEY DRNE BOONES FE
RRY RD
NE BROADACRES RD
NE WHISKEY HILL RD
10TH ST
ASH STELM ST
OAK
ST
NE M
INER
AL S
PRIN
GS R
D
SUNSET DR
6TH ST
KARI LN
RIVIERA CT
CASTEEL ST
NE 4TH ST
NE SCHMIDT LN
B ST
HOOD
VIEW
DR
OAK RIDGE LN
NINA PL
9TH ST
KURTH AV
WALN
UT CT
MILL ST
BEAVER CT
MAPLE ST
PACIFIC CR
RAINBOW LP
SCHMIDT LN
BASILIO DR
NE LA
NDUR
A CT
NE CEDAR DR
B ST
C ST
B ST
9TH ST
Study IntersectionLocations 4.1
Figure
NH:\pr
ojfile\1145
4 - City of
Hubbard
TSP Upd
ate\gis\mx
ds\Fig_ba
se_8x11.m
xdHubbard TSP Update June 2011
City LimitsUrban Growth BoundaryHubbardTaxlots
Hubbard RoadsLocal RoadsOR 99ERailroad
EXHIBIT "A"
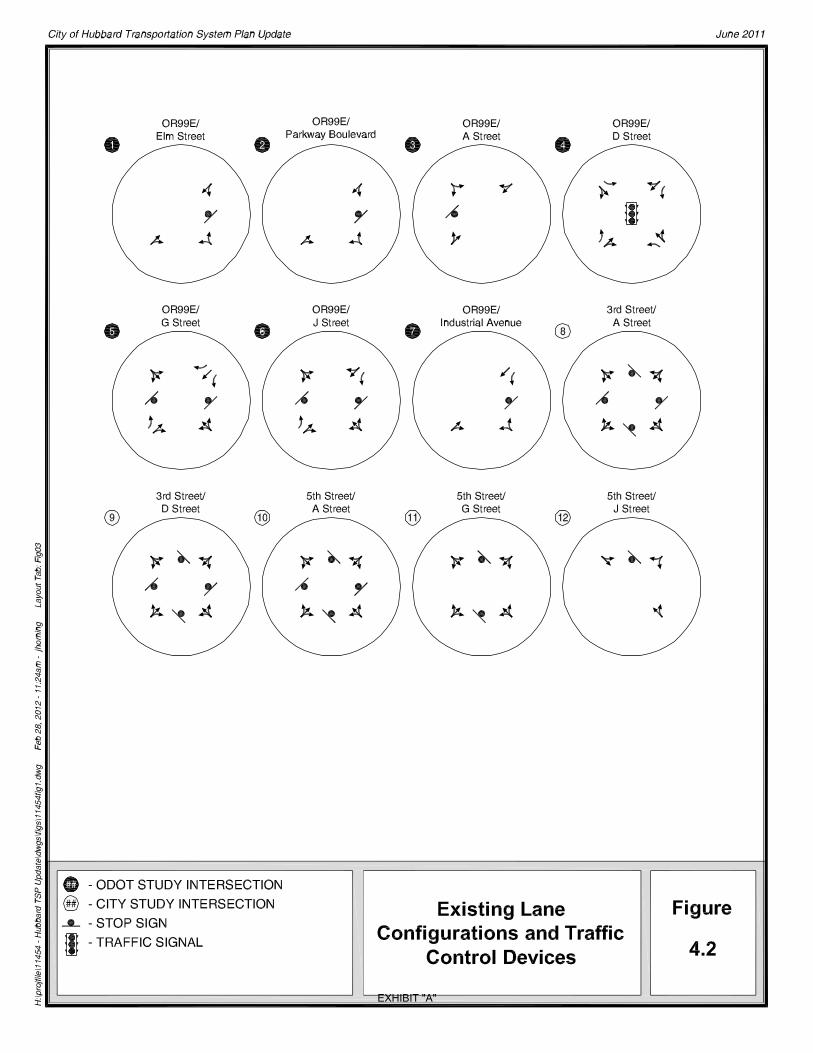
EXHIBIT "A"

City of Hubbard TSP, 2012 51
Figure 4.3 illustrates the daily traffic profile at OR 99E and D Street in Hubbard. The traffic counts indicate that the system weekday peak hour occurs between 4:30 p.m. and 5:30 p.m. Traffic counts also indicate that the majority of traffic in Hubbard is located on OR 99E and D Street; side street traffic is minimal. Appendix D contains the raw 2010 traffic counts. Figure 4.3 Average Daily Traffic (OR 99E and D Street)
Figure 4.4 shows the existing weekday p.m. peak hour traffic volumes at each of the study intersections. These volumes have been balanced and seasonally adjusted using the “Commuter” trend from ODOT’s Seasonal Trend Table according to the procedures defined in the ODOT Analysis Procedures Manual. The traffic counts conducted in October 2010 at all study intersections were seasonally adjusted by a factor of 1.03. The seasonal adjustment factor selection process is described in the Methodology Memo, included in Appendix E.
EXHIBIT "A"

EXHIBIT "A"

City of Hubbard TSP, 2012 53
EXISTING TRAFFIC OPERATIONS
Traffic operations at intersections are typically gauged using a measure known as “level of service” (LOS). Level of service represents the average amount of delay that motorists experience when passing through an intersection using a letter grade scale from “A” (best) to “F” (worst). At signalized and all-way stop-controlled intersections, LOS is based on the average delay experienced by all vehicles entering the intersection. At two-way stop-controlled intersections, LOS is based on the average delay experienced by the worst movement at the intersection, typically a left-turn from the stop-controlled street. For signalized intersections, LOS “D” (drivers experience no more than 55 seconds of average delay) is generally considered to be an acceptable operational level. For unsignalized intersections, LOS “E” (drivers experience no more than 50 seconds of average delay) is generally considered to be an acceptable level. ODOT uses a volume-to-capacity (v/c) ratio to evaluate operations at intersections under its jurisdiction (e.g. OR 99E). The v/c ratio indicates the percentage of an intersection’s or movement’s capacity that is being used. For example, a v/c ratio of 0.50 indicates that half of the available capacity is used. In order to meet ODOT performance standards for a regional highway outlined in the Oregon Highway Planviii, the v/c ratio at OR 99E intersections in Hubbard should not exceed 0.85. All of the operational analyses described in this report were performed in accordance with the procedures stated in the 2000 Highway Capacity Manual ixand the ODOT Analysis Procedures Manualx. Based on current p.m. peak hour traffic volumes, level of service was calculated for the study area intersections. The results of the level of service analysis are summarized in Figure 4.4 and Table 4.5.
EXHIBIT "A"
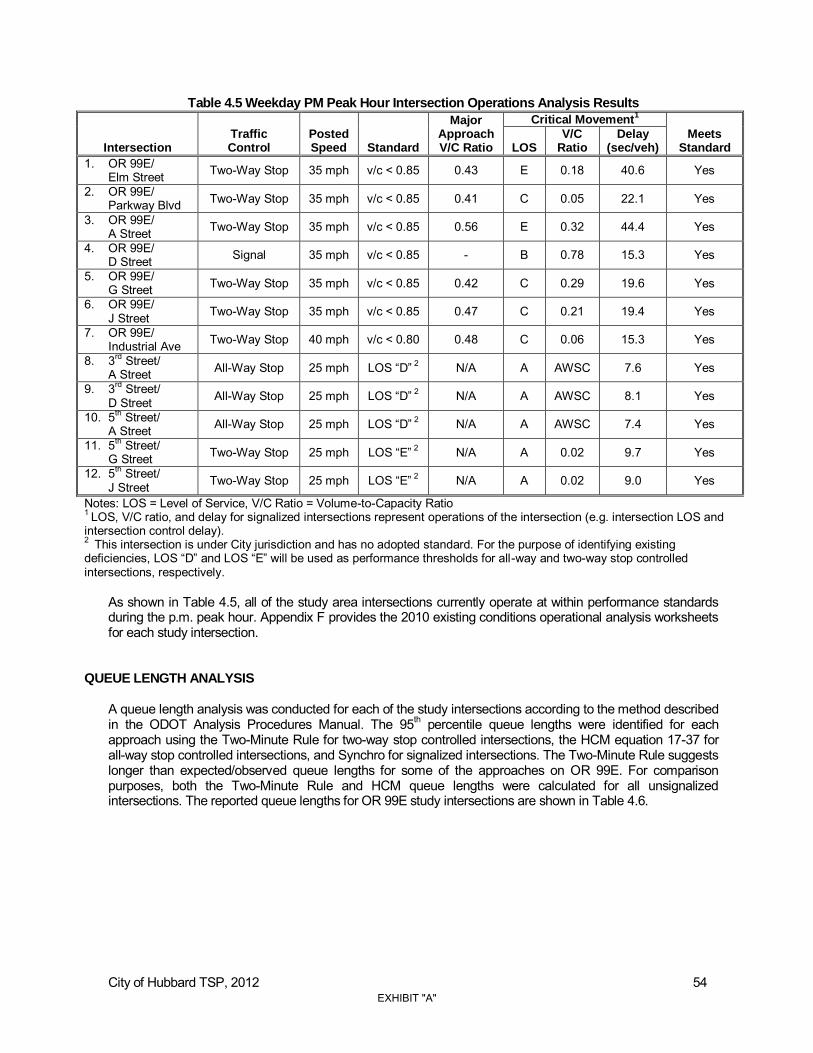
City of Hubbard TSP, 2012 54
Table 4.5 Weekday PM Peak Hour Intersection Operations Analysis Results
Intersection Traffic Control
Posted Speed Standard
Major Approach V/C Ratio
Critical Movement1
Meets Standard LOS
V/C Ratio
Delay (sec/veh)
1. OR 99E/ Elm Street Two-Way Stop 35 mph v/c < 0.85 0.43 E 0.18 40.6 Yes
2. OR 99E/ Parkway Blvd Two-Way Stop 35 mph v/c < 0.85 0.41 C 0.05 22.1 Yes
3. OR 99E/ A Street Two-Way Stop 35 mph v/c < 0.85 0.56 E 0.32 44.4 Yes
4. OR 99E/ D Street Signal 35 mph v/c < 0.85 - B 0.78 15.3 Yes
5. OR 99E/ G Street Two-Way Stop 35 mph v/c < 0.85 0.42 C 0.29 19.6 Yes
6. OR 99E/ J Street Two-Way Stop 35 mph v/c < 0.85 0.47 C 0.21 19.4 Yes
7. OR 99E/ Industrial Ave Two-Way Stop 40 mph v/c < 0.80 0.48 C 0.06 15.3 Yes
8. 3rd Street/ A Street All-Way Stop 25 mph LOS “D”
2 N/A A AWSC 7.6 Yes
9. 3rd Street/ D Street All-Way Stop 25 mph LOS “D”
2 N/A A AWSC 8.1 Yes
10. 5th Street/ A Street All-Way Stop 25 mph LOS “D”
2 N/A A AWSC 7.4 Yes
11. 5th Street/ G Street Two-Way Stop 25 mph LOS “E”
2 N/A A 0.02 9.7 Yes
12. 5th Street/ J Street Two-Way Stop 25 mph LOS “E”
2 N/A A 0.02 9.0 Yes
Notes: LOS = Level of Service, V/C Ratio = Volume-to-Capacity Ratio 1 LOS, V/C ratio, and delay for signalized intersections represent operations of the intersection (e.g. intersection LOS and intersection control delay). 2 This intersection is under City jurisdiction and has no adopted standard. For the purpose of identifying existing deficiencies, LOS “D” and LOS “E” will be used as performance thresholds for all-way and two-way stop controlled intersections, respectively.
As shown in Table 4.5, all of the study area intersections currently operate at within performance standards during the p.m. peak hour. Appendix F provides the 2010 existing conditions operational analysis worksheets for each study intersection.
QUEUE LENGTH ANALYSIS
A queue length analysis was conducted for each of the study intersections according to the method described in the ODOT Analysis Procedures Manual. The 95th percentile queue lengths were identified for each approach using the Two-Minute Rule for two-way stop controlled intersections, the HCM equation 17-37 for all-way stop controlled intersections, and Synchro for signalized intersections. The Two-Minute Rule suggests longer than expected/observed queue lengths for some of the approaches on OR 99E. For comparison purposes, both the Two-Minute Rule and HCM queue lengths were calculated for all unsignalized intersections. The reported queue lengths for OR 99E study intersections are shown in Table 4.6.
EXHIBIT "A"

City of Hubbard TSP, 2012 55
Table 4.6 Queue Length Analysis (2010)
Intersection Approach
95th
Percentile Queue Length (feet)
1 Queue
Storage Available
Adequate Storage?
2-Minute Rule HCM Synchro
1. OR 99E/Elm Street Westbound 25 25 175 Yes Southbound 25 25 -3 Yes
2. OR 99E/Parkway Boulevard
Westbound 25 25 300 Yes Southbound 25 25 -3 Yes
3. OR 99E/A Street Eastbound 75 50 300 Yes Northbound 25 25 -3 Yes
4. OR 99E/D Street Northbound TH/RT 2502 220 No
Northbound LT 25 120 Yes Southbound TH/RT 5502 700 Yes
Southbound LT 25 120 Yes Eastbound TH/RT 100 100 Yes
Eastbound LT 150 300 Yes Westbound TH/RT 75 80 Yes
Westbound LT 50 80 Yes 5. OR 99E/G Street Northbound LT 150 25 >300 Yes
Southbound LT 75 25 >300 Yes Eastbound 175 50 200 Yes Westbound 75 25 >300 Yes
6. OR 99E/J Street Northbound LT 25 25 >300 Yes Southbound LT 50 25 >300 Yes
Eastbound 75 25 120 Yes Westbound 100 25 120 Yes
7. OR 99E/Industrial Avenue
Southbound LT 25 25 >300 Yes Westbound 50 25 200 Yes
1 All queue lengths are rounded up to the nearest 25 feet. 2 Reported queue may be longer than existing queue due to use of optimized signal timings in the Synchro model. The project team is awaiting signal timing data for this intersection from ODOT.
3 Turn pockets are not provided, but more than 300 feet of storage is available in the through travel lane.
As shown in Table 4.6, with the exception of the OR 99E/D Street intersection, the existing 95th percentile queue lengths at the study intersections are less than their respective available storage. At the OR 99E/D Street intersection, queues for the northbound through and right turn movement currently extend past the OR 99E/E Street intersection. Queuing analysis calculations for OR 99E and local study intersections are provided in Appendix F.
CRASH ANALYSIS
Roadway Segment Crash Analysis
The Oregon 99E Corridor Safety Report (2002) identified a high number of crashes on OR 99E between the northern city limits of Salem and the northern city limits of Canby. This segment of OR 99E was noted to have higher rates of crashes involving alcohol use and crashes involving pedestrians than the statewide average. Findings specific to the segment of OR 99E in Hubbard include:
Access control is a problem on Highway 99E in Hubbard, particularly in areas with wide shoulders and “open frontage” where driveways are not defined.
The crash rate on OR 99E in Hubbard is higher than the state average, which is primarily attributed to the high traffic volumes for the number of available lanes.
EXHIBIT "A"
City of Hubbard TSP, 2012 56
Queues from the signal at D Street contribute to rear end crashes and it is difficult for side traffic to find gaps to cross or enter the highway, resulting in turning and angle crashes
A review of ODOT’s Safety Priority Index System (SPIS) was also completed. The SPIS is a method developed by ODOT for identifying high crash locations on state highways. In 2009, the segment of OR 99E through Hubbard was identified as a Category 3 segment (three to five fatal and serious injury crashes in a five-mile segment) in the Safety Investment Program (SIP). In 2010, the segment of OR 99E between Parkway Boulevard and A Street (mileposts 28.98 to 29.19) was identified as a 95th percentile (top 5 percent) SPIS site. Approximately 87% of crashes on this segment are rear end crashes, possibly related to vehicle queues from the signal at D Street. Recent improvements at the OR 99E/D Street intersection (signal timing changes, addition of flashing yellow arrows, curb radii, and new curb, gutter, and sidewalks) may influence future crash rates on this segment and at the OR 99E/D Street intersection. Based on its analysis, ODOT recommends installing a two-way left turn lane on this segment of OR 99E. The project team has requested historic roadway segment crash records for OR 99E within Hubbard. In subsequent tasks of the TSP update, this segment crash data will be reviewed in detail and potential mitigations identified for reducing crashes. Intersection Crash Analysis
To identify potential safety deficiencies or conflict points at study intersections within Hubbard, five years of crash data, - from 2005 through 2009 - were obtained from ODOT and analyzed. Crash data were reviewed at the intersection level in order to identify potential safety issues that should be addressed. Typically, intersection safety is evaluated by calculating the intersection’s crash rate (the number of crashes per million vehicles entering the intersection) and the frequency of crashes (the number of crashes per year). These rates are compared to other similar facilities and crash patterns are examined to determine whether a safety deficiency exists. For this analysis, the critical rate method was used to evaluate each of the study intersections. Appendix G contains the raw ODOT crash data and Appendix H contains the critical crash rate calculations. Under this methodology, a critical crash rate is calculated for each intersection and compared to each intersection’s observed crash rate. The critical crash rates are based on the performance of other study intersections with the same traffic control device.xi For the purpose of the analysis, the study intersections were divided into two groups: 1) intersections located on OR 99E and 2) intersections located off of OR 99E. These two groups were used due to the substantial difference in traffic volumes between intersections on OR 99E and local intersections. Comparing crash rates between high and low volume intersections can be misleading and over-represent crashes occurring at low volume intersections. Establishing these two comparison groups creates a more valid assessment of existing safety performance. Crash rates for intersections were calculated in crashes per million entering vehicles (MEV). The observed crash frequency, crash rate, and critical crash rate for each study intersection is summarized in Table 4.7.xii
EXHIBIT "A"

City of Hubbard TSP, 2012 57
Table 4.7 Crash Analysis Summary (2005-2009)
Intersection
Property Damage
Only (PDO)
Crashes Injury
Crashes Fatal
Crashes Total
Crashes
Crash Frequency (per year)
Observed Crash
Rate (per MEV)
Critical Crash Rate
Exceeds Critical Rate?
1. Elm Street/ OR 99E 1 2 0 3 0.6 0.10 0.37 No
2. Parkway Boulevard/ OR 99E
0 3 0 3 0.6 0.10 0.37 No
3. A Street/ OR 99E 0 5 0 5 1.0 0.17 0.37 No
4. D Street/ OR 99E 8 8 0 16 3.2 0.52 0.37 Yes
5. G Street/ OR 99E 10 4 0 14 2.8 0.48 0.37 Yes
6. J Street/ OR 99E 6 0 0 6 1.2 0.22 0.38 No
7. Industrial Avenue/ OR 99E
0 0 0 0 0.0 0.00 0.38 No
8. A Street/ 3rd Street 0 0 0 0 0.0 0.00 0.59 No
9. D Street/ 3rd Street 1 0 0 1 0.2 0.14 0.49 No
10. A Street/ 5th Street 1 0 0 1 0.2 0.30 0.62 No
11. G Street/ 5th Street 1 0 0 1 0.2 0.58 0.77 No
12. J Street/ 5th Street 0 0 0 0 0.0 0.00 0.65 No
Of the 12 study intersections, two exceed their critical crash rate: D Street/OR 99E and G Street/OR 99E. The majority of crashes at the D Street/OR 99E intersection angle or turn crashes involving vehicles disregarding the traffic signal. At both intersections, multiple northbound and southbound vehicles were rear-ended while stopped at the signal or flashing yellow beacon (all southbound rear-end crashes occurred during the p.m. peak and the majority of northbound crashes occurred during the a.m. peak). The majority of crashes at the G Street/OR 99E intersection involved vehicles trying to cross OR 99E (six westbound and four eastbound vehicles). Table 4.7 provides additional detail about the types of crashes that have been reported at each of the study intersections.
EXHIBIT "A"

City of Hubbard TSP, 2012 58
Table 4.8 Intersection Crash Type and Severity (2005-2009)
Intersection Name No. of
Crashes
Collision Type
Angle Head-On Rear-End Turning Other
1. Elm Street/OR 99E 3 0 0 2 1 0 2. Parkway Boulevard/OR
99E 3 0 0 3 0 0
3. A Street/OR 99E 5 0 0 4 1 0 4. D Street/OR 99E 16 5 0 4 7 0 5. G Street/OR 99E 14 10 0 2 2 0 6. J Street/OR 99E 6 3 0 1 2 0 7. Industrial Avenue/OR 99E 0 0 0 0 0 0 8. A Street/3rd Street 0 0 0 0 0 0 9. D Street/3rd Street 1 0 0 0 1 0 10. A Street/5th Street 1 1 0 0 0 0 11. G Street/5th Street 1 1 0 0 0 0 12. J Street/5th Street 0 0 0 0 0 0
Total 50 20 0 16 14 0
All but three of the 50 crashes identified in the crash data are related to the OR 99E corridor. Over half of these crashes occurred at the intersections of OR 99E with G Street and D Street. Crash data for the two intersections that exceed the critical crash rate were reviewed in detail and potential mitigations identified for reducing crashes in Section 5 – Alternatives Analysis.
FUTURE TRAFFIC OPERATIONS The following section describes anticipated future growth in the City of Hubbard and surrounding region between 2010 and 2035. It also summarizes how the transportation system is anticipated to operate with the additional traffic in the “no build” scenario (if no improvements were made to the existing system). Future traffic operations were evaluated in accordance with the Cumulative Analysis Procedure identified in the ODOT Analysis Procedures Manualxiii. The detailed methodology for this analysis and development of future growth forecasts are included in Appendix E. Planned Transportation Improvements Appendix A describes the future transportation improvements recommended for the study area in existing local and regional planning documents. There are no capacity increasing projects currently planned within the study area. Safety improvements to the OR 99E/Young Street intersection and addition of a two-way center turn lane at the OR 99E/Belle Passi Road intersection in Woodburn, are included in the draft 2012-2015 State Transportation Improvement Program (STIP), but are not anticipated to impact traffic in Hubbard. The Woodburn Highway 99E Corridor Plan is currently being completed and a corridor plan that addresses the section of OR 99E in Hubbard will be developed concurrently with the TSP update. These corridor plans will evaluate land use and transportation conditions along the OR 99E corridor and identify specific transportation improvements needed to support future growth. The Hubbard TSP update was developed in coordination with the upcoming OR 99E Corridor Plan.
EXHIBIT "A"
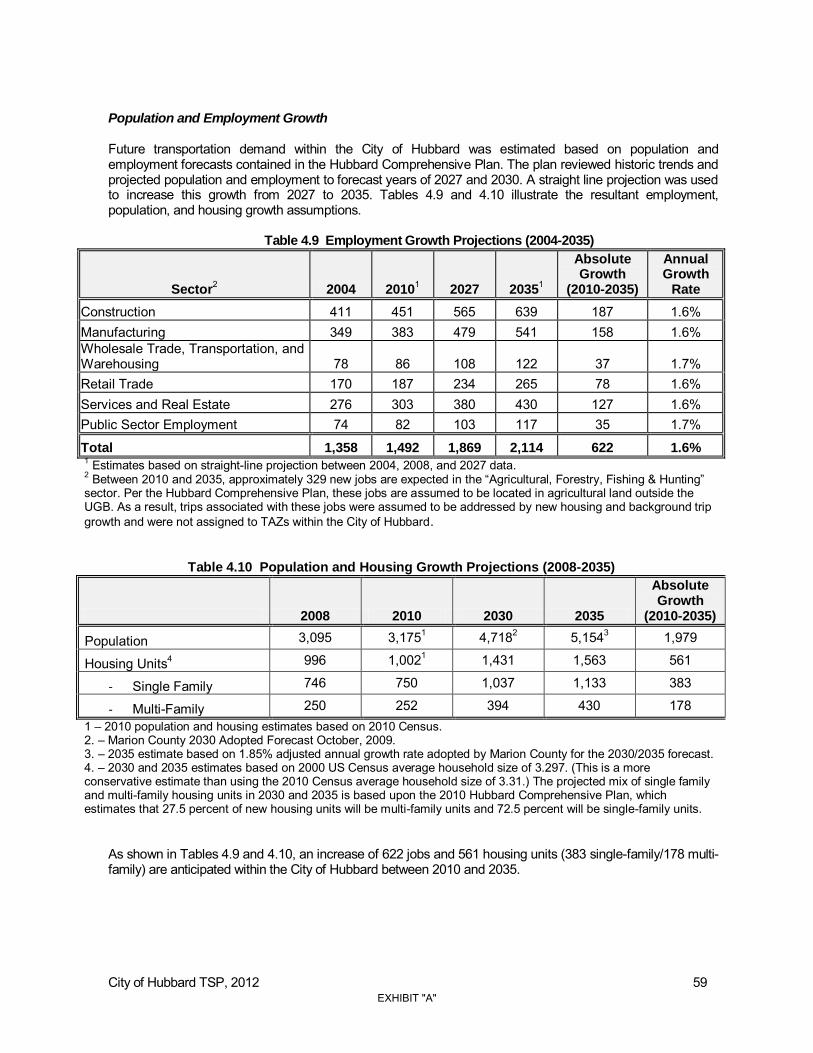
City of Hubbard TSP, 2012 59
Population and Employment Growth Future transportation demand within the City of Hubbard was estimated based on population and employment forecasts contained in the Hubbard Comprehensive Plan. The plan reviewed historic trends and projected population and employment to forecast years of 2027 and 2030. A straight line projection was used to increase this growth from 2027 to 2035. Tables 4.9 and 4.10 illustrate the resultant employment, population, and housing growth assumptions.
Table 4.9 Employment Growth Projections (2004-2035)
Sector2 2004 2010
1 2027 2035
1
Absolute Growth
(2010-2035)
Annual Growth
Rate
Construction 411 451 565 639 187 1.6% Manufacturing 349 383 479 541 158 1.6% Wholesale Trade, Transportation, and Warehousing 78 86 108 122 37 1.7% Retail Trade 170 187 234 265 78 1.6% Services and Real Estate 276 303 380 430 127 1.6% Public Sector Employment 74 82 103 117 35 1.7%
Total 1,358 1,492 1,869 2,114 622 1.6% 1 Estimates based on straight-line projection between 2004, 2008, and 2027 data. 2 Between 2010 and 2035, approximately 329 new jobs are expected in the “Agricultural, Forestry, Fishing & Hunting” sector. Per the Hubbard Comprehensive Plan, these jobs are assumed to be located in agricultural land outside the UGB. As a result, trips associated with these jobs were assumed to be addressed by new housing and background trip growth and were not assigned to TAZs within the City of Hubbard.
Table 4.10 Population and Housing Growth Projections (2008-2035)
2008 2010 2030 2035
Absolute Growth
(2010-2035)
Population 3,095 3,1751 4,7182 5,1543 1,979
Housing Units4 996 1,0021 1,431 1,563 561
- Single Family 746 750 1,037 1,133 383
- Multi-Family 250 252 394 430 178 1 – 2010 population and housing estimates based on 2010 Census. 2. – Marion County 2030 Adopted Forecast October, 2009. 3. – 2035 estimate based on 1.85% adjusted annual growth rate adopted by Marion County for the 2030/2035 forecast. 4. – 2030 and 2035 estimates based on 2000 US Census average household size of 3.297. (This is a more conservative estimate than using the 2010 Census average household size of 3.31.) The projected mix of single family and multi-family housing units in 2030 and 2035 is based upon the 2010 Hubbard Comprehensive Plan, which estimates that 27.5 percent of new housing units will be multi-family units and 72.5 percent will be single-family units.
As shown in Tables 4.9 and 4.10, an increase of 622 jobs and 561 housing units (383 single-family/178 multi-family) are anticipated within the City of Hubbard between 2010 and 2035.
EXHIBIT "A"

City of Hubbard TSP, 2012 60
Traffic Analysis Zones In order to evaluate the impacts of anticipated growth, the employment and housing growth was assigned to the traffic network according to Traffic Analysis Zones (TAZs) established as part of the TSP update. The proposed TAZ boundaries are intended to aggregate areas that have common access to major transportation facilities and similar land use patterns. New jobs and households were assigned to each TAZ based on the Hubbard Buildable Land Inventory (MWVCOG, 2008) and planned land uses for UGB expansion areas outlined in the Hubbard Comprehensive Plan.xiv Appendix E includes a map of the TAZs utilized to develop the future forecast for Hubbard and a detailed summary of how trips were assigned to each TAZ.
Trip Generation Trip generation estimates for the growth sectors shown in Tables 4.9 and 4.10 were prepared based on observations found in the standard reference manual, Trip Generation, 8th
Edition, published by the Institute of Transportation Engineers (ITE)xv. The growth sectors were evaluated according to equivalent land uses found in ITE, which were identified by considering characteristics of the various land uses and those of the growth sectors. Appendix E includes a detailed breakdown of the trip generation estimates by TAZ. Trips generated by population and employment growth were assigned to the network according to the trip production and attractions probabilities identified through the Cumulative Analysis procedures in the APM. Appendix E contains a detailed description of the Cumulative Analysis process and the traffic volumes used in this analysis. Background traffic growth was calculated using ODOT 2029 volume forecasts for OR 99E projected to 2035. The trips generated by future job and housing growth were added to the 2035 background volumes. Projected 2035 traffic volumes at study intersections are shown in Figure 4.5.
EXHIBIT "A"
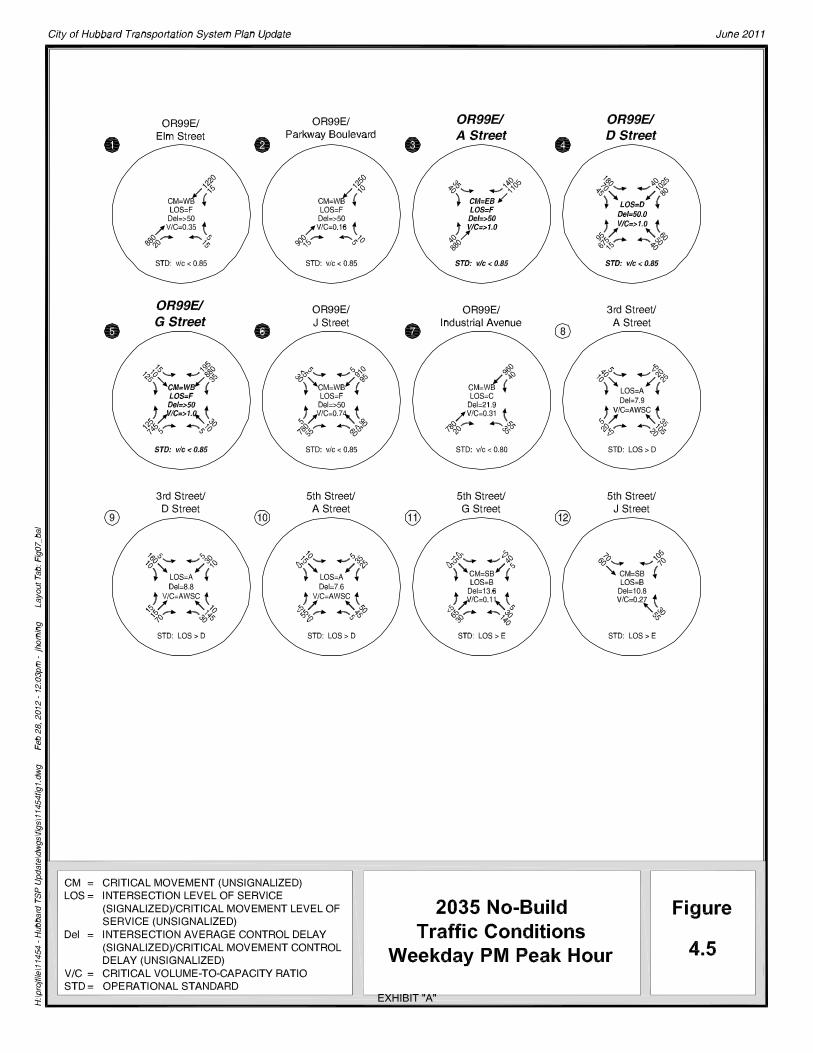
EXHIBIT "A"
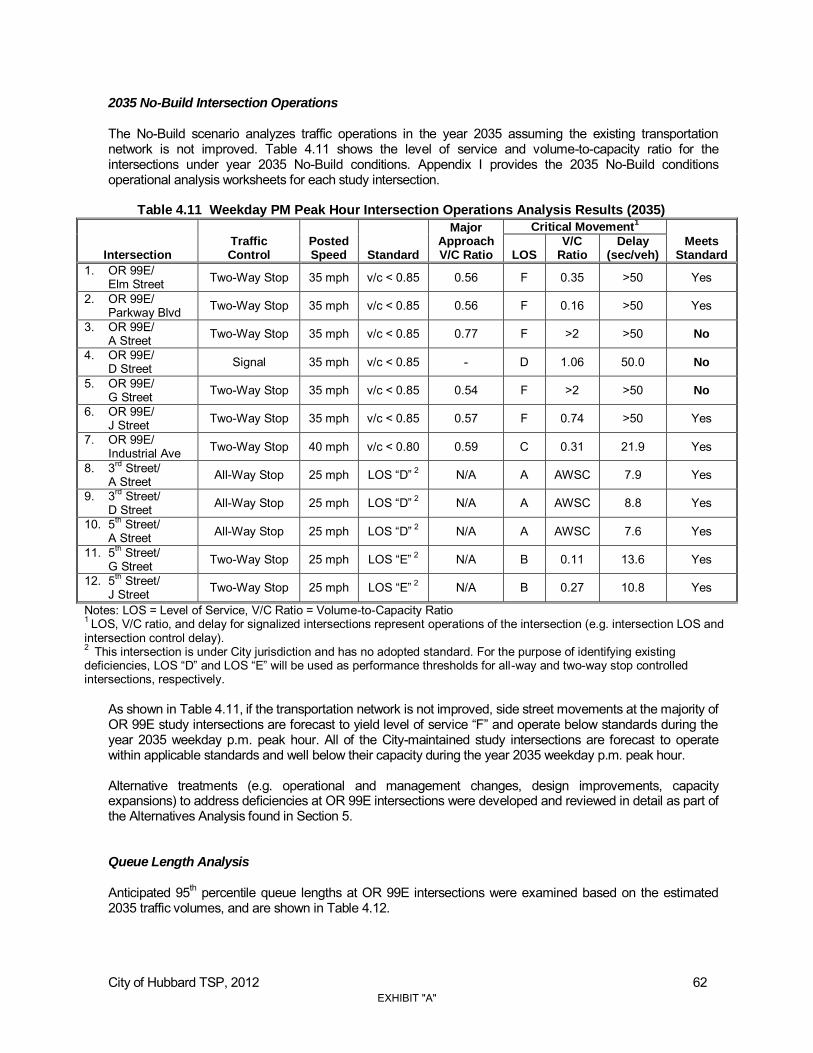
City of Hubbard TSP, 2012 62
2035 No-Build Intersection Operations
The No-Build scenario analyzes traffic operations in the year 2035 assuming the existing transportation network is not improved. Table 4.11 shows the level of service and volume-to-capacity ratio for the intersections under year 2035 No-Build conditions. Appendix I provides the 2035 No-Build conditions operational analysis worksheets for each study intersection.
Table 4.11 Weekday PM Peak Hour Intersection Operations Analysis Results (2035)
Intersection Traffic Control
Posted Speed Standard
Major Approach V/C Ratio
Critical Movement1
Meets Standard LOS
V/C Ratio
Delay (sec/veh)
1. OR 99E/ Elm Street Two-Way Stop 35 mph v/c < 0.85 0.56 F 0.35 >50 Yes
2. OR 99E/ Parkway Blvd Two-Way Stop 35 mph v/c < 0.85 0.56 F 0.16 >50 Yes
3. OR 99E/ A Street Two-Way Stop 35 mph v/c < 0.85 0.77 F >2 >50 No
4. OR 99E/ D Street Signal 35 mph v/c < 0.85 - D 1.06 50.0 No
5. OR 99E/ G Street Two-Way Stop 35 mph v/c < 0.85 0.54 F >2 >50 No
6. OR 99E/ J Street Two-Way Stop 35 mph v/c < 0.85 0.57 F 0.74 >50 Yes
7. OR 99E/ Industrial Ave Two-Way Stop 40 mph v/c < 0.80 0.59 C 0.31 21.9 Yes
8. 3rd Street/ A Street All-Way Stop 25 mph LOS “D”
2 N/A A AWSC 7.9 Yes
9. 3rd Street/ D Street All-Way Stop 25 mph LOS “D”
2 N/A A AWSC 8.8 Yes
10. 5th Street/ A Street All-Way Stop 25 mph LOS “D”
2 N/A A AWSC 7.6 Yes
11. 5th Street/ G Street Two-Way Stop 25 mph LOS “E”
2 N/A B 0.11 13.6 Yes
12. 5th Street/ J Street Two-Way Stop 25 mph LOS “E”
2 N/A B 0.27 10.8 Yes
Notes: LOS = Level of Service, V/C Ratio = Volume-to-Capacity Ratio 1 LOS, V/C ratio, and delay for signalized intersections represent operations of the intersection (e.g. intersection LOS and intersection control delay). 2 This intersection is under City jurisdiction and has no adopted standard. For the purpose of identifying existing deficiencies, LOS “D” and LOS “E” will be used as performance thresholds for all-way and two-way stop controlled intersections, respectively.
As shown in Table 4.11, if the transportation network is not improved, side street movements at the majority of OR 99E study intersections are forecast to yield level of service “F” and operate below standards during the year 2035 weekday p.m. peak hour. All of the City-maintained study intersections are forecast to operate within applicable standards and well below their capacity during the year 2035 weekday p.m. peak hour. Alternative treatments (e.g. operational and management changes, design improvements, capacity expansions) to address deficiencies at OR 99E intersections were developed and reviewed in detail as part of the Alternatives Analysis found in Section 5. Queue Length Analysis Anticipated 95th percentile queue lengths at OR 99E intersections were examined based on the estimated 2035 traffic volumes, and are shown in Table 4.12.
EXHIBIT "A"
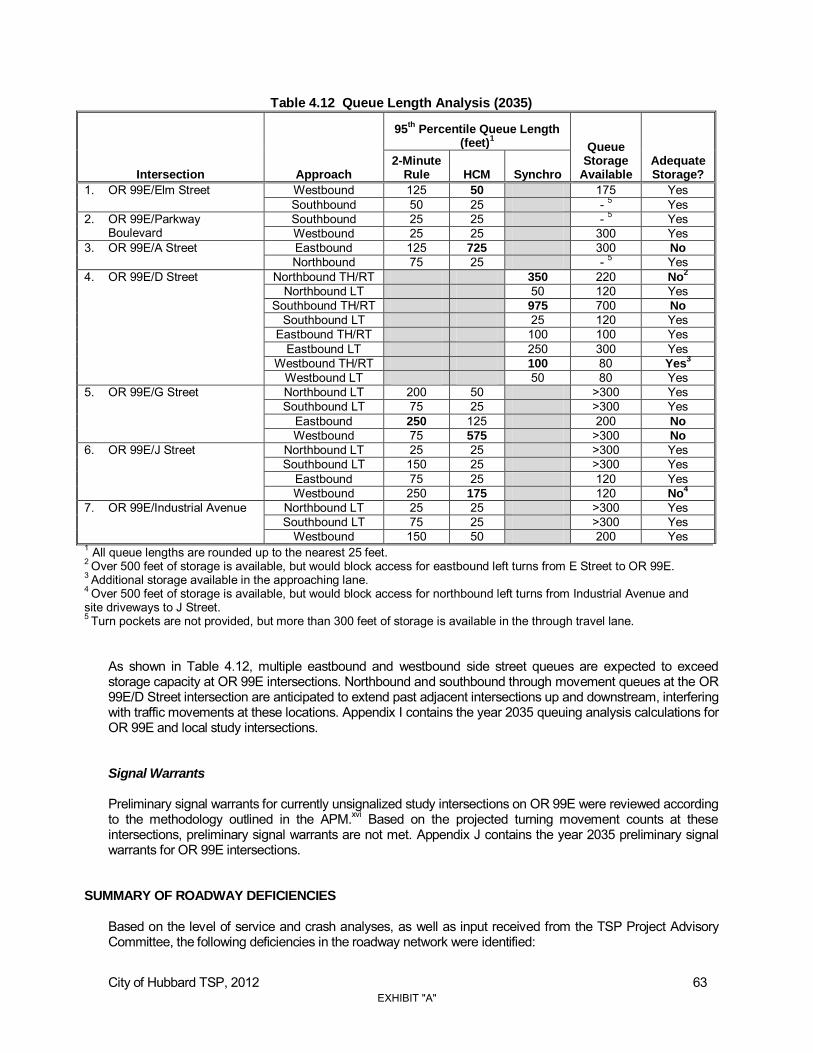
City of Hubbard TSP, 2012 63
Table 4.12 Queue Length Analysis (2035)
Intersection Approach
95th
Percentile Queue Length (feet)
1 Queue
Storage Available
Adequate Storage?
2-Minute Rule HCM Synchro
1. OR 99E/Elm Street Westbound 125 50 175 Yes Southbound 50 25 - 5 Yes
2. OR 99E/Parkway Boulevard
Southbound 25 25 - 5 Yes Westbound 25 25 300 Yes
3. OR 99E/A Street Eastbound 125 725 300 No
Northbound 75 25 - 5 Yes 4. OR 99E/D Street Northbound TH/RT 350 220 No
2
Northbound LT 50 120 Yes Southbound TH/RT 975 700 No
Southbound LT 25 120 Yes Eastbound TH/RT 100 100 Yes
Eastbound LT 250 300 Yes Westbound TH/RT 100 80 Yes
3
Westbound LT 50 80 Yes 5. OR 99E/G Street Northbound LT 200 50 >300 Yes
Southbound LT 75 25 >300 Yes Eastbound 250 125 200 No
Westbound 75 575 >300 No
6. OR 99E/J Street Northbound LT 25 25 >300 Yes Southbound LT 150 25 >300 Yes
Eastbound 75 25 120 Yes Westbound 250 175 120 No
4
7. OR 99E/Industrial Avenue Northbound LT 25 25 >300 Yes Southbound LT 75 25 >300 Yes
Westbound 150 50 200 Yes 1 All queue lengths are rounded up to the nearest 25 feet. 2 Over 500 feet of storage is available, but would block access for eastbound left turns from E Street to OR 99E. 3 Additional storage available in the approaching lane. 4 Over 500 feet of storage is available, but would block access for northbound left turns from Industrial Avenue and site driveways to J Street. 5 Turn pockets are not provided, but more than 300 feet of storage is available in the through travel lane.
As shown in Table 4.12, multiple eastbound and westbound side street queues are expected to exceed storage capacity at OR 99E intersections. Northbound and southbound through movement queues at the OR 99E/D Street intersection are anticipated to extend past adjacent intersections up and downstream, interfering with traffic movements at these locations. Appendix I contains the year 2035 queuing analysis calculations for OR 99E and local study intersections. Signal Warrants Preliminary signal warrants for currently unsignalized study intersections on OR 99E were reviewed according to the methodology outlined in the APM.xvi Based on the projected turning movement counts at these intersections, preliminary signal warrants are not met. Appendix J contains the year 2035 preliminary signal warrants for OR 99E intersections.
SUMMARY OF ROADWAY DEFICIENCIES
Based on the level of service and crash analyses, as well as input received from the TSP Project Advisory Committee, the following deficiencies in the roadway network were identified:
EXHIBIT "A"

City of Hubbard TSP, 2012 64
The existing Roadway Network Plan in the 1999 Hubbard TSP does not incorporate recent
UGB expansion areas. The roadway needs of these areas, including roadway extensions, functional classifications, design standards, and access requirements will need to be addressed in the TSP update. The location(s) of and need for new or extended collector streets should also be reevaluated in new areas within the UGB and some areas outside of the UGB in order to increase accessibility and create alternative routes to OR 99E.
There are only three crossings of the Union Pacific railroad providing east-west connectivity within the City of Hubbard. This creates discontinuities in the roadway grid network and focuses traffic to destinations throughout the City on a limited number of roadway segments.
Many roadways within Hubbard do not meet existing design or access spacing standards. There are not currently marked bicycle lanes on any arterials or collectors within Hubbard and many streets do not have sidewalks, or provide sidewalks narrower than the required 5 to 6 feet. Roadway functional classifications and cross-sectional standards need to be reviewed to determine if there is a desire to achieve these standards over time or if the functional classification and/or corresponding design standard should be modified. The review should focus on OR99E, 3rd Street, and 5th Street in particular and consider the recommendations of the 2003 Hubbard Downtown Development Resource Team Report.
OR 99E within Hubbard has been identified in the SIP as a Category 3 segment (three to five fatal and serious injury crashes in a five-mile segment) and an intersection in Hubbard was identified as a 90th percentile (top 10 percent) SPIS site in 2010. The majority of crashes are located at the intersections of D Street and G Street with OR 99E.
In the 2035 No-Build scenario, side street movements at the majority of OR 99E study intersections are forecast to yield level of service “F” and do not meet standards during the weekday p.m. peak hour.
Preliminary signal warrants are not met at any of the study intersections on OR 99E due to the low traffic volumes on side streets.
PEDESTRIAN AND BICYCLE NETWORK
The following sections document the existing and future conditions and deficiencies for the pedestrian and bicycle network.
EXISTING CONDITIONS
Pedestrian System Pedestrian facilities serve a variety of needs, including:
Relatively short trips (under a mile) to local destinations and pedestrian attractors, such as schools, parks, stores, and public facilities (e.g., libraries, recreation centers, community centers);
Recreational trips (e.g., jogging or hiking) and circulation within parklands; and Local commute trips, where residents have chosen to live near where they work. Within small communities such as Hubbard, most origins and destinations are within a ½ to 1-mile
distance, meaning that walking could be employed regularly for a variety of trips.
Section 3 describes existing pedestrian facilities in Hubbard and provides an overview of pedestrian-related goals and policies. Figure 3.4 shows existing sidewalk locations, widths, and conditions in the City of Hubbard. Sidewalks currently exist primarily in newer residential developments (the northwestern portion of the City), on 2nd and 3rd Streets near the historic downtown, and on the eastern half of OR 99E north of D Street. Marked crosswalks are located primarily on 3rd Street and F Street in the downtown area. The D
EXHIBIT "A"
City of Hubbard TSP, 2012 65
Street/OR 99E intersection has marked crosswalks at each approach. This is the only marked pedestrian crossing of OR 99E in Hubbard. Pedestrian crossings of the Union Pacific railroad tracks are provided on the south sides of D Street and G Street. The crossing at D Street is a relatively new, 6 foot wide sidewalk in good condition with ADA compliant curb ramps at both block ends. The crossing at G Street is a less than 5-foot wide asphalt path in poor condition that does not meet Americans with Disabilities Act (ADA) standards. No pedestrian crossing facilities are provided at the A Street railroad crossing. Continuous pedestrian facilities should be provided on collectors and arterials such as OR 99E, 2nd Street, 3rd Street, 5th Street, D Street, G Street, and A Street in order to connect neighborhoods within Hubbard to employment areas and pedestrian attractors such as downtown, restaurants and stores along OR 99E, regional and school bus stops, and Barendse Park. These facilities should separate pedestrians from vehicular traffic and provide continuous connections along roadways. Pedestrian facilities should also provide safe opportunities for pedestrians to cross roadways and the railroad tracks at reasonable intervals. The needs of pedestrians of all ages and abilities should be considered when planning pedestrian facilities (e.g. ADA accessibility, “child-friendly” crossings between parks and residential areas). Bicycle System
Similar to pedestrian facilities, bicycle facilities can serve a variety of trip purposes, including local errands, commute trips, and recreational trips. Section 3 describes existing bicycle facilities in Hubbard and provides an overview of bicycle-related goals and policies. Hubbard currently has no marked bicycle facilities of any kind; however, several streets are designated as shared roadway facilities. Figure 3.5 shows the location of existing shared roadway bicycle facilities in the City of Hubbard. A variety of bicycle facilities are feasible within Hubbard and have been implemented in similar small communities throughout Oregon. ODOT categorizes bicycle facilities into the following four major classifications:
Shared roadway - Bicycles and vehicles share the same roadway area under this classification. The shared roadway facility is best used where there is minimal vehicle traffic to conflict with bicycle traffic.
Shoulder bikeways - This bicycle facility consists of roadways with paved shoulders to accommodate bicycle traffic.
Bike lanes - Separate lane adjacent to the vehicle travel lane for the exclusive use of bicyclists are considered bike lanes.
Bike paths - These bicycle facilities are exclusive bicycle lanes separated from the roadway.
Dedicated bicycle facilities such as bicycle lanes should be provided along major streets such as OR 99E where automobile speeds are higher than 25 miles per hour, volumes are high, or poor sight distance exists. According to the Oregon Bicycle and Pedestrian Plan (Oregon Department of Transportation, 1995), shared roadways are acceptable on the majority of Hubbard local streets where the average daily traffic (ADT) is less than 3,000 vehicles per day. Shared roadway routes may include “sharrow” pavement markings or other signage to alert drivers to the presence of cyclists and to alert cyclists of preferable routes. Bicycle facilities should connect residential neighborhoods to schools, retail centers, and employment areas. Supporting bicycling as a viable alternative to the automobile also requires support facilities, such as secure parking, (particularly at key destinations such as downtown, community centers, and at OR 99E businesses). These facilities are necessary before the bicycle trip will be considered a practical alternative by most potential users.
EXHIBIT "A"

City of Hubbard TSP, 2012 66
FUTURE CONDITIONS
Pedestrian System As shown in Figure 3.4, multiple gaps currently exist in the pedestrian network that limit pedestrian connectivity and impact the comfort and safety of making pedestrian trips within the City. Several pedestrian system improvements are needed to address these issues and increase the attractiveness of walking for a variety of trip purposes. These improvements include:
Creating safe and accessible pedestrian crossings of the Union Pacific Railroad and OR 99E; Developing continuous sidewalks that meet City standards and connect neighborhoods, parks,
bus stops, shopping, employment, and other destinations; and Establishing marked pedestrian crossing locations of collector and arterial streets.
The completion of partial sidewalks in the downtown area and along OR 99E would serve major pedestrian destinations and increase connectivity between these areas and local neighborhoods. Identifying opportunities to implement and/or improve pedestrian crossings through the railroad right-of-way, particularly at A Street and G Street, would help improve east-west connectivity through the City. Pedestrian connections can be created relatively easily while maintaining future railroad capacity and can help to increase safety by encouraging crossing at designated areas with appropriate warning systems. New development in the City of Hubbard should provide adequate pedestrian facilities both within the development and connecting the development to surrounding neighborhoods. This will result in necessary City pedestrian improvements being limited primarily to retrofitting and infilling existing gaps in the pedestrian network. Discussion of specific pedestrian facility needs, cost estimates, and project prioritization, are discussed in Sections 5 and 6 of the TSP. Bicycle System
Similar to the pedestrian system, Hubbard’s bicycle system should connect residential areas throughout the City with parks, shopping, employment, and other destinations. Support facilities such as bike parking are necessary to make cycling a more secure and convenient travel option for local trips such as shopping. Facilities should also support the use of bicycling for intra-city trips for commuting and recreation. The local bicycle network should generally feature designated bicycle lanes on all arterials and on streets carrying more than 3,000 vehicles per day. In Hubbard, this currently includes only OR 99E and D Street. OR 99E currently has wide shoulders to accommodate cyclists through the majority of Hubbard, but signing and pavement markings could be improved to increase awareness of shoulders as a cycling facility. Areas where the shoulder narrows or is shared with traffic, such as the right turn lane at OR 99E/G Street should also be examined to reduce bicycle/vehicle conflicts. Designated bicycle lanes should also be considered on D Street and other collector streets as redevelopment and roadway maintenance occurs. The majority of streets within Hubbard are appropriate for shared roadway bicycle facilities. Signage, pavement markings, and other features should be considered on shared roadway facilities to create a designated bicycle network connecting to destinations throughout the City, improve wayfinding for cyclists, and promote cycling as a travel option. Off-street bicycle facilities also provide transportation options for pedestrians and bicyclists. The Hubbard Parks Master Plan identifies a multi-use path adjacent to Mill Creek that would connect North Marion School (approximately 2 miles north of Hubbard near Boones Ferry Road) to Broadacres Road in southern Hubbard. This path could serve both recreation and transportation purposes and link existing and planned parks throughout Hubbard. Additional opportunities for off-street multi-use paths may exist parallel to the railroad
EXHIBIT "A"
City of Hubbard TSP, 2012 67
right-of-way (with connections to Barendse Park), Whiskey Hill Road, Broadacres Road, and through future development in the UGB expansion areas. Working with ODOT and Marion County to extend bicycle facility improvements on OR 99E or multi-use trails beyond the city limits could increase inter-city bicycle commuting and bicycle recreation and tourism trips to Hubbard. Developing bicycle facilities that connect to existing and future facilities within the City of Woodburn would help to leverage both cities’ investments in active transportation infrastructure.
SUMMARY OF PEDESTRIAN AND BICYCLE DEFICIENCIES
Based on the inventory of existing facilities, as well as input received from the TSP Project Advisory Committee, the following deficiencies in the pedestrian and bicycle networks were identified:
There are many areas where sidewalks are missing or deficient within the City of Hubbard. Some sidewalks are in poor physical condition or too narrow for City design standards. Sidewalks in good condition, at least 5-feet wide should be provided on all collector, arterial, and local streets within city limits. Due to cost constraints, improvements should be prioritized in areas that provide connections to major pedestrian attractors (e.g. parks, downtown, OR 99E).
D Street is currently the only designated pedestrian crossing of OR 99E. Pedestrian crossings of the railroad right-of-way are provided only on the southern side of D Street and G Street, however, the G Street crossing is not ADA accessible. Pedestrian crossing improvements and additional crossing locations should be evaluated to increase east-west pedestrian connectivity
There are currently no marked bicycle facilities in Hubbard. Bicycle lanes are desirable on all collector and arterial roadways; however, roadways with traffic volumes greater than 3,000 vehicles per day (OR 99E and potentially D Street) as well as those that create recreational opportunities or connect major destinations should be the priority.
PUBLIC TRANSPORTATION The following sections document the existing and future conditions and deficiencies for the public transportation network. Existing Conditions
Public transportation for Hubbard residents is provided by the Canby Area Transit System (CATS) and Chemeketa Area Regional Transportation System (CARTS). CATS provides service to Hubbard via its fixed route Orange Line and Dial-A-Ride for customers unable to access the fixed route service. The Orange Line extends from Oregon City (northeast of Hubbard) to Woodburn (southeast of Hubbard) with stops in between in Aurora and Canby. Service on the Orange Line is provided on weekdays from approximately 5:30 a.m. to 8:30 p.m.; headways along the Orange Line route vary between 30-minutes to one-hour depending on the time of day. CARTS has flex routes service provided by Cherriots Salem-Keizer Transit. Reservations 24-hours in advance are required to use the service. The service is available Monday through Friday with the exception of public holidays. It is a shared ride service, so depending on demand, passengers may share rides with others who have made reservations in their area. The service connects to other fixed route services in the region (e.g., Cherriots, CATS). Section 3 provides a full inventory of public transportation services in the Hubbard area, as well as an overview of public transportation-related goals and policies.
EXHIBIT "A"

City of Hubbard TSP, 2012 68
Future Conditions
Future transit conditions in the City of Hubbard could include expanded regional and intercity commuter services (including inter-city rail) and more widespread demand for and awareness of existing transit and rideshare services.
Rail Service
The following sections document the existing and future conditions and deficiencies for the rail network within Hubbard. Existing Conditions
The Union Pacific Railroad bisects the City of Hubbard, running parallel to OR 99E on the west side. This line, known as the Valley Main Line, is the primary north/south line along the West Coast and is used for both freight and passenger rail services, though neither service stops in Hubbard. This line is heavily used for shipping freight and contains long freight trains (~300 - 400 feet) that run at frequent intervals (~20 trips per day). The Federal Railroad Administration (FRA) classifies the UP line in Class 4 condition with a maximum freight speed of 60 miles per hour and a maximum passenger rail speed of 80 mph. Intercity rail passenger service is currently provided on the Valley Main Line by Amtrak for both their Coast Starlight long distance train and Cascades corridor trains. The Coast Starlight operates one (1) train per day in each direction between Seattle and Los Angeles. The Cascades runs three (3) times per day between Portland and Eugene in Oregon. Approximately 5,014 feet of single track and three (3) at-grade crossings of public roads are located inside the UGB. These crossings are located at:
A Street, between 2nd and 3rd streets; D Street, between 2nd and 3rd streets; and G Street, between 2nd and 3rd streets.
These at-grade crossings are protected by automatic signals and gates, which provide a high level of warning at the crossings. While automatic signals provide warnings of approaching trains, grade separated crossings provide the highest level of protection for all crossing users. East-west travel across the railroad in Hubbard is temporarily blocked when trains pass. This blockage causes traffic back-ups and inhibits the local fire station’s ability to respond to events west of the tracks until trains pass (the fire station is located southeast of the railroad tracks on 2nd Street/H Street). Section 3 provides a full inventory of rail service in the Hubbard area, as well as an overview of rail-related goals and policies. Future Conditions
Future rail conditions in Hubbard will likely include increased freight rail volumes and speeds. According to the Oregon Rail Study (2010) significant investment is required to increase passenger service from two (2) to six (6) roundtrips per day, increase average speed from 42 to 65 mph, and improve reliability from 68 percent to 95 percent on-time performance. The 1999 Hubbard TSP recommends applying to the ODOT Rail Crossing Section to reopen the J Street at-grade rail crossing, which was closed when the Public Utilities Commission issued a series of orders between 1978 and 1980 limiting Hubbard to three at-grade rail crossings (there were previously five at-grade crossings
EXHIBIT "A"

City of Hubbard TSP, 2012 69
in Hubbard, the existing crossings plus crossings at J and E Streets). Reopening or creating new at-grade rail crossings is currently strongly discouraged by ODOT due to safety concerns, increasing train speeds and volumes on the corridor, and the limited mobility benefits obtained from new at-grade crossings. Although at-grade crossings improve connectivity when no trains are present, they would not address traffic backups or limited emergency response ability issues that frequently occur when trains are present. As a result, railroad over or under-crossings should be considered if additional crossings are necessary in the long term. An over or under-crossing would cost significantly more to construct than an at-grade crossing and require additional right-of-way for approach ramps and structures, but would provide additional safety and mobility benefits for roadway and rail users. Trains are also not required to sound their horns when approaching grade-separated crossings. Rail crossing alternatives, including crossing locations and types, are presented and evaluated in more detail in Section 5 - Alternatives Analysis.
Air Service
The City of Hubbard is served by the Aurora State Airport and the Salem Municipal Airport. Portland International Airport is the nearest facility for commercial airline travel. Information regarding the Aurora and Salem airports is presented below. The Aurora State Airport is located approximately 5 to 7 miles northeast of Hubbard. Based on information in the Aurora State Airport Master Plan completed in October 2000, it is the busiest State-owned airport and overall fifth busiest airport in Oregon. The airport serves a variety of charter, corporate and recreational users including a commercial helicopter operation at the northeast end of the airport. It is equipped with one 5,000-foot runway with a parallel length taxiway making it feasible to accommodate up to 45,000 pound aircraft with dual landing gear. The 2000 Aurora State Airport Master Plan forecasted an increase in annual take-offs/landings of about 1-2% per year from 2000 to 2020. The Salem Municipal Airport is located approximately 25 miles southwest of Hubbard. The Salem Municipal Airport is frequently referred to as McNary Field; it is located approximately two miles southeast of downtown Salem. The airport is bordered by I-5 to the East and the Pacific Railroad on the West. Currently, the 751 acre airport serves general aviation aircraft and the Oregon Army National Guard – Army Aviation Support Facility. The airport is made up of two jet runways and supporting taxiways. Both runways have recently been resurfaced and grooved. The airport is owned and operated by the City of Salem and is organizationally structured under the Urban Development Department. The Salem Municipal Airport Plan was last updated in 1997.
Pipeline Service and Water Transportation Facilities
There are no regional pipelines nor are there water transportation facilities in the City of Hubbard. The closest pipelines are located along Interstate 5; the pipelines distribute petroleum and gas. The Pudding River is located approximately 2 miles northeast of the City of Hubbard, but does not serve as a water transportation facility.
Transportation Funding
There are a variety of options available for Hubbard to fund its transportation improvements. The following section identifies the funding sources that have contributed to projects within the City over the past fifteen years and forecasts the future funding availability from these existing funding sources.
EXHIBIT "A"

City of Hubbard TSP, 2012 70
In the future it is likely that the transportation program in Hubbard will be funded by a combination of funding sources. The purpose of this section is to provide the City with a reasonable assumption of future funding during the development of transportation alternatives.
Existing Funding
Table 4.13 provides a summary of the funding that has been used for transportation projects within the City of Hubbard over the past twelve years. As shown in Table 4.12 there have been 24 projects completed within Hubbard since 2000. The majority of these projects have been maintenance projects, although several projects have created additional capacity or added new facilities to existing streets (e.g. sidewalks). The funds have been adjusted to year 2010 dollars based on construction cost trends for Oregonxvii. The total dollar value of these projects in year 2010 dollars is approximately $3.6 million.
EXHIBIT "A"

City of Hubbard TSP, 2012 71
Table 4.13 Past Transportation Project Funding
Year Location Improvements Completed Cost 2010 Cost Funding Source
2011 Barendse Park Walking path project $82,700 $82,700 Local Funds Oregon Parks grant
2011 4th Street between H-J Pavement overlay and additional pavement width $26,236 $26,236 Local funds
ODOT SCA grant
2011 1st Street between D-A Pavement overlay and some storm drainage $25,108 $25,108 Local Funds
2010 Hwy 99E between D Street - north city limits Sidewalk, landscaping, lighting $991,000 $991,000 ODOT TE grant
2010 Hwy 99E and Schmidt Lane Street improvements $453,000 $453,000 ODOT IOF grant Private development
2010 4th Street between F-H Pavement overlay and additional pavement width $24,323 $24,323 Local Funds
2010 1st Street between D-G Pavement overlay and additional pavement width and drainage $25,000 $25,000 ODOT SCA grant
2010 E Street between 2nd -99E Pavement overlay $11,014 $11,014 Local Funds 2010 G Street between 7th-3rd Pavement overlay $27,429 $27,429 Local Funds
2009 Hwy 99E and D Street intersection
Signal replacement and street alignment project $890,000 $881,946 ODOT
2009 3rd Street between D-F Pavement overlay $19,955 $19,774 ODOT SCA grant Local Funds
2009 3rd Street between G-J Pavement overlay $35,973 $35,647 ODOT SCA grant Local Funds
2009 7th Street between E-C Pavement overlay $5,614 $5,563 Local Funds 2009 D Street between 7th-9th Pavement overlay $19,736 $19,557 Local Funds
2007-08 D, 3rd, 7th, Casteel streets Street improvements $364,325 $331,067 Local funds ODOT SCA grant
2007-08 3rd -7th streets Foot/Bike Path improvements $18,738 $17,027 Local funds
2006 5th Street between Baines-Barendse Full street improvements $176,851 $156,171 Local funds
ODOT SCA grant
2006 D Street between 4th -5th and 4th Street between D-E Half street improvements $74,165 $65,492 Local funds
2003 B Street between 3rd-6th Pavement overlay and additional pavement width $31,000 $39,471 Local funds
ODOT SCA grant 2003 E Street between 3rd -5th Half street improvements $36,200 $46,092 Local funds 2003 5th Street between D-F Full street improvements $83,600 $106,444 Federal CDBG grant
2003 5th Street between E-F Full street improvements $95,000 $120,959 Local funds ODOT SCA grant
2002 D Street between 2nd-99E Half street improvements $53,500 $71,442 Local funds ODOT SCA grant
2000 5th Street between A-C Pavement overlay $25,000 $36,993 ODOT SCA grant ODOT Funds City Funds
Other
$2,561,823 $697,234 $360,400
$213,485/yr $58,103/yr $30,033/yr
TOTAL $3,619,458 $301,621/yr
CDBG = Community Development Block Grant SCA = Special City Allotment (Dedicated Funds)
As shown in Table 4.13, an average of approximately $301,000 per year in 2010 dollars has been spent within Hubbard on transportation projects since the year 2000. Most of these projects have been maintenance-related (e.g. resurfacing and improving existing streets), as opposed to capital projects (e.g. building new facilities or expanding roadway capacity). The majority of the funds have been provided by ODOT grants. The City of Hubbard has provided approximately $58,000 per year on average for transportation projects. Local transportation funds rely on a portion of gas taxes, a special allotment grant, and System Development Charges (SDCs) charged during the building and remodeling of residences and businesses. A major decline in this revenue over the past 3 years has restricted the ability to make major improvements and upgrades to the City’s streets, foot/bike paths and storm drain
EXHIBIT "A"
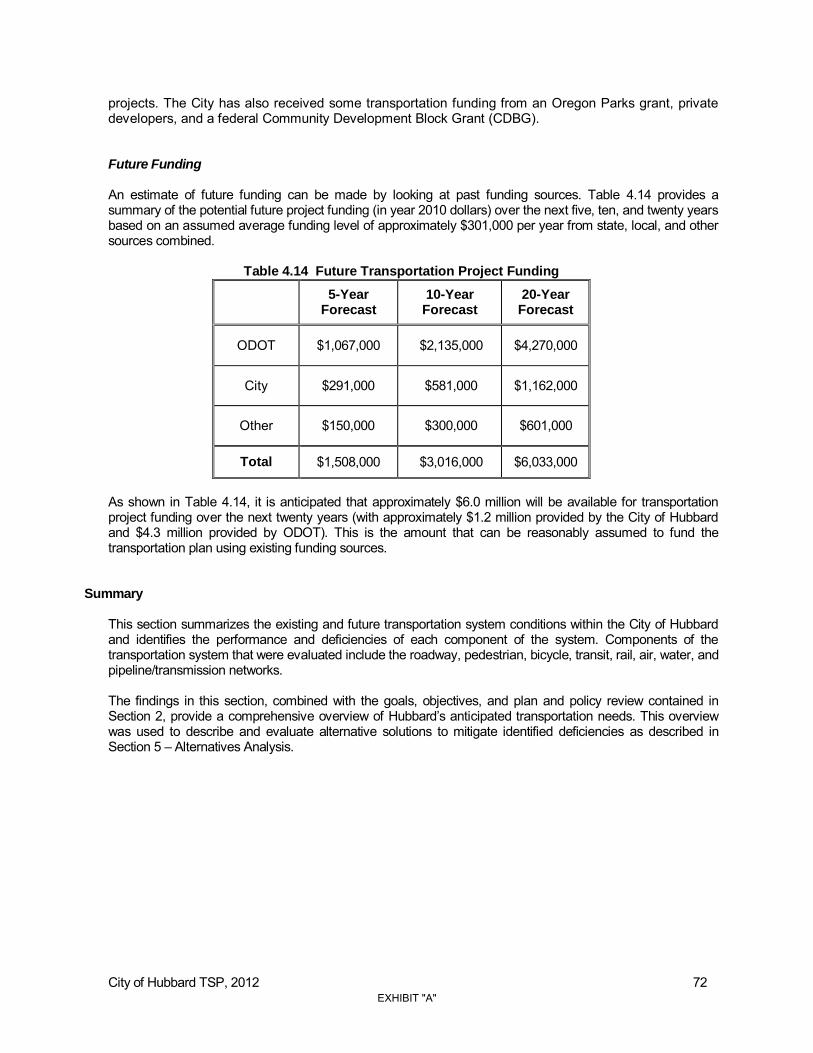
City of Hubbard TSP, 2012 72
projects. The City has also received some transportation funding from an Oregon Parks grant, private developers, and a federal Community Development Block Grant (CDBG). Future Funding An estimate of future funding can be made by looking at past funding sources. Table 4.14 provides a summary of the potential future project funding (in year 2010 dollars) over the next five, ten, and twenty years based on an assumed average funding level of approximately $301,000 per year from state, local, and other sources combined.
Table 4.14 Future Transportation Project Funding
5-Year
Forecast 10-Year
Forecast 20-Year
Forecast
ODOT $1,067,000 $2,135,000 $4,270,000
City $291,000 $581,000 $1,162,000
Other $150,000 $300,000 $601,000
Total $1,508,000 $3,016,000 $6,033,000
As shown in Table 4.14, it is anticipated that approximately $6.0 million will be available for transportation project funding over the next twenty years (with approximately $1.2 million provided by the City of Hubbard and $4.3 million provided by ODOT). This is the amount that can be reasonably assumed to fund the transportation plan using existing funding sources.
Summary
This section summarizes the existing and future transportation system conditions within the City of Hubbard and identifies the performance and deficiencies of each component of the system. Components of the transportation system that were evaluated include the roadway, pedestrian, bicycle, transit, rail, air, water, and pipeline/transmission networks. The findings in this section, combined with the goals, objectives, and plan and policy review contained in Section 2, provide a comprehensive overview of Hubbard’s anticipated transportation needs. This overview was used to describe and evaluate alternative solutions to mitigate identified deficiencies as described in Section 5 – Alternatives Analysis.
EXHIBIT "A"

City of Hubbard TSP, 2012 73
EXHIBIT "A"

City of Hubbard TSP, 2012 74
Section 5 Alternatives
Analysis
EXHIBIT "A"
City of Hubbard TSP, 2012 75
Alternatives Analysis The following section summarizes the alternatives analysis completed to address the future transportation deficiencies identified for the roadway, pedestrian, bicycle, rail and public transit systems in the Existing and Future Conditions Section. This section also includes an evaluation of the various transportation alternatives, including cost estimates of the alternative solutions, as compared to projected future transportation funding. ROADWAY ALTERNATIVES
The primary focus of the roadway alternatives analysis included the development of alternatives to determine the appropriate street cross section for OR Highway 99E in Hubbard. The roadway alternatives analysis also includes an evaluation of existing city roadway functional classifications and cross-sectional standards and modifications to enable design flexibility and facilities that better reflect forecast demand.
OR 99E Cross Section
Five alternatives were analyzed to determine the appropriate cross-section to serve projected future demand on OR 99E within Hubbard. These alternatives include:
1. Extending the 3-lane cross section north from D Street to the UGB; 2. Extending the 3-lane cross section north from D Street to the UGB and adding a traffic signal at
OR 99E/G Street; 3. Constructing a 5-lane cross section through the entire length of Hubbard. 4. Extending the 3-lane cross section north from D Street to the UGB and constructing a 5-lane
cross section between D and G Streets. 5. Extending the 3-lane cross section north from D Street to the UGB and constructing a
southbound through/right-turn lane between A Street and Schmidt Lane.
In the 2035 No-Build operations analysis, minor street movements at the intersections of OR 99E with A St, D St, and G St are forecast to exceed capacity (V/C >1.0) and yield a level of service “F” during the p.m. peak hour. The alternatives presented below are primarily intended to provide additional capacity for increased traffic volumes on OR 99E and to reduce queuing and delay for traffic crossing and entering OR 99E from local streets. OR 99E is a designated state freight route. ORS 366.215 states the Oregon Transportation Commission may not permanently reduce the vehicle-carrying capacity of an identified freight route.xviii As a result, all projects on OR 99E will be subject to ORS 366.215 review to determine the potential for a reduction of freight capacity. Any structures or obstacles in the right-of-way such as signs, guardrails, landscaping, or other roadside features and any changes to travel lanes will be subject to a review process before they can be built. Although the alternatives described below are intended to increase overall operations and vehicle carrying capacity of OR 99E, these planning concepts may potentially reduce freight vehicle-carrying capacity of the highway; further evaluation of the project designs will be required at the time of implementation to ensure compliance with ORS 366.215.
Alternative 1: Extend the 3-Lane Cross Section North from D Street to the UGB
Alternative 1 assumes the existing transportation network is unchanged under 2035 conditions, except for the extension of the 3-lane cross section on OR 99E northeast from the OR 99E/D Street intersection to the Urban Growth Boundary (UGB). The roadway inventory indicates 80 feet of right-of-way and 51 feet of pavement on this section of OR 99E. The existing right-of-way is adequate to accommodate a 14 to16 foot two-way left-turn lane, consistent with
EXHIBIT "A"

City of Hubbard TSP, 2012 76
existing ODOT Highway Design Standards and Hubbard Street Design Standards.xix The extension of the 3-lane cross section could be pursued as a stand-alone project or as a larger retrofit project to bring the segment of OR 99E north of D Street up to existing design standards. The existing right-of-way is adequate to accommodate the sidewalk, bikeway, and landscaping requirements outlined in the major arterial street design standards, assuming a 3-lane cross section.xx Figure 5.1 illustrates the assumed lane configurations, traffic controls, and 2035 operational analysis under this alternative. The 2035 traffic operations for this alternative are also summarized in Table 5.1.
Table 5.1 Alternative 1 (Extend 3-Lane Cross Section) Operational Analysis Results (2035)
Intersection Traffic Control
Posted Speed Standard
Major Approach V/C Ratio
Critical Movement1
Impacted by Alternative?
Meets Standard LOS
V/C Ratio
Delay (sec/veh)
1. OR 99E/ Elm Street
Two-Way Stop
35 mph v/c < 0.85 0.75 C 0.09 22.1 Yes Yes
2. OR 99E/ Parkway Blvd
Two-Way Stop
35 mph v/c < 0.85 0.76 C 0.04 19.1 Yes Yes
3. OR 99E/ A Street
Two-Way Stop
35 mph v/c < 0.85 0.77 D 0.39 33.9 Yes Yes
4. OR 99E/ D Street Signal 35 mph v/c <
0.85 - D 1.06 50.0 No No
5. OR 99E/ G Street
Two-Way Stop
35 mph v/c < 0.85 0.54 F >2 >50 No No
6. OR 99E/ J Street
Two-Way Stop
35 mph v/c < 0.85 0.57 F 0.74 >50 No Yes
7. OR 99E/ Industrial Ave
Two-Way Stop
40 mph v/c < 0.80 0.59 C 0.31 21.9 No Yes
Notes: LOS = Level of Service, V/C Ratio = Volume-to-Capacity Ratio 1 LOS, V/C ratio, and delay for signalized intersections represent operations of the intersection (e.g. intersection LOS and intersection control delay).
As shown in Table 5.1, the A Street intersection is anticipated to meet ODOT performance standards in 2035 if the 3-lane cross section is extended north. Operations would also improve at the OR 99E/Elm Street and OR 99E/Parkway Blvd intersections. These intersections were forecast to meet ODOT’s performance standards, but operate at level of service “F” with more than 50 seconds of delay in the No-Build alternative. No downstream traffic impacts are anticipated from extending the 3-lane cross section north; the OR 99E/D Street and OR 99E/G Street intersections are expected to continue to operate over capacity (v/c > 1.0) under Alternative 1.
EXHIBIT "A"

EXHIBIT "A"

City of Hubbard TSP, 2012 78
A queuing analysis was also conducted for Alternative 1. Table 5.2 illustrates the anticipated queues at OR 99E study intersections if the 3-lane cross section were extended. The 95th percentile queue lengths were identified for each approach using the Two-Minute Rule and HCM equation 17-37 for two-way stop controlled intersections and Synchro for signalized intersections. The traffic operations and queuing analysis worksheets for Alternative 1 are also provided in Appendix K.
Table 5.2 Alternative 1 (Extend 3-Lane Cross Section) Queue Length Analysis (2035)
Intersection Approach
95th
Percentile Queue Length (feet)
1 Queue
Storage Available
Impacted by
Alternative? Adequate Storage?
2-Minute Rule HCM Synchro
8. OR 99E/ Elm Street
Westbound 25 25 - 1752 Yes Yes
Southbound LT 25 25 - 300 Yes Yes 9. OR 99E/
Parkway Boulevard
Westbound 25 25 - 3002 No Yes
Southbound LT 25 25 - 300 No Yes
10. OR 99E/ A Street
Eastbound 75 50 - 3002 Yes Yes Northbound LT 75 25 - 360 No Yes
11. OR 99E/ D Street
Northbound TH/RT - - 350 2202 No No3
Northbound LT - - 50 120 No Yes Southbound TH/RT - - 975 7002 No No
Southbound LT - - 25 360 No Yes Eastbound TH/RT - - 100 1002 No Yes
Eastbound LT - - 250 300 No Yes Westbound TH/RT - - 100 802 No No
4
Westbound LT - - 50 80 No No2
12. OR 99E/ G Street
Northbound LT 200 50 - >300 No Yes Southbound LT 75 25 - >300 No Yes
Eastbound 250 125 - 2002 No No
Westbound 75 575 - >3002 No No
13. OR 99E/ J Street
Northbound LT 25 25 - >300 No Yes Southbound LT 150 25 - >300 No Yes
Eastbound 75 25 - 1202 No Yes Westbound 250 175 - 1202 No No
5
14. OR 99E/ Industrial Avenue
Northbound LT 25 25 - >300 No Yes Southbound LT 75 25 - >300 No Yes
Westbound 150 50 - 2002 No Yes 1 All queue lengths are rounded up to the nearest 25 feet. 2 Turn pockets are not provided, so turning traffic must queue within the through travel lane. 3 Over 500 feet of through travel lane is available, but queues would block access for eastbound left turns from E Street to OR 99E. 4 Additional storage is available in the approaching lane. 5 Over 500 feet of through travel lane is available, but queues would block access for northbound left turns from Industrial Avenue and site driveways to J Street.
As shown in Table 5.2, under Alternative 1 the anticipated 95th percentile queues can be accommodated in the available storage at the Elm Street, Parkway Boulevard, and A Street intersections. (Under the No-Build scenario, queues at the eastbound approach to the OR 99E/A Street intersection were expected to significantly exceed storage.) However, queuing is not decreased at any intersections other than OR 99E/A Street and OR 99E/Elm Street under this alternative. No downstream impacts are anticipated from extending the 3-lane cross section north; queues at the OR 99E/D Street, OR 99E/G Street, and OR 99E/J Street intersections are expected to continue to exceed available storage under Alternative 1.
Alternative 2: Extend 3-Lane Cross Section and Add a Traffic Signal at G Street Alternative 2 assumes the existing transportation network is unchanged under 2035 conditions, except for the addition of a traffic signal at the OR 99E/G Street intersection and the extension of the 3-lane cross section on
EXHIBIT "A"

City of Hubbard TSP, 2012 79
OR 99E northeast from the OR 99E/D Street intersection to the Urban Growth Boundary (UGB). Other modifications such as the addition of a southbound right turn lane at the OR 99E/D Street intersection and east and westbound left turn lanes at the OR 99E/G Street intersection were also considered under this alternative. The OR 99E/G Street intersection does not meet ODOT signal spacing standards or preliminary signal warrants based on projected 2035 traffic volumes.xxi Appendix J includes the year 2035 preliminary signal warrant for the OR 99E/G Street intersection. In the future this intersection may meet signal warrants due to multiple reasons (although meeting warrants does not guarantee a signal will be installed):
Poor operations at the OR 99E/D Street intersection or other factors cause vehicles to divert to G Street. A 45% increase in 8th highest, 4th highest, or peak hour volumes on this approach would likely warrant a signal under “Case 2: Interruption of Continuous Traffic”. If a signal were installed at G Street, diverted traffic would likely be adequate to meet this warrant.
The need for a coordinated signal system to create adequate vehicle platooning (Warrant 6); An increase in crashes at the intersection (five of more crashes in a 12 month period) that
cannot be satisfactorily reduced through other treatments (Warrant 7); or An increase in future projected traffic volumes or increase in weekend traffic resulting in more
than 1,000 vehicles entering the intersection per hour (Warrant 8). A traffic signal at the OR 99E/G Street intersection would help to control the progression of traffic on OR 99E through Hubbard, enabling vehicles to more safely and easily enter or cross OR 99E from G Street and other local streets (due to platooning). The signal would provide a second protected OR 99E crossing location for pedestrians. It is also likely that a portion of eastbound through and left turn movements that would otherwise use the existing signal at D Street will be diverted to the G Street intersection. This will relieve a portion of the demand on D Street, which is forecast to operate over capacity (V/C >1.0) with queues exceeding the available storage in 2035. xxii Turn lane warrants were also reviewed for intersections that are forecast to operate at or near capacity in 2035 with a 3-lane cross section. The ODOT Analysis Procedures Manual states: “At signalized intersections a left turn lane is always desirable, while a right turn lane is generally determined based on signal capacity needs.” Based on capacity constraints at the D Street signal and projected right turn volumes, a southbound right turn lane should be considered at this intersection. In addition, east and westbound left turn lanes should be considered with the installation of the traffic signal at G Street.xxiii
Figure 5.2 illustrates the assumed lane configurations, traffic controls, and 2035 operational analysis under Alternative 2. Year 2035 traffic operations for this alternative are also summarized in Table 5.3.
As shown in Table 5.3, although traffic diversion to the G Street signal is expected to prevent the D Street intersection from operating over capacity (v/c > 1.0) in 2035, the D Street intersection is not anticipated meet ODOT performance standards under Alternative 2. Installation of a southbound right turn lane would slightly reduce congestion and delay at the intersection and improve level of service. Installation of a signal at the OR 99E/G Street intersection is expected to enable the intersection to operate under capacity in 2035, but the intersection still would not meet ODOT performance standards. Constructing left turn lanes on the eastbound and westbound approaches in conjunction with installation of a signal would improve performance significantly and allow the intersection to operate below a v/c ratio of 0.85. Installation of a signal at the OR 99E/G Street intersection is also expected to improve performance at the OR 99E/J Street intersection due to westbound left turns that will likely be diverted to the signal.
EXHIBIT "A"

City of Hubbard TSP, 2012 80
Table 5.3 Alternative 2 (Extend 3-Lane Cross Section and Add Signal) Operational Analysis Results (2035)
Intersection Traffic Control
Posted Speed Standard
Major Approach V/C Ratio
Critical Movement1
Impacted by Alternative?
Meets Standard LOS
V/C Ratio
Delay (sec/veh)
Added Signal Only
1. OR 99E/ Elm Street
Two-Way Stop
35 mph v/c < 0.85 0.75 C 0.09 22.1 Yes Yes
2. OR 99E/ Parkway Blvd
Two-Way Stop
35 mph v/c < 0.85 0.76 C 0.04 19.1 Yes Yes
3. OR 99E/ A Street
Two-Way Stop
35 mph v/c < 0.85 0.77 D 0.38 33.4 Yes Yes
4. OR 99E/ D Street
Signal (with 3-
lane cross-
section)
35 mph v/c < 0.85 - D 0.98 37.5 Yes No
5. OR 99E/ G Street
Signal (with 3-
lane cross-
section)
35 mph v/c < 0.85 - C 0.92 28.9 Yes No
6. OR 99E/ J Street
Two-Way Stop
35 mph v/c < 0.85 0.57 E 0.63 47.2 Yes Yes
7. OR 99E/ Industrial Ave
Two-Way Stop
40 mph v/c < 0.80 0.59 C 0.31 21.9 No Yes
Added Signal and Turn Lanes
1. OR 99E/ Elm Street
Two-Way Stop
35 mph v/c < 0.85 0.75 C 0.09 22.1 Yes Yes
2. OR 99E/ Parkway Blvd
Two-Way Stop
35 mph v/c < 0.85 0.76 C 0.04 19.1 Yes Yes
3. OR 99E/ A Street
Two-Way Stop
35 mph v/c < 0.85 0.77 D 0.38 33.4 Yes Yes
4. OR 99E/ D Street
Signal (with
added SB RT lane)
35 mph v/c < 0.85 - C 0.94 30.2 Yes No
5. OR 99E/ G Street
Signal (with
EB/WB LT lane)
35 mph v/c < 0.85 - B 0.82 18.5 Yes Yes
6. OR 99E/ J Street
Two-Way Stop
35 mph v/c < 0.85 0.57 E 0.62 46.3 Yes Yes
7. OR 99E/ Industrial Ave
Two-Way Stop
40 mph v/c < 0.80 0.59 C 0.31 21.9 No Yes
Notes: LOS = Level of Service, V/C Ratio = Volume-to-Capacity Ratio 1 LOS, V/C ratio, and delay for signalized intersections represent operations of the intersection (e.g. intersection LOS and intersection control delay).
EXHIBIT "A"
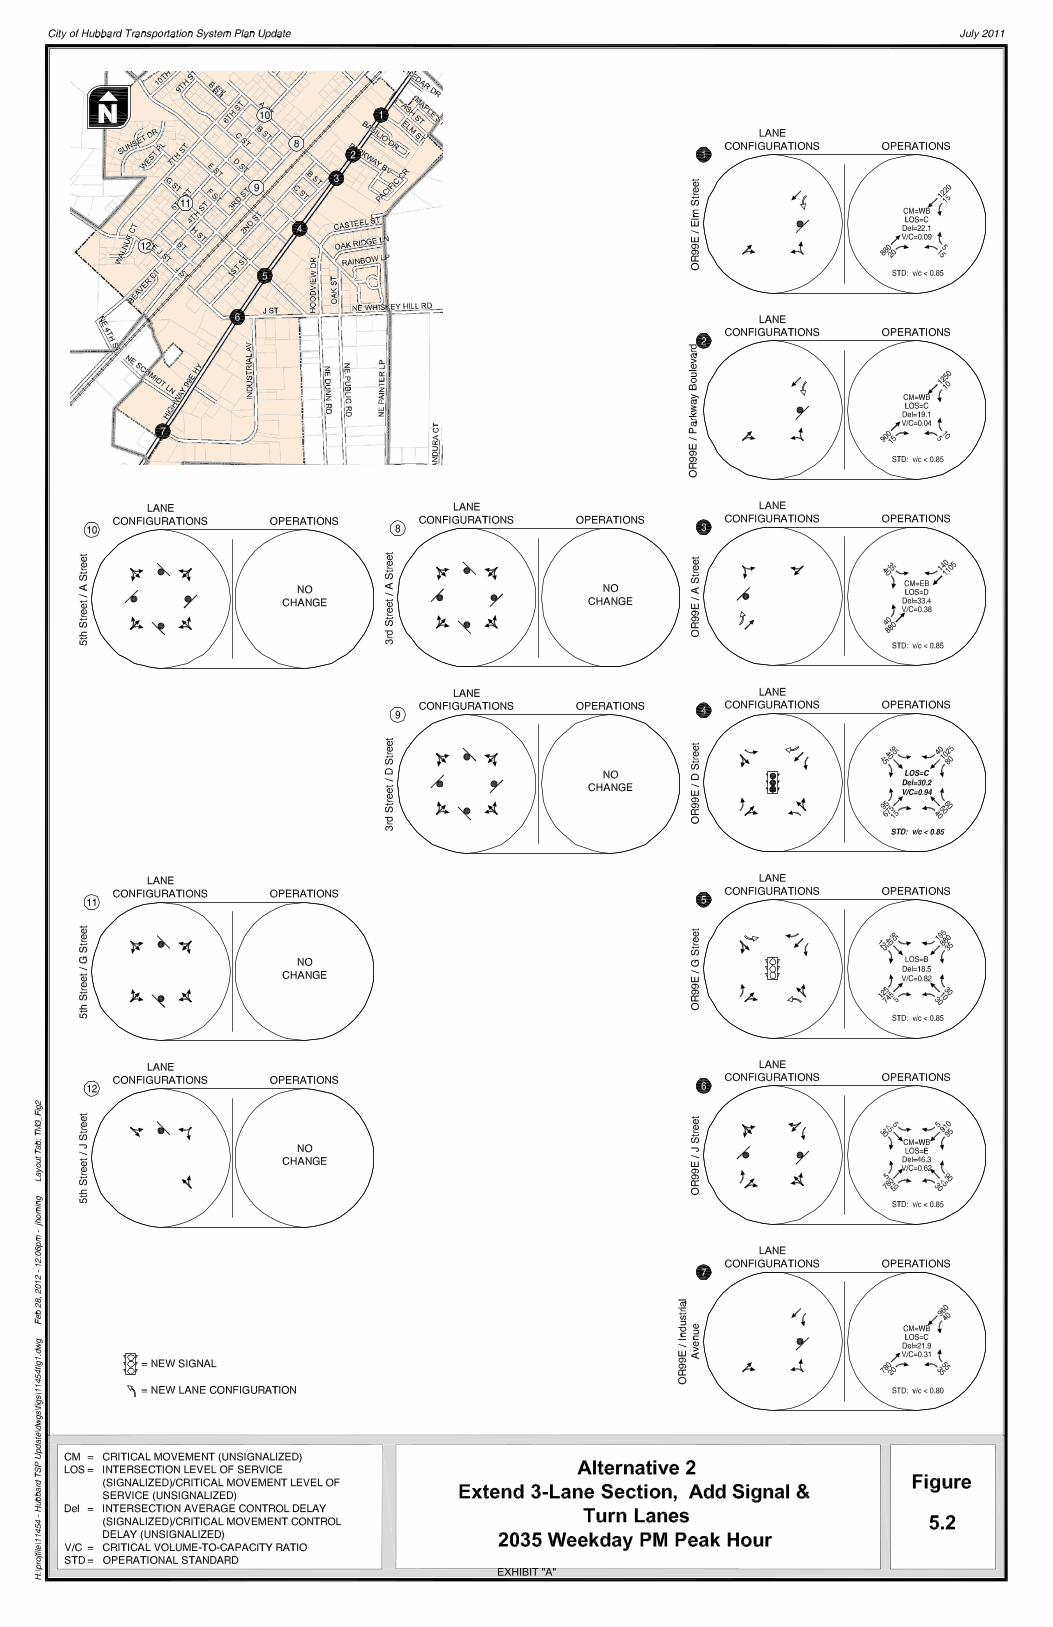
EXHIBIT "A"
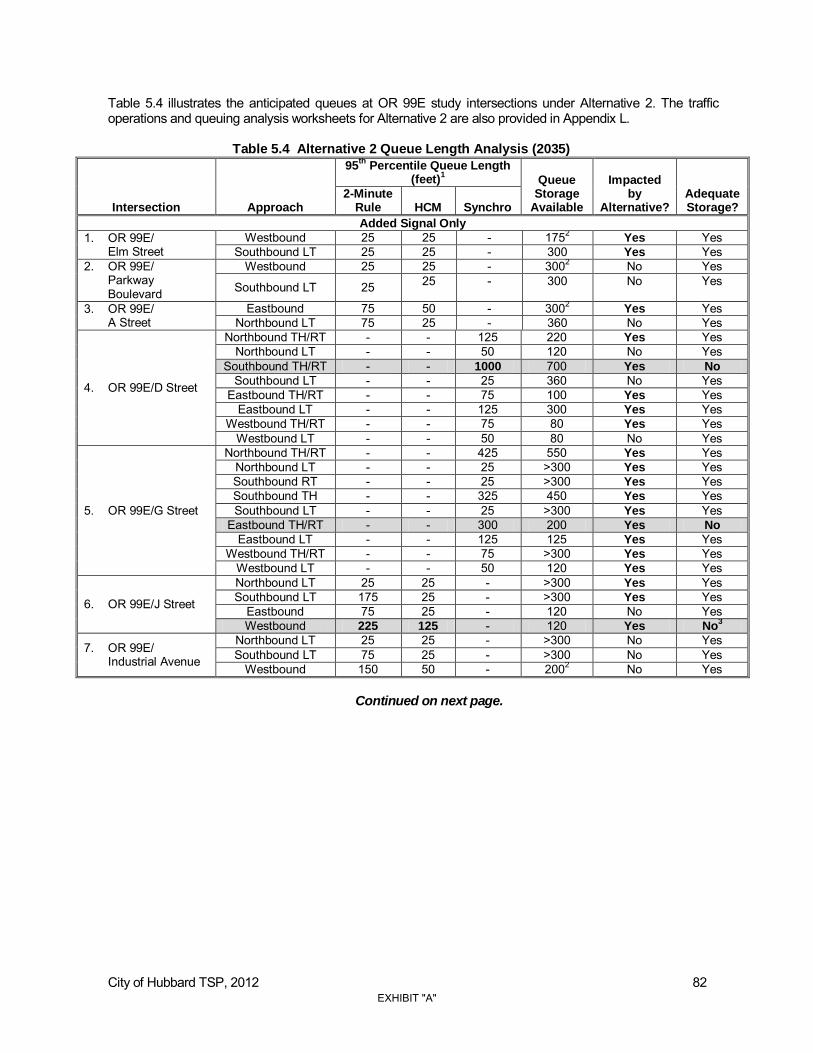
City of Hubbard TSP, 2012 82
Table 5.4 illustrates the anticipated queues at OR 99E study intersections under Alternative 2. The traffic operations and queuing analysis worksheets for Alternative 2 are also provided in Appendix L.
Table 5.4 Alternative 2 Queue Length Analysis (2035)
Intersection Approach
95th
Percentile Queue Length (feet)
1 Queue
Storage Available
Impacted by
Alternative? Adequate Storage?
2-Minute Rule HCM Synchro
Added Signal Only
1. OR 99E/ Elm Street
Westbound 25 25 - 1752 Yes Yes
Southbound LT 25 25 - 300 Yes Yes 2. OR 99E/
Parkway Boulevard
Westbound 25 25 - 3002 No Yes
Southbound LT 25 25 - 300 No Yes
3. OR 99E/ A Street
Eastbound 75 50 - 3002 Yes Yes Northbound LT 75 25 - 360 No Yes
4. OR 99E/D Street
Northbound TH/RT - - 125 220 Yes Yes
Northbound LT - - 50 120 No Yes Southbound TH/RT - - 1000 700 Yes No
Southbound LT - - 25 360 No Yes Eastbound TH/RT - - 75 100 Yes Yes
Eastbound LT - - 125 300 Yes Yes Westbound TH/RT - - 75 80 Yes Yes
Westbound LT - - 50 80 No Yes
5. OR 99E/G Street
Northbound TH/RT - - 425 550 Yes Yes Northbound LT - - 25 >300 Yes Yes Southbound RT - - 25 >300 Yes Yes Southbound TH - - 325 450 Yes Yes Southbound LT - - 25 >300 Yes Yes
Eastbound TH/RT - - 300 200 Yes No
Eastbound LT - - 125 125 Yes Yes
Westbound TH/RT - - 75 >300 Yes Yes
Westbound LT - - 50 120 Yes Yes
6. OR 99E/J Street
Northbound LT 25 25 - >300 Yes Yes Southbound LT 175 25 - >300 Yes Yes
Eastbound 75 25 - 120 No Yes Westbound 225 125 - 120 Yes No
3
7. OR 99E/ Industrial Avenue
Northbound LT 25 25 - >300 No Yes Southbound LT 75 25 - >300 No Yes
Westbound 150 50 - 2002 No Yes
Continued on next page.
EXHIBIT "A"
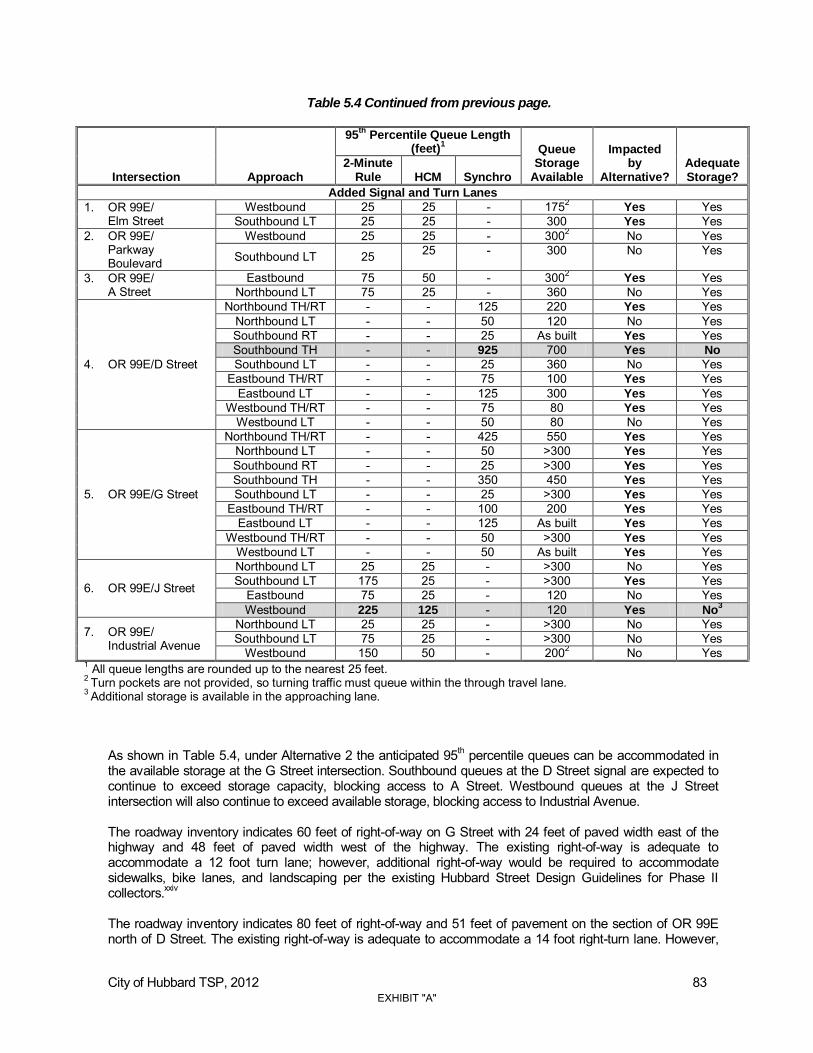
City of Hubbard TSP, 2012 83
Table 5.4 Continued from previous page.
Intersection Approach
95th
Percentile Queue Length (feet)
1 Queue
Storage Available
Impacted by
Alternative? Adequate Storage?
2-Minute Rule HCM Synchro
Added Signal and Turn Lanes
1. OR 99E/ Elm Street
Westbound 25 25 - 1752 Yes Yes
Southbound LT 25 25 - 300 Yes Yes 2. OR 99E/
Parkway Boulevard
Westbound 25 25 - 3002 No Yes
Southbound LT 25 25 - 300 No Yes
3. OR 99E/ A Street
Eastbound 75 50 - 3002 Yes Yes Northbound LT 75 25 - 360 No Yes
4. OR 99E/D Street
Northbound TH/RT - - 125 220 Yes Yes
Northbound LT - - 50 120 No Yes Southbound RT - - 25 As built Yes Yes Southbound TH - - 925 700 Yes No
Southbound LT - - 25 360 No Yes Eastbound TH/RT - - 75 100 Yes Yes
Eastbound LT - - 125 300 Yes Yes Westbound TH/RT - - 75 80 Yes Yes
Westbound LT - - 50 80 No Yes
5. OR 99E/G Street
Northbound TH/RT - - 425 550 Yes Yes Northbound LT - - 50 >300 Yes Yes Southbound RT - - 25 >300 Yes Yes Southbound TH - - 350 450 Yes Yes Southbound LT - - 25 >300 Yes Yes
Eastbound TH/RT - - 100 200 Yes Yes
Eastbound LT - - 125 As built Yes Yes
Westbound TH/RT - - 50 >300 Yes Yes
Westbound LT - - 50 As built Yes Yes
6. OR 99E/J Street
Northbound LT 25 25 - >300 No Yes Southbound LT 175 25 - >300 Yes Yes
Eastbound 75 25 - 120 No Yes Westbound 225 125 - 120 Yes No
3
7. OR 99E/ Industrial Avenue
Northbound LT 25 25 - >300 No Yes Southbound LT 75 25 - >300 No Yes
Westbound 150 50 - 2002 No Yes 1 All queue lengths are rounded up to the nearest 25 feet. 2 Turn pockets are not provided, so turning traffic must queue within the through travel lane. 3 Additional storage is available in the approaching lane.
As shown in Table 5.4, under Alternative 2 the anticipated 95th percentile queues can be accommodated in the available storage at the G Street intersection. Southbound queues at the D Street signal are expected to continue to exceed storage capacity, blocking access to A Street. Westbound queues at the J Street intersection will also continue to exceed available storage, blocking access to Industrial Avenue. The roadway inventory indicates 60 feet of right-of-way on G Street with 24 feet of paved width east of the highway and 48 feet of paved width west of the highway. The existing right-of-way is adequate to accommodate a 12 foot turn lane; however, additional right-of-way would be required to accommodate sidewalks, bike lanes, and landscaping per the existing Hubbard Street Design Guidelines for Phase II collectors.xxiv The roadway inventory indicates 80 feet of right-of-way and 51 feet of pavement on the section of OR 99E north of D Street. The existing right-of-way is adequate to accommodate a 14 foot right-turn lane. However,
EXHIBIT "A"

City of Hubbard TSP, 2012 84
additional right-of-way would be required to accommodate sidewalks, bike lanes, and landscaping per the existing Hubbard Street Design Guidelines for major arterials.xxv An alternative mitigation measure that was recommended at the Project Advisory Committee meeting was installing a “pork chop” median at the OR 99E/A Street intersection to limit movements to right-in/right-out/left-in. The project team reviewed this option, but the eastbound left turn movements diverted to the D Street signal would cause the intersection to exceed capacity and worsen existing queuing issues.
Alternative 3: Construct a 5-Lane Cross Section through the Entire Length of Hubbard Alternative 3 assumes the adoption of a 5-lane cross section on OR 99E within the Hubbard UGB. No additional traffic signals or minor street turn lanes are assumed in this alternative. A 5-lane cross section is consistent with existing Hubbard Street Design Standards for major arterials. Under this alternative, all study intersections meet ODOT performance standards and there are no queue storage issues. The roadway inventory indicates 80 feet of right-of-way and 44 to 58 feet of pavement on OR 99E within Hubbard. The existing ODOT Highway Design Standards and Hubbard Street Design Standards require a 100 foot right-of-way to accommodate four 12 foot travel lanes, a 16 foot two-way left-turn lane, sidewalks, bike lanes, and landscaping.xxvi The existing right-of-way is not adequate to accommodate this alternative. Figure 5.3 illustrates the assumed lane configurations, traffic controls, and 2035 operational analysis under Alternative 3. Year 2035 traffic operations for this alternative are also summarized in Table 5.5.
Table 5.5 Alternative 3 (5-Lane Cross Section Throughout Hubbard) Operational Analysis Results (2035)
Intersection Traffic Control
Posted Speed Standard
Major Approach V/C Ratio
Critical Movement1
Impacted by Alternative?
Meets Standard LOS
V/C Ratio
Delay (sec/veh)
1. OR 99E/ Elm Street
Two-Way Stop
35 mph v/c < 0.85 0.38 C 0.07 16.5 Yes Yes
2. OR 99E/ Parkway Blvd
Two-Way Stop
35 mph v/c < 0.85 0.38 B 0.02 12.6 Yes Yes
3. OR 99E/ A Street
Two-Way Stop
35 mph v/c < 0.85 0.45 D 0.28 22.6 Yes Yes
4. OR 99E/ D Street Signal 35 mph v/c <
0.85 - B 0.69 15.3 Yes Yes
5. OR 99E/ G Street
Two-Way Stop
35 mph v/c < 0.85 0.36 C 0.16 19.2 Yes Yes
6. OR 99E/ J Street
Two-Way Stop
35 mph v/c < 0.85 0.37 D 0.51 27.6 Yes Yes
7. OR 99E/ Industrial Ave
Two-Way Stop
40 mph v/c < 0.80 0.30 C 0.22 21.9 Yes Yes
Notes: LOS = Level of Service, V/C Ratio = Volume-to-Capacity Ratio 1 LOS, V/C ratio, and delay for signalized intersections represent operations of the intersection (e.g. intersection LOS and intersection control delay).
EXHIBIT "A"

EXHIBIT "A"

City of Hubbard TSP, 2012 86
As shown in Table 5.5, all study intersections on the OR 99E corridor are expected to meet ODOT performance standards in 2035 if a 5-lane cross section is constructed. A queuing analysis was also conducted for Alternative 3. This is summarized in Table 5.6. The traffic operations and queuing analysis worksheets for Alternative 3 are also provided in Appendix M.
Table 5.6 Alternative 3 Queue Length Analysis (2035)
Intersection Approach
95th
Percentile Queue Length (feet)
1 Queue
Storage Available
Impacted by
Alternative? Adequate Storage?
2-Minute Rule HCM Synchro
1. OR 99E/ Elm Street
Westbound 25 25 - 175 Yes Yes Southbound LT 25 25 - 300 Yes Yes
2. OR 99E/ Parkway Boulevard
Westbound 25 25 - 300 No Yes
Southbound LT 25 25 - 300 No Yes
3. OR 99E/ A Street
Eastbound 75 50 - 300 Yes Yes Northbound LT 75 25 - 360 No Yes
4. OR 99E/ D Street
Northbound TH/RT - - 175 220 Yes Yes
Northbound LT - - 50 120 No Yes Southbound TH/RT - - 350 700 Yes Yes
Southbound LT - - 50 360 Yes Yes Eastbound TH/RT - - 100 100 No Yes
Eastbound LT - - 175 300 Yes Yes Westbound TH/RT - - 75 80 Yes Yes
Westbound LT - - 50 80 No Yes
5. OR 99E/ G Street
Northbound LT 200 25 - >300 Yes Yes Southbound LT 75 25 - >300 No Yes
Eastbound 25 50 - 200 Yes Yes
Westbound 25 25 - >300 Yes Yes
6. OR 99E/ J Street
Northbound LT 25 25 - >300 No Yes Southbound LT 175 25 - >300 Yes Yes
Eastbound 25 25 - 120 Yes Yes Westbound 100 75 - 120 Yes Yes
7. OR 99E /Industrial Avenue
Southbound LT 75 25 - >300 No Yes Westbound 75 25 - 200 Yes Yes
1 All queue lengths are rounded up to the nearest 25 feet.
As shown in Table 5.6, under Alternative 3 the anticipated 95th percentile queues can be accommodated in the available storage at all OR 99E study intersections.
Alternative 4: Extend the 3-Lane Cross Section North of D Street and Construct a 5-Lane Cross Section between D and G Streets
Alternative 4 assumes expansion of the 3-lane cross section on OR 99E north of D Street to the Hubbard UGB and construction of a 5-lane cross section between D and G Streets. No additional traffic signals or minor street turn lanes are assumed in this alternative. Under this alternative, all study intersections meet ODOT performance standards and there are no queue storage issues, except at J Street. As discussed for Alternative 1, there is adequate existing right-of-way north of D Street to accommodate a 3-lane cross section with the sidewalk, bikeway, and landscaping required in the major arterial street design standards.xxvii The roadway inventory indicates 80 feet of right-of-way and 51 feet of pavement on OR 99E between D and G Street. As discussed for Alternative 3, the existing right-of-way is not adequate to accommodate the 100 foot major arterial cross section in the existing Hubbard Street Design Standards which includes pedestrian and bicycle facilities.xxviii
EXHIBIT "A"

City of Hubbard TSP, 2012 87
Figure 5.4 illustrates the assumed lane configurations, traffic controls, and 2035 operational analysis under Alternative 4. Year 2035 traffic operations for this alternative are also summarized in Table 5.7.
Table 5.7 Alternative 4 (5-Lane Cross Section between D and G Street) Operational Analysis Results
(2035)
Intersection Traffic Control
Posted Speed Standard
Major Approach V/C Ratio
Critical Movement1
Impacted by Alternative?
Meets Standard LOS
V/C Ratio
Delay (sec/veh)
1. OR 99E/ Elm Street
Two-Way Stop
35 mph v/c < 0.85 0.75 C 0.09 22.1 Yes Yes
2. OR 99E/ Parkway Blvd
Two-Way Stop
35 mph v/c < 0.85 0.76 C 0.04 19.1 Yes Yes
3. OR 99E/ A Street
Two-Way Stop
35 mph v/c < 0.85 0.77 D 0.39 33.6 Yes Yes
4. OR 99E/ D Street Signal 35 mph v/c <
0.85 - B 0.69 14.3 Yes Yes
5. OR 99E/ G Street
Two-Way Stop
35 mph v/c < 0.85 0.46 C 0.20 23.9 Yes Yes
6. OR 99E/ J Street
Two-Way Stop
35 mph v/c < 0.85 0.57 F 0.74 >50 No Yes
7. OR 99E/ Industrial Ave
Two-Way Stop
40 mph v/c < 0.80 0.59 C 0.31 21.9 No Yes
Notes: LOS = Level of Service, V/C Ratio = Volume-to-Capacity Ratio 1 LOS, V/C ratio, and delay for signalized intersections represent operations of the intersection (e.g. intersection LOS and intersection control delay).
EXHIBIT "A"
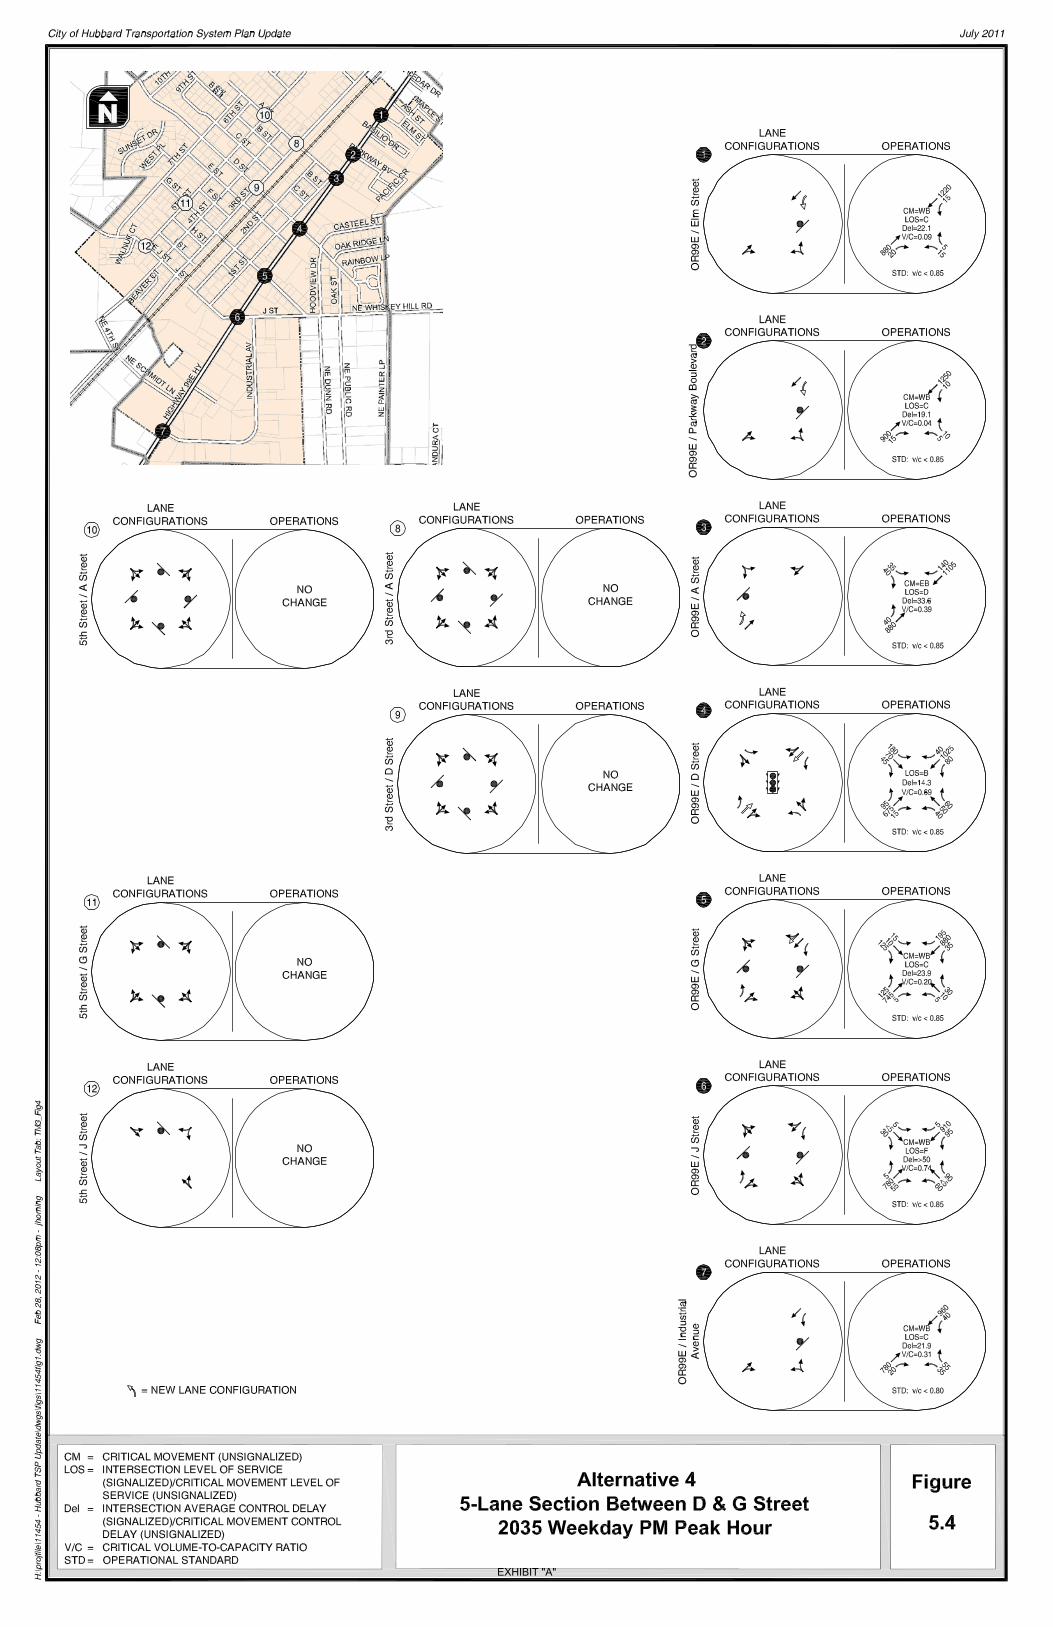
EXHIBIT "A"

City of Hubbard TSP, 2012 89
As shown in Table 5.7, all study intersections on the OR 99E corridor are expected to meet ODOT performance standards in 2035 under Alternative 4. A queuing analysis was also conducted for Alternative 4. Table 5.8 illustrates the anticipated queues at OR 99E study intersections under this alternative. The traffic operations and queuing analysis worksheets for Alternative 4 are also provided in Appendix N.
Table 5.8 Alternative 4 Queue Length Analysis (2035)
Intersection Approach
95th
Percentile Queue Length (feet)
1 Queue
Storage Available
Impacted by Alternative?
Adequate Storage?
2-Minute Rule HCM Synchro
1. OR 99E/ Elm Street
Westbound 25 25 - 175 Yes Yes Southbound LT 25 25 - 300 Yes Yes
2. OR 99E/ Parkway Boulevard
Westbound 25 25 - 300 No Yes
Southbound LT 25 25 - 300 No Yes
3. OR 99E/ A Street
Eastbound 75 50 - 300 Yes Yes Northbound LT 75 25 - 360 No Yes
4. OR 99E/ D Street
Northbound TH/RT - - 125 220 Yes Yes
Northbound LT - - 50 120 No Yes Southbound TH/RT - - 250 700 Yes Yes
Southbound LT - - 25 360 No Yes Eastbound TH/RT - - 100 100 No Yes
Eastbound LT - - 200 300 Yes Yes Westbound TH/RT - - 75 80 Yes Yes
Westbound LT - - 50 80 No Yes
5. OR 99E/ G Street
Northbound LT 200 25 - >300 Yes Yes Southbound LT 75 25 - >300 No Yes
Eastbound 25 50 - 200 Yes Yes
Westbound 25 25 - >300 Yes Yes
6. OR 99E/ J Street
Northbound LT 25 25 - >300 No Yes Southbound LT 175 25 - >300 Yes Yes
Eastbound 25 25 - 120 Yes Yes Westbound 100 175 - 120 Yes No
7. OR 99E/ Industrial Avenue
Southbound LT 75 25 - >300 No Yes Westbound 75 50 - 200 Yes Yes
1 All queue lengths are rounded up to the nearest 25 feet.
As shown in Table 5.8, under Alternative 4 the anticipated 95th percentile queues can be accommodated in the available storage at all OR 99E study intersections, except the westbound approach at J Street. Additional through lane space is available to accommodate queuing at this approach, but 95th percentile queues may interfere with northbound left turns from Industrial Avenue.
Alternative 5: Extend the 3-Lane Cross Section North of D Street and Construct a southbound through/right-turn lane between A Street and Schmidt Lane
Alternative 5 assumes expansion of the 3-lane cross section on OR 99E north of D Street to the Hubbard UGB and construction of a second southbound through/right-turn lane between A Street and Schmidt Lane. No additional traffic signals or minor street turn lanes are assumed in this alternative. Under this alternative, all study intersections meet ODOT performance standards and there are no queue storage issues, except at the northbound approach to OR 99E/D Street and westbound approach to OR 99E/J Street. As discussed for Alternative 1, there is adequate existing right-of-way north of A Street to accommodate a 3-lane cross section with the sidewalk, bikeway, and landscaping required in the major arterial street design standards. The roadway inventory indicates 80 feet of right-of-way and 51 feet of pavement on OR 99E
EXHIBIT "A"

City of Hubbard TSP, 2012 90
between D Street and Schmidt Lane. As discussed for Alternative 3, the existing right-of-way is not adequate to accommodate a 92 foot 4-lane major arterial cross section with pedestrian and bicycle facilities.xxix
Figure 5.5 illustrates the assumed lane configurations, traffic controls, and 2035 operational analysis under Alternative 5. Year 2035 traffic operations for this alternative are also summarized in Table 5.9.
Table 5.9 Alternative 5 (4-Lane Cross Section between A Street and Schmidt Lane) Operational
Analysis Results (2035)
Intersection Traffic Control
Posted Speed Standard
Major Approach V/C Ratio
Critical Movement1
Impacted by Alternative?
Meets Standard LOS
V/C Ratio
Delay (sec/veh)
1. OR 99E/ Elm Street
Two-Way Stop
35 mph v/c < 0.85 0.75 C 0.09 22.1 Yes Yes
2. OR 99E/ Parkway Blvd
Two-Way Stop
35 mph v/c < 0.85 0.76 C 0.04 19.1 Yes Yes
3. OR 99E/ A Street
Two-Way Stop
35 mph v/c < 0.85 0.77 D 0.39 34.3 Yes Yes
4. OR 99E/ D Street Signal 35 mph v/c <
0.85 - B 0.75 17.3 Yes Yes
5. OR 99E/ G Street
Two-Way Stop
35 mph v/c < 0.85 0.46 C 0.20 24.1 Yes Yes
6. OR 99E/ J Street
Two-Way Stop
35 mph v/c < 0.85 0.52 E 0.67 46.5 Yes Yes
7. OR 99E/ Industrial Ave
Two-Way Stop
40 mph v/c < 0.80 0.59 C 0.31 21.9 No Yes
Notes: LOS = Level of Service, V/C Ratio = Volume-to-Capacity Ratio 1 LOS, V/C ratio, and delay for signalized intersections represent operations of the intersection (e.g. intersection LOS and intersection control delay).
EXHIBIT "A"
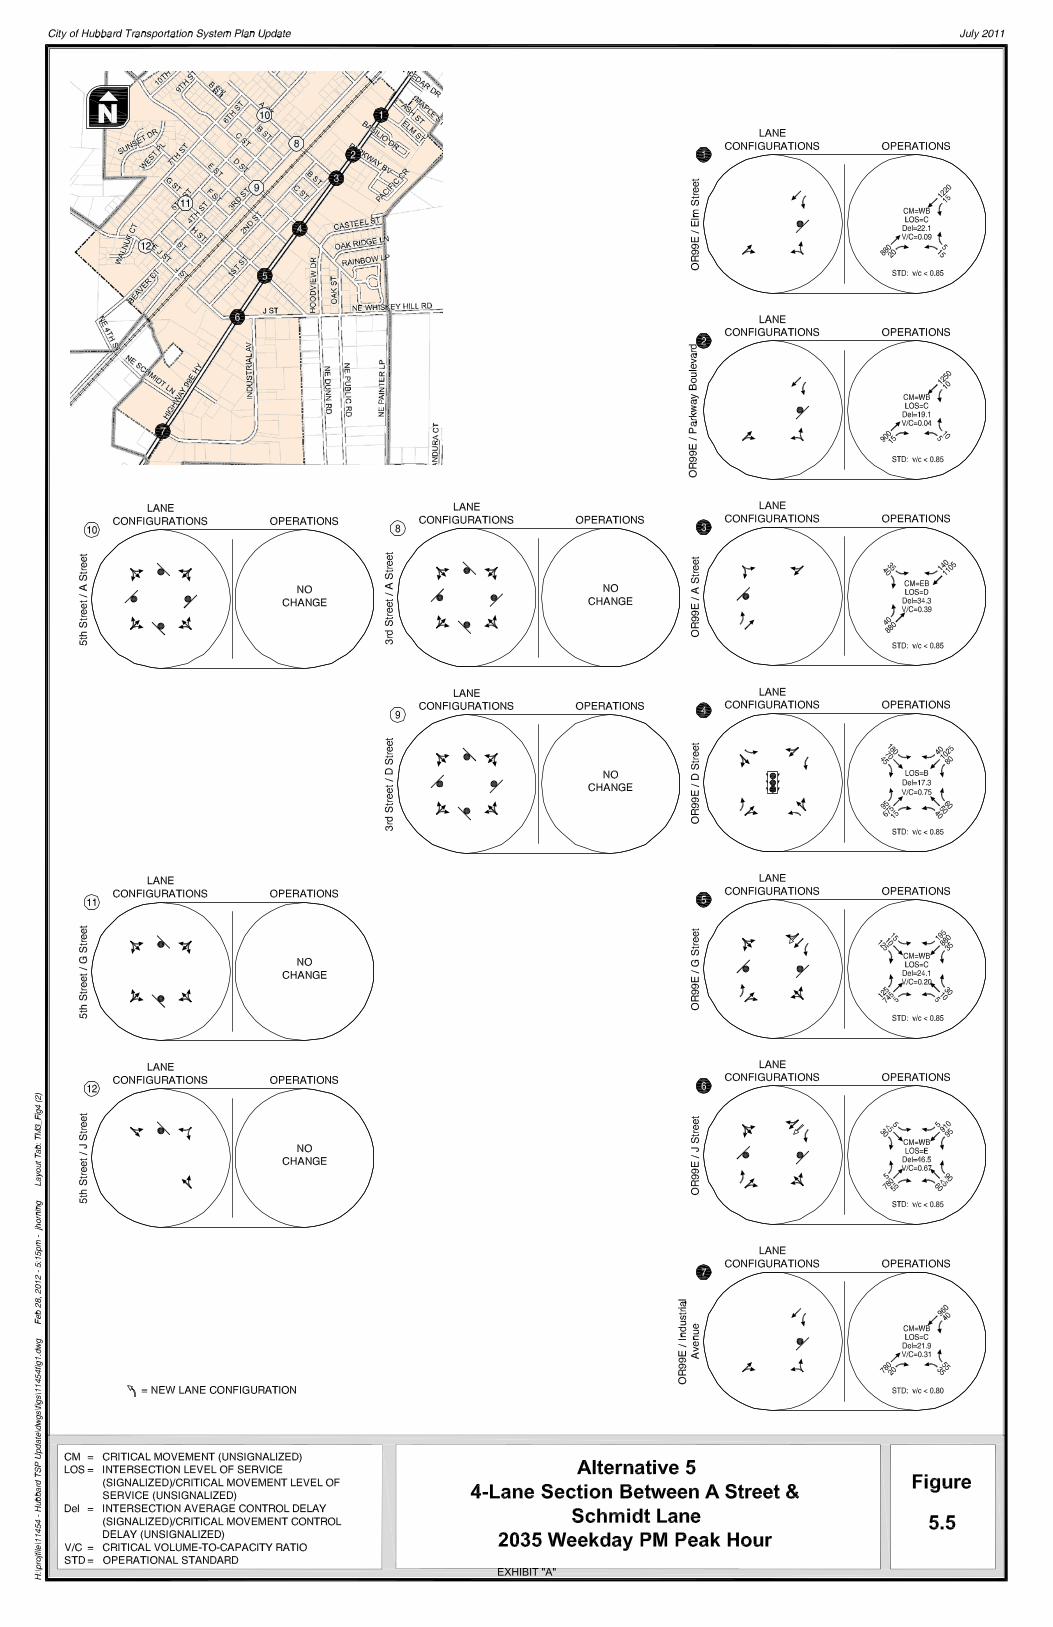
EXHIBIT "A"
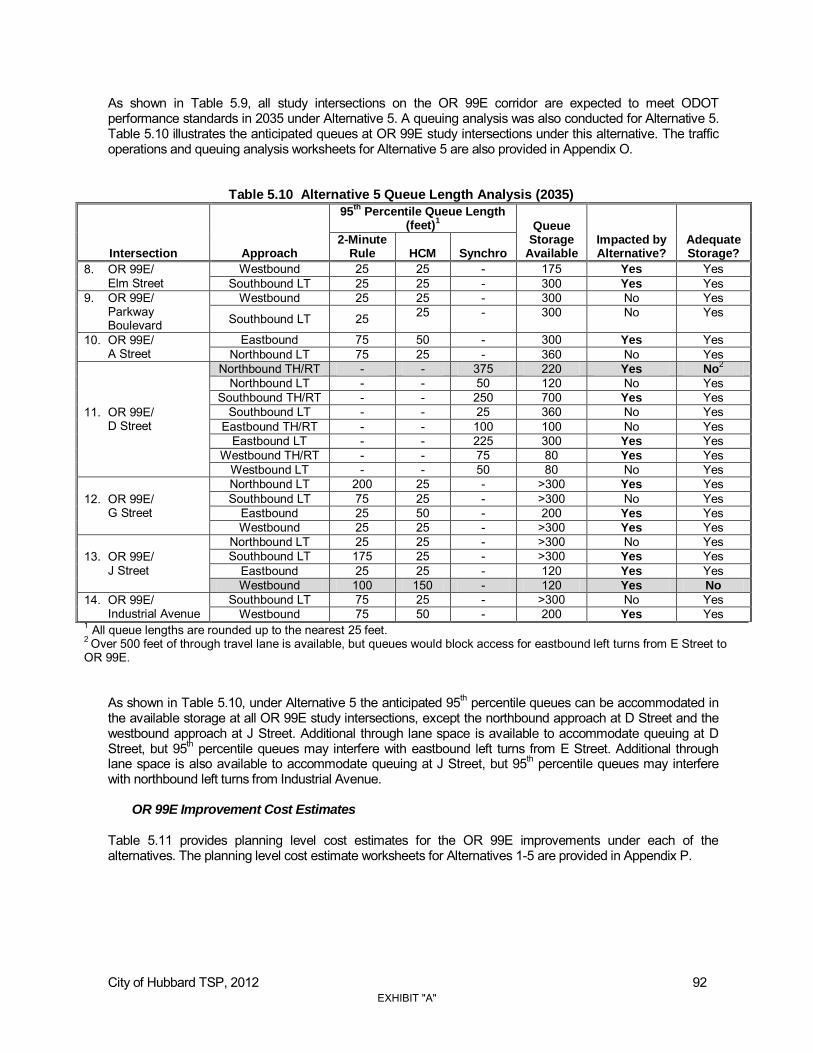
City of Hubbard TSP, 2012 92
As shown in Table 5.9, all study intersections on the OR 99E corridor are expected to meet ODOT performance standards in 2035 under Alternative 5. A queuing analysis was also conducted for Alternative 5. Table 5.10 illustrates the anticipated queues at OR 99E study intersections under this alternative. The traffic operations and queuing analysis worksheets for Alternative 5 are also provided in Appendix O.
Table 5.10 Alternative 5 Queue Length Analysis (2035)
Intersection Approach
95th
Percentile Queue Length (feet)
1 Queue
Storage Available
Impacted by Alternative?
Adequate Storage?
2-Minute Rule HCM Synchro
8. OR 99E/ Elm Street
Westbound 25 25 - 175 Yes Yes Southbound LT 25 25 - 300 Yes Yes
9. OR 99E/ Parkway Boulevard
Westbound 25 25 - 300 No Yes
Southbound LT 25 25 - 300 No Yes
10. OR 99E/ A Street
Eastbound 75 50 - 300 Yes Yes Northbound LT 75 25 - 360 No Yes
11. OR 99E/ D Street
Northbound TH/RT - - 375 220 Yes No2
Northbound LT - - 50 120 No Yes Southbound TH/RT - - 250 700 Yes Yes
Southbound LT - - 25 360 No Yes Eastbound TH/RT - - 100 100 No Yes
Eastbound LT - - 225 300 Yes Yes Westbound TH/RT - - 75 80 Yes Yes
Westbound LT - - 50 80 No Yes
12. OR 99E/ G Street
Northbound LT 200 25 - >300 Yes Yes Southbound LT 75 25 - >300 No Yes
Eastbound 25 50 - 200 Yes Yes
Westbound 25 25 - >300 Yes Yes
13. OR 99E/ J Street
Northbound LT 25 25 - >300 No Yes Southbound LT 175 25 - >300 Yes Yes
Eastbound 25 25 - 120 Yes Yes Westbound 100 150 - 120 Yes No
14. OR 99E/ Industrial Avenue
Southbound LT 75 25 - >300 No Yes Westbound 75 50 - 200 Yes Yes
1 All queue lengths are rounded up to the nearest 25 feet. 2 Over 500 feet of through travel lane is available, but queues would block access for eastbound left turns from E Street to OR 99E.
As shown in Table 5.10, under Alternative 5 the anticipated 95th percentile queues can be accommodated in the available storage at all OR 99E study intersections, except the northbound approach at D Street and the westbound approach at J Street. Additional through lane space is available to accommodate queuing at D Street, but 95th percentile queues may interfere with eastbound left turns from E Street. Additional through lane space is also available to accommodate queuing at J Street, but 95th percentile queues may interfere with northbound left turns from Industrial Avenue.
OR 99E Improvement Cost Estimates
Table 5.11 provides planning level cost estimates for the OR 99E improvements under each of the alternatives. The planning level cost estimate worksheets for Alternatives 1-5 are provided in Appendix P.
EXHIBIT "A"

City of Hubbard TSP, 2012 93
Table 5.11 OR 99E Improvements Planning Level Cost Estimate
Roadway
Segment
Improvement
Length (feet) Planning Level Cost Estimate
3 ROW
Available? From To Lane Taper2
Alternative 1: Extend 3-Lane Section
OR 99E Northern UGB D Street Provide center left-
turn lane 2,450 285 $1,549,000 Yes
Total $1,549,000 Alternative 2: Extend 3-Lane Section, Add Signal & Turn Lanes
OR 99E
Northern UGB D Street Provide center left-
turn lane 2,450 285 $1,549,000 Yes
- - Provide southbound right-turn lane at D
Street 50 285 $58,000 No4
G Street
OR 99E OR 99E Install traffic signal N/A N/A $488,0005 Yes
- - Provide eastbound left turn lane at OR
99E 125 125 $55,000 No4
- - Provide westbound left turn lane at OR
99E 50 125 $21,000 No4
Total $2,171,000 Alternative 3: Construct 5-Lane Section Through Entire Length of Hubbard
OR 99E Northern UGB
Southern UGB
Provide 5-lane cross section 6,680 570 $6,255,000 No4
Total6 $6,255,000
Alternative 4: Construct 5-Lane Section between D and G Street and Extend 3-Lane Section to North UGB
OR 99E Northern UGB D Street Provide center left-
turn lane 2,450 285 $1,549,000 Yes
OR 99E D Street G Street Provide 5-lane cross section 1,050 570 $866,000 No4
Total6 $2,415,000
Alternative 5: Extend 3-Lane Section, Add Southbound Through/Right-Turn Lane
OR 99E
Northern UGB D Street Provide center left-
turn lane 2,450 285 $1,549,000 Yes
A Street Schmidt Lane
Provide southbound through/right-turn lane 2,240 285 $1,257,000 No4
Total6 $2,806,000
1 Pavement Area = length x 16-foot lane width (turn lanes) or 12-foot lane width (travel lanes) 2 Taper length = (lane width x speed2)/60 Pavement area of taper = ½ x taper length x lane width 3 All cost estimates include mobilization (10%), erosion control (5%), traffic control (5%) contingencies (30%), architectural/engineering fees (15%), and construction management (10%) 4 Additional right-of-way would be required to accommodate sidewalks, bike lanes, and landscaping per the existing Hubbard Street Design Guidelines. 5Estimate based on typical ODOT signal design. 6 Cost estimates do not include acquisition of necessary right-of-way or impacts to existing buildings and utilities. Alternatives 3 and 4 would impact several existing buildings and require acquisition of approximately 66,800 and 10,500 square feet of right-of-way, respectively.
As shown in Table 5.11, the total planning level cost of the OR 99E improvements range from $1.5 million to $6.3 million. Additional right-of-way would need to be purchased under Alternatives 2, 3, 4, and 5 to accommodate sidewalks, bike lanes, and landscaping as outlined in the existing Hubbard Street Design Guidelines. Costs for right-of-way acquisition are not included in the planning level cost estimates in Table 5.10. Further, cost estimates for sidewalk and bikeway projects are included in the “Pedestrian and Bicycle Network” section of this memo and are also not reflected in Table 5.11. Right-of-way acquisition costs can vary widely depending upon property zoning and other factors. A review of aerial photography indicates that obtaining the
EXHIBIT "A"
City of Hubbard TSP, 2012 94
91 foot right-of-way on G Street for Alternative 2 or the 100 foot right-of-way on OR 99E for Alternatives 3 or 4 will likely impact multiple structures.
FUNCTIONAL CLASSIFICATION CHANGES
A review of existing roadway functional classifications was completed as part of the Existing and Future Conditions review found in Section 2. Based on that review, the following roadways were upgraded from local streets to collector classification:
G Street from 2nd Street to 7th Street; NE Cedar Drive east of OR 99E; NE Dunn Road from Whiskey Hill Rad to the UGB; and NE Painter Loop from Whiskey Hill Road to the UGB.
These recommendations are based on forecast travel volumes, the connectivity these streets provide to arterials, and the access they provide to recent UGB expansion areas and the future street network. In addition, the following roadways within recent UGB expansion areas were assigned a functional classification of minor arterial (all segments are continuations of existing minor arterials):
Whiskey Hill Road from G Street to Painter Loop Broadacres Road from 7th Street to the UGB. D Street from 10th Street to the UGB.
There is no cost associated with these changes; however, additional right-of-way will be required on Cedar Drive, Dunn Road, and Painter Loop to accommodate the 60 foot collector street cross section outlined in the Hubbard Street Design Standards (all three roads currently have a 40 foot right-of-way). The resultant design and access standards would be applied as new development occurs and as roadway, pedestrian, and bicycle improvements are made. The proposed future functional classification map is shown in Figure 6.3.
Future Street Network
The Future Street Network plan identifies future right-of-way that the City of Hubbard may need in order to build and maintain a balanced street network (to the extent possible) that is in accordance with the Oregon Transportation Planning Rule. The Future Street Network Plan designates:
Where existing collectors/arterials could be extended or added; Where new local access streets and/or pedestrian ways could be located to provide better
connection between existing streets; and Where new local access streets could be located to provide adequate connections for both
automobiles and pedestrians to significant local destinations and new development (particularly within recent UGB expansion areas).
Locations for the right-of-way and improvements were identified based on review of the existing street grid, existing parcel boundary locations, physical constraints (e.g. the railroad corridor, steep slopes, or floodplains that might preclude economical road construction) and applicable access management guidelines. Figure 6.3 shows a conceptual map of potential future extensions of the local and collector street network. All of the proposed future roadways are anticipated to be local roadways with the exception of one extension of an existing collector street and several collectors serving the UGB expansion areas. They include:
10th Street extension north from B Street to 9th Streetxxx;
EXHIBIT "A"

City of Hubbard TSP, 2012 95
A Street extension west from 7th Street to 10th Street; Future “loop road” along eastern UGB boundary from Cedar Drive to Whiskey Hill Road
xxxi; Cedar Drive extension east from OR 99E to UGB and future loop road; A Street extension east from OR 99E to future loop road; Future 4th Street extension north and west from 3rd Street into UGB expansion area; Future street extension south from Broadacres Road into UGB expansion area.
One proposed future roadway, NE Public Road, would widen an existing alley into a local street.xxxii Proposed rights-of-way for potential future street locations have been placed along existing parcel boundaries to the extent possible in order to facilitate dedication as development occurs. Where it is necessary to cross existing parcels, the proposed right-of-ways are configured in a manner that should be conducive to future development (e.g. at 90 degree angles) and provide suitable pedestrian access. The grid sizes vary to accommodate existing structures, property lines, and the level of access appropriate for surrounding land uses. The proposed street network, particularly in the southern UGB expansion areas, is conceptual and will vary based on future development patterns and lot sizes. For example, additional local roads may be needed if smaller lots are developed. The layout of internal roads should remain flexible and the future street plan should continue to be refined, as development occurs, to suit market conditions and the constraints and opportunities of each property. The plan is intended to provide some flexibility in alignments and to define the desired level of connectivity in each area. Adopting maximum block length and perimeter standards would provide the City a consistent tool to evaluate modifications to the future street plan as development occurs. For example, the typical block length in the historic downtown and residential areas of Hubbard is less than 300 feet. Adopting maximum block length and perimeter standards of 600 and 1,800 feet, respectively, would allow for some flexibility in block size and length, but would not allow for development of large, poorly connected blocks. Consideration was given to the potential for a grade-separated railroad crossing in the long-term future. Potential railroad crossing locations and associated issues are discussed further in the “Railroad Crossings” section of this memo. Consideration was also given to potential impacts on Mill Creek and Little Bear Creek. Three creek crossings are proposed in the southwestern UGB expansion area, but the actual number and location will depend upon how the large parcels in this area are subdivided and developed. The street network plan in this area should be refined as development occurs to provide logical connections with the existing Hubbard street grid, while limiting negative impacts on the creek.
EXHIBIT "A"

City of Hubbard TSP, 2012 96
Street Design Standards
Table 5.12 shows the existing Hubbard Street Design Standards corresponding to each of the functional classifications adopted in the 1999 Hubbard TSP (MWVCOG, 1999). Table 5.13 summarizes the Rural Arterial design standards (for OR 99E) as identified in the ODOT Highway Design Manual.
Table 5.11 Existing Hubbard Street Design Standards1
Functional Classification
ROW Width
2 Paved Width
Travel Lanes
Turning Lane Parking
Parkway Strip
Sidewalk Width
Bikeway Type and Standards
Arterial Major - OR 99E 100 76 4
12’ lanes
1 14-16’ lane
None 2 5’ strips
2 6’
sidewalks
2 6’ bike lanes
Minor - D Street - J Street - 3rd Street
60 483 2 11’ lanes None
Both sides of street
None 2 6’
sidewalks
2 6’ bike lanes
Collector3 Phase I -Baines Blvd - A Street - Schmidt Lane - 2nd Street - 5th Street - 7th Street - 10th Street
60 344 2 10’ lanes None
Both sides of street
2 4.5’ strips
2 5’
sidewalks
Shared Roadway
Phase II - G Street (2035)
60 344 2 11’ lanes None None 2
‘4.5 strips
2 5’
sidewalks
2 6’ bike lanes
Local Local Street
50 283 1 14’ lane None
Both sides of street
2 5’ strips
2 5’
sidewalks
Shared Roadway
Cul-de-sac 50 30 1
14’ lane None Both
sides of street
2 5’ strips
2 5’
sidewalks
Shared Roadway
Cul-de-sac-bulb 46 40 None 1
5’ strip
2 5’
sidewalks
Shared Roadway
1All dimensions in table are in feet. 2 ROW = right-of-way 3 Phase I changes to Phase II when traffic volume exceeds 3,000 ADT. 4Greater widths may be required at intersections with turn lanes.
Table 5.13 Existing ODOT Rural Arterial Design Standards1
Functional Classification
# of Lanes
Design Speed
Width of Traveled
Way Shoulder
Width
Maximum Grade
(%) Maximum Curvature
Stopping Sight
Distance
Rural Arterial 2 70 mph 24’ 8’ 3 3°15’ 730 4 70 mph 2 x 24’ 8’ 3 3°15’ 730
EXHIBIT "A"

City of Hubbard TSP, 2012 97
In addition to the design standards shown in Table 5.13, the ODOT Highway Design Manual indicates that a 16 foot two-way left-turn lane should be used on rural arterial highways with design speeds greater than 60 miles per hour.
Major Arterials (OR 99E) The current Hubbard design standard for major arterials includes a 5-lane cross section with 6-foot sidewalks and bike lanes on both sides of the street, resulting in a 76-foot paved width and 100-foot right-of-way. OR 99E is currently a 3-lane highway with a 14-foot center left turn lane south of D Street, 2-lanes north of D Street, and has incomplete sidewalks and shoulder bikeways. In addition, only 80 feet of right-of-way currently exists on the OR 99E corridor, meaning significant right-of-way acquisition and improvements would be required to bring OR 99E up to the existing standard. An alternative three-lane (Phase 1) major arterial standard was adopted in the TSP update to be consistent with current conditions and to provide phased near-term and long-term (Phase II) cross-section options on OR 99E.
Minor Arterials The current design standard for minor arterials includes two 11-foot travel lanes with 6-foot bike lanes, 6-foot sidewalks, and on-street parking on both sides of the street. The paved width and right-of-way standards for minor arterials are 48 feet and 60 feet, respectively. None of the existing collector streets in Hubbard (D Street, J Street, 3rd Street) currently have bike lanes or meet the paved width standard. The current minor arterial standards could be revised to provide flexibility regarding provision of on-street parking and bike lanes (particularly in the historic downtown area). Recommendations to provide this flexibility are outlined in the “Revised Cross Sections” section below.
Collectors There are currently two design standards for collectors. Both standards include a 34-foot paved width and 60-foot right-of-way. The “Phase I” standard for collectors with less than 3,000 ADT includes two 10-foot travel lanes, on-street parking, and a shared roadway with bicycles. The “Phase II” standard for collectors with more than 3,000 ADT includes two 11-foot travel lanes with two 6-foot bike lanes and no on-street parking. There are currently no collectors in Hubbard with traffic volumes greater than 3,000 ADT and no collectors are anticipated to serve more than 3,000 ADT in 2035 except G Street (currently classified as a local street between 2nd Street and 7th Street). As part of the TSP update, the City eliminated the Phase II collector designation.
Local Streets There is currently only one design standard for local streets in Hubbard. The current standard recommends one 14-foot travel lane with on-street parking and parkway strips. The City has received comments that the paved width of this cross section is too narrow, as well as requests for additional flexibility in provision of and minimum widths of parkway strips. As part of the TSP update, the City increased the travel lane width of its current local street standard.
Revised Cross Sections Table 5.14 and Figure 6.4 show several alternative cross sections to those in the 1999 TSP. These alternatives are consistent with ODOT Rural Arterial design standards and the streetscape recommendations contained in the Hubbard Downtown Revitalization Plan.
EXHIBIT "A"

City of Hubbard TSP, 2012 98
Table 5.14 Revised Street Design Standards1
Functional Classification
ROW Width
2 Paved Width
Travel Lanes
Turning Lane Parking
Parkway Strip
Sidewalk Width
Bikeway Type and Standards
Major Arterial
Phase I 80 52 2 12’ lanes
1 16’ lane None 2
5’ strips 2
6’ sidewalks
2 6’ bike lanes
Phase II 101 64 3
12’ lanes7
1 16’ lane None 2
5’ strips 2
6’ sidewalks
2 6’ bike lanes
Phase III 101 76 4 12’ lanes
1 16’ lane None 2
5’ strips 2
6’ sidewalks
2 6’ bike lanes
Minor Arterial
Downtown (3rd Street)
60 42 2 11’ lanes None
8’ West side
6’ East side
12’ West side
2 6’ bike lanes
Other 60 483 2 11’ lanes None
7’ Both sides
None 2 6’ sidewalks
2 6’ bike lanes
Collector
Collector4 60 343 2 10’ lanes None
7’ Both sides
2 4.5’ strips
2 5’ sidewalks
Shared Roadway
Local
Local Street or Cul-de-sac 50 303 1
16’ lane None 7’
Both sides
2 5’ strips
2 5’ sidewalks
Shared Roadway
Cul-de-sac-bulb 46 40 None 1
5’ strip 2
5’ sidewalks Shared
Roadway 1All dimensions in table are in feet. 2ROW = right-of-way 3 Greater widths may be required at intersections with turn lanes. 4 Collectors should be considered for reclassification as minor arterials when traffic volumes exceed 3,000 ADT. 5Parking allowed on both sides if driveways are staggered or if additional right-of-way permits. 6 Parkway strips allowed where right-of-way permits. 7Two southbound and one northbound lane.
EXHIBIT "A"

City of Hubbard TSP, 2012 99
OR 99E is the only major arterial in Hubbard. The revised street design standard is intended to provide a design alternative that fits within the existing right-of-way and that provides options for the future development of the corridor. D Street, J Street, and 3rd Street comprise the minor arterial network in Hubbard. The revised minor arterial design standards incorporate the recommendations of the Downtown Revitalization Plan and acknowledge the unique character of 3rd Street and the historic downtown area.xxxiii These standards provide a 12-foot sidewalk and on-street parking fronting buildings on the western side of 3rd Street, and a landscaped buffer on the eastern side of the street fronting the railroad right-of-way. The Phase II collector standard is eliminated because no collectors other than G Street are anticipated to meet the 3,000 vehicle per day threshold. .
Railroad Crossings
As noted in Section 4 – Existing and Future Conditions, the Public Utilities Commission previously limited the City to three at-grade rail crossings, and ODOT approval of additional at-grade crossing is unlikely due to safety concerns and increasing train speeds and volumes on the corridor. The Union Pacific main line that travels through Hubbard is part of the designated High Speed Rail Corridor. As a result, the number of grade crossings permitted in Hubbard could possibly be reduced again in the future, depending upon how the corridor project develops. In addition, the existing railroad crossings are “humped” which can cause additional safety problems such as low vehicles and trucks with trailers becoming “hung-up” on the tracks. The absence of a grade-separated crossing (overpass or underpass) of the Union Pacific railroad poses significant challenges for the City’s transportation network. Limited rail crossing opportunities impede the City’s emergency response capability, limit east-west connectivity, and focus traffic on a limited number of roadway segments within Hubbard. Potential locations for a grade-separated railroad crossing were considered for the long-term (>20 year) planning horizon. Based on typical overpass geometry, a 1,035 foot approach ramp would be needed on each side of a railroad overpass. xxxiv Figure 5.6 illustrates the approximate ramp lengths required for a grade-separated railroad crossing at various locations in Hubbard. The ramp lengths shown in Figure 5.6 take into account the issue that if there is not adequate distance to accommodate the ramp between the railroad and OR 99E, an overpass or underpass of OR 99E will also be required. As shown in Figure 5.6, the close proximity of the railroad and OR 99E may limit the number of locations where a grade-separated crossing can be constructed in Hubbard; however, many over or underpass ramp design options could be considered to accommodate a specific preferred crossing location. For example, the ramp length could be shortened if the approach grade was increased to 5 percent (the maximum grade allowed by the Americans with Disabilities Act) or the crossing could be built at an angle. A grade-separated undercrossing, as opposed to an overcrossing, may also require a shorter approach ramp, since the existing tracks are slightly elevated above the surrounding area. Drainage issues may impact the feasibility of a railroad underpass, but this should be factored against the average lower cost and level of neighborhood disruption of undercrossings relative to overcrossings. Of the potential grade separated crossing locations considered for this preliminary analysis, Schmidt Lane provides the most space to accommodate the ramp necessary for a grade-separated crossing. It should be noted, however, that a portion of any crossing in this location would be outside of the Hubbard UGB and would require a goal exception. A grade separated crossing of the railroad is likely to cost in the range of $25 - $40 million.
EXHIBIT "A"

D ST
3RD ST
5TH STG ST
HIGHW
AY 99
E HY
4TH ST
J ST
A ST
7TH ST
1ST ST
C ST
2ND ST
NE FRONT S
T
E ST
BAINES BV
I STNE J ST
NE DUNN RD
NE PA
INTE
R LPNE PUBLIC RD
INDU
STRI
AL AV
ALLAN AV
F ST
H ST
DORSEY DRNE BOONES FE
RRY RD
NE BROADACRES RD
NE WHISKEY HILL RD
10TH ST
ASH STELM ST
OAK
ST
NE M
INER
AL S
PRIN
GS R
D
SUNSET DR
6TH ST
KARI LN
RIVIERA CT
CASTEEL ST
NE 4TH ST
NE SCHMIDT LN
B ST
HOOD
VIEW
DR
OAK RIDGE LN
NINA PL
WEST PL
9TH ST
KURTH AV
WALN
UT CT
MILL ST
BEAVER CT
MAPLE ST
PARKWAY BV
PACIFIC CR
RAINBOW LP
BASILIO DR
NE LA
NDUR
A CT
NE CEDAR DR
J ST
B ST
C ST
E ST
B ST
9TH ST
Potential Railroad Overpass
Evaluation 5.6 7Figure
NH:
\projf
ile\11
454 -
City
of H
ubba
rd TS
P Upd
ate\gi
s\mxd
s\Fig_
base
_8x1
1.mxd
Hubbard TSP Update June 2011
Hubbard RoadsLocal RoadsOR 99ERailroad
Urban Growth BoundaryHubbardTaxlotsCity Limits
Estimated Overpass Approach Length
EXHIBIT "A"

City of Hubbard TSP, 2012 101
Pedestrian and Bicycle Networks
Current street design standards require sidewalks on all local, collector, and arterial roadways within the city limits. Bicycle lanes are required on all arterial roadways and collectors with over 3,000 vehicles per day, which includes only OR 99E and G Street in the year 2035 horizon. There are many roadways without sidewalks, sidewalks in poor condition or with critical gaps. There are currently no bicycle lanes provided within the city limits on any facilities with the exception of shoulder lanes on portions of OR 99E. The Existing and Future Conditions analysis found in Section 4, prioritized the need for sidewalks based on system connectivity needs and identified roadways that warrant exclusive bicycle lanes based on their projected vehicle traffic volumes. The following section identifies pedestrian and bicycle network projects that have been identified as potential priorities. It also provides planning level cost estimates to complete all of the identified projects. The planning level costs provided are for stand-alone pedestrian and bicycle projects and do not account for full road reconstruction or potential cost savings of implementing multiple projects together. Project costs were refined to account for these factors once the preferred list of improvements were identified and additional feedback was received from City staff.
Pedestrian Projects
For the purpose of this analysis, priority sidewalk project locations were identified based on arterials and collectors without sidewalks, system connectivity needs, and gaps in existing sidewalks on local streets. Based on this analysis, the following locations were identified as potential sidewalk priorities:
OR 99E o West side between the northern UGB line and Schmidt Lane o East side between D Street and the southern UGB line
D Street o North side between 3rd Street and OR 99E o South side between 10th Street and 7th Street o Both sides between OR 99E and Oak Street
J Street o Both sides between the western UGB Line and OR 99E o Both sides between G Street and the eastern UGB line
3rd Street - West side between Moonbeam Court and E Street A Street – Both sides between the western terminus (past 7th Street) and OR 99E G Street – Both sides between 7th and 2nd Street, and between OR 99E and J Street 2nd Street – Gaps between A Street and J Street 5th Street – East side between A Street and J Street 7th Street – Both sides between A Street and J Street
In addition to sidewalks, pedestrian railroad crossing improvements are a potential priority at the following locations:
A Street (both sides) G Street (both sides) D Street (north side) J Street (pedestrian only crossing)
Pedestrian crossing improvements such as a Rectangular Rapid Flashing Beacon (RRFB), HAWK signal, signing, or striping could also be considered at the following locationsxxxv:
OR 99E/G Street OR 99E/A Street
EXHIBIT "A"
City of Hubbard TSP, 2012 102
This list of potential pedestrian priority projects will be refined based upon feedback received from the Project Management Team and others. Figure 5.7 illustrates the potential pedestrian network improvements. Table 5.15 provides planning level cost estimates for the pedestrian projects identified above. The total cost to complete all of the identified pedestrian priorities is approximately $2.1 million. In addition, high visibility crosswalks at any location in Hubbard are estimated at $7,465 each. The planning level cost estimates do not include additional costs for right-of-way acquisition in areas where the existing right-of-way is not adequate to accommodate the cross section outlined in the Hubbard Street Design Standards. Right-of-way acquisition needs are address in more detail in the “Right-of-Way Issues” section of this memo.
EXHIBIT "A"

D ST
3RD ST
5TH STG ST
HIGHW
AY 99
E HY
4TH ST
J ST
A ST
7TH ST
1ST ST
C ST
2ND ST
NE FRONT S
T
E ST
BAINES BV
I STNE J ST
NE DUNN RD
NE PA
INTE
R LPNE PUBLIC RD
INDU
STRI
AL AV
ALLAN AV
F ST
H ST
DORSEY DRNE BOONES FE
RRY RD
NE BROADACRES RD
NE WHISKEY HILL RD
10TH ST
ASH STELM ST
OAK
ST
NE M
INER
AL S
PRIN
GS R
D
SUNSET DR
6TH ST
KARI LN
RIVIERA CT
CASTEEL ST
NE 4TH ST
NE SCHMIDT LN
B ST
HOOD
VIEW
DR
OAK RIDGE LN
NINA PL
WEST PL
9TH ST
KURTH AV
WALN
UT CT
MILL ST
BEAVER CT
MAPLE ST
PARKWAY BV
PACIFIC CR
RAINBOW LP
BASILIO DR
NE LA
NDUR
A CT
NE CEDAR DR
J ST
B ST
C ST
E ST
B ST
9TH ST
Proposed Pedestrian NetworkImprovements 5.7
Figure
NH:
\projf
ile\11
454 -
City
of H
ubba
rd TS
P Upd
ate\gi
s\mxd
s\Fig_
base
_8x1
1.mxd
Hubbard TSP Update June 2011
0 0.1 0.20.05 Miles
Potential Crossing ImprovementsOR 99E
RRNew Sidewalk ProjectSidewalk Repair ProjectExisting Sidewalks
RailroadUrban Growth Boundary
Hubbard RoadsLocal RoadsOR 99EHubbardTaxlotsCity Limits
EXHIBIT "A"
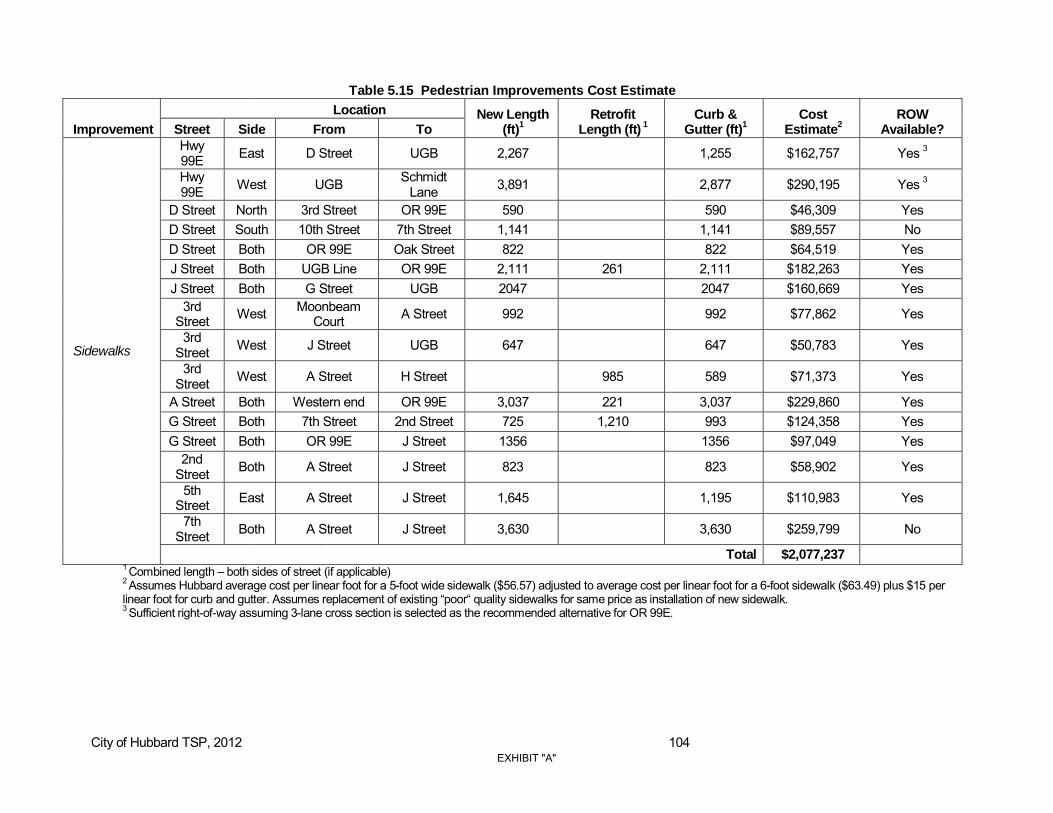
City of Hubbard TSP, 2012 104
Table 5.15 Pedestrian Improvements Cost Estimate
Improvement
Location New Length (ft)
1
Retrofit Length (ft)
1
Curb & Gutter (ft)
1
Cost Estimate
2 ROW
Available? Street Side From To
Sidewalks
Hwy 99E East D Street UGB 2,267 1,255 $162,757 Yes 3
Hwy 99E West UGB Schmidt
Lane 3,891 2,877 $290,195 Yes 3
D Street North 3rd Street OR 99E 590 590 $46,309 Yes D Street South 10th Street 7th Street 1,141 1,141 $89,557 No D Street Both OR 99E Oak Street 822 822 $64,519 Yes J Street Both UGB Line OR 99E 2,111 261 2,111 $182,263 Yes J Street Both G Street UGB 2047 2047 $160,669 Yes
3rd Street West Moonbeam
Court A Street 992 992 $77,862 Yes
3rd Street West J Street UGB 647 647 $50,783 Yes
3rd Street West A Street H Street 985 589 $71,373 Yes
A Street Both Western end OR 99E 3,037 221 3,037 $229,860 Yes G Street Both 7th Street 2nd Street 725 1,210 993 $124,358 Yes G Street Both OR 99E J Street 1356 1356 $97,049 Yes
2nd Street Both A Street J Street 823 823 $58,902 Yes
5th Street East A Street J Street 1,645 1,195 $110,983 Yes
7th Street Both A Street J Street 3,630 3,630 $259,799 No
Total $2,077,237 1 Combined length – both sides of street (if applicable) 2 Assumes Hubbard average cost per linear foot for a 5-foot wide sidewalk ($56.57) adjusted to average cost per linear foot for a 6-foot sidewalk ($63.49) plus $15 per linear foot for curb and gutter. Assumes replacement of existing “poor“ quality sidewalks for same price as installation of new sidewalk. 3 Sufficient right-of-way assuming 3-lane cross section is selected as the recommended alternative for OR 99E.
EXHIBIT "A"

D ST
3RD ST
5TH STG ST
HIGHW
AY 99
E HY
4TH ST
J ST
A ST
7TH ST
1ST ST
C ST
2ND ST
NE FRONT S
T
E ST
BAINES BV
I STNE J ST
NE DUNN RD
NE PA
INTE
R LPNE PUBLIC RD
INDU
STRI
AL AV
ALLAN AV
F ST
H ST
DORSEY DRNE BOONES FE
RRY RD
NE BROADACRES RD
NE WHISKEY HILL RD
10TH ST
ASH STELM ST
OAK
ST
NE M
INER
AL S
PRIN
GS R
D
SUNSET DR
6TH ST
KARI LN
RIVIERA CT
CASTEEL ST
NE 4TH ST
NE SCHMIDT LN
B ST
HOOD
VIEW
DR
OAK RIDGE LN
NINA PL
WEST PL
9TH ST
KURTH AV
WALN
UT CT
MILL ST
BEAVER CT
MAPLE ST
PARKWAY BV
PACIFIC CR
RAINBOW LP
BASILIO DR
NE LA
NDUR
A CT
NE CEDAR DR
J ST
B ST
C ST
E ST
B ST
9TH ST
Proposed Pedestrian Network
Improvements 5.7 8Figure
NH:
\projf
ile\11
454 -
City
of H
ubba
rd TS
P Upd
ate\gi
s\mxd
s\Fig_
base
_8x1
1.mxd
Hubbard TSP Update June 2011
0 0.1 0.20.05 Miles
Potential Crossing ImprovementsOR 99E
RRNew Sidewalk ProjectSidewalk Repair ProjectExisting Sidewalks
RailroadUrban Growth Boundary
Hubbard RoadsLocal RoadsOR 99EHubbardTaxlotsCity Limits
EXHIBIT "A"
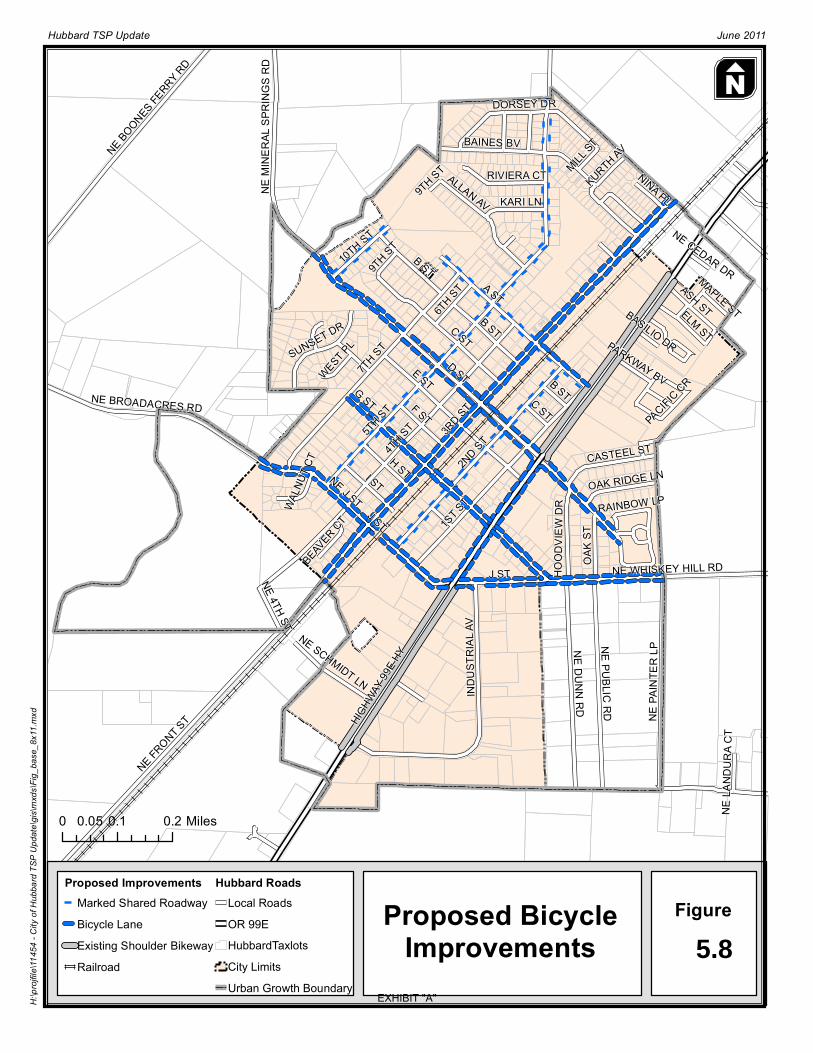
D ST
3RD ST
5TH STG ST
HIGHW
AY 99
E HY
4TH ST
J ST
A ST
E ST7TH ST
1ST ST
C ST
2ND ST
NE FRONT S
T
BAINES BV
I STNE J ST
NE DUNN RD
NE PA
INTE
R LPNE PUBLIC RD
INDU
STRI
AL AV
ALLAN AV
F ST
H ST
DORSEY DRNE BOONES FE
RRY RD
NE BROADACRES RD
NE WHISKEY HILL RD
10TH ST
ASH STELM ST
OAK
ST
NE M
INER
AL S
PRIN
GS R
D
SUNSET DR
6TH ST
KARI LN
RIVIERA CT
CASTEEL ST
NE 4TH ST
NE SCHMIDT LN
B ST
HOOD
VIEW
DR
OAK RIDGE LN
NINA PL
WEST PL
9TH ST
KURTH AV
WALN
UT CT
MILL ST
BEAVER CT
MAPLE ST
PARKWAY BV
PACIFIC CR
RAINBOW LP
BASILIO DR
NE LA
NDUR
A CT
NE CEDAR DR
J ST
B ST
C ST
B ST
9TH ST
Proposed BicycleImprovements 5.8 9
Figure
NH:
\projf
ile\11
454 -
City
of H
ubba
rd TS
P Upd
ate\gi
s\mxd
s\Fig_
base
_8x1
1.mxd
Hubbard TSP Update June 2011
0 0.1 0.20.05 Miles
Proposed ImprovementsMarked Shared RoadwayBicycle LaneExisting Shoulder BikewayRailroad
Hubbard RoadsLocal RoadsOR 99EHubbardTaxlotsCity LimitsUrban Growth Boundary
EXHIBIT "A"

City of Hubbard TSP, 2012 107
PUBLIC TRANSIT
The Oregon Public Transportation Plan (ODOT, 1997) describes the preferred state of public transportation in 2015 to respond to state and federal goals. The plan identifies minimum levels of public transportation to provide a range of services intended to keep pace with Oregon’s changing and increasing public transportation demand needs. Minimum levels of service recommendations are given by types of services, size of community, and distance from other major urban central cities. The population of Hubbard was 3,175 in 2010 and is projected to be 5,154 in 2035; so Hubbard will remain a small community during the 20-year planning horizon. According to the Oregon Public Transportation Plan, the goals for communities between 2,500 and 25,000 population and over 20 miles from an urban center city should include:
Public transportation service to the general public based on locally established service and funding priorities.
An accessible ride to anyone requesting service. A coordinated scheduling system. Phone access to the scheduling system at least 40 hours weekly between Monday and
Friday. Respond to service requests within 24 hours, not necessarily provide a ride within 24 hours.
The existing public transit system - described in Sections 3 and 4 - meets each of these goals. The 1999 TSP identifies constructing bus pull-outs on OR 99E as an additional public transportation recommendation. The goal of this recommendation is to reduce conflicts between traffic on OR 99E and stopped buses, however, even with bus pullouts traffic would be required to stop behind school buses.
RIGHT-OF-WAY ISSUES
Right-of-way deficiencies were identified based on a review of the roadway inventory, tax lot data, and the proposed Hubbard Street Design Standards. Right-of-way needs mapping was conducted in GIS using current tax lot boundaries and street centerlines obtained from Marion County. The proposed future right-of-way needs were then established based on an offset from the centerline equal to half of the proposed roadway cross section in the proposed Hubbard Street Design Standards. Figure 5.9 shows a summary map of the right-of-way needs to accommodate the proposed street design standards and the identified pedestrian and bicycle projects in the TSP. Appendix Q provides the project specific right-of-way needs and identifies each of the properties that would be affected by the acquisition of right-of-way necessary to provide the identified improvements in the future. There is currently adequate right-of-way to accommodate the proposed cross sections and bicycle pedestrian improvements on all of the streets in Hubbard except OR 99E, 7th Street, and D Street.
The OR 99E corridor requires an additional 20 feet of right-of-way if a 5-lane section is identified as the preferred future alternative. The existing 80-foot right-of-way on OR 99E is adequate to accommodate a 3-lane section if this is identified as the preferred future alternative.
The J Street corridor requires an additional 10 feet of right-of-way in order to accommodate the recommended 60-foot cross section (with the exception of the segment between D Street and E Street).
An additional 10 to 20 feet of right-of way is also needed on the southern side of D Street west of 7th Street in order to accommodate the recommended 60 foot cross section.
EXHIBIT "A"

D ST
3RD ST
5TH STG ST
HIGHW
AY 99
E HY
4TH ST
J ST
A ST
7TH ST
1ST ST
C ST
2ND ST
NE FRONT S
T
E ST
BAINES BV
I STNE J ST
NE DUNN RD
NE PA
INTE
R LPNE PUBLIC RD
INDU
STRI
AL AV
ALLAN AV
F ST
H ST
DORSEY DRNE BOONES FE
RRY RD
NE BROADACRES RD
NE WHISKEY HILL RD
10TH ST
ASH STELM ST
OAK
ST
NE M
INER
AL S
PRIN
GS R
D
SUNSET DR
6TH ST
KARI LN
RIVIERA CT
CASTEEL ST
NE 4TH ST
NE SCHMIDT LN
B ST
HOOD
VIEW
DR
OAK RIDGE LN
NINA PL
WEST PL
9TH ST
KURTH AV
WALN
UT CT
MILL ST
BEAVER CT
MAPLE ST
PARKWAY BV
PACIFIC CR
RAINBOW LP
BASILIO DR
NE LA
NDUR
A CT
NE CEDAR DR
J ST
B ST
C ST
E ST
B ST
9TH ST
Right-of-Way Deficiencies 5.9
Figure
NH:
\projf
ile\11
454 -
City
of H
ubba
rd TS
P Upd
ate\gi
s\mxd
s\Fig_
base
_8x1
1.mxd
Hubbard TSP Update June 2011
0 0.1 0.20.05 Miles
Right-of-Way (ROW) NeedsROW Deficiency (all alternatives)ROW Deficiency (Alternative 3)
Hubbard RoadsLocal RoadsOR 99E
RailroadUrban Growth BoundaryHubbardTaxlotsCity Limits
EXHIBIT "A"

City of Hubbard TSP, 2012 109
REVENUE FORECAST AND PREFERRED PLAN
Five alternatives were identified for the OR 99E corridor and desired improvements for the pedestrian and bicycle networks were identified. The total costs to address the deficiencies identified on OR 99E total approximately $1.4 million for Alternative 1, $2.0 million for Alternative 2, $6.1 million for Alternative 3, $2.3 million for Alternative 4, and $2.8 million for Alternative 5. The alternative selected to address OR 99E deficiencies may impact the number of additional bicycle and pedestrian improvements that can reasonably be completed within the 20-year horizon based on funding constraints. The total estimated transportation costs depending upon which OR 99E alternative is selected are shown in Table 5.17.
Table 5.17 Total Planning Level Transportation Improvement Costs
Improvements Alternative 1 Alternative 2
Alternative 3 Alternative 4 Alternative 5
OR 99E $1,600,000 $2,200,000 $6,300,000 $2,400,000 $2,806,000 Pedestrian Priorities $2,100,000 $2,100,000 $2,100,000 $2,100,000 $2,100,000
Bicycle Priorities $1,900,000 $1,900,000 $1,900,000 $1,900,000 $1,900,000
Total $5,600,000 $6,200,000 $10,300,000 $6,400,000 $6,806,000
Transportation Funding
The end of Section 4 – Existing and Future Conditions includes a forecast of the amounts of transportation funding for the 20-year planning horizon, as shown in Table 5.18. The estimated 20-year forecast funds are significantly below the estimated transportation costs for Alternative 2 through 5, but are adequate to address the deficiencies identified in Alternative 1.
Table 5.18 Future Transportation Project Funding
5-Year
Forecast 10-Year
Forecast 20-Year
Forecast
ODOT $1,067,000 $2,135,000 $4,270,000
City $291,000 $581,000 $1,162,000
Other $150,000 $300,000 $601,000
Total $1,508,000 $3,016,000 $6,033,000
Preferred and Financially Constrained Plans
The improvements identified as part of the Transportation Alternatives Analysis were reviewed by the TSP Project Advisory Committee and the Hubbard City Council to determine which OR 99E alternative was the Preferred Plan for Hubbard, to prioritize and confirm the additional roadway and multimodal improvements which are desired as part of the Preferred Plan, and to confirm the future street plan and street design standards. The results are presented in Section 6 – Preferred Plan and Financially Constrained Alternative.
EXHIBIT "A"

City of Hubbard TSP, 2012 110
Section 6 Preferred Plan
And Financially Constrained
Alternative
EXHIBIT "A"

City of Hubbard TSP, 2012 111
Preferred Plan and Financially Constrained Alternative
The previous section identified various alternatives to address the city’s future transportation needs and deficiencies for the roadway, pedestrian, bicycle, rail and public transit networks. These alternatives were reviewed to determine which alternative related to improvements on Pacific Highway 99E was the recommended alternative, to prioritize the timeframe for completing additional multi-modal improvements included in the Preferred Transportation System Plan (Preferred Plan). The Preferred Plan described in this section is the city’s preferred transportation system plan that will “establish a coordinated network of transportation facilities adequate to serve state, regional and local transportation” as required by the Oregon Transportation Planning Rule (TPR).
In addition to the Preferred Plan, the city also developed a “revenue forecast” transportation scenario, known as, the Financially Constrained Alternative. The Financially Constrained Alternative considers project priorities under a constrained financial scenario, where project costs are matched to the city’s projected future transportation funds. The Financially Constrained Alternative provides further guidance on how to prioritize transportation projects listed in the Preferred Plan in the event that additional funding sources cannot be obtained to fill the funding gap between the financial forecast and the projected costs of the Preferred Plan. In the event that additional funding sources become available to complete projects included in the Preferred Plan but not in the Financially Constrained Alternative, the city may complete these projects before completing all of the projects listed in the Financially Constrained Alternative.
The Preferred Plan and the Financially Constrained Alternative presented in this section were developed based upon input from the project advisory committee, City Council, the public, and to meet the city’s transportation goals and objectives. The city’s transportation goals, as identified in Section 2, include the following:
Street Network: 1) To encourage safe, efficient, convenient, and economic modes of travel that reduces reliance upon
one form of transportation, minimizes energy consumption and air quality impacts.
2) To develop a safe and efficient street system which will handle the projected needs of the community and provide connections to the region.
Rail Transportation: 1) To minimize the rail system’s negative impacts on other components of the transportation system,
adjacent land uses, and quality of life in Hubbard.
2) To positively encourage a land use pattern which will maximize the use of rail-based systems or preserve the future opportunity to use rail-based systems.
3) Support intercity travel via high speed rail while minimizing impacts to the city.
Bicycle Transportation: To provide safe, accessible, and convenient bicycling facilities.
Pedestrian Transportation: To provide safe, accessible, and convenient pedestrian facilities.
Public Transportation: 1) The City of Hubbard will seek for all its citizens the maximum level of access to all social, work and
welfare resources. 2) The City of Hubbard will seek for all its citizens the creation of a customer-based regionally
coordinated public transit system that is efficient, effective, and founded on present and future needs.
EXHIBIT "A"

City of Hubbard TSP, 2012 112
This section also describes the city’s updated Roadway Functional Classification Map, Future Street Plan, street design standards, and access control standards.
PREFERRED PLAN
The Preferred Plan identifies roadway, pedestrian, bicycle, and other improvements needed to address the city’s transportation deficiencies and meet the city’s transportation goals. The projects are categorized as either high-priority, medium-priority, or low-priority based on how they will meet the city’s needs and the order in which the projects could potentially be pursued. These improvements are presented as three project lists:
Level 1 (High-priority) – Projects in this list mitigate declining infrastructure conditions and
maximize the existing system through operational improvements, where possible. These projects are generally recommended for implementation in the short-term (5 to 10 years).
Level 2 (Medium-priority) – Projects in this list maintain the basic transportation infrastructure within the city. Although they address some bottlenecks, they do not include major capacity enhancements. These projects are generally recommended for implementation in the medium-term (10 to 15 years).
Level 3 (Low-priority) – Projects in this list maintain the system, meet growth and economic activity needs, and lessen congestion through strategic investments in capacity. These projects are generally recommended for implementation in the long-term (15-20 years).
Figure 6.1 provides a map of the Preferred Plan. Tables 6.1 through 6.4 summarize the improvements by mode and priority. Appendix R provides prospectus sheets for each project.
EXHIBIT "A"
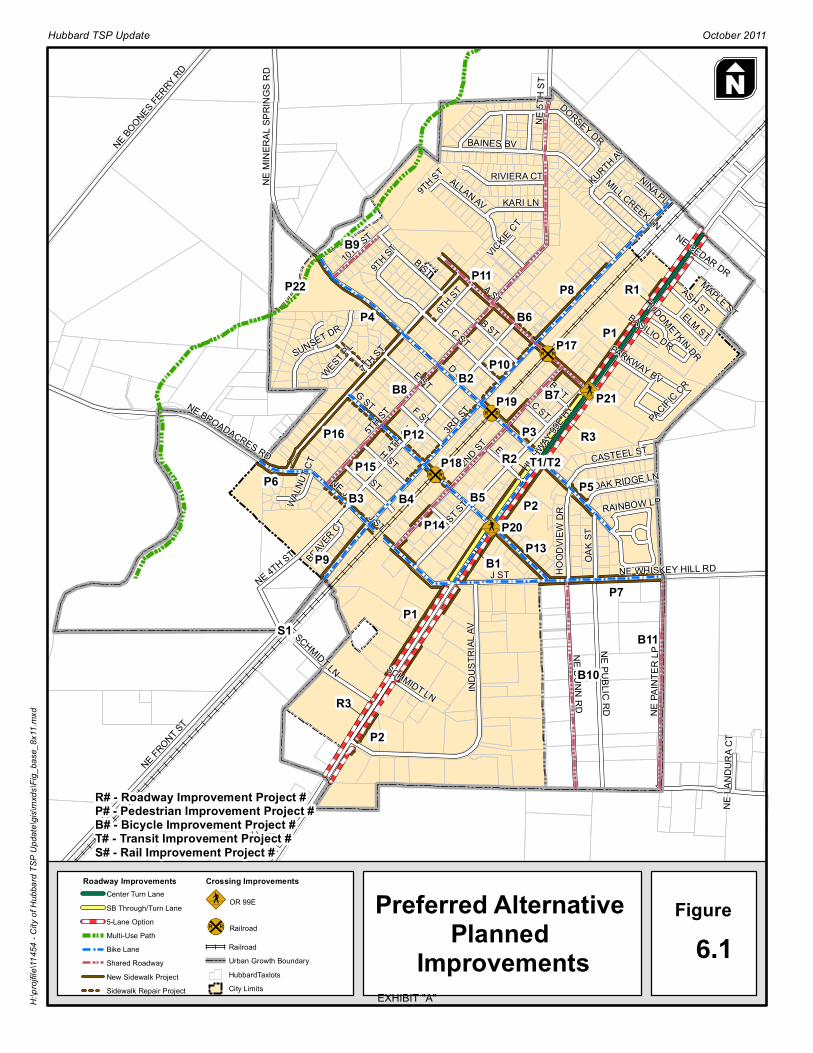
D ST
3RD ST
5TH STG ST
HIGHWAY 99
E HY
4TH ST
J ST
A ST
7TH ST
1ST ST
C ST
2ND ST
NE FRONT ST
E ST
BAINES BV
I STNE J ST
NE DUNN RD
NE PA
INTE
R LPNE PUBLIC RD
INDU
STRI
AL AV
ALLAN AV
F ST
H ST
DORSEY DRNE BOONES FERRY RD
NE BROADACRES RD
NE 5T
H ST
NE WHISKEY HILL RD
10TH ST
ASH STELM ST
OAK
ST
NE M
INER
AL S
PRIN
GS R
D
SUNSET DR
6TH ST
KARI LN
RIVIERA CT
CASTEEL ST
NE 4TH ST
NE SCHMIDT LN
B ST
HOOD
VIEW
DR
OAK RIDGE LN
NINA PL
WEST PL
9TH ST
KURTH AV
WALN
UT CT
BEAVER CT
MAPLE ST
PARKWAY BV
MILL CREEK LN
PACIFIC CR
RAINBOW LP
SCHMIDT LN
BASILIO DR
NE LA
NDUR
A CT
RUDOMETKIN DR
NE CEDAR DR
VICKIE CT
J ST
B ST
C ST
E ST
B ST
9TH ST
Preferred Alternative Planned
Improvements 6.1Figure
NH:
\projf
ile\11
454 -
City
of H
ubba
rd TS
P Upd
ate\gi
s\mxd
s\Fig_
base
_8x1
1.mxd
Hubbard TSP Update October 2011
Roadway ImprovementsCenter Turn LaneSB Through/Turn Lane5-Lane OptionMulti-Use PathBike LaneShared RoadwayNew Sidewalk ProjectSidewalk Repair Project
Crossing Improvements
OR 99E
Railroad
RailroadUrban Growth BoundaryHubbardTaxlotsCity Limits
R1
R3
R3R2
P1
P1
P2
P2
P3
P4
P5P6
P7
P8
P9
P10
P11
P12
P13P14
P15
P16
P17
P18
P19
P20
P21
B1
B2
B3 B4 B5
B6
B7B8
B9
B10
B11
R# - Roadway Improvement Project #P# - Pedestrian Improvement Project #B# - Bicycle Improvement Project #T# - Transit Improvement Project #S# - Rail Improvement Project #
T1/T2
S1
P22
EXHIBIT "A"

City of Hubbard TSP, 2012 114
Preferred Plan Roadway Improvements
Table 6.1 identifies the roadway improvements in the Preferred Plan and each improvement’s priority. Because the proposed OR 99E improvements are driven by future volume projections and funding availability, the Preferred Plan presents a phased approach to roadway improvements. This phased approach involves expanding the OR 99E three-lane section in the short-term and preserving adequate right-of-way during the development process for a five-lane section throughout the city in the long-term (potentially beyond 20 years) as warranted by growing traffic volumes. Roadway improvements in the Preferred Plan were prioritized as high-, medium-, and low-priority as follows:
High priority projects were identified as projects that could be constructed in the short-term with projected funding levels and available right-of-way. This phase includes extending the 3-lane cross section of OR 99E north to the UGB to improve safety and serve moderate traffic growth. The city would also begin to preserve right-of-way through the land development process for future expansions of OR 99E to a 5-lane cross section.
Medium-priority improvements are those that are necessary to serve projected 2035 traffic volumes and meet ODOT performance standards on OR 99E. This phase includes constructing a continuous southbound through/right-turn lane from A Street to approximately 800 feet south of Schmidt Lane.xxxviUnder this configuration, all study intersections are expected to meet ODOT performance standards in 2035.To complete this phase, the city and ODOT would need to acquire approximately 10 feet of right-of-way on the west side of OR 99E. At least one building would be impacted. See Appendix Q for approximate right-of-way impacts. The resultant operations for these improvements are included in Appendix O.
Low-priority projects were identified as those that would serve projected 2035 traffic volumes and provide capacity to accommodate additional growth and economic activity beyond a 20-year horizon. This phase includes construction of a 5-lane cross section on OR 99E through Hubbard and would be constructed if justified by future traffic volumes. This widening would require additional funding from ODOT or another source.
EXHIBIT "A"
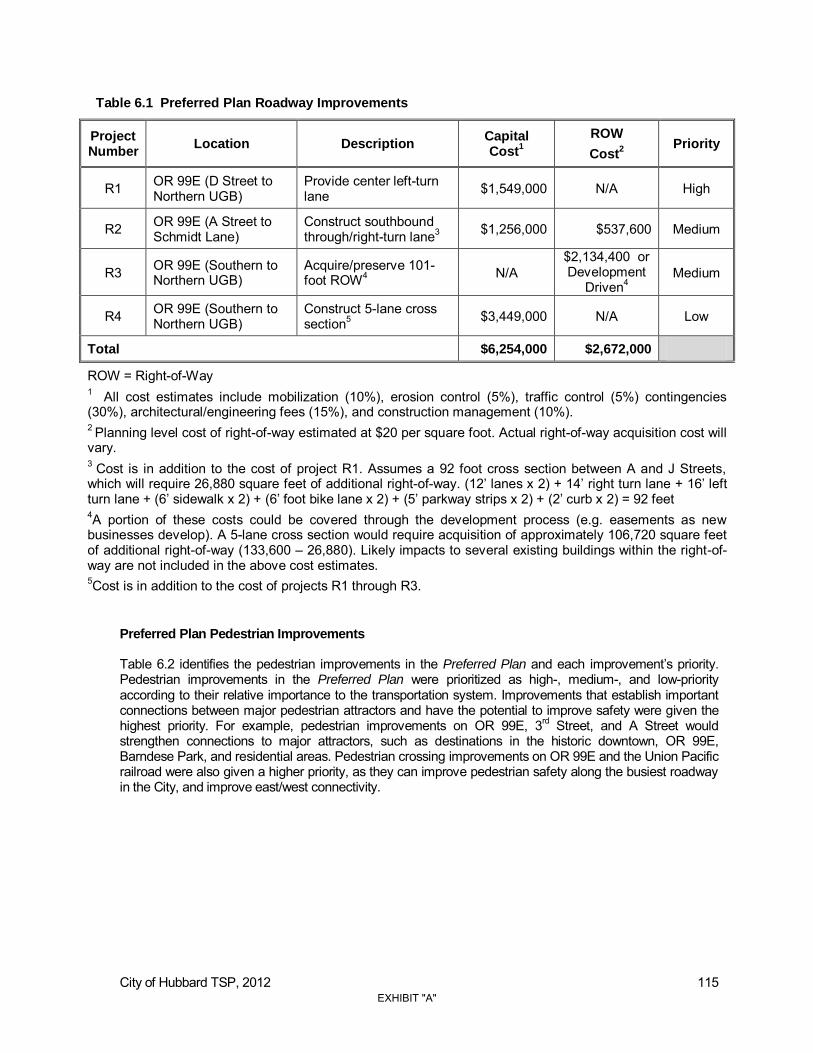
City of Hubbard TSP, 2012 115
Table 6.1 Preferred Plan Roadway Improvements
Project Number
Location Description Capital Cost
1
ROW
Cost2
Priority
R1 OR 99E (D Street to Northern UGB)
Provide center left-turn lane $1,549,000 N/A High
R2 OR 99E (A Street to Schmidt Lane)
Construct southbound through/right-turn lane3 $1,256,000 $537,600 Medium
R3 OR 99E (Southern to Northern UGB)
Acquire/preserve 101-foot ROW4 N/A
$2,134,400 or Development
Driven4 Medium
R4 OR 99E (Southern to Northern UGB)
Construct 5-lane cross section5 $3,449,000 N/A Low
Total $6,254,000 $2,672,000
ROW = Right-of-Way 1 All cost estimates include mobilization (10%), erosion control (5%), traffic control (5%) contingencies (30%), architectural/engineering fees (15%), and construction management (10%). 2 Planning level cost of right-of-way estimated at $20 per square foot. Actual right-of-way acquisition cost will vary. 3 Cost is in addition to the cost of project R1. Assumes a 92 foot cross section between A and J Streets, which will require 26,880 square feet of additional right-of-way. (12’ lanes x 2) + 14’ right turn lane + 16’ left turn lane + (6’ sidewalk x 2) + (6’ foot bike lane x 2) + (5’ parkway strips x 2) + (2’ curb x 2) = 92 feet 4A portion of these costs could be covered through the development process (e.g. easements as new businesses develop). A 5-lane cross section would require acquisition of approximately 106,720 square feet of additional right-of-way (133,600 – 26,880). Likely impacts to several existing buildings within the right-of-way are not included in the above cost estimates. 5Cost is in addition to the cost of projects R1 through R3.
Preferred Plan Pedestrian Improvements
Table 6.2 identifies the pedestrian improvements in the Preferred Plan and each improvement’s priority. Pedestrian improvements in the Preferred Plan were prioritized as high-, medium-, and low-priority according to their relative importance to the transportation system. Improvements that establish important connections between major pedestrian attractors and have the potential to improve safety were given the highest priority. For example, pedestrian improvements on OR 99E, 3rd Street, and A Street would strengthen connections to major attractors, such as destinations in the historic downtown, OR 99E, Barndese Park, and residential areas. Pedestrian crossing improvements on OR 99E and the Union Pacific railroad were also given a higher priority, as they can improve pedestrian safety along the busiest roadway in the City, and improve east/west connectivity.
EXHIBIT "A"

City of Hubbard TSP, 2012 116
Table 6.2 Preferred Plan Pedestrian Improvements
Project Number Location Description
Capital Cost
1 ROW Cost
2
Priority
P1 OR 99E (D Street to UGB) Install sidewalks $162,757 N/A3 High
P2 OR 99E (UGB to Schmidt Lane) Install sidewalks $290,195 N/A3 High
P3 D Street (3rd Street to OR99E) Install sidewalks $46,309 N/A High
P4 D Street (10th Street to 7th Street) Install sidewalks $89,557 $142,5604 Low
P5 D Street (OR 99E to Oak Street) Install sidewalks $64,519 N/A Medium
P6 J Street & Broadacres Road (UGB to OR 99E) Install sidewalks $182,263 N/A Medium
P7 J Street& Whiskey Hill Road (G Street to UGB) Install sidewalks $160,669 N/A Medium
P8 3rd Street (Moonbeam Court to A Street) Install sidewalks $77,862 N/A High
P9 3rd Street (J Street to UGB) Install sidewalks $50,783 N/A High
P10 3rd Street (A Street to H Street) Install sidewalks $71,373 N/A High
P11 A Street (OR 99E to terminus) 9 Install sidewalks $229,860 N/A High
P12 G Street (7th Street to 2nd Street)10 Install sidewalks $124,358 N/A Medium
P13 G Street (OR 99E to J Street) Install sidewalks $97,049 N/A Medium
P14 2nd Street (A Street to J Street) Install sidewalks $58,902 N/A Low
P15 5th Street (A Street to J Street) Install sidewalks $110,983 N/A Low
P16 7th Street (A Street to J Street) Install sidewalks $259,799 $275,5205 Low
P17 A Street railroad crossing (both sides)9
Conduct engineering study and install sidewalks at the existing railroad crossing
$66,5117 N/A8 High
P18 G Street (both sides) 10 Conduct engineering study and install sidewalks at the existing railroad crossing
$66,5117 N/A8 Medium
P19 D Street (north side) Conduct engineering study and install sidewalks at the existing railroad crossing
$45,7557 N/A8 Low
EXHIBIT "A"

City of Hubbard TSP, 2012 117
Project Number Location Description
Capital Cost
1 ROW Cost
2
Priority
P20 OR 99E/G Street High-visibility crosswalks and flashing beacon6 $49,860 N/A Medium
P21 OR 99E/A Street9 High-visibility crosswalks and flashing beacon6 $49,860 N/A High
P22 Mill Creek Construct Multi-Use Path identified in the Parks Master Plan
Development Driven
Development Driven Medium
Total $2,355,734 $418,080 ROW = Right-of-way 1Assumes Hubbard average cost per linear foot for a 5-foot wide sidewalk ($56.57) adjusted to average cost per linear foot for a 6-foot sidewalk ($63.49) plus $15 per linear foot for curb and gutter. Assumes replacement of existing “poor“ quality sidewalks for same price as installation of new sidewalk. 2 Planning level cost of right-of-way estimated at $20 per square foot. Actual right-of-way acquisition cost will vary. 3Available right-of-way is adequate under the 3-lane scenario. Right of way necessary to accommodate sidewalks under a 5-lane scenario is included in the cost estimate for projects R2 and R3. 4 Cost estimate assumes 7,128 square feet of right-of-way acquisition to accommodate a 1,188 foot long, 6 foot wide sidewalk. Constructing the standard 60 foot cross section for a minor arterial on this segment would require 20,160 square feet of right-of-way acquisition. Slopes in the area will also likely add to construction costs. 5 Cost estimate assumes 13,776 square feet of right-of-way acquisition to accommodate a 2,296 foot long, 6 foot wide sidewalk. Constructing the standard 60 foot cross section for a collector street on this segment would require 22,960 square feet of right-of-way acquisition. 6 Assumes $7,465 per crosswalk (one on each intersection approach) and $20,000 for installation of two rectangular rapid flashing beacons (one on each side of the road). A raised median could also be constructed to provide a pedestrian refuge. This treatment would involve additional costs for a third beacon, median design and construction, and coordination with ODOT to ensure compliance with Oregon Revised Statutes (ORS 366.215). 7
Assumes $25,000 for engineering study to evaluate grade issues associated with the “humped” railroad crossing (e.g. mitigation to maintain 5% maximum sidewalk slope per ADA requirements and prevent grade separation between the sidewalk and adjacent roadway).Sidewalk cost estimate includes constructing sidewalk from 2nd to 3rd Street and accounts for ODOT Rail requirement that inside edge of sidewalk must be constructed at least 5 feet from railroad crossing signal mast. See Note 1 for sidewalk cost estimate approach. 8 Adequate right-of-way is available on roadway approaches. Additional costs may be associated with mitigating issues identified by the engineering study and developing and implementing a Construction and Maintenance Agreement between the City and Union Pacific Railroad. 9 Sidewalk and crossing improvement projects on A Street (P11, P17, P21) should be implemented concurrently. 10 Sidewalk and crossing improvement projects on G Street (P12, P18) should be implemented concurrently.
EXHIBIT "A"

City of Hubbard TSP, 2012 118
Pedestrian improvements on OR 99E will have to be implemented with consideration for the phased highway expansion approach described in the Preferred Plan Roadway Improvements section. In order to reduce the amount of sidewalk reconstruction needed, sidewalks on the western side of OR 99E between A Street and J Street should be constructed assuming a five-lane cross section to accommodate the southbound through/right-turn lane proposed as a medium-term roadway improvement. All other sidewalks can be constructed assuming a three-lane cross section, but will need to be replaced if traffic volumes warrant expansion of OR 99E to a five-lane cross section in the long-term future (potentially beyond 20 years).
Preferred Plan Bicycle Improvements
Bicycle priorities identified in Table 6.3 were based on timing, safety benefits, and their relative importance to the transportation system. OR 99E, D Street, and 3rd Street were given highest-priority to coincide with the high-priority pedestrian projects along the same corridors.
Table 6.3 Preferred Plan Bicycle Improvements
Project Number Location Description
Capital Cost
1 ROW Cost Priority
B1 Hwy 99E Install bike lanes $161,400 N/A High
B2 D Street Install bike lanes $392,580 $285,1202 Medium
B3 J Street Install bike lanes $451,380 N/A Low
B4 3rd Street Install bike lanes $554,220 N/A Medium
B5 G Street Install bike lanes $282,360 N/A Medium
B6 A Street Shared Roadway $1,508 N/A Low
B7 2nd Street Shared Roadway $2,011 N/A Low
B8 5th Street Shared Roadway $4,278 N/A Low
B9 10th Street Shared Roadway $764 N/A Low
B10 Dunn Road Shared Roadway $1,135 N/A Low
B11 Painter Loop Shared Roadway $1,153 N/A Low
Total $1,852,789 $285,120 1 For a 6-foot wide bike lane or shoulder bikeway, assumes the following costs per linear foot; $48 pavement, $1 striping, and $11 cut and fill. For shared roadways, assumes $60 each for shared roadway markings (“Sharrows”) every 250 feet and $250 per sign for bike route/directional signage every 750 feet. 2 Cost estimate assumes 14,256 square feet of right-of-way acquisition to accommodate two 1,188 foot long, 6 foot wide bike lanes. Constructing the standard 60 foot cross section for a minor arterial on this segment would require 20,160 square feet of right-of-way acquisition. Slopes in the area will also likely add to construction costs.
EXHIBIT "A"
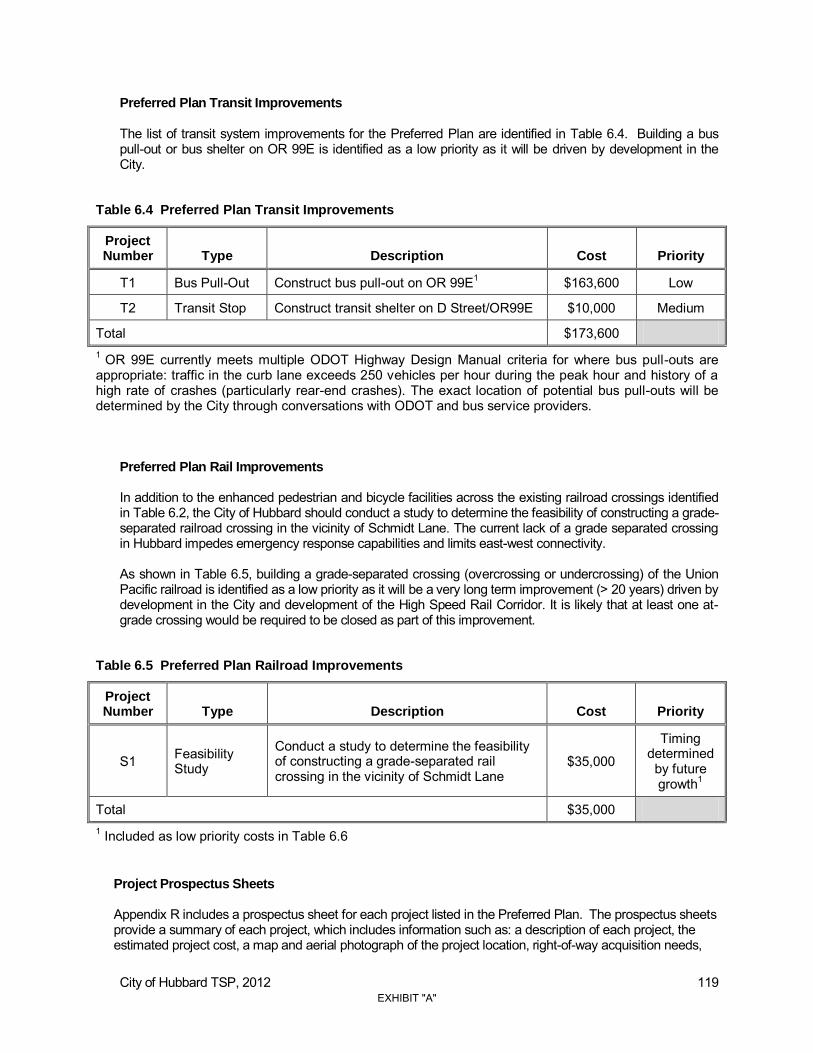
City of Hubbard TSP, 2012 119
Preferred Plan Transit Improvements
The list of transit system improvements for the Preferred Plan are identified in Table 6.4. Building a bus pull-out or bus shelter on OR 99E is identified as a low priority as it will be driven by development in the City.
Table 6.4 Preferred Plan Transit Improvements
Project Number Type Description Cost Priority
T1 Bus Pull-Out Construct bus pull-out on OR 99E1 $163,600 Low
T2 Transit Stop Construct transit shelter on D Street/OR99E $10,000 Medium
Total $173,600 1 OR 99E currently meets multiple ODOT Highway Design Manual criteria for where bus pull-outs are appropriate: traffic in the curb lane exceeds 250 vehicles per hour during the peak hour and history of a high rate of crashes (particularly rear-end crashes). The exact location of potential bus pull-outs will be determined by the City through conversations with ODOT and bus service providers.
Preferred Plan Rail Improvements
In addition to the enhanced pedestrian and bicycle facilities across the existing railroad crossings identified in Table 6.2, the City of Hubbard should conduct a study to determine the feasibility of constructing a grade-separated railroad crossing in the vicinity of Schmidt Lane. The current lack of a grade separated crossing in Hubbard impedes emergency response capabilities and limits east-west connectivity. As shown in Table 6.5, building a grade-separated crossing (overcrossing or undercrossing) of the Union Pacific railroad is identified as a low priority as it will be a very long term improvement (> 20 years) driven by development in the City and development of the High Speed Rail Corridor. It is likely that at least one at-grade crossing would be required to be closed as part of this improvement.
Table 6.5 Preferred Plan Railroad Improvements
Project Number Type Description Cost Priority
S1 Feasibility Study
Conduct a study to determine the feasibility of constructing a grade-separated rail crossing in the vicinity of Schmidt Lane
$35,000
Timing determined by future growth1
Total $35,000 1 Included as low priority costs in Table 6.6
Project Prospectus Sheets Appendix R includes a prospectus sheet for each project listed in the Preferred Plan. The prospectus sheets provide a summary of each project, which includes information such as: a description of each project, the estimated project cost, a map and aerial photograph of the project location, right-of-way acquisition needs,
EXHIBIT "A"

City of Hubbard TSP, 2012 120
and a figure of the typical street cross-section (if applicable). The prospectus sheets provide valuable information needed for further project planning and design, and can help evaluate what additional steps are needed to make a project ready for development.
Transportation Improvement Costs The total cost of the transportation improvements contained in the Preferred Plan is approximately $14 million, as shown in Table 6.6.
Table 6.6 Planning Level Transportation Improvement Costs (Preferred Plan)1
Type High Priority Medium Priority Low Priority Total
Roadway $1,549,000 $3,928,000 $3,449,000 $8,926,000
Pedestrian $1,045,510 $724,473 $1,003,832 $2,773,815
Bicycle $839,100 $836,580 $462,229 $2,137,909
Transit N/A $10,000 $163,600 $173,600
Rail N/A N/A $35,000 $35,000
Total $2,755,910 $6,176,753 $5,113,661 $14,046,324
1 Costs include estimated right-of-way acquisition costs. The transportation improvement costs in Table 6.6 include all projects identified in the Preferred Plan and represent an ideal scenario. The costs in Table 6.6 can be compared to Table 6.7, which illustrates the total projected funds available within the 20-year forecast. Details on how the forecast future funding scenario was developed are documented in Section 4. The approximately $6.0 million identified in Table 6.7 leaves a funding gap of approximately $8 million between the financial forecast and the projected costs of the Preferred Plan alternative.
Table 6.7 Forecast Future Transportation Funding
5-Year
Forecast 10-Year
Forecast
20-Year Forecast
ODOT $1,067,000 $2,135,000 $4,270,000
City $291,000 $581,000 $1,162,000
Other $150,000 $300,000 $601,000
Total $1,508,000 $3,016,000 $6,033,000
EXHIBIT "A"

City of Hubbard TSP, 2012 121
FINANCIALLY CONSTRAINED ALTERNATIVE The estimated costs to construct the Preferred Plan far exceed projected future transportation funding amounts. To describe a more likely future transportation system, a Financially Constrained Alternative for future improvements was also identified. The Financially Constrained Alternative considers project prioritization and costs and attempts to match them to the projected transportation funding flows while addressing as many of the city’s transportation needs as possible summary of current and future funding sources and recommendations to increase local funding for transportation facilities are addressed in the Transportation Financing Program found in Section 6. The Financially Constrained Alternative identifies the near-term, mid-term, and long-term roadway, pedestrian, bicycle, and transit improvements that can be achieved within the transportation funding forecast. The Financially Constrained Alternative was developed by the project team with guidance from the Project Advisory Committee, Planning Commission, City Council, and results of a public survey. The timelines were identified based on the project priorities identified for the Preferred Plan above, project costs, city needs, and the projected funding flows. For example, if the projected funding was only sufficient to accomplish the high-priority projects, those projects were divided into near-term, mid-term, and long-term projects based on the assumption that the forecast funding would be spread out evenly among the next twenty years. All priority roadway improvements were included in the Financially Constrained Alternative. The remaining funding was allocated to pedestrian and bicycle projects. These specific, non-auto projects were selected based on the project priorities identified for the Preferred Plan. Figure 6.2 provides a map of the Financially Constrained Alternative. Tables 6.8 through 6.11 summarize the proposed Financially Constrained Alternative projects by mode and time-frame.
EXHIBIT "A"

D ST
3RD ST
5TH STG ST
HIGHWAY 99
E HY
4TH ST
J ST
A ST
7TH ST
1ST ST
C ST
2ND ST
NE FRONT ST
E ST
BAINES BV
I STNE J ST
NE DUNN RD
NE PA
INTE
R LPNE PUBLIC RD
INDU
STRI
AL AV
ALLAN AV
F ST
H ST
DORSEY DRNE BOONES FERRY RD
NE BROADACRES RD
NE 5T
H ST
NE WHISKEY HILL RD
10TH ST
ASH STELM ST
OAK
ST
NE M
INER
AL S
PRIN
GS R
D
SUNSET DR
6TH ST
KARI LN
RIVIERA CT
CASTEEL ST
NE 4TH ST
NE SCHMIDT LN
B ST
HOOD
VIEW
DR
OAK RIDGE LN
NINA PL
WEST PL
9TH ST
KURTH AV
WALN
UT CT
BEAVER CT
MAPLE ST
PARKWAY BV
MILL CREEK LN
PACIFIC CR
RAINBOW LP
SCHMIDT LN
BASILIO DR
NE LA
NDUR
A CT
RUDOMETKIN DR
NE CEDAR DR
VICKIE CT
J ST
B ST
C ST
E ST
B ST
9TH ST
Financially Constrained Alternative
Improvements6.2
Figure
NH:
\projf
ile\11
454 -
City
of H
ubba
rd TS
P Upd
ate\gi
s\mxd
s\Fig_
base
_8x1
1.mxd
Hubbard TSP Update May 2012
Roadway ImprovementsCenter Turn LaneSB Through/Turn Lane5-Lane OptionShoulder BikewayNew Sidewalk ProjectSidewalk Repair Project
Crossing ImprovementsOR 99E
RailroadRailroadUrban Growth BoundaryHubbardTaxlotsCity Limits
R1
R2
R3R2
P1
P1
P2
P2
P3
P8
P9
P10
P11
B1
R# - Roadway Improvement Project #P# - Pedestrian Improvement Project #B# - Bicycle Improvement Project #T# - Transit Improvement Project #S# - Rail Improvement Project #
R3
P22
P17
P21
P5
P6
P7
P12
P18
P13
P16P15
P20
EXHIBIT "A"
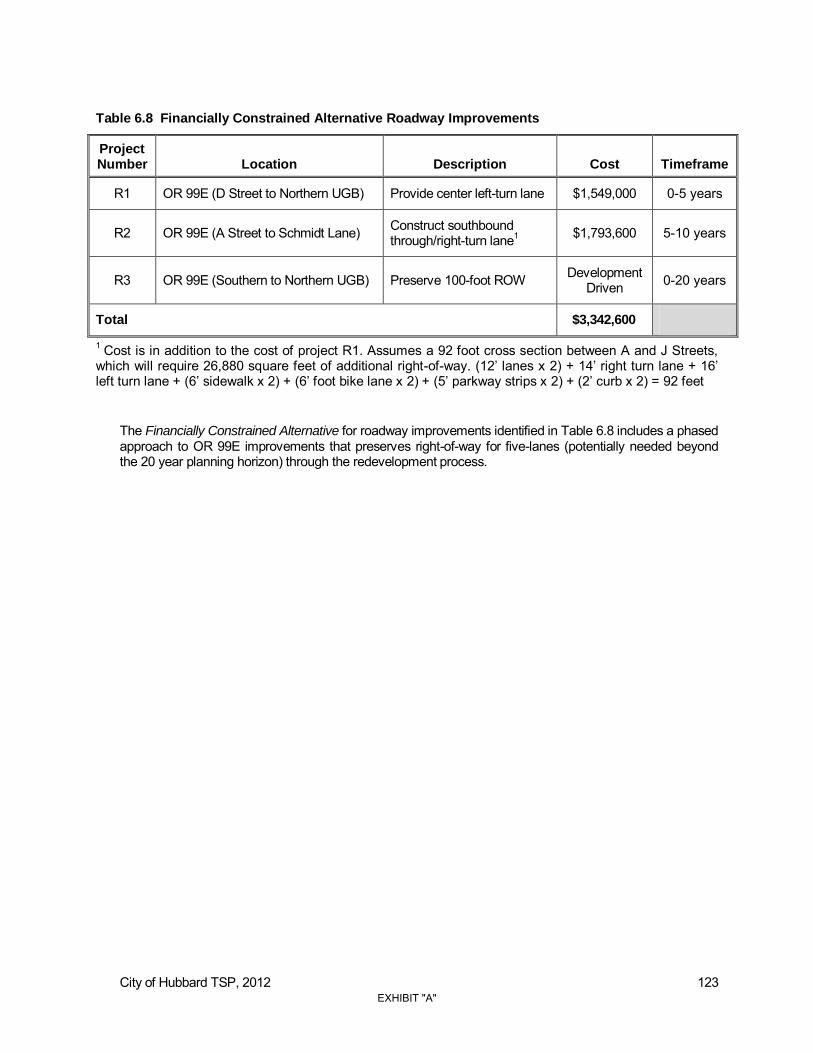
City of Hubbard TSP, 2012 123
Table 6.8 Financially Constrained Alternative Roadway Improvements
Project Number Location Description Cost Timeframe
R1 OR 99E (D Street to Northern UGB) Provide center left-turn lane $1,549,000 0-5 years
R2 OR 99E (A Street to Schmidt Lane) Construct southbound through/right-turn lane1 $1,793,600 5-10 years
R3 OR 99E (Southern to Northern UGB) Preserve 100-foot ROW Development Driven 0-20 years
Total $3,342,600
1 Cost is in addition to the cost of project R1. Assumes a 92 foot cross section between A and J Streets, which will require 26,880 square feet of additional right-of-way. (12’ lanes x 2) + 14’ right turn lane + 16’ left turn lane + (6’ sidewalk x 2) + (6’ foot bike lane x 2) + (5’ parkway strips x 2) + (2’ curb x 2) = 92 feet
The Financially Constrained Alternative for roadway improvements identified in Table 6.8 includes a phased approach to OR 99E improvements that preserves right-of-way for five-lanes (potentially needed beyond the 20 year planning horizon) through the redevelopment process.
EXHIBIT "A"
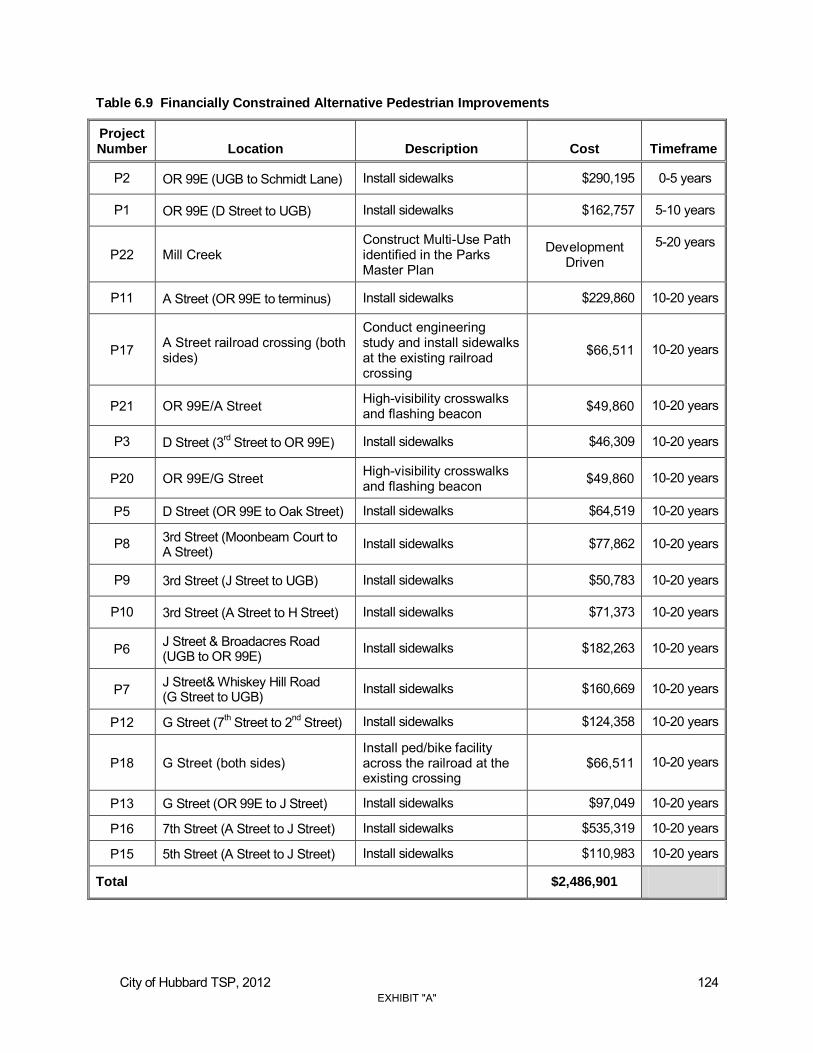
City of Hubbard TSP, 2012 124
Table 6.9 Financially Constrained Alternative Pedestrian Improvements
Project Number Location Description Cost Timeframe
P2 OR 99E (UGB to Schmidt Lane) Install sidewalks $290,195 0-5 years
P1 OR 99E (D Street to UGB) Install sidewalks $162,757 5-10 years
P22 Mill Creek Construct Multi-Use Path identified in the Parks Master Plan
Development Driven
5-20 years
P11 A Street (OR 99E to terminus) Install sidewalks $229,860 10-20 years
P17 A Street railroad crossing (both sides)
Conduct engineering study and install sidewalks at the existing railroad crossing
$66,511 10-20 years
P21 OR 99E/A Street High-visibility crosswalks and flashing beacon $49,860 10-20 years
P3 D Street (3rd Street to OR 99E) Install sidewalks $46,309 10-20 years
P20 OR 99E/G Street High-visibility crosswalks and flashing beacon $49,860 10-20 years
P5 D Street (OR 99E to Oak Street) Install sidewalks $64,519 10-20 years
P8 3rd Street (Moonbeam Court to A Street) Install sidewalks $77,862 10-20 years
P9 3rd Street (J Street to UGB) Install sidewalks $50,783 10-20 years
P10 3rd Street (A Street to H Street) Install sidewalks $71,373 10-20 years
P6 J Street & Broadacres Road (UGB to OR 99E) Install sidewalks $182,263 10-20 years
P7 J Street& Whiskey Hill Road (G Street to UGB) Install sidewalks $160,669 10-20 years
P12 G Street (7th Street to 2nd Street) Install sidewalks $124,358 10-20 years
P18 G Street (both sides) Install ped/bike facility across the railroad at the existing crossing
$66,511 10-20 years
P13 G Street (OR 99E to J Street) Install sidewalks $97,049 10-20 years
P16 7th Street (A Street to J Street) Install sidewalks $535,319 10-20 years
P15 5th Street (A Street to J Street) Install sidewalks $110,983 10-20 years
Total $2,486,901
EXHIBIT "A"

City of Hubbard TSP, 2012 125
The Financially Constrained Alternative for pedestrian improvements is identified in Table 6.9 and includes as many improvements as possible while balancing the needs of the other modes, according to priorities identified in the Preferred Plan.
Table 6.10 Financially Constrained Alternative Bicycle Improvements
Project Number Location Description Cost Timeframe
B1 Hwy 99E Install bike lanes $161,400 0-5 years
Total $161,400 1 Additional right-of-way will need to be acquired to extend a bike lane on D Street west of 7th Street. The cost estimate includes right-of-way acquisition for this segment.
Bicycle improvements identified in Table 6.10 were chosen based on priorities in the Preferred Plan while balancing costs with other modes. Only the bicycle improvements on OR 99Ewere included. OR 99E has the highest traffic volumes, vehicle speeds, and heavy truck volumes in Hubbard; therefore creating the greatest safety and comfort concerns for bicyclists. The total cost of the transportation improvements contained in the Financially Constrained Alternative have been constrained to the financial forecast of approximately $6 million, as shown in Table 6.11.
Table 6.11 Financially Constrained Planning Level Transportation Improvement Costs
Type 0-5 Years 5-10 Years 10-20 Years Total
Roadway $1,549,000 $1,793,600 Development Driven $3,342,600
Pedestrian $290,195 $166,862 $2,029,844 $2,486,901
Bicycle $161,400 $0 $0 $161,400
Total $2,000,595 $1,960,462 $2,029,844 $5,990,901
EXHIBIT "A"
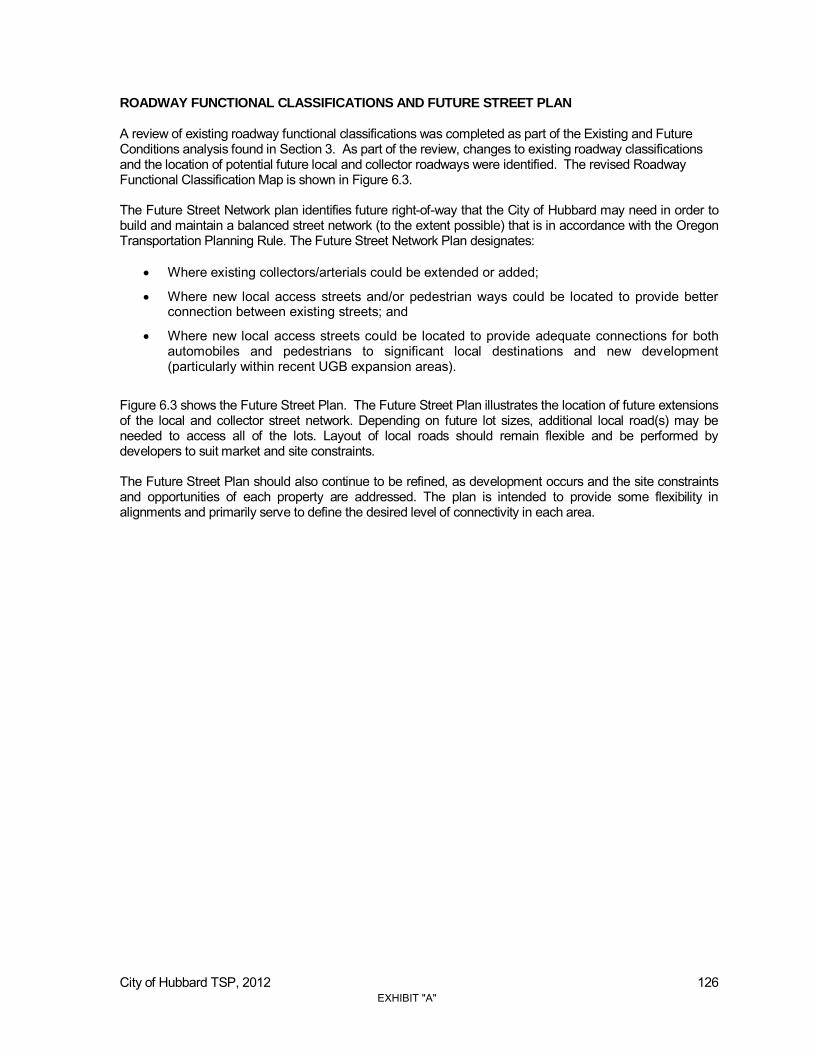
City of Hubbard TSP, 2012 126
ROADWAY FUNCTIONAL CLASSIFICATIONS AND FUTURE STREET PLAN
A review of existing roadway functional classifications was completed as part of the Existing and Future Conditions analysis found in Section 3. As part of the review, changes to existing roadway classifications and the location of potential future local and collector roadways were identified. The revised Roadway Functional Classification Map is shown in Figure 6.3. The Future Street Network plan identifies future right-of-way that the City of Hubbard may need in order to build and maintain a balanced street network (to the extent possible) that is in accordance with the Oregon Transportation Planning Rule. The Future Street Network Plan designates:
Where existing collectors/arterials could be extended or added;
Where new local access streets and/or pedestrian ways could be located to provide better connection between existing streets; and
Where new local access streets could be located to provide adequate connections for both automobiles and pedestrians to significant local destinations and new development (particularly within recent UGB expansion areas).
Figure 6.3 shows the Future Street Plan. The Future Street Plan illustrates the location of future extensions of the local and collector street network. Depending on future lot sizes, additional local road(s) may be needed to access all of the lots. Layout of local roads should remain flexible and be performed by developers to suit market and site constraints. The Future Street Plan should also continue to be refined, as development occurs and the site constraints and opportunities of each property are addressed. The plan is intended to provide some flexibility in alignments and primarily serve to define the desired level of connectivity in each area.
EXHIBIT "A"

D ST
3RD ST
5TH STG ST
HIGHW
AY 99
E HY
4TH ST
J ST
A ST
7TH ST
1ST ST
C ST
2ND ST
NE FRONT S
T
E ST
BAINES BV
I STNE J ST
NE DUNN RD
NE PA
INTE
R LPNE PUBLIC RD
INDU
STRI
AL AV
ALLAN AV
F ST
H ST
DORSEY DRNE BOONES FE
RRY RD
NE BROADACRES RD
NE WHISKEY HILL RD
10TH ST
ASH STELM ST
OAK
ST
NE M
INER
AL S
PRIN
GS R
D
SUNSET DR
6TH ST
KARI LN
RIVIERA CT
CASTEEL ST
NE 4TH ST
NE SCHMIDT LN
B ST
HOOD
VIEW
DR
OAK RIDGE LN
NINA PL
WEST PL
9TH ST
KURTH AV
WALN
UT CT
MILL ST
BEAVER CT
MAPLE ST
PARKWAY BV
PACIFIC CR
RAINBOW LP
BASILIO DR
NE LA
NDUR
A CT
NE CEDAR DR
J ST
B ST
C ST
E ST
B ST
9TH ST
Future Street Plan 6.3
Figure
NH:
\projf
ile\11
454 -
City
of H
ubba
rd TS
P Upd
ate\gi
s\mxd
s\Fig_
base
_8x1
1.mxd
Hubbard TSP Update October 2011
Future Street PlanFuture CollectorFuture Local RoadMajor ArterialMinor ArterialCollectorLocal RoadPrivate Road
RailroadUrban Growth BoundaryHubbardTaxlotsCity Limits
EXHIBIT "A"

City of Hubbard TSP, 2012 128
STREET CROSS-SECTION STANDARDS
Figure 6.4 illustrates the Street Cross-Section Standards developed as part of the 2012 Transportation System Plan update. These standards are consistent with ODOT Rural Arterial design standards and the streetscape recommendations contained in the Hubbard Downtown Revitalization Plan. OR 99E is the only major arterial in Hubbard. The addition of “Phase I” and “Phase II” major arterial standards provides flexibility for a phased expansion of OR 99E to accommodate growth and development on the corridor as it occurs. D Street, J Street, and 3rd Street comprise the minor arterial network in Hubbard. The proposed minor arterial design standards incorporate the recommendations of the Downtown Revitalization Plan and acknowledge the unique character of 3rd Street and the historic downtown area.xxxvii These standards provide a 12-foot sidewalk and on-street parking fronting buildings on the western side of 3rd Street, and a landscaped buffer on the eastern side of the street fronting the railroad right-of-way. The existing “Phase II” collector standard has been eliminated because no collectors other than G Street are anticipated to meet the 3,000 vehicle per day threshold. Table 6.12 summarizes the roadway cross-section standards.
EXHIBIT "A"
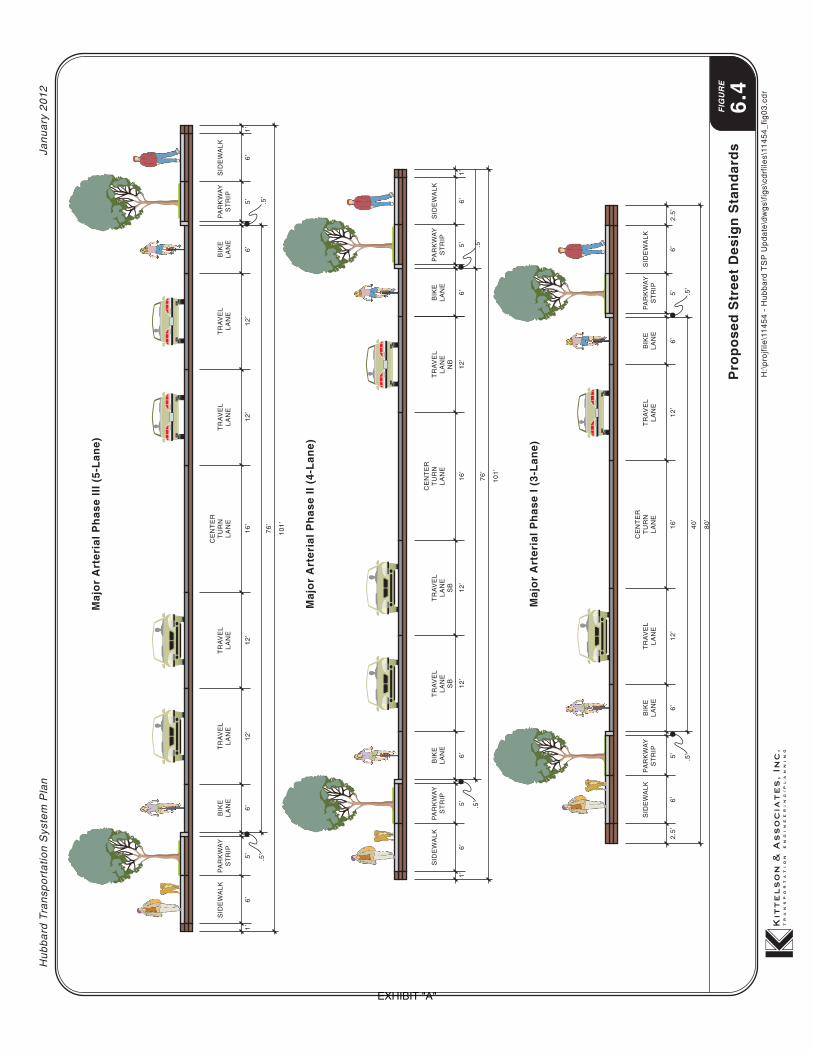
EXHIBIT "A"
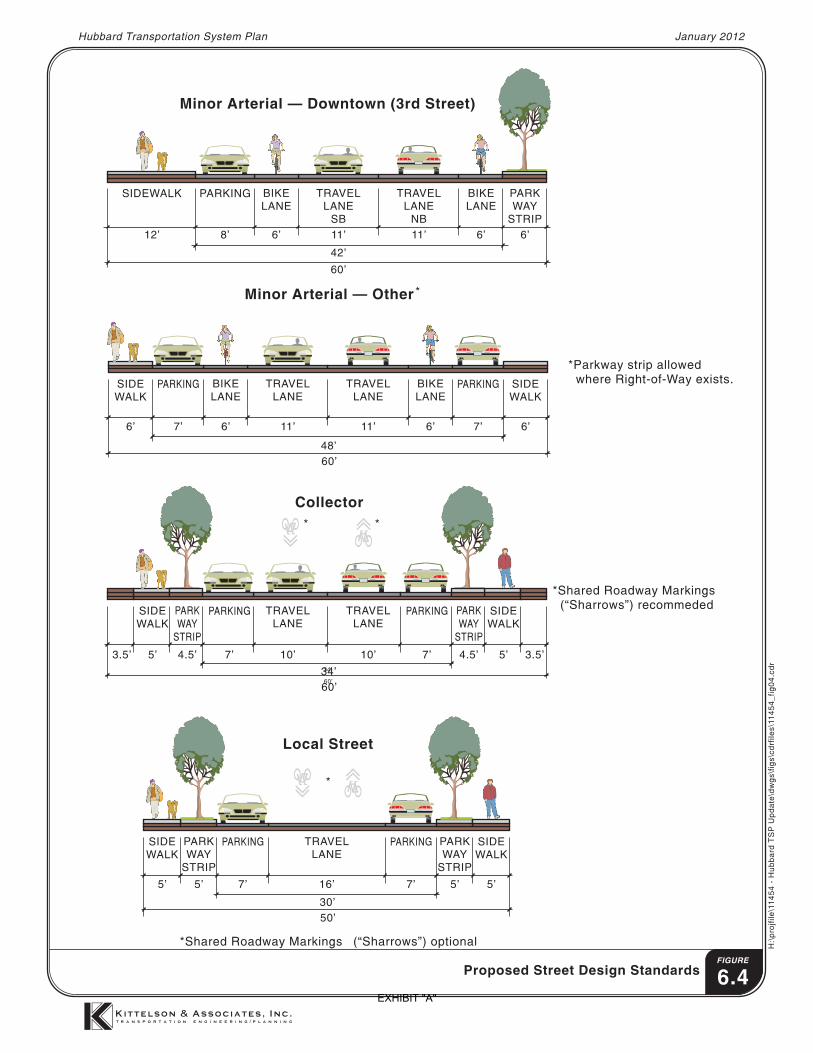
EXHIBIT "A"

City of Hubbard TSP, 2012 131
Table 6.12 Hubbard Street Design Standards
Functional Classification
ROW Width
2 Paved Width
Travel Lanes
Turning Lane Parking
Parkway Strip
Sidewalk Width
Bikeway Type and Standards
Major Arterial
Phase I 80 52 2 12’ lanes
1 16’ lane None 2
5’ strips 2
6’ sidewalks
2 6’ bike lanes
Phase II 101 64 3
12’ lanes7
1 16’ lane None 2
5’ strips 2
6’ sidewalks
2 6’ bike lanes
Phase III 101 76 4 12’ lanes
1 16’ lane None 2
5’ strips 2
6’ sidewalks
2 6’ bike lanes
Minor Arterial
Downtown (3rd Street)
60 42 2 11’ lanes None
8’ West side
6’ East side
12’ West side
2 6’ bike lanes
Other 60 483 2 11’ lanes None
7’ Both sides
None 2 6’ sidewalks
2 6’ bike lanes
Collector
Collector4 60 343 2 10’ lanes None
7’ Both sides
2 4.5’ strips
2 5’ sidewalks
Shared Roadway
Local
Local Street or Cul-de-sac 50 303 1
16’ lane None 7’
Both sides
2 5’ strips
2 5’ sidewalks
Shared Roadway
Cul-de-sac-bulb 46 40 None 1
5’ strip 2
5’ sidewalks Shared
Roadway 1All dimensions in table are in feet. 2ROW = right-of-way 3 Greater widths may be required at intersections with turn lanes. 4 Collectors should be considered for reclassification as minor arterials when traffic volumes exceed 3,000 ADT. 5Parking allowed on both sides if driveways are staggered or if additional right-of-way permits. 6 Parkway strips allowed where right-of-way permits. 7Two southbound and one northbound lane.
EXHIBIT "A"

City of Hubbard TSP, 2012 132
ACCESS MANAGEMENT
Access management is the process in which access to land development is balanced with the need for safe and efficient traffic flow of the roadway system. Access management standards area closely associated with the functional classification of a roadway. Typically, along state highways and arterials, the frequency of driveways and intersecting streets is more restrictive because the movement of traffic usually takes a higher priority. Along collector streets, access standards are less restrictive than along arterials and state highways to allow a greater balance between access and mobility. Access standards along local streets are restricted by safety considerations, as property access is the primary function of these streets. Table 6.13 summarizes the access spacing standards for each roadway classification.
Table 6.13 Hubbard Access Management Standards
Functional Classification
Minimum Spacing (feet)
Between Public Roadways
Between Private Roadways
Between Traffic Signals
Rural Regional Highway (ODOT) Per ODOT standards Per ODOT standards Per ODOT
standards Major Arterial (City) 1,320 300 – 500 1,320 – 2,640 Minor Arterial (City) 400 150 – 300 - Collector (City) 400 100 – 150 -
Summary
The Preferred Plan provides a comprehensive set of projects to address the city’s needs for the Transportation System Plan. However, the total costs of the Preferred Plan far exceed the projected transportation funding over the twenty year horizon of the plan. The Financially Constrained Alternative uses the identified project priorities to establish a set of projects that is a more likely future scenario based on projected funding, while still addressing as many of the city’s needs as possible. Additional elements of the TSP include, an updated Roadway Functional Classification Map, Future Street Plan, Street Design Standards, and Access Management Standards.
EXHIBIT "A"

City of Hubbard TSP, 2012 133
EXHIBIT "A"

City of Hubbard TSP, 2012 134
Section 7 Implementation of the
Transportation System Plan
EXHIBIT "A"

City of Hubbard TSP, 2012 135
Implementation of the Transportation System Plan This section includes a description of the actions needed to implement the Transportation System Plan (TSP). These actions include the development of a Transportation Financing Program that identifies funding sources and strategies to complete the transportation improvement projects included in the TSP. These actions also include the development of transportation policies and land use regulations that are designed to enable and carry out the requirements of the TSP. TRANSPORTATION FINANCING PROGRAM The previous section identified a list of planned transportation facilities and major improvements, provided a general estimate of the priority and timing of improvements, and provided conceptual capital cost estimates. The following section provides an overview of existing and anticipated funding sources and identifies additional strategies for funding capital projects.
Projected Transportation Funding The Existing and Future Conditions Section documented the funding sources of transportation projects within the City of Hubbard over the previous twelve years. The total dollar value of the 24 projects completed between 2000 and 2011 is approximately $3.6 million (2010 dollars). None of the past funding sources have been from dedicated funds. The majority of transportation projects were funded by grants administered by ODOT. Funding for transportation improvements have also utilized local transportation funds and funding from an Oregon parks grant, private developers, and a Community Development Block Grant (CDBG). An average of approximately $301,000 per year in 2010 dollars has been spent within Hubbard on transportation projects over the past twelve years; approximately $213,500 per year of which has historically been provided by ODOT and ODOT Grants. The City of Hubbard has provided approximately $58,100 per year on average for transportation projects while other sources have provided approximately $30,000 per year. An estimate of future funding was based on past funding trends. Table 7.1 provides a summary of the estimated future project funding (in year 2010 dollars) over the next five, ten, and twenty years based on an assumed average funding level of approximately $301,000 per year (the forecast numbers are cumulative). As shown in Table 7.1, approximately $6.0 million is projected to be available over the next twenty years for transportation projects based on historic funding levels from the City, ODOT, and other sources.
Table 7.1 Forecast Future Transportation Funding
5-Year Forecast 10-Year Forecast 20-Year Forecast
ODOT $1,067,000 $2,135,000 $4,270,000
City $291,000 $581,000 $1,162,000
Other $150,000 $300,000 $601,000
Total $1,508,000 $3,016,000 $6,033,000
EXHIBIT "A"

City of Hubbard TSP, 2012 136
Preferred Plan Costs Table 7.2 provides an overview of the transportation improvements identified for the Preferred Plan. As shown, the total cost of the Preferred Plan is approximately $14 million.
Table 7.2 Total Planning Level Transportation Improvement Costs (Preferred Plan)1
Type High Priority Medium Priority Low Priority Total
Roadway $1,549,000 $3,928,000 $3,449,000 $8,926,000
Pedestrian $1,045,510 $724,473 $1,003,832 $2,773,815
Bicycle $839,100 $836,580 $462,229 $2,137,909
Transit N/A $10,000 $163,600 $173,600
Rail N/A N/A $35,000 $35,000
Total $2,755,910 $6,176,753 $5,113,661 $14,046,324
1 Costs include estimated right-of-way acquisition costs.
Financially Constrained Alternative
Between the projected transportation funding levels (Table 7.1) and Preferred Plan (Table 7.2), there is an approximately $8 million funding gap. Projected future funding levels were used to create the Financially Constrained Alternative presented in the previous section. The Financially Constrained Alternative identifies the near-term, mid-term, and long-term improvements that can be achieved within the transportation funding forecast. Table 7.3 identifies the funding by project type for the short-term (0-5 years), medium-term (5-10 years), and long-term (10-20 years) horizons.
Table 7.3 Financially Constrained Planning Level Transportation Improvement Costs
Type 0-5 Years 5-10 Years 10-20 Years Total
Roadway $1,549,000 $1,793,600 Development Driven $3,342,600
Pedestrian $290,195 $166,862 $2,029,844 $2,486,901
Bicycle $161,400 $0 $0 $161,400
Total $2,000,595 $1,960,462 $2,029,844 $5,990,901
As shown in Table 7.3, additional funding will be needed to fund the high-priority short and medium-term projects identified in the Financially Constrained Alternative. A portion of this gap could be financed by increasing the TSDC rate or pursuing new transportation funding sources that Hubbard has not used in the past. See Appendix S for information on each of the above funding sources.
EXHIBIT "A"

City of Hubbard TSP, 2012 137
Additional Funding and Financing Sources
Hubbard has several options for enhancing transportation revenues for project construction activities. Potential options include revisions to the current street utility fee and transportation SDC methodology, which could result in additional revenues. These and other funding sources are listed in Table 7.4. A brief description of local considerations for each funding options is provided in Appendix S. Appendix S also includes a list of ODOT and Business Oregon contacts for current grant and loan funding opportunities.
Table 7.4 Existing and Potential Transportation Funding Sources
Funding Source
May Be Spent on Usually Requires Voter Approval Operations Capital
Street Fund (existing)
Street Construction Fund (existing)
General Fund (existing)
Transportation Utility Fee
Transportation System Development Charges
Local Option Taxes (i.e., property or fuel tax)
Local Improvement District
Reimbursement District
Economic Improvement District
Urban Renewal District
Parking Districts
General Obligation Bonds
Revenue Bonds
Grants and Loans
ODOT Funding Levels The transportation projects on the ODOT transportation system are not guaranteed funding or implementation through inclusion in the TSP. However, a variety of relatively smaller projects for which either ODOT or Hubbard will have primary funding responsibility are identified for implementation over the 20-year TSP planning horizon. The mobility standards for OR 99E are based on future operational performance forecasts that assume that these actions can be completed within the planning horizon using some combination of federal, state, local, and private funds. The recommended alternative meets the mobility standard threshold in the Oregon Highway Plan.
EXHIBIT "A"
City of Hubbard TSP, 2012 138
Order-of-magnitude cost estimates (also called planning-level cost estimates) were created for each of the TSP’s recommendations. This section provides a summary of these cost estimates, with tables organized by modal plan and approximate time frame. The recommendations are organized by approximate time frame: short term is assumed to be 0-5 years from plan adoption; medium-term is assumed to be 5-10 years; and long-term is assumed to be 10-20 years. These recommendations and time frames do not constitute a binding commitment for implementation within any time frame, but are simply a reflection of the time frame within which the need for the improvement becomes acute.
ODOT considers the construction of a five-lane cross section on OR 99E (Southern to Northern UGB) identified in this document as not reasonably likely to be constructed during the 20-year planning horizon. For recommended projects to be considered reasonably likely to be funded during the identified planning horizon, they must either be selected for inclusion in the STIP, associated with a specific source of funding that is supported by ODOT in writing. The STIP is a scheduling and funding document.
Unlike project lists contained in the STIP, the TSP project list is not required by federal or state law to be “fiscally constrained.” Fiscal constraint is defined as a “demonstration of sufficient funds (federal, state, local, and private) to implement proposed transportation system improvements, as well as to operate and maintain the entire system, through a comparison of revenues and costs.” (Source: Federal Highway Administration web page: http://www.fhwa.dot.gov/planning/fcdef62805.htm ) This means that this plan can provide a single comprehensive list of regional transportation improvements needs and associated costs without having to provide a fiscal rationale as to how the respective projects will be funded. With this rationale, however, the projects cannot be used to support local land use changes.
The TSP recommendations, therefore, act only as a reference for regional and local officials to consult when (1) considering projects to propose to the State for inclusion in the STIP; (2) developing priorities for local funding; (3) determining project needs associated with private development proposals; and (4) determining projects needed to support publicly or privately initiated plan comprehensive amendments and zone changes. Because the cost of needed transportation improvements across the state far exceeds available funds, state officials must decide what projects to fund on the state system, through inclusion in the STIP, based on a thorough evaluation of all projects proposed statewide.
Transportation System Development Charges (TSDC)
As part of the TSP Update, the City of Hubbard updated its TSDC to incorporate projects from the updated TSP. SDCs are one-time fees imposed on new development or certain types of “major redevelopment.” They are intended to recover a fair share of the costs of existing and planned facilities that provide capacity to serve growth. Consequently, TSDC revenues may only be used as a funding source for projects that add capacity to the system. TSDCs cannot be used for operation or routine maintenance. Hubbard originally adopted its transportation TSDC in June 2005, and has made annual escalation adjustments since then. The current Hubbard transportation SDC applies to new development within the city for which a building permit is required, unless it is otherwise exempt. The current TSDC per dwelling unit charge was $3,572 as of February 2008. Non-residential TSDCs are based on calculated rates per unit of development in accordance with Institute of Transportation Engineers (ITE) land use classifications. The current basis for Hubbard’s transportation TSDC is an estimate of the “cost per new trip-end for SDC eligible capital improvement.” Hubbard’s current TSDC methodology is appropriate for local collector and arterial street projects, but cannot be applied to pedestrian/bicycle facilities that are not part of major street projects. As part of the TSDC update, the city updated its TSDC methodology to include a “person trip” basis for determining both a street TSDC and pedestrian/bicycle TSDC component allowing pedestrian and bicycle projects to be incorporated into the TSDC. This entailed an updated list of eligible capital improvement projects, which reflect the capacity-increasing share of roadways, pedestrian, and bicycle facility improvement costs. A copy of the updated TSDC report may be found in Appendix U.
EXHIBIT "A"

City of Hubbard TSP, 2012 139
IMPLEMENTING ORDINANCES Transportation implementing ordinances are needed to enable the construction of planned TSP facilities and protect planned transportation facilities. TSP implementing ordinances are also needed to ensure consistency with other adopted local policy and regulator documents, and to comply with the Oregon Transportation Planning Rule (TPR). The TPR requires cities to adopt policies and land use regulations for implementing the TSP as provided in OAR 660-12-045. A review of Hubbard’s Transportation goals and policies and related development ordinances, including the Hubbard Development Code was completed as part of the 2012 TSP update. Revisions and changes to existing policy statements and code requirements may be found in Appendix V.
EXHIBIT "A"

City of Hubbard TSP, 2012 140
Glossary
EXHIBIT "A"

City of Hubbard TSP, 2012 141
Glossary of Transportation Terms and Acronyms Access Management: Measures regulating access to streets, roads, and highways from public streets or roads and private driveways. Measures may include, but are not limited to, restrictions on the siting of interchanges, restrictions on the type and amount of access to roadways; and the use of physical controls, such as signals and channelization including raised medians to reduce impact of approaching traffic on the main facility. ADA: Americans with Disabilities Act of 1990. Federal legislation requiring that public facilities and commercial buildings have doorways, corridors, accessways, elevators, seating, and other facilities that are accessible to the handicapped population. Arterial Highway: A highway primarily for through traffic, usually on a continuous route. Average Daily Traffic (ADT): The annual average two-way traffic volume. It represents the total traffic for the year divided by 365. Bikeway: A bikeway is created when a road has the appropriate design treatment for bicyclists, based on motor vehicle traffic volumes and speeds: shared roadway, shoulder bikeway, bike lane or bicycle boulevard. Another type of facility is separated from the roadway: multi-use path. Bikelane: A portion of the roadway which has been designated by striping and pavement markings for the preferential or exclusive use of bicyclists. Comprehensive Plan: A local document that guides a community’s land use, conservation of natural resources, economic development, and public services. Plans contain data and information called the inventory, and the policy element. The policy element sets forth the community’s long-range objectives and the policies by which they will be achieved. The plan in adopted by ordinance and has the force of law. Demand Management: Actions which are designed to change travel behavior in order to improve performance of transportation facilities and to reduce need for additional road capacity. Methods may include but are not limited to the use of alternative modes, ridesharing and vanpool programs, and trip reduction ordinances. Demand Response Service: Non-fixed route service route utilizing vans or buses with passengers boarding and alighting at prearranged times at any location within the system’s service area. Sometimes referred to a “dial-a-ride”, it is designed to carry passengers from their origins to specific locations on an immediate basis or advanced reservation basis. DLCD: Department of Land Conservation and Development, the State of Oregon’s land use planning agency. Divided Highway: A two-way highway on which traffic traveling in opposite directions is physically separated by a median. Frontage Road (Local Service Road): A local street or road located parallel to an arterial highway for service to abutting properties for the purpose of controlling access to the arterial highway. Functional Classification: (see Table below). Implementing Measures: The mechanisms used to accomplish the goals, policies, and objectives contained in a comprehensive plan. There are a variety of measures and two common examples are zoning and land-subdivision ordinances. Intermodal: Connecting individual modes of transportation and/or accommodating transfers between such modes.
EXHIBIT "A"

City of Hubbard TSP, 2012 142
ISTEA: the federally enacted Intermodal Surface Transportation Efficiency Act of 1991 which provided authorizations for highway, highway safety, and mass transportation for the following six years. Level of Service: A quantitative measure of the effect of a number of factors on transportation service including speed and travel time, traffic interruptions, freedom of movement, safety, driving comfort, and convenience (see Table below). Mobility: Being able to move easily from place to place. Modes of Transportation: Mass transit, air, water, pipeline, rail, highways, bicycle, pedestrian types of travel and transport. The terms “modes”, mode connectivity”, and intermodal refer to these types of travel. Multimodal: Involving several modes of transportation. Paratransit: A general term for various types of transit service which differ (in one or more ways) from the standard fixed-route, large-bus service usually provided by transit agencies. Examples include demand-response and contracted fixed route service, among others. Paratransit services usually use smaller vehicles, such as vans, taxicabs, or small buses. Periodic Review: A broad reevaluation of the comprehensive plan that occurs every four to ten years. Public Transit: Bus, van, light rail and other surface transportation systems open to the general public which operate frequently and on predetermined routes and schedules. PDIA: Potential Development Impact Analysis: Estimates existing and potential development for residential, commercial, and industrial land based on U.S. Census data, local zoning ordinances, and aerial photos. Designed to help answer the question, “How many vehicle trips would be produced if every vacant, buildable parcel of property were developed at maximum density?”. OAR: Oregon Administrative Rules. A body of law that describes how legislation and other laws will be implemented. ODOT: Oregon Department of Transportation Rural: Any area not included in a business, industrial, or residential zone of moderate or high density, whether or not it is within the boundaries of a municipality. Shared Roadway Bikeway: A type of bikeway where bicyclists and motor vehicles share a travel lane. Shoulder Bikeway: A type of bikeway where bicyclists travel on a paved shoulder. SOV: Single-occupant vehicle STIP: Statewide Transportation Improvement Program Structures: A bridge, retaining wall, or tunnel. Transportation Disadvantaged: A term used to denote individuals without the ability or capability to use personal conveyances to travel. For example, these individuals may be the working poor, students, physically or mentally challenged people. TPR: The Transportation Planning Rule contained in Oregon’s Administrative Rule, Chapter 660, Division 12, which implements the statewide planning Goal 12: Transportation. Urbanizable area: Area between the Urban Growth Boundary and city limits that will eventually be developed.
EXHIBIT "A"

City of Hubbard TSP, 2012 143
UBA: Urban Business Area UGB: Urban Growth Boundary. A line drawn around a geographic area that separates urban use lands from resource, or rural, use lands; and shows where the city intends to grow. Urban: Any territory within an incorporated area or with frontage on a highway which is at least 50 percent built-up with structures devoted to business, industry, or residences for a distance of a quarter mile or more. Urbanizing: Areas within an urban growth boundary that are undeveloped. Variance: An authorization issued by the Department that allows a deviation from the Department’s access management standards. V/C ratio: Volume-to-capacity ratio, a measure of roadway congestion, calculated by dividing the number of vehicles passing through a section of highway during the peak hour by the capacity of the section (see Table 1.7). VMT: Vehicle miles of travel, Miles traveled per vehicle multiplied by the total number of vehicles. FUNCTIONAL CLASS CRITERIA
Classification
Primary Function
Typical Spacing
Typical Trip Length
Typical Projected Traffic Volume
Principal Arterial
Provides for trips passing through community and connecting regional centers.
2-3 miles
Over 5 miles
30,000 ADT+
Major Arterial
Serves as primary route between major urban activity areas and to access principal arterials.
1-2 miles
2 - 5 miles
15,000 - 30,000 ADT
Minor Arterial
Serves as the primary travel routes within community system and to augment and connect the arterial system.
1 mile
Over 1 mile
7,500 - 25,000 ADT
Major Collector
Channels traffic from minor collectors and local streets to arterials and provides limited property access.
½ - 1 mile
Under 1 mile
5,000 - 10,000 ADT
Minor Collector
Channels traffic from local streets to major collectors and arterial streets and provides property access.
¼ - ½ mile
½ - 1 mile
1,500 - 7,000 ADT
Local Street
Provides direct access to individual properties.
300-500 feet
Under ½ mile
1,500 ADT or less
EXHIBIT "A"
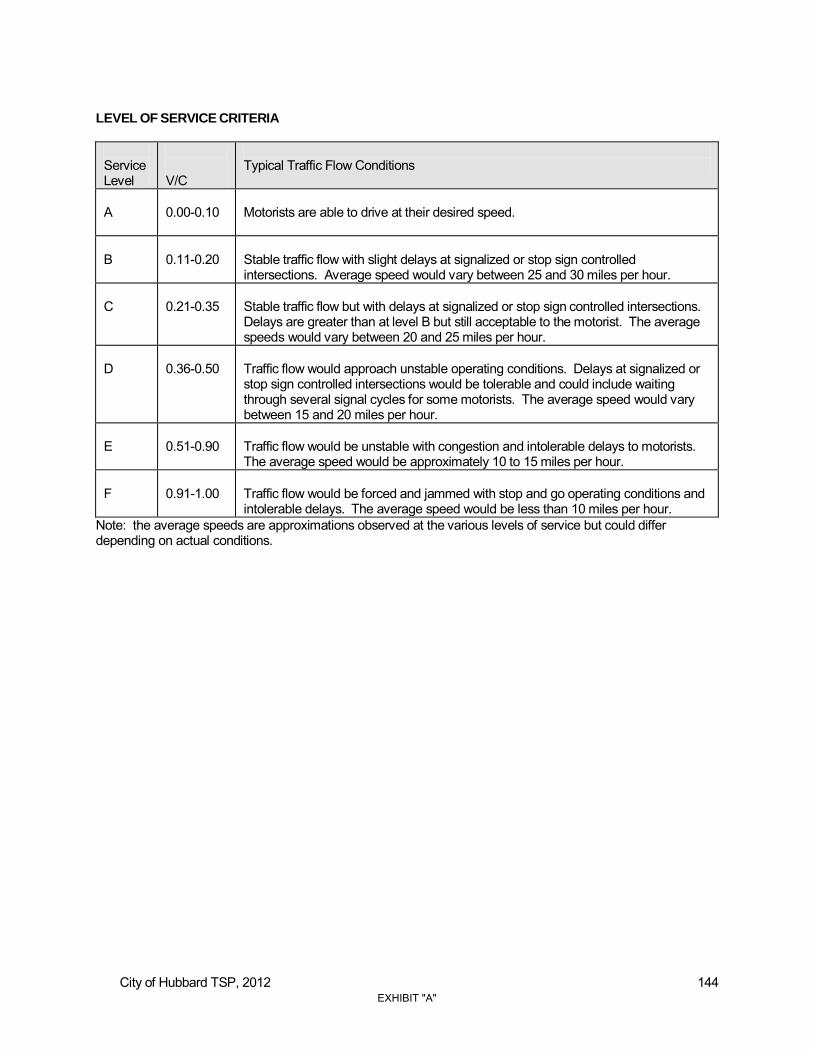
City of Hubbard TSP, 2012 144
LEVEL OF SERVICE CRITERIA
Service Level
V/C
Typical Traffic Flow Conditions
A
0.00-0.10
Motorists are able to drive at their desired speed.
B
0.11-0.20
Stable traffic flow with slight delays at signalized or stop sign controlled intersections. Average speed would vary between 25 and 30 miles per hour.
C
0.21-0.35
Stable traffic flow but with delays at signalized or stop sign controlled intersections. Delays are greater than at level B but still acceptable to the motorist. The average speeds would vary between 20 and 25 miles per hour.
D
0.36-0.50
Traffic flow would approach unstable operating conditions. Delays at signalized or stop sign controlled intersections would be tolerable and could include waiting through several signal cycles for some motorists. The average speed would vary between 15 and 20 miles per hour.
E
0.51-0.90
Traffic flow would be unstable with congestion and intolerable delays to motorists. The average speed would be approximately 10 to 15 miles per hour.
F
0.91-1.00
Traffic flow would be forced and jammed with stop and go operating conditions and intolerable delays. The average speed would be less than 10 miles per hour.
Note: the average speeds are approximations observed at the various levels of service but could differ depending on actual conditions.
EXHIBIT "A"

City of Hubbard TSP, 2012 145
This page left intentionally blank
EXHIBIT "A"
City of Hubbard TSP, 2012 146
Reference Section
EXHIBIT "A"

City of Hubbard TSP, 2012 147
REFERENCES
i Source: ODOT TSP Guidelines 2008; online at: http://www.oregon.gov/ODOT/TD/TP/
ii Source: PSE Population Research Center(PRC)November,2011.
iii Source: Marion County 2030 Adopted Forecast October, 2009.
iv Source: City of Canby website 2011: http://www.ci.canby.or.us/transportation/CAThomepage.htm
v Source: ODOT, 2001. Oregon Rail Plan.
vi Source: Correspondence with ODOT Rail Division. May 2011.
vii 2010 census data is not yet available at the census tract or block level, so analyzing the spatial distribution of the Hubbard population is not possible at this time. In addition, there is only one census tract and four partial census blocks located in Hubbard.
viii ODOT. Oregon Highway Plan. 1999. ix Transportation Research Board. Highway Capacity Manual. 2000. x Oregon Department of Transportation. Analysis Procedures Manual. 2006. xi More information on the method can be found in American Association of State Highway Officials’ (AASHTO) Highway Safety Manual, (Reference 4, see Chapter 4 Network Screening).
xii Not all crashes that occur at an intersection are reflected in the reported data. Some crashes are not reported by motorists or do not exceed the property damage limit necessary to be reported and classified.
xiii Oregon Department of Transportation. Analysis Procedures Manual. 2006. xiv For the consistency with the Hubbard Comprehensive Plan, employment forecasts were allocated into the following two (2) land use categories:
Commercial: Retail Trade; Real Estate and Services. Industrial: Construction; Manufacturing; and Wholesale Trade, Transportation,
Communications and Utilities.
This analysis assumes growth in public sector employment will occur on existing public lands and that growth in agriculture, forestry and fishing industries will occur primarily on adjacent agricultural lands outside the urban area.
xv Institute of Transportation Engineers. Trip Generation Manual, 8th Edition. 2008.
xvi TPAU uses Signal Warrants 1, Case A and Case B (MUTCD), which deal primarily with high volumes on the intersecting minor street and high volumes on the major-street. Meeting preliminary signal warrants does not guarantee that a signal shall be installed. Before a signal can be installed a field warrant analysis is conducted by the Region. If warrants are met, the State Traffic Engineer will make the final decision on the installation of a signal.
EXHIBIT "A"

City of Hubbard TSP, 2012 148
xvii Washington State Department of Transportation (WSDOT) provides extensive information on construction cost trends of several States (Washington, California, Colorado, Oregon, South Dakota, and Utah) and is referenced on the FWHA construction cost website. http://www.wsdot.wa.gov/biz/construction/constructioncosts.cfm
xviii Specific exceptions to this prohibition are allowed by statute.
xix The existing two-way left-turn lane on OR 99E in Hubbard is 14 feet. The ODOT Highway Design Manual indicates that a 16 foot two-way left-turn lane should be used on rural arterial highways with design speeds greater than 60 miles per hour.
xx (12’ lanes x 2) + 16’ turn lane + (6’ sidewalk x 2) + (6’ foot bike lane x 2) + (5’ parkway strips x 2) + (2’ curb x 2) = 78 feet
xxi The desirable spacing of signalized intersections on regional highways is 0.5 mile. D Street and G Street are only 0.15 miles apart and D Street and J Street are approximately 0.28 miles apart, however, the State Traffic Engineer can approve installation of a traffic signal at locations where 1/2-mile spacing is infeasible due to a variety of reasons.
The OR 99E/J Street intersection was also considered as a potential signal location, G Street was selected as the preferred location despite its close proximity to the existing D Street signal due to G Street’s higher total and turning movement volumes, history of crashes involving vehicles crossing OR 99E, and connection to a railroad crossing.
xxii For the purpose of this analysis, it was assumed that eastbound left turn and through movements would redistribute evenly between the D Street and G Street intersections after installation of a traffic signal causing the G Street intersection to meet preliminary signal warrants. This amount of diversion is considered likely based on a review of historic traffic volumes and the current unbalance between traffic volumes entering OR 99E at D Street and exiting OR 99E at G Street.
xxiii For the purpose of this analysis, it was assumed that westbound left turn movements would redistribute evenly between the G Street and J Street intersections after installation of a traffic signal and left turn lanes.
xxiv Existing Hubbard Street Design Standards for collector streets require a 60 foot right of way, but do not include a turn lane. (11’ lanes x 2) + (12’ turn lane) + (5’ sidewalk x 2) + (6’ foot bike lane x 2) + (4.5’ parkway strips x 2) + (2’ curb x 2) = 69 feet
xxv (12’ lanes x 2) + 14’ right turn lane + 16’ left turn lane + (6’ sidewalk x 2) + (6’ foot bike lane x 2) + (5’ parkway strips x 2) + (2’ curb x 2) = 92 feet
xxvi (12’ lanes x 4) + 16’ turn lane + (6’ sidewalk x 2) + (6’ foot bike lane x 2) + (5’ parkway strips x 2) + (1’ curb x 2) = 100 feet
xxvii (12’ lanes x 2) + 16’ turn lane + (6’ sidewalk x 2) + (6’ foot bike lane x 2) + (5’ parkway strips x 2) + (2’ curb x 2) = 78 feet
xxviii (12’ lanes x 4) + 16’ turn lane + (6’ sidewalk x 2) + (6’ foot bike lane x 2) + (5’ parkway strips x 2) + (1’ curb x 2) = 100 feet
xxix (12’ lanes x 2) + 14’ right turn lane + 16’ left turn lane + (6’ sidewalk x 2) + (6’ foot bike lane x 2) + (5’ parkway strips x 2) + (2’ curb x 2) = 92 feet
EXHIBIT "A"
City of Hubbard TSP, 2012 149
xxx The 1999 Hubbard TSP proposed connecting 10th Street to Baines Boulevard, this alignment is not financially feasible due to slopes, wetlands, riparian, and floodplain constraints. The alternative connection of 10th Street to 9th Street avoids these obstacles.
xxxi This “loop road” was proposed in the 1999 Hubbard TSP in order to create an alternative to OR 99E for some local trips.
xxxii Widening the existing 20-foot alley cross section to a 50-foot local street cross section may impact several existing properties.
xxxiii The proposed cross section has been modified from that recommended in the Downtown Revitalization Plan to include two 6-foot bike lanes as opposed to one. In areas where only one bike lane is provided, cyclists may tend to ride both directions in the bike lane, causing conflicts with other cyclists and vehicles at intersections.
xxxiv (24 foot clearance between the top of the railroad track and the bottom of the bridge structure + 7 foot bridge structure) / 3% typical maximum design grade = 1,035 feet
xxxv Pedestrian crossing improvements on OR 99E will need to be considered and approved by ODOT.
xxxvi The western half of OR 99E between J Street and 800 feet south of Schmidt Lane has already been constructed at a sufficient width to accommodate two southbound travel lanes. On this segment only striping and shoulder improvements are needed.
xxxvii The proposed cross section has been modified from that recommended in the Downtown Revitalization Plan to include two 6-foot bike lanes as opposed to one. In areas where only one bike lane is provided, cyclists may tend to ride both directions in the bike lane, causing conflicts with other cyclists and vehicles at intersections.
EXHIBIT "A"
ORDINANCE 324-2012 EXHIBIT B Page 1 of 21
AMENDMENTS TO THE HUBBARD DEVELOPMENT CODE New language is shown in bold underline. Deleted language is shown in strikeout.
CHAPTER 1
GENERAL ORDINANCE PROVISIONS 1.200 DEFINITIONS
Clear-Vision Area: See Vision Clearance. A triangular area on a lot at the intersection of two streets or a street and a railroad, two sides of which are lines measured from the corner intersection of the right-of-way lines for a distance of twenty (20) feet. The third side of the triangle is a line across the corner of the lot joining the ends of the other two sides. Where the lines at the intersections have rounded corners the right-of-way lines will be extended in a straight line to a point of intersection. Level of Service ("LOS"): A quantitative standard for transportation facilities describing operational conditions. Level of Service may be described for intersections (signalized or unsignalized) or street segments (between signalized intersections). Parkway Strip: A landscape area for street trees and other plantings within the public right-of-way, usually a continuous planter area between the street and a sidewalk.
Street: The entire width between the boundary lines of every way of travel which provides for public or private use for the purpose of providing ingress and egress for vehicular and pedestrian traffic and the placement of utilities to one or more lots, parcels, areas or tracts of land. A private way is excluded that is created to provide ingress and egress to land in conjunction with the use of such land for forestry, mining or agricultural purposes.
A. Alley: A narrow street through a block used primarily for access by service
vehicles to the back or side of properties fronting on another street. B. Arterial, minor/major: The highest order classification of streets; includes
highways and other major streets with limited or no direct access from adjoining properties. A street of considerable continuity which is used primarily for through traffic and interconnection between major areas of the City.
C. Collector: Type of street that serves traffic within commercial, industrial,
and residential neighborhood areas. Connects local neighborhood or district streets to the arterial network. A street supplementary to the arterial street system, used partly by through traffic and partly for access to abutting properties.

ORDINANCE 324-2012 EXHIBIT B Page 2 of 21
D. Cul-de-sac (dead-end): A short street with one end open to traffic and the
other terminated by a vehicle turn-around. E. Half Street: A portion of the width of a street, usually along the edge of a
subdivision, where the remaining portion of the street could be provided in another subdivision.
F. Frontage Road, Marginal Access Road: A service road parallel and adjacent
to a major arterial street providing access to abutting properties, but protected from through traffic.
G. Local Street: A street intended primarily for access to abutting properties, but
protected from through traffic.
Vision Clearance: Those areas near intersections of roadways and motor vehicle access points where a clear field of vision is necessary for traffic safety and to maintain adequate sight distance. A triangular area at the street intersection corner of a corner lot, or at the corner at any alley and street intersection. The triangular area is defined by a diagonal line connecting points on the right-of-way lines a prescribed distance from corner formed by the intersecting streets. Sight distance: The unobstructed viewing distance measured from one object or location to another object or location, usually required the purpose of traffic safety.
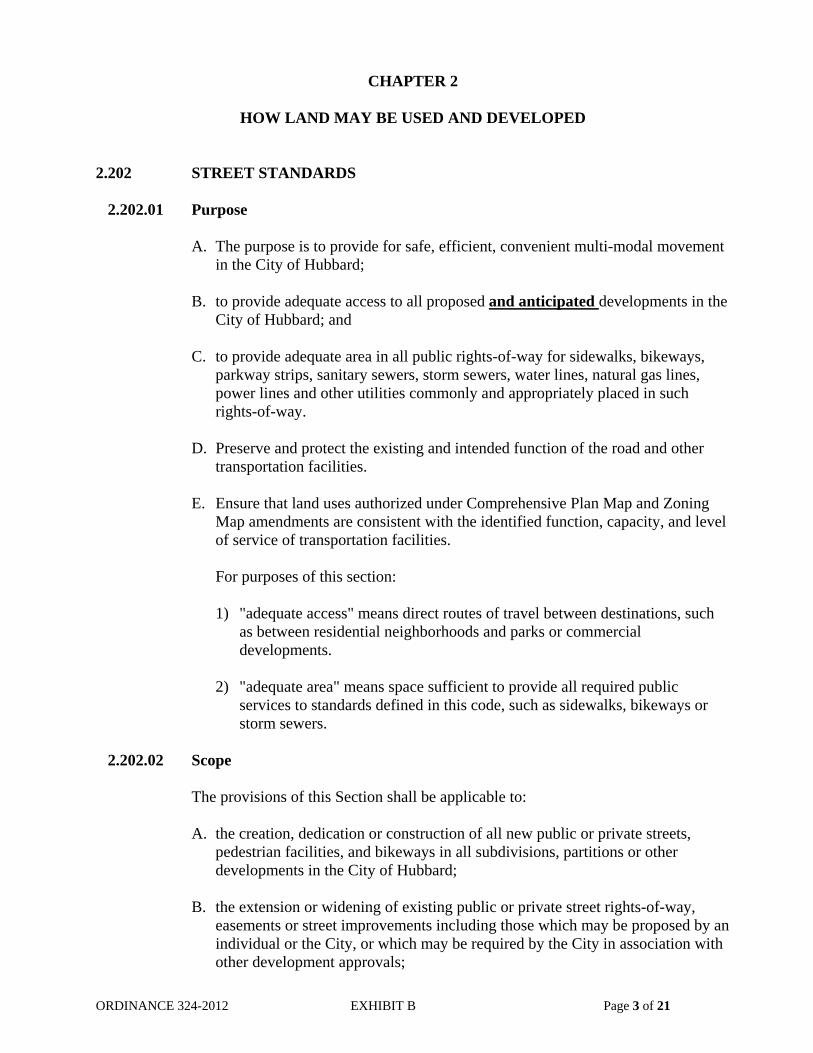
ORDINANCE 324-2012 EXHIBIT B Page 3 of 21
CHAPTER 2
HOW LAND MAY BE USED AND DEVELOPED 2.202 STREET STANDARDS 2.202.01 Purpose
A. The purpose is to provide for safe, efficient, convenient multi-modal movement in the City of Hubbard;
B. to provide adequate access to all proposed and anticipated developments in the
City of Hubbard; and C. to provide adequate area in all public rights-of-way for sidewalks, bikeways,
parkway strips, sanitary sewers, storm sewers, water lines, natural gas lines, power lines and other utilities commonly and appropriately placed in such rights-of-way.
D. Preserve and protect the existing and intended function of the road and other
transportation facilities. E. Ensure that land uses authorized under Comprehensive Plan Map and Zoning
Map amendments are consistent with the identified function, capacity, and level of service of transportation facilities.
For purposes of this section:
1) "adequate access" means direct routes of travel between destinations, such as between residential neighborhoods and parks or commercial developments.
2) "adequate area" means space sufficient to provide all required public
services to standards defined in this code, such as sidewalks, bikeways or storm sewers.
2.202.02 Scope The provisions of this Section shall be applicable to:
A. the creation, dedication or construction of all new public or private streets, pedestrian facilities, and bikeways in all subdivisions, partitions or other developments in the City of Hubbard;
B. the extension or widening of existing public or private street rights-of-way,
easements or street improvements including those which may be proposed by an individual or the City, or which may be required by the City in association with other development approvals;

ORDINANCE 324-2012 EXHIBIT B Page 4 of 21
C. the construction or modification of any utilities, sidewalks, or bikeways in
public rights-of-way or private street easements; and D. the planting of any street trees or other landscape materials in public
rights-of-way (parkway strip). 2.202.03 General Provisions
The following provisions shall apply to the dedication, construction, improvement or other development of all public streets in the City of Hubbard. These provisions are intended to provide a general overview of typical minimum design standards. All streets shall be designed in conformance of the specific requirements of the most current Public Works Design and Construction Standards and the Transportation System Plan of the City of Hubbard. The standards sections contained in the Public Works Design and Construction Standards in the City of Hubbard and the Transportation System Plan are minimum requirements only and shall not be construed as prohibiting the City Engineer from requiring thicker sections or engineer designed pavement sections in lieu of standards sections where conditions warrant.
A. The location, width and grade of streets shall be considered in their relation to
existing and planned streets, to topographical conditions, to public convenience and safety, and to the proposed use of the land to be served by the streets.
B. Development proposals shall provide for the continuation of all streets,
bikeways and pedestrian facilities within the development and to existing and planned streets, bikeways, and pedestrian facilities outside the development.
C. Alignment. All streets other than local streets or cul-de-sacs, as far as practical,
shall be in alignment with existing streets by continuation of the centerlines thereof. The staggering of street alignments resulting in "T" intersections shall, wherever practical, be avoided. However, when not practical, the "T" intersections shall leave a minimum distance of 200 feet between the center lines of streets having approximately the same direction and otherwise shall not be less than 100 feet.
D. Future Extension of Streets and Location of New Streets. Where necessary to
give access to, or permit a satisfactory future development of adjoining land, streets shall be extended to the boundary of a tract being developed and the resulting dead-end streets may be approved without turn-a-rounds, upon approval by emergency service agencies. Reserve strips and street plugs may be required to preserve the objectives of street extensions.
Street locations shall conform to the Hubbard Transportation System Plan
and an approved street plan or subdivision plat. Where the location of a street is not shown in an existing street plan, the location of streets in a development shall either:
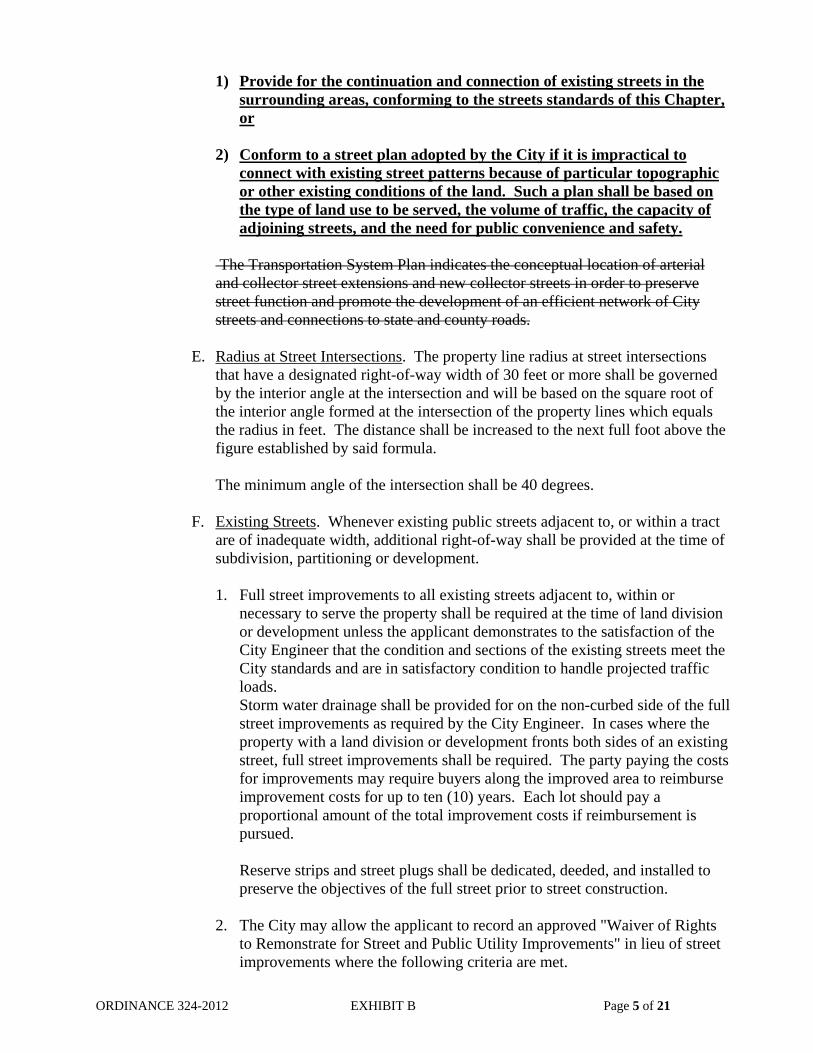
ORDINANCE 324-2012 EXHIBIT B Page 5 of 21
1) Provide for the continuation and connection of existing streets in the surrounding areas, conforming to the streets standards of this Chapter, or
2) Conform to a street plan adopted by the City if it is impractical to connect with existing street patterns because of particular topographic or other existing conditions of the land. Such a plan shall be based on the type of land use to be served, the volume of traffic, the capacity of adjoining streets, and the need for public convenience and safety.
The Transportation System Plan indicates the conceptual location of arterial and collector street extensions and new collector streets in order to preserve street function and promote the development of an efficient network of City streets and connections to state and county roads.
E. Radius at Street Intersections. The property line radius at street intersections
that have a designated right-of-way width of 30 feet or more shall be governed by the interior angle at the intersection and will be based on the square root of the interior angle formed at the intersection of the property lines which equals the radius in feet. The distance shall be increased to the next full foot above the figure established by said formula.
The minimum angle of the intersection shall be 40 degrees. F. Existing Streets. Whenever existing public streets adjacent to, or within a tract
are of inadequate width, additional right-of-way shall be provided at the time of subdivision, partitioning or development.
1. Full street improvements to all existing streets adjacent to, within or
necessary to serve the property shall be required at the time of land division or development unless the applicant demonstrates to the satisfaction of the City Engineer that the condition and sections of the existing streets meet the City standards and are in satisfactory condition to handle projected traffic loads. Storm water drainage shall be provided for on the non-curbed side of the full street improvements as required by the City Engineer. In cases where the property with a land division or development fronts both sides of an existing street, full street improvements shall be required. The party paying the costs for improvements may require buyers along the improved area to reimburse improvement costs for up to ten (10) years. Each lot should pay a proportional amount of the total improvement costs if reimbursement is pursued.
Reserve strips and street plugs shall be dedicated, deeded, and installed to
preserve the objectives of the full street prior to street construction.
2. The City may allow the applicant to record an approved "Waiver of Rights to Remonstrate for Street and Public Utility Improvements" in lieu of street improvements where the following criteria are met.
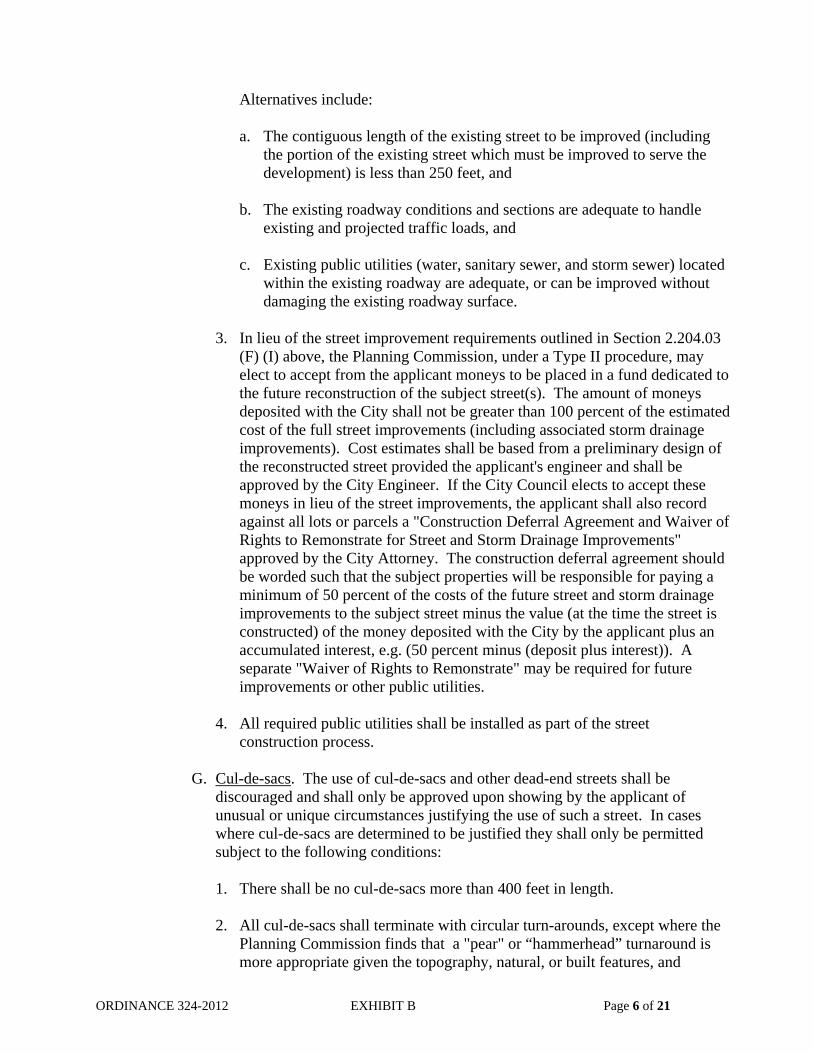
ORDINANCE 324-2012 EXHIBIT B Page 6 of 21
Alternatives include:
a. The contiguous length of the existing street to be improved (including the portion of the existing street which must be improved to serve the development) is less than 250 feet, and
b. The existing roadway conditions and sections are adequate to handle
existing and projected traffic loads, and c. Existing public utilities (water, sanitary sewer, and storm sewer) located
within the existing roadway are adequate, or can be improved without damaging the existing roadway surface.
3. In lieu of the street improvement requirements outlined in Section 2.204.03
(F) (I) above, the Planning Commission, under a Type II procedure, may elect to accept from the applicant moneys to be placed in a fund dedicated to the future reconstruction of the subject street(s). The amount of moneys deposited with the City shall not be greater than 100 percent of the estimated cost of the full street improvements (including associated storm drainage improvements). Cost estimates shall be based from a preliminary design of the reconstructed street provided the applicant's engineer and shall be approved by the City Engineer. If the City Council elects to accept these moneys in lieu of the street improvements, the applicant shall also record against all lots or parcels a "Construction Deferral Agreement and Waiver of Rights to Remonstrate for Street and Storm Drainage Improvements" approved by the City Attorney. The construction deferral agreement should be worded such that the subject properties will be responsible for paying a minimum of 50 percent of the costs of the future street and storm drainage improvements to the subject street minus the value (at the time the street is constructed) of the money deposited with the City by the applicant plus an accumulated interest, e.g. (50 percent minus (deposit plus interest)). A separate "Waiver of Rights to Remonstrate" may be required for future improvements or other public utilities.
4. All required public utilities shall be installed as part of the street
construction process.
G. Cul-de-sacs. The use of cul-de-sacs and other dead-end streets shall be discouraged and shall only be approved upon showing by the applicant of unusual or unique circumstances justifying the use of such a street. In cases where cul-de-sacs are determined to be justified they shall only be permitted subject to the following conditions:
1. There shall be no cul-de-sacs more than 400 feet in length. 2. All cul-de-sacs shall terminate with circular turn-arounds, except where the
Planning Commission finds that a "pear" or “hammerhead” turnaround is more appropriate given the topography, natural, or built features, and

ORDINANCE 324-2012 EXHIBIT B Page 7 of 21
expected use. Such variations shall be approved by the City Engineer and emergency services providers.
3. An accessway shall be provided consistent with the standards as determined
by the Planning Commission to be necessary to insure safe, efficient, and convenient multi-modal access.
For the purpose of this section, "unusual or unique circumstances" exist when slopes are 8 percent or more, wetlands or a body of water are present, existing development on adjacent property prevents a street connection. For the purpose of this section "accessway" means a walkway that provides pedestrian and/or bicycle passage either between streets or from a street to a building or other destination such as a school, park, or transit stop. Accessways generally include a walkway and additional land on either side of the walkway, often in the form of an easement or right-of-way, to provide clearance and separation between the walkway and the adjacent uses. Accessways through parking lots are generally physically separated from adjacent vehicle parking or parallel vehicle traffic by curbs or similar devices including landscaping, trees, and lighting. Where accessways cross driveways, they are generally raised, paved, or marked in a manner that provides convenient access for pedestrians.
H. Street Names. Street names and numbers shall conform to the established
pattern in the City and shall be subject to the approval of the Planning Commission, City staff, and emergency service agencies.
I. Grades and Curves. Grades shall not exceed 8 percent on public or private
streets. To provide for adequate drainage, all streets shall have a minimum slope of 0.5 percent. On arterials there shall be a tangent of not less than 100 feet between reversed curves.
J. Marginal Access Streets. If a development abuts or contains an existing or
proposed arterial street or railroad right-of-way, the Planning Commission may require marginal access streets, reverse frontage lots with suitable depth, screen planting contained in a non-access reservation along the rear or side property line, or such other treatment as may be necessary for adequate protection of residential properties and to afford separation of through and local traffic. Consideration shall be given for pedestrian routes.
K. Clear Vision Areas. Clear vision areas shall be maintained on corner lots at the
intersection of all public streets and at the intersections of a public street with a private street, alley or drive which serves more than three parcels. No structure or planting shall be permitted within a clear vision area which would impede visibility between a height of 36 inches and 9 feet above the curb grade of the intersecting streets.
Clear vision areas are as defined in Section 1.200 (definitions), 2.203.07(K) and
2.209.07.
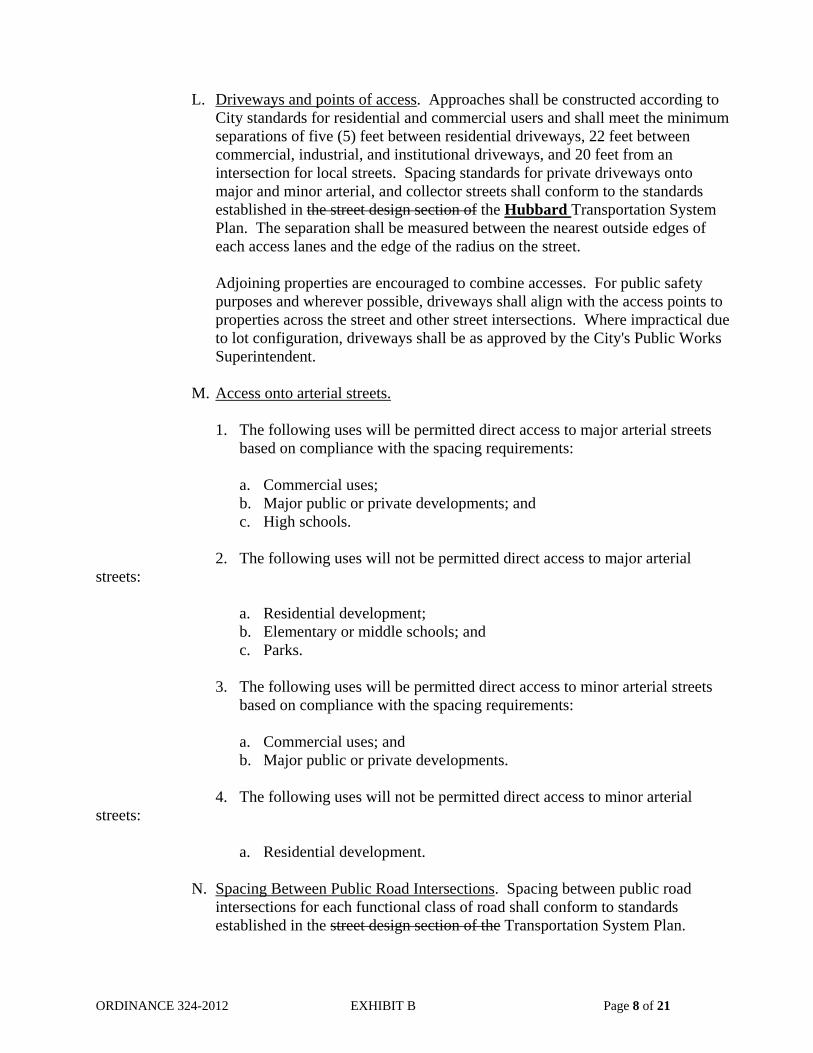
ORDINANCE 324-2012 EXHIBIT B Page 8 of 21
L. Driveways and points of access. Approaches shall be constructed according to
City standards for residential and commercial users and shall meet the minimum separations of five (5) feet between residential driveways, 22 feet between commercial, industrial, and institutional driveways, and 20 feet from an intersection for local streets. Spacing standards for private driveways onto major and minor arterial, and collector streets shall conform to the standards established in the street design section of the Hubbard Transportation System Plan. The separation shall be measured between the nearest outside edges of each access lanes and the edge of the radius on the street.
Adjoining properties are encouraged to combine accesses. For public safety
purposes and wherever possible, driveways shall align with the access points to properties across the street and other street intersections. Where impractical due to lot configuration, driveways shall be as approved by the City's Public Works Superintendent.
M. Access onto arterial streets.
1. The following uses will be permitted direct access to major arterial streets
based on compliance with the spacing requirements: a. Commercial uses; b. Major public or private developments; and c. High schools. 2. The following uses will not be permitted direct access to major arterial streets: a. Residential development; b. Elementary or middle schools; and c. Parks.
3. The following uses will be permitted direct access to minor arterial streets based on compliance with the spacing requirements:
a. Commercial uses; and b. Major public or private developments. 4. The following uses will not be permitted direct access to minor arterial streets: a. Residential development.
N. Spacing Between Public Road Intersections. Spacing between public road intersections for each functional class of road shall conform to standards established in the street design section of the Transportation System Plan.

ORDINANCE 324-2012 EXHIBIT B Page 9 of 21
O. Parkway Strip Landscaping. Landscaping and plant materials used in the parkway strip is subject to the provisions of 2.207. Maintenance of parkway strips in the right-of-way is the continuing obligation of the adjacent property owner.
2.202.04 General Right-of-Way and Improvement Widths
The following standards in the Street Design Standards Table are general criteria for all types of public streets, bikeways, parkway strips, and sidewalks in the City of Hubbard. These standards shall be the minimum requirements for all streets, bikeways, and pedestrian facilities except where modifications are permitted under Section 2.202.05.
The Street Design Standards Table lists several options for local streets. The street design section of the TSP establishes guidelines for selection of the appropriate local street option. The TSP identifies the conceptual location of some new collector streets that shall be built as specified by Phase 2 design standards.

ORDINANCE 324-2012 EXHIBIT B Page 10 of 21
STREET DESIGN STANDARDS TABLE
Functional Classification
ROW Width2
Paved Width
Travel Lanes
Turning Lane Parking
Parkway Strip
Sidewalk Width
Bikeway Type and Standards
Major Arterial
Phase I 80 52 2
12’ lanes1
16’ lane None 2 5’ strips
2 6’
sidewalks
2 6’ bike lanes
Phase II 101 64
3 12’
lanes7
1 16’ lane None 2
5’ strips
2 6’
sidewalks
2 6’ bike lanes
Phase III 101 76 4
12’ lanes1
16’ lane None 2 5’ strips
2 6’
sidewalks
2 6’ bike lanes
Minor Arterial
Downtown (3rd Street) 60 42 2
11’ lanes None 8’
West side
6’ East side
12’ West side
2 6’ bike lanes
Other 60 483 2
11’ lanes None 7’
Both sides
None 2 6’
sidewalks
2 6’ bike lanes
Collector
Collector4
60 343 2 10’ lanes None
7’ Both sides
2 4.5’ strips
2 5’
sidewalks
Shared Roadway
Local
Local Street or Cul-de-sac 50 303 1
16’ lane None 7’
Both sides
2 5’ strips
2 5’
sidewalks
Shared Roadway
Cul-de-sac-bulb 46 40 None 1
5’ strip
2 5’
sidewalks
Shared Roadway
1All dimensions in table are in feet. 2 ROW = right-of-way 3 Greater widths may be required at intersections with turn lanes. 4 Collectors should be considered for reclassification as minor arterials when traffic volumes exceed 3,000 ADT. 5 Parking allowed on both sides if driveways are staggered or if additional right-of-way permits. 6 Parkway strips allowed where right-of-way permits. 7 Two southbound and one northbound lane.

11
Street Type1
ROW Width
Paved Width
Travel Lanes
Turning
Lane
Parking
Parkway Strip
Sidewalk Width3
Bikeway Type and
Standards
Utility Easement
Width
Example
Application ARTERIAL Major 100 ft. 76 ft. 4 @12 ft. 1 @ 14 -16 ft. None 2 @ 5 ft.2 2 @ 6 ft. Bike lanes, 2 @ 6
ft. 2 @ 8 ft. Hwy. 99E
Minor 60 ft. 48 ft.4 2 @11ft. None Both sides of street @ 7 ft., with interspersed tree planters.
None, except tree planters used (see TSP Appendix D)
2 @ 6 ft. Bike lanes, 2 @ 6 ft. 2 @ 8 ft. 3rd Street
COLLECTOR5 Phase 1 60 ft. 34 ft.4 2 @10 ft. None Both sides of
street @ 7 ft. 2 @ 4.5 ft. 2 @ 5 ft. Shared roadway 2 @ 8 ft. 7th Street
Phase 2 60 ft. 34 ft 4 2 @11ft. None None 2 @ 4.5 ft. 2 @ 5 ft. Bike lanes, 2 @ 6 ft. 2 @ 8 ft. G St. between 2nd & Hwy. 99E
LOCAL 50 ft. 28 ft. 1 @ 16 ft. None6 Both sides of
street @ 7 ft. 2 @ 5 ft. 2 @ 5 ft. Shared roadway 2 @ 8 ft.
Cul-de-sac 50 ft. 30 ft. 1 @ 14 ft. None Both sides of street @ 7 ft.
2 @ 5 ft. 2 @ 5 ft. Shared roadway 2 @ 8 ft.
Cul-de-sac bulb
46 ft. radius
40 ft. None 5 ft. 2 @ 5 ft. Shared roadway
1. See Appendix D for drawings of street designs 2. The city will be responsible for landscape maintenance in the parkway strip 3. Includes 0.5 ft. curb 4. Greater widths may be required at intersections to accommodate turn lanes 5. Phase I changes to Phase II when traffic volume exceeds 3,000 ADT, or safety issues become a concern.

12
2.202.05 Modification of Right-of-Way and Improvement Width
The Planning Commission, pursuant to the review procedures of Section 3.203, may allow modification to the public street standards of Section 2.202.04, when both of the following criteria (A. and B.) are satisfied:
A. The modification is necessary to provide design flexibility in instances where:
1. unusual topographic conditions require a reduced width or grade separation of improved surfaces;
2. parcel shape or configuration precludes accessing a proposed development
with a street which meets the full standards of Section 2.202.04; 3. a modification is necessary to preserve trees or other natural features
determined by the Planning Commission to be significant to the aesthetic character of the area; or
4. a Planned Unit Development is proposed and the modification of street
standards is necessary to provide greater privacy or aesthetic quality to the development.
B. Modification of the standards of Section 2.202.04 shall only be approved if
the Planning Commission finds that the specific design proposed provides adequate vehicular access based on anticipated traffic volumes.
2.202.06 Construction Specifications
Construction specifications for all public streets shall comply with the criteria of the most recently adopted Public Works Design and Construction Standards /street standards and Transportation System Plan of the City of Hubbard.
2.202.07 Private Streets
A. Private streets shall only be allowed where the applicable criteria of Section 2.208.03 (C) are satisfied. Private streets shall comply with the following minimum standards, unless a greater width is required by the Uniform Fire Code1:
No. of Potential Dwellings Served Easement or Tract Width Surface Width 1-3 25 feet 18 feet 4 25 feet 24 feet More than 4 30 feet 28 feet 1 Contact the local Fire District Office regarding Uniform Fire Code requirements.

13
*Note: If narrower streets are developed as part of Section 2.202.04 of the Code, more on-site parking is required.
B. The Planning Commission may require an increased surface width if deemed necessary to provide adequate access to commercial or industrial uses. Prior to any requested private street or drive adoption, the City requires the private drive or street to meet minor street standards as put forth in Section 2.202.04 of the Code.
C. All private streets serving more than one ownership shall be constructed to the
same cross-sectional specifications required for public streets. Provision for the maintenance of the street shall be provided in the form of a maintenance agreement, home owners association or other instrument acceptable to the City Attorney.
D. A turn-around shall be required for any private residential street in excess of
150 feet long, which has only one outlet and which serves more than three residences. Non-residential private streets serving more than one ownership shall provide a turn-around if in excess of 200 feet long and having only one outlet. Turn-arounds for private streets shall be either a circular turn-around with a minimum paved radius of 35 feet, or a "tee" turn-around with a minimum paved dimension across the "tee" of 70 feet.
E. The Planning Commission may require provisions for the dedication and
future extension of a public street. F. The City does not accept transfer of private streets to public streets unless the
private street meets the City's construction standards at the time of acceptance and the construction inspected by the City Public Works Department and City Engineer during construction. Streets constructed to City standards, or those that provide evidence of compliance with City standards, (such as, but not limited to, providing core samples), inspected, and approved by the City and public emergency services agencies, may be eligible for transfer to public ownership if approved by the Planning Commission during a public hearing.

14
2.207 SITE AND LANDSCAPING DESIGN 2.207.01 Purpose
A. The purpose is to guide the planting and maintenance of landscaping materials;
B. to enhance the appearance of the City, providing areas for outdoor recreation
and to:
1. provide shade and windbreaks where appropriate to conserve energy in building and site design;
2. buffer and screen conflicting land uses; 3. provide for the landscaping of parking areas to facilitate vehicular
movement and break up large areas of impervious surface; and 4. promote public safety through appropriate design principles; and 5. encourage provision of screening and buffering to mitigate for visual and
sound impacts related to the railroad.
C. to prevent or reduce erosion potential within developments by providing appropriate landscape materials.
2.207.02 Scope
All construction, expansion or redevelopment of structures or parking lots for commercial, multi-family, or industrial uses shall be subject to the landscaping requirements of this Section. Landscaping plans shall be submitted as required by the Site Development Review procedures of Section 3.105 and reviewed by the Planning Commission, subject to Type II review procedures set forth in Section 3.200. The construction of new streets containing parkway strips shall also be subject to the landscaping requirements of this chapter.
2.207.07 Recommended Street Trees
A. Street trees shall be planted for all developments that are subject to Subdivision or Site Development Review, unless otherwise waived by the Public Works Superintendent for utility purposes. Plantings of street trees shall generally follow construction of curbs and sidewalks, however, the City may defer tree planting until final inspection of completed dwellings to avoid damage to trees during construction. The planting and

15
maintenance of street trees shall conform to the following standards and guidelines and any applicable road authority requirements:
1. Caliper Size. The minimum diameter or caliper size at planting, as
measured 4 feet above grade shall be two (2) inches.
2. Spacing and Location. Street trees shall be planted within the street right-of-way within existing and proposed parkway strips, except when utility easements occupy these areas. Street tree spacing shall be based upon the type of tree(s) selected and the canopy size at maturity and, at a minimum, the planting area shall contain 16 square feet, or typically, 4 feet by 4 feet. In general, trees shall be spaced no more than 30 feet apart, except where planting a tree would conflict with existing trees, retaining walls, utilities and similar physical barriers. All street trees shall be placed outside utility easements.
3. Soil Preparation, Planting and Care. The developer shall be
responsible for planting street trees, including soil preparation, ground cover material, staking, and temporary irrigation for two years after planting.
4. Assurances. The City shall require the developer to provide a
performance and maintenance bond in an amount determined by the City Engineer, to ensure the planting of the tree(s) and care during the first two years after planting.
B. Recommended Street Trees. The following tree species are recommended for use as street and parking lot
trees. Other tree species may be approved by the City based on climate zone, growth characteristics and site conditions, including available space, overhead clearance, soil conditions, and exposure.:
Any trees planted within the right-of-way of the Oregon Department of
Transportation (ODOT) requires prior approval from ODOT. 1. Trees maturing to small mature stature (generally 30 feet or less in height):
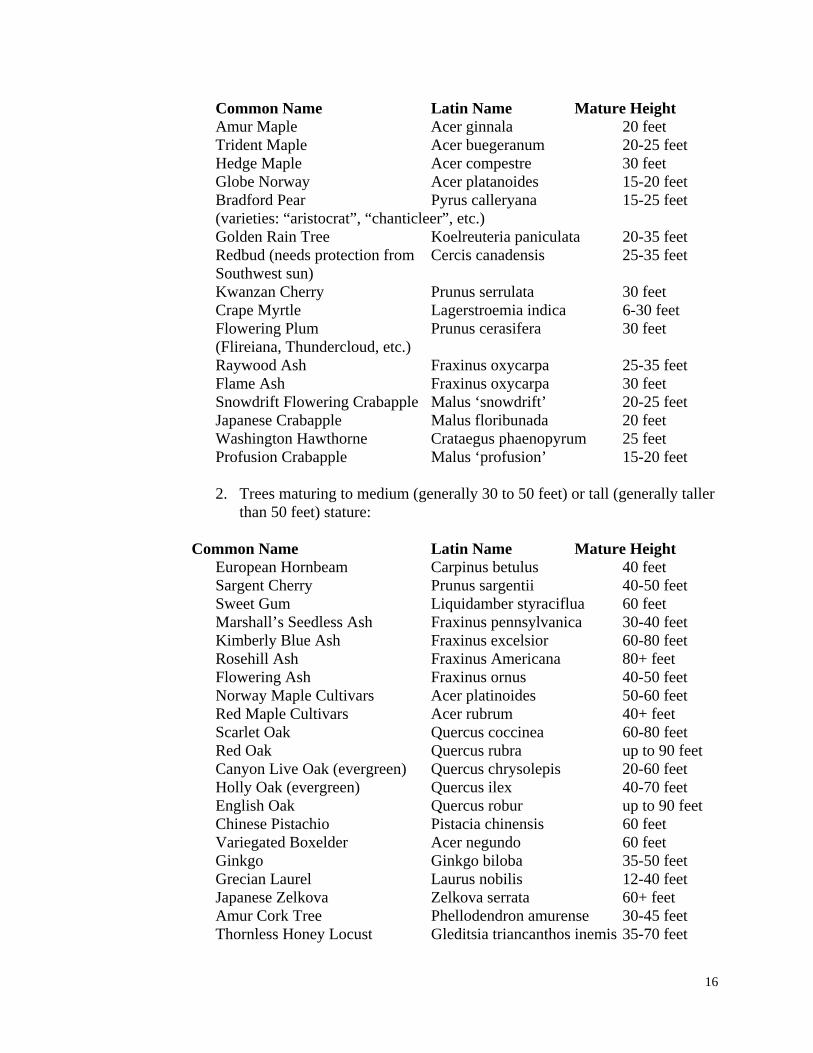
16
Common Name Latin Name Mature Height Amur Maple Acer ginnala 20 feet Trident Maple Acer buegeranum 20-25 feet Hedge Maple Acer compestre 30 feet Globe Norway Acer platanoides 15-20 feet Bradford Pear Pyrus calleryana 15-25 feet (varieties: “aristocrat”, “chanticleer”, etc.) Golden Rain Tree Koelreuteria paniculata 20-35 feet Redbud (needs protection from Cercis canadensis 25-35 feet Southwest sun) Kwanzan Cherry Prunus serrulata 30 feet Crape Myrtle Lagerstroemia indica 6-30 feet Flowering Plum Prunus cerasifera 30 feet (Flireiana, Thundercloud, etc.) Raywood Ash Fraxinus oxycarpa 25-35 feet Flame Ash Fraxinus oxycarpa 30 feet Snowdrift Flowering Crabapple Malus ‘snowdrift’ 20-25 feet Japanese Crabapple Malus floribunada 20 feet Washington Hawthorne Crataegus phaenopyrum 25 feet Profusion Crabapple Malus ‘profusion’ 15-20 feet
2. Trees maturing to medium (generally 30 to 50 feet) or tall (generally taller than 50 feet) stature:
Common Name Latin Name Mature Height European Hornbeam Carpinus betulus 40 feet Sargent Cherry Prunus sargentii 40-50 feet Sweet Gum Liquidamber styraciflua 60 feet Marshall’s Seedless Ash Fraxinus pennsylvanica 30-40 feet Kimberly Blue Ash Fraxinus excelsior 60-80 feet Rosehill Ash Fraxinus Americana 80+ feet Flowering Ash Fraxinus ornus 40-50 feet Norway Maple Cultivars Acer platinoides 50-60 feet Red Maple Cultivars Acer rubrum 40+ feet Scarlet Oak Quercus coccinea 60-80 feet Red Oak Quercus rubra up to 90 feet Canyon Live Oak (evergreen) Quercus chrysolepis 20-60 feet Holly Oak (evergreen) Quercus ilex 40-70 feet English Oak Quercus robur up to 90 feet Chinese Pistachio Pistacia chinensis 60 feet Variegated Boxelder Acer negundo 60 feet Ginkgo Ginkgo biloba 35-50 feet Grecian Laurel Laurus nobilis 12-40 feet Japanese Zelkova Zelkova serrata 60+ feet Amur Cork Tree Phellodendron amurense 30-45 feet Thornless Honey Locust Gleditsia triancanthos inemis 35-70 feet

17
2.207.08 C. Prohibited Street Trees
The following trees are not allowed within public rights-of-way except under special circumstances and with the approval of the Staff Advisor. As street trees they cause one of more of the following problems: 1) Their roots damage sewer lines or pavement; 2) They are particularly subject to disease or insects; 3) They cause visibility problems along streets or intersections; 4) They create messy sidewalks and pavements, usually due to fruit drop.
Common Name Latin Name Evergreen Conifers numerous species Poplar & related species Populus tricocarpa Black Locust Robinia psuedoacacia Box Elder (except variegated) Acer negundo Sycamore Platanus species Siberian Elm Ulmus pumila American Elm Ulmus americana Walnut Juglans species Weeping Willow Saxix babylonica Commercial Fruit Trees numerous species Catalpa Catalpa speciosa Tree of Heaven Ailanthus altissima Big Leaf Maple Acer macrophyllum Fruiting Mulberry Morus alba Osage Orange Maclura pomifera Weeping varieties of various trees: i.e. cherry, mulberry, crabapple 2.207.06 Planting and Maintenance
A. No sight-obscuring plantings exceeding thirty (30) inches in height shall be located within any required clear-vision area as defined in Section 1.200 of this Ordinance.
B. Plant materials shall not cause a hazard. Landscape plant materials over
walks, pedestrian paths and seating areas shall be pruned to a minimum height of eight (8) feet and to a minimum height of fifteen (15) feet over streets and vehicular traffic areas.
C. Landscape plant materials shall be selected which do not generally interfere
with utilities above or below ground. D. Landscape plant material shall be installed to current nursery industry
standards.

18
E. Landscape plant materials shall be properly guyed and staked to current industry standards as necessary. Stakes and guy wires shall not interfere with vehicular or pedestrian traffic.
F. Except for when a developer is required to provide a performance and
maintenance bond to ensure the planting of street trees during the first two years after planting, all landscape material shall be guaranteed by the developer for a period of one year from the date of installation. A copy of the guarantee shall be furnished to the City by the developer.
G. Plant materials shall be suited to the conditions under which they will be
growing. As an example, plants to be grown in exposed, windy areas which will not be irrigated should be sufficiently hardy to thrive under these conditions. Plants should have vigorous root systems, and be sound, healthy, free from defects, diseases and infections. Landscaping plans shall be submitted to the City by a licensed landscaping professional.
H. Except for street trees, which require a minimum caliper size at planting
of two (2) inches, deciduous trees should be fully branched, have a minimum caliper of one and one-quarter (1 1/4) inches, and a minimum height of eight (8) feet at the time of planting.
I. Evergreen trees shall be a minimum of six (6) feet in height, fully branched. J. Shrubs should be supplied in one (1) gallon containers or eight (8) inch burlap
balls with a minimum spread of twelve (12) to fifteen (15) inches. K. Ground cover plants shall be spaced in accordance with current nursery
industry standards to achieve covering of the planting area. Rows of plants are to be staggered for a more effective covering. Ground cover shall be supplied in a minimum four (4) inch size container or a two and one-quarter (2 1/4) inch container or equivalent if planted eighteen (18) inches on center.
L. Irrigation requirements.
1. All developments are required to provide appropriate methods of irrigation
for the landscaping. Large landscape areas, exceeding 400 square feet, shall be irrigated with automatic sprinkler systems to insure the continued health and attractiveness of the plant materials.
2. Sprinkler heads shall not cause any hazard to the public. Hose bibs and
manually operated methods of irrigation may be appropriate for cumulative landscaping areas totaling under 400 square feet.
3. Xeriscaping may be used as a landscaping option. All Xeriscaping plans
shall be submitted to the City by a licensed landscape professional.

19
4. Irrigation shall not be required in existing wooded areas, wetlands,
floodplains or along natural drainage channels or stream banks.
M. Appropriate methods of care and maintenance of landscaped plant material shall be provided by the owner of the property.
N. Landscape plant material shall be protected from damage due to heavy foot
traffic or vehicular traffic by protective tree grates, pavers or other suitable methods.
2.208 DEVELOPMENT STANDARDS FOR LAND DIVISIONS 2.208.04 Standards for Blocks
A. General. The length, width and shape of blocks shall be designed with regard to providing adequate building sites for the use contemplated; consideration of needs for convenient access, circulation, control and safety of street traffic including pedestrians and bicyclists; and recognition of limitations and opportunities of topography.
B. Sizes. Blocks in residential and commercial districts shall not exceed 1,600
600 feet in perimeter length between street lines, except blocks adjacent to major arterial streets, or unless the previous adjacent development pattern or topographical conditions justify a variation. The recommended minimum distance between intersections on major arterial streets is 1,320 feet or more. Blocks that exceed 600 feet in length shall be requiraased to provide additional pedestrian and bikeway accesses.
CHAPTER 3
APPLICATION REQUIREMENTS AND REVIEW PROCEDURES
3.105 SITE DEVELOPMENT REVIEW 3.105.05 Submittal Requirements
A. The following information shall be submitted as part of a complete application for Site Development Review:
1. Site Analysis
a. existing site topography;

20
b. identification of areas exceeding 10% slopes; c. site drainage, areas of potential flooding; d. areas with significant natural vegetation; e. classification of soil types; f. existing structures, roadway access and utilities; and g. existing and proposed streets, bikeways, and pedestrian facilities within
200 feet; and
h. a traffic impact analysis if requested by the City Engineer. 3.107 SUBDIVISIONS AND PLANNED UNIT DEVELOPMENTS 3.107.02 Submittal Requirements
A. The following submittal requirements shall apply to all Preliminary Plan applications for subdivisions and PUDs.
1. All applications shall be submitted on forms provided by the City to the
City Recorder along with the appropriate fee. It shall be the applicant's responsibility to submit a complete application which addresses the review criteria of this Section.
2. In addition to the information listed in Subsection 3.106.03 of this
Ordinance, applicants for subdivisions and planned unit developments shall submit the following:
a. the name, address and phone number of the applicant engineer, land
surveyor or person preparing the application; b. name of the PUD or subdivision; c. date the drawing was made; d. vicinity sketch showing location of the proposed land division; e. identification of each lot or parcel and block by number; f. gross acreage of property being subdivided;

21
g. direction of drainage and approximate grade of abutting streets; h. streets proposed and their names, approximate grade, and radius of curves;
i. any other legal access to the subdivision or PUD other than a public street;
j. contour lines at two foot intervals if 10% slope or less, five foot
intervals if exceeding 10% slope, and a statement of the source of contour information; and
k. all areas to be offered for public dedication; and l. a traffic impact analysis if requested by the City Engineer.