hplc fingerprint and simultaneous quantitative analysis of ... · as indonesian jamu, indian...
TRANSCRIPT

O
Hpo
Ra
b
c
Id
a
ARAA
KAFHpP
I
cnPsM2ltehwRa((
0c
Revista Brasileira de Farmacognosia 28 (2018) 527–532
ww w.elsev ier .com/ locate /b jp
riginal Article
PLC fingerprint and simultaneous quantitative analysis ofhyllanthin and hypophyllanthin for identification and authenticationf Phyllanthus niruri from related species
oni Nasrulloha,b, Mohamad Rafia,c,∗, Wulan Tri Wahyunia,c, Shuichi Shimmad, Rudi Heryantoa,c
Department of Chemistry, Faculty of Mathematics and Natural Sciences, Bogor Agricultural University, Jalan Tanjung Kampus IPB Dramaga, Bogor, IndonesiaCenter for Plant Product Quality Testing, Ministry of Agriculture, Jakarta Selatan, IndonesiaTropical Biopharmaca Research Center-Institute of Research and Community Services, Bogor Agricultural University, Jalan Taman Kencana No. 3 Kampus IPB Taman Kencana, Bogor,
ndonesiaDepartment of Biotechnology, Graduate School of Engineering, Osaka University, Suita, Osaka, Japan
r t i c l e i n f o
rticle history:eceived 28 November 2017ccepted 20 April 2018vailable online 20 August 2018
eywords:uthenticationingerprint analysis
a b s t r a c t
A precise and accurate method for the identification and authentication of Phyllanthus niruri L. from P.debilis Klein ex Willd. and P. urinaria L., Phyllanthaceae, was developed using high-performance liquidchromatography. Chromatographic fingerprint analysis was combined with simultaneous quantifica-tion of phyllanthin and hypophyllanthin for the developed method. Phyllanthin and hypophyllanthinwere successfully separated and quantified under this proposed method. The highest amount of phyl-lanthin and hypophyllanthin was found in P. niruri compared to P. debilis and P. urinaria. Fingerprintchromatogram of the three Phyllanthus species showed distinct profiles that these may be used to iden-
ypophyllanthinhyllanthinhyllanthus
tify and authenticate each Phyllanthus species, which improved by marker compounds present in eachspecies. The combination of chromatographic fingerprint analysis and discriminant analysis was suc-cessfully discriminated all three species, including P. niruri adulterated with P. debilis or P. urinaria. Themethod can be used for the identification and authentication of P. niruri from related species, such as P.
rasilhe CC
debilis and P. urinaria.© 2018 Sociedade B
access article under t
ntroduction
The genus of Phyllanthus belongs to the family of Phyllanthaceaeomprising of more than 600 species and one of them is Phyllanthusiruri L., which mostly found in the tropical and subtropical regions.. niruri has a long history in some traditional medicinal system,uch as Indonesian Jamu, Indian Ayurveda and Traditional Chineseedicine, to prevent or treat various diseases (Bagalkotkar et al.,
006). In Indonesia, P. niruri is known as meniran and usually grownike a weed on agricultural and wastelands. Considering its efficacyo treat many diseases and maintaining health, P. niruri is consid-red as one of the most important medicinal plants in Jamu. P. nirurias been used to treat health problems such as diarrhea, jaundice,ounds, diabetes, diuretic, stomachache and hepatitis (Joseph andaj, 2011; Patel et al., 2011). P. niruri denotes many pharmacological
ctivities such as antioxidant (Lim and Murtijaya, 2007), antiviralTan et al., 2013), antidiabetic (Adeneye, 2012), anti-inflammatoryKassuya et al., 2005) and hepatoprotective (Pramyothin et al.,∗ Corresponding author.E-mail: [email protected] (M. Rafi).
https://doi.org/10.1016/j.bjp.2018.04.014102-695X/© 2018 Sociedade Brasileira de Farmacognosia. Published by Elsevier Editreativecommons.org/licenses/by-nc-nd/4.0/).
eira de Farmacognosia. Published by Elsevier Editora Ltda. This is an open BY-NC-ND license (http://creativecommons.org/licenses/by-nc-nd/4.0/).
2007). It is also used to improve the immune system (immunos-timulant) (Taiwo et al., 2009). P. niruri has numerous secondarymetabolites such as lignans, alkaloids, flavonoids, hydrolyzable tan-nins (ellagitannins), triterpenoids and polyphenolic compounds(Patel et al., 2011). The primary bioactive compounds presentin P. niruri are lignans, such as phyllanthin (1), hypophyllanthin(2), phyltetralin, nirtetralin and niranthin (Murugaiyah and Chan,2007; Shanker et al., 2011). Compounds 1 and 2 are two lignanscommonly used as marker compounds in the quality control of P.niruri as described in Indian Pharmacopoeia (2010).
Since the efficacy of a medicinal plant depends on more thanone single chemical compound that work synergistically, there
ora Ltda. This is an open access article under the CC BY-NC-ND license (http://

5 a de Farmacognosia 28 (2018) 527–532
amcmtmoaatoctdbxxas
putsfohl(cP(a
dcwnawa(omn
M
P
LndstdT7
C
CA
Box 1: Origin and code of the Phyllanthus species sam-ples.
No. Origin (sub-district, regency) Sample code
P. niruri P. debilis P. urinaria
1 Dramaga-1, Bogor PN-1 PD-1 PU-12 Dramaga-2, Bogor PN-2 PD-2 PU-23 Central Bogor, Bogor PN-3 PD-3 PU-34 Southern Bogor, Bogor PN-4 PD-4 PU-45 Rajapolah, Tasikmalaya PN-5 PD-5 PU-56 Purwadadi, Subang PN-6 PD-6 PU-67 Pondok Gede, Bekasi — PD-7 —
28 R. Nasrulloh et al. / Revista Brasileir
re two approaches in the quality control of herbal medicine, i.e.,ulticomponent-based and pattern-based approaches from the
hromatograms, spectrum or other graphs from chemical instru-entation. The pattern-based approach, which is also known as
he fingerprint analysis, can reveal all detectable compounds in aedicinal plant, and therefore, it could be applied in the detection
f adulteration of raw materials of herbal medicinal products (Moknd Chau, 2005; Ma et al., 2011). On the other hand, quantitativenalysis of multicomponents can reveal the concentration of bioac-ive compounds in a medicinal plant. Therefore, the combinationf chromatographic fingerprint and quantitative analysis of multi-omponents often used for the complementary properties betweenhese approaches makes it more comprehensive for identification,iscrimination and authentication of medicinal herbs. This com-ination has been used, for example, in the quality evaluation ofiaoyanlidan tablets (Tang et al., 2014), authentication of Curcumaanthorrhiza from C. longa (Rafi et al., 2015) and chemical char-cterization of two morphologically related Espeletia, Asteraceae,pecies (Padilla-Gonzalez et al., 2016).
There are two closely related species that have similar mor-hology and grow sympatrically with P. niruri, i.e., P. debilis and P.rinaria. These may lead to misidentification and quite vulnerableo adulteration of P. niruri from P. debilis and P. urinaria. Therefore, aimple and reliable chemical analysis method should be developedor the identification and authentication of P. niruri using the sec-ndary metabolite profiles. Several analytical methods using HPLCave been developed for quantitative determination of the two
ignans of these species, phyllanthin (1) and hypophyllanthin (2)Murugaiyah and Chan, 2007; Shanker et al., 2011), as well as forhromatographic fingerprint analysis (Martins et al., 2011) in somehyllanthus species. HPLC with ultraviolet (UV) or photodiode arrayPDA) detection is widely applied for those two analytical methodsttributed to its convenience and efficiency.
Previously reported analytical methods for P. niruri were onlyeveloped for quantitative analysis for its marker compound orhromatographic fingerprint analysis alone. There is no reportedork combining the chromatographic fingerprint and simulta-eous quantitative analysis of 1 and 2 for the identification anduthentication of P. niruri from P. debilis and P. urinaria. In this study,e developed a simple and reliable method for the identification
nd authentication of P. niruri by combining the two approachessimultaneous quantification and HPLC fingerprint analysis) withne multivariate analysis, i.e., discriminant analysis. The developedethod can be used for the identification and authentication of P.
iruri from related species, such as P. debilis and P. urinaria.
aterials and methods
lant material
Twenty samples consisting of six samples of Phyllanthus niruri., eight samples of P. debilis Klein ex Willd. and six samples of P. uri-aria L., Phyllanthaceae, were collected in the year 2017 from eightifferent locations in West Java province, Indonesia (Box 1). Allamples were identified in Herbarium Bogoriense, Research Cen-er for Biology, Indonesian Institute of Science. All samples wereried at 40 ◦C, pulverized, and sieved (60-mesh) before analysis.hree simulated samples of P. niruri adulterated with 25, 50 and5% of P. debilis and P. urinaria were also used.
hemicals and reagents
Phyllanthin (1) and hypophyllanthin (2) were purchased fromhromaDex Inc. (Santa Ana, CA, USA) with about 98.9% purity.ll solvents used for the analysis were obtained from Merck
8 Ciomas, Bogor — PD-8 —
(Darmstadt, Germany), i.e., methanol (HPLC grade), ultrapurewater from purification system of Direct-Q
®5 UV-R, and formic
acid (purity 98–100%). All standards and samples were filteredthrough 0.2 �m nylon membrane filter obtained from Whatman(Kent, UK). The HPLC mobile phase was prepared fresh daily, fil-tered through 0.2 �m polyvinylidene difluoride (PVDF) membranefilter obtained from Waters Corp. (Milford, Massachusetts, USA)and degassed before analysis.
Apparatus and chromatographic conditions
The HPLC system used was LC-20A series (Shimadzu, Kyoto,Japan) equipped with a UV detector. The chromatographic separa-tion was performed on a Luna C18 (2) column (150 mm × 4.6 mm,5 �m) (Phenomenex, Torrance, CA, USA). The mobile phaseconsisted of methanol (solvent A) and aqueous solution of formicacid 0.5% (v/v, pH 2.3) (solvent B) at a flow rate of 1 ml/min. The gra-dient elution program was set as follow: 0–3 min, 23% A; 3–9 min,23–35% A; 9–16 min, 35–42% A; 16–17 min, 42–70% A; 17–29 min,70% A; 29–30 min, 70–100% A; 30–40 min, 100% A. This was fol-lowed by a 15 min equilibrium period prior to the next injection.The chromatogram was monitored at a wavelength of 210 nm dur-ing experiment. The column temperature was maintained at 34 ◦Cand the injection volume was 20 �l.
Preparation of samples and standard solutions
Powdered samples of 200 mg each were accurately weighed andsonicated with 10 ml methanol for 60 min at room temperature.The samples were then filtered through a 0.2 �m nylon membranefilter, and methanol was added to a final volume of 10 ml beforeinjected into the HPLC system. A mixed of standard stock solutionof PTN and HPN was prepared in methanol at a concentration of1000 �g/ml. An appropriate amount of standard stock solutionswas diluted with methanol to obtain six concentrations in the rangeof 1.05–83.87 �g/ml for 1 and 2.10–83.87 �g/ml for 2. The cali-bration curve was obtained by plotting the peak area (y) againstconcentration (x) of each compound and were fitted to a linearregression equation of y = ax + b.
Method validation
Quantitative analysis of phyllanthin (1) and hypophyllanthin(2) was validated following the International Conference on Har-monization (ICH) guidelines (ICH, 2005) in terms of linearity ofthe calibration curves, accuracy, precision, stability, limit of detec-tion (LOD) and limit of quantification (LOQ). The linearity of the
calibration curve of each analyte was evaluated by plotting thepeak areas (y) versus the concentrations (x, �g/ml). Recovery testwas used to determine the accuracy of the analytical method. Theaccuracy (recovery test) was performed using standard addition
R. Nasrulloh et al. / Revista Brasileira de Farmacognosia 28 (2018) 527–532 529
uV (x1.000.000)
1.75
1.50
1.25
1.00
0.75
0.50
0.25
0.00
5.0 10.0 15.0 20.0 25.0 30.0 35.0 40.0 min
21 5 6
7 89
10
6
78
9 10
ab
c
d
Figure 1. HPLC chromatograms of PN-1 sample using various solvent compositions: (a) methanol–water, (b) methanol–0.5% acetic acid, (c) methanol–0.5% phosphoric acidand (d) methanol–0.5% formic acid.
uV (x1,000,000)
uV (x1,000,000)
uV (x1,000,000)
1.0
0.9
0.8
0.7
0.6
0.5
0.4
0.3
0.2
0.1
0.0
-0.0
1.0
0.9
0.8
0.7
0.6
0.5
0.4
0.3
0.2
0.1
0.0
-0.0
1.0
0.9
0.8
0.7
0.6
0.5
0.4
0.3
0.2
0.1
0.0
-0.0
0.0 2.5 5.0 7.5 10.0 12.5 15.0 17.5 20.0 22.5 25.0 27.5 30.0 32.5 35.0 37.5 min
2.5 5.0 7.5 10.0 12.5 15.0 17.5 20.0 22.5 25.0 27.5 30.0 32.5 35.0 37.5 min
2.50.0 5.0 7.5 10.0 12.5 15.0 17.5 20.0 22.5 25.0 27.5 30.0 32.5 35.0 37.5 min
a
b
c
1
234
5
6
1
2
12
56
4
7 8 910 11
3
56
7 8 910 11
4
3
7
8
Figure 2. HPLC chromatograms of (a) mixed standard solutions of phyllanthin(1) and hypophyllanthin (2), (b) individual Phyllanthus sample and (c) adulterateds57
mtpwsa1
Table 1Resolution of all common peaks present in Phyllanthus niruri, P. debilis and P. urinariasamples.
Peak number Resolution
P. niruri P. debilis P. urinaria
1 — — —2 15.141 14.914 14.2133 — 13.473 —4 — — 16.0245 17.919 9.514 3.7536 6.035 5.216 5.8367 2.177 2.207 1.9468 1.721 1.807 1.7489 3.636 3.786 3.786
amples. Composition: (b1) PN-5, 100%; (b2) PU-5, 100%; (b3) PD-5, 100%; (c1) PN-:PU-5, 75:25%; (c2) PN-5:PU-5, 50:50%; (c3) PN-5:PU-5, 25:75%; (c4) PN-5:PD-5,5:25%; (c5) PN-5:PD-5, 50:50%; (c6) PN-5:PD-5, 25:75%.
ethod. The known amount of the mixed standard solutions withhe high, intermediate and low level were spiked into the sam-le (PN-1) in triplicates of each level. The precision of the method
as evaluated by intra- and inter-day repeatability of six individualamples (PN-1) each day within three consecutive days. Stability ofnalytes was assessed by analyzing the same sample solution (PN-) at 0, 4, 8, 12, 24 and 48 h after preparation. Validation of the
10 1.954 1.997 2.00911 18.659 19.495 19.699
HPLC fingerprint analysis was performed by evaluating intra-and inter-day precision and stability which expressed as relativestandard deviation (RSD) of the relative retention time (RRT) andrelative peak area (RPA) of the characteristic peaks to the referencepeak (peak number 9).
Statistical analysis
Discriminant analysis was performed in XLSTAT ver 2012software (Addinsoft, New York, USA) for the identification andauthentication of P. niruri from P. debilis and P. urinaria.
Results and discussion
Optimization of HPLC condition
To obtain the most chemical information and good separa-tion for chromatographic fingerprint and quantitative analyses, weoptimized the mobile phase composition, gradient elution proce-dure and detection wavelength. We used mixed standard solutionand PN-1 sample in this step to obtain the optimum condition.The mobile phase containing methanol–water gave better sepa-ration for phyllanthin (1) and hypophyllanthin (2) compared withacetonitrile–water. In order to give a better resolution, formic acid,phosphoric acid and acetic acid were added to the aqueous phaseof a binary mixture of methanol–water. As a result, mobile phaseconsisting of methanol–0.5% formic acid in water (v/v, pH 2.3) was
found to be optimum for chromatographic fingerprint and quanti-tative analyses of 1 and 2 (Fig. 1).The resolution of phyllanthin (1) (peak 7) and hypophyllanthin(2) (peak 8) in the mixed standard solution was >1.5 (acceptance
530 R. Nasrulloh et al. / Revista Brasileira de Farmacognosia 28 (2018) 527–532
12
10
8
6
4
2
0
6
4
2
3
5
7
0
1
0 20 40
Concentraion, µg/ml
Concentraion, µg/ml
y = 123,450.5608x - 1,277.5080R2 = 0.9988
y = 71,488.0543x - 4,591.6544R2 = 0.9974
60 80 100
0 20 40 60 80 100
Mill
ions
Mill
ions
Pea
k ar
eaP
eak
area
a
b
Fl
c(aoaDghs
V
yrr2grTaTcL
9
uV (x10,000)
uV (x10,000)
1.2
1.11.0
0.9
0.8
0.7
0.8
0.50.4
0.30.2
0.1
0.0
-01
-02
0.0
2.00
1.75
1.50
1.25
1.00
0.75
0.50
0.25
0.00
-0.25
2.5 5.0 7.5 10.0 12.5 15.0 17.5 20.0 22.5 25.0 27.5 30.0 32.5min
0.0 2.5 5.0 7.5 10.0 12.5 15.0 17.5 20.0 22.5 25.0 27.5 30.0 32.5min
7
8
7
8
a
b
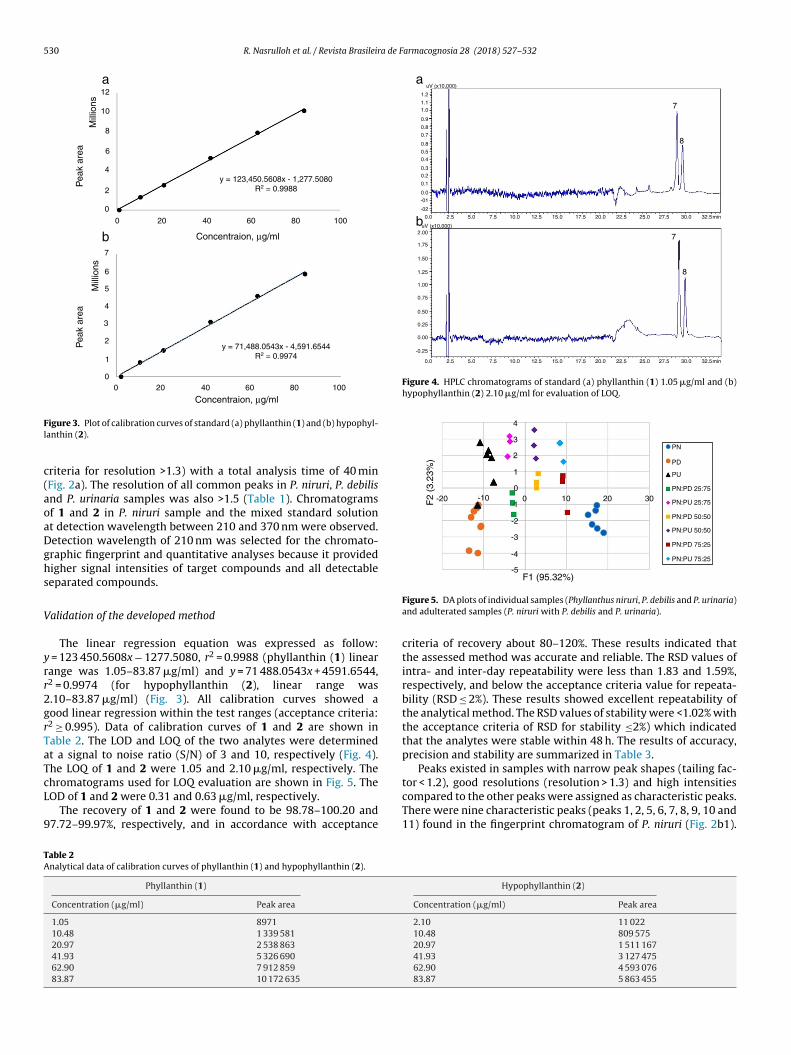
Figure 4. HPLC chromatograms of standard (a) phyllanthin (1) 1.05 �g/ml and (b)hypophyllanthin (2) 2.10 �g/ml for evaluation of LOQ.
F2
(3.2
3%)
F1 (95.32%)
4
3
2
1
1
-2
-3
-4
-5
00 10 20 30-10-20
PN
PD
PU
PN:PD 25:75
PN:PU 25:75
PN:PD 50:50
PN:PU 50:50
PN:PD 75:25
PN:PU 75:25
TA
igure 3. Plot of calibration curves of standard (a) phyllanthin (1) and (b) hypophyl-anthin (2).
riteria for resolution >1.3) with a total analysis time of 40 minFig. 2a). The resolution of all common peaks in P. niruri, P. debilisnd P. urinaria samples was also >1.5 (Table 1). Chromatogramsf 1 and 2 in P. niruri sample and the mixed standard solutiont detection wavelength between 210 and 370 nm were observed.etection wavelength of 210 nm was selected for the chromato-raphic fingerprint and quantitative analyses because it providedigher signal intensities of target compounds and all detectableeparated compounds.
alidation of the developed method
The linear regression equation was expressed as follow: = 123 450.5608x − 1277.5080, r2 = 0.9988 (phyllanthin (1) linearange was 1.05–83.87 �g/ml) and y = 71 488.0543x + 4591.6544,2 = 0.9974 (for hypophyllanthin (2), linear range was.10–83.87 �g/ml) (Fig. 3). All calibration curves showed aood linear regression within the test ranges (acceptance criteria:2 ≥ 0.995). Data of calibration curves of 1 and 2 are shown inable 2. The LOD and LOQ of the two analytes were determinedt a signal to noise ratio (S/N) of 3 and 10, respectively (Fig. 4).he LOQ of 1 and 2 were 1.05 and 2.10 �g/ml, respectively. The
hromatograms used for LOQ evaluation are shown in Fig. 5. TheOD of 1 and 2 were 0.31 and 0.63 �g/ml, respectively.The recovery of 1 and 2 were found to be 98.78–100.20 and7.72–99.97%, respectively, and in accordance with acceptance
able 2nalytical data of calibration curves of phyllanthin (1) and hypophyllanthin (2).
Phyllanthin (1)
Concentration (�g/ml) Peak area
1.05 8971
10.48 1 339 581
20.97 2 538 863
41.93 5 326 690
62.90 7 912 859
83.87 10 172 635
Figure 5. DA plots of individual samples (Phyllanthus niruri, P. debilis and P. urinaria)and adulterated samples (P. niruri with P. debilis and P. urinaria).
criteria of recovery about 80–120%. These results indicated thatthe assessed method was accurate and reliable. The RSD values ofintra- and inter-day repeatability were less than 1.83 and 1.59%,respectively, and below the acceptance criteria value for repeata-bility (RSD ≤ 2%). These results showed excellent repeatability ofthe analytical method. The RSD values of stability were <1.02% withthe acceptance criteria of RSD for stability ≤2%) which indicatedthat the analytes were stable within 48 h. The results of accuracy,precision and stability are summarized in Table 3.
Peaks existed in samples with narrow peak shapes (tailing fac-
tor < 1.2), good resolutions (resolution > 1.3) and high intensitiescompared to the other peaks were assigned as characteristic peaks.There were nine characteristic peaks (peaks 1, 2, 5, 6, 7, 8, 9, 10 and11) found in the fingerprint chromatogram of P. niruri (Fig. 2b1).Hypophyllanthin (2)
Concentration (�g/ml) Peak area
2.10 11 02210.48 809 57520.97 1 511 16741.93 3 127 47562.90 4 593 07683.87 5 863 455

R. Nasrulloh et al. / Revista Brasileira de Farmacognosia 28 (2018) 527–532 531
Table 3Analytical data of recovery, precision and stability for quantitative determination of lignans in PN-1samples.
Analyte Recovery (n = 3) Precision (RSD, %) Stability (n = 6)
Average (%) RSD (%) Intra-day (n = 6) Inter-day (n = 3) RSD (%)
(1) 99.81 0.24 Day 1 = 0.52 1.42 0.82100.20 0.49 Day 2 = 1.4198.78 0.55 Day 3 = 0.49
(2) 99.72 0.17 Day 1 = 0.71 1.58 1.0199.97 0.40 Day 2 = 1.8297.72 0.59 Day 3 = 0.34
Phyllanthin (1) and hypophyllanthin (2).
Table 4Analytical data of precision and stability of nine characteristic peaks in PN-1 sample.
Peak number RSD of RRT (%) RSD of RPA (%)
Intra-day precision (n = 6) Inter-day precision (n = 3) Stability (n = 6) Intra-day precision (n = 6) Inter-day precision (n = 3) Stability (n = 6)
1 0.01 0.03 0.00 0.79 1.52 1.602 0.02 0.06 0.08 0.51 0.62 0.935 0.13 0.37 0.52 1.01 0.71 1.536 0.01 0.02 0.00 0.06 0.40 0.127 0.01 0.01 0.00 0.12 0.44 0.308 0.01 0.01 0.00 0.23 0.65 0.569a 0.00 0.00 0.00 0.00 0.00 0.0010 0.00 0.00 0.00 0.18 0.24 0.08
Paa1afid1
Qh
ntelTtvbmtncdpfs
AP
tmi2
11 0.03 0.05 0.08
a Reference peak.
eak 9 was chosen as the reference peak since it had a large peakrea. The RSD of RRT and RPA of the characteristic peaks for intra-nd inter-day precision and stability test were less than 0.53 and.61%, respectively. The acceptance criteria for precision is ≤2%. Thenalytical results of the precision and stability for chromatographicngerprint are shown in Table 4. These results indicated that theeveloped method was reliable for simultaneous determination of
and 2 and HPLC fingerprint analysis of P. niruri.
uantitative determination of phyllanthin (1) andypophyllanthin (2)
The proposed HPLC method was successfully applied to simulta-eously determined 1 and 2 in the three Phyllanthus species used inhis work. About 20 samples comprising of six samples of P. niruri,ight samples of P. debilis and six samples of P. urinaria were ana-yzed. The analysis of each sample was performed in triplicates.he contents of 1 and 2 in the six batches of P. niruri were inhe range 0.73–3.05 and 2.58–6.27 �g/mg, respectively. The largeariation of 1 and 2 contents in samples from different areas maye due to many factors, such as geographical conditions, environ-ental growth conditions and the age of the plants. Meanwhile,
he contents of 1 and 2 in P. debilis and P. urinaria are mostlyot detected except in the samples of PD-2 and PU-5. Overall, theontents of 1 and 2 in P. niruri are significantly higher than in P.ebilis and P. urinaria (Fig. 5). These results showed that the pro-osed method could be used to identify and discriminate P. nirurirom P. debilis and P. urinaria based on the contents of 1 and 2 in theamples.
uthentication and determination of Phyllanthus niruri from. debilis and P. urinaria
The proposed HPLC fingerprint method was successfully applied
o the three Phyllanthus species obtained from Rajapolah, Tasik-alaya (PN-5, PD-5 and PU-5). There were 11 common peaks foundn all chromatograms. There are nine characteristic peaks (peaks 1,, 5, 6, 7, 8, 9, 10 and 11) for P. niruri (Fig. 2b1), five characteristic
0.60 1.12 1.21
peaks (peaks 1, 2, 4, 5 and 11) for P. urinaria (Fig. 2b2) and fourcharacteristic peaks (peaks 1, 2, 3 and 11) for P. debilis (Fig. 2b3).In order to discriminate P. niruri, P. debilis and P. urinaria, the fin-gerprint chromatograms of all samples were compared. The resultshowed that six peaks with relatively high intensities (peaks 5, 6,7, 8, 9 and 10) were typical peaks for P. niruri. These peaks maybe used for identification and discrimination of P. niruri from P.debilis and P. urinaria (Fig. 2b). Peaks 3 and 4 were typical peaks forP. debilis and P. urinaria, respectively. These peaks can be used forauthentication of P. niruri if there is a contamination from P. debilisand P. urinaria as can be seen in Fig. 2c when P. niruri adulteratedwith P. debilis and P. urinaria. The intensity of typical peaks for P.niruri was linearly decreased with the increasing adulterant con-centrations (P. debilis and P. urinaria). These results showed thatthe chromatographic fingerprint might be used for authenticationof P. niruri from P. debilis and P. urinaria.
Authentication of P. niruri from P. debilis and P. urinaria could beindicated by visual observation of their fingerprint chromatogramsin addition to discriminant analysis (DA) used in this study. DA isone of the supervised pattern recognition analyses and mostly uti-lized for a discrimination or classification purpose of the object. DAwill generate a discriminant function (DF) for each group by search-ing a linear combination of data that will give separation of two ormore observation groups. In this study, DA was used for authentica-tion and discrimination of P. niruri, P. debilis and P. urinaria samplesbased on the peak areas of 11 common peaks. DA was performedon 38 objects (20 individual and 18 adulterated samples) and 11variable data matrices.
The individual sample used is six P. niruri samples, eight P.debilis samples and six P. urinaria samples. The adulterated samplesused were from six adulterant samples (PD-3, PD-5, PD-6, PU-3,PU-5 and PU-6) with three-level adulteration concentrations (25,50 and 75%). The result of DA showed that the total variance oftwo discriminant functions (DF) was 98.55% (DF1 = 95.32% andDF2 = 3.23%). This result showed that the individual samples (P.niruri, P. debilis and P. urinaria) and adulterated samples (P. niruri
with P. debilis and P. niruri with P. urinaria) could be classified intotheir own groups as shown in Fig. 5. Leave one out cross-validationwas used to validate the DA model and gave about 74% of samples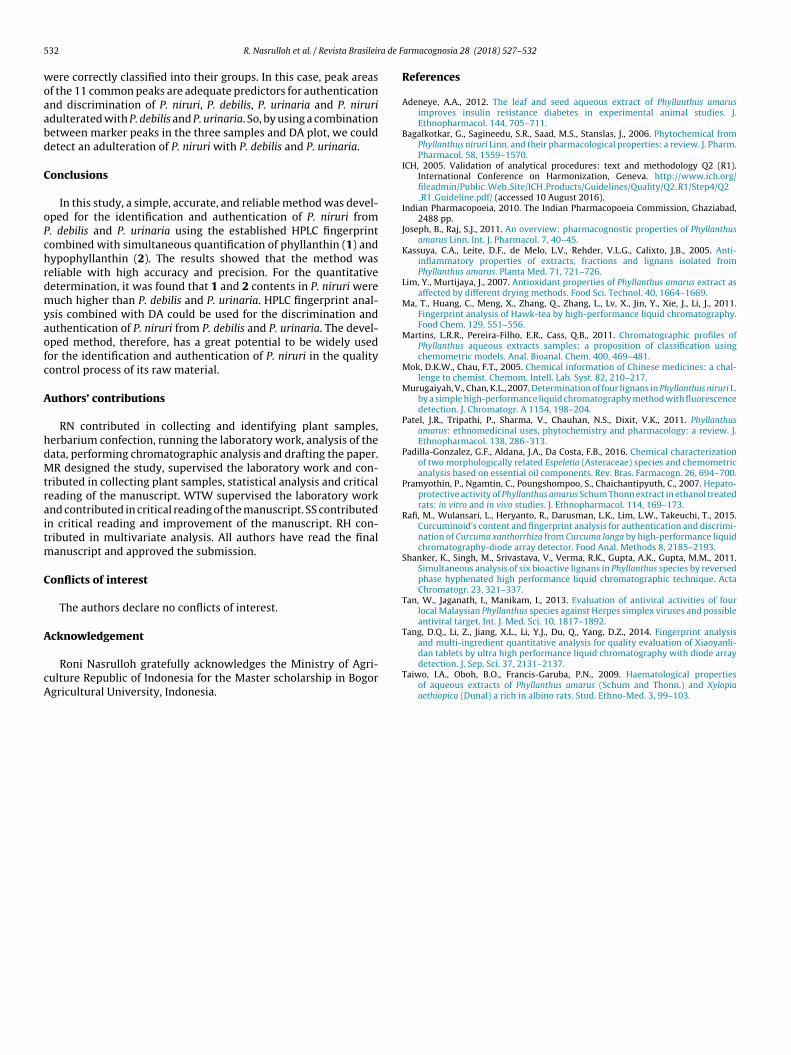
5 a de F
woaabd
C
oPchrdmyaofc
A
hdMtraitm
C
A
cA
32 R. Nasrulloh et al. / Revista Brasileir
ere correctly classified into their groups. In this case, peak areasf the 11 common peaks are adequate predictors for authenticationnd discrimination of P. niruri, P. debilis, P. urinaria and P. niruridulterated with P. debilis and P. urinaria. So, by using a combinationetween marker peaks in the three samples and DA plot, we couldetect an adulteration of P. niruri with P. debilis and P. urinaria.
onclusions
In this study, a simple, accurate, and reliable method was devel-ped for the identification and authentication of P. niruri from. debilis and P. urinaria using the established HPLC fingerprintombined with simultaneous quantification of phyllanthin (1) andypophyllanthin (2). The results showed that the method waseliable with high accuracy and precision. For the quantitativeetermination, it was found that 1 and 2 contents in P. niruri wereuch higher than P. debilis and P. urinaria. HPLC fingerprint anal-
sis combined with DA could be used for the discrimination anduthentication of P. niruri from P. debilis and P. urinaria. The devel-ped method, therefore, has a great potential to be widely usedor the identification and authentication of P. niruri in the qualityontrol process of its raw material.
uthors’ contributions
RN contributed in collecting and identifying plant samples,erbarium confection, running the laboratory work, analysis of theata, performing chromatographic analysis and drafting the paper.R designed the study, supervised the laboratory work and con-
ributed in collecting plant samples, statistical analysis and criticaleading of the manuscript. WTW supervised the laboratory worknd contributed in critical reading of the manuscript. SS contributedn critical reading and improvement of the manuscript. RH con-ributed in multivariate analysis. All authors have read the final
anuscript and approved the submission.
onflicts of interest
The authors declare no conflicts of interest.
cknowledgement
Roni Nasrulloh gratefully acknowledges the Ministry of Agri-ulture Republic of Indonesia for the Master scholarship in Bogorgricultural University, Indonesia.
armacognosia 28 (2018) 527–532
References
Adeneye, A.A., 2012. The leaf and seed aqueous extract of Phyllanthus amarusimproves insulin resistance diabetes in experimental animal studies. J.Ethnopharmacol. 144, 705–711.
Bagalkotkar, G., Sagineedu, S.R., Saad, M.S., Stanslas, J., 2006. Phytochemical fromPhyllanthus niruri Linn. and their pharmacological properties: a review. J. Pharm.Pharmacol. 58, 1559–1570.
ICH, 2005. Validation of analytical procedures: text and methodology Q2 (R1).International Conference on Harmonization, Geneva. http://www.ich.org/fileadmin/Public Web Site/ICH Products/Guidelines/Quality/Q2 R1/Step4/Q2R1 Guideline.pdf/ (accessed 10 August 2016).
Indian Pharmacopoeia, 2010. The Indian Pharmacopoeia Commission, Ghaziabad,2488 pp.
Joseph, B., Raj, S.J., 2011. An overview: pharmacognostic properties of Phyllanthusamarus Linn. Int. J. Pharmacol. 7, 40–45.
Kassuya, C.A., Leite, D.F., de Melo, L.V., Rehder, V.L.G., Calixto, J.B., 2005. Anti-inflammatory properties of extracts, fractions and lignans isolated fromPhyllanthus amarus. Planta Med. 71, 721–726.
Lim, Y., Murtijaya, J., 2007. Antioxidant properties of Phyllanthus amarus extract asaffected by different drying methods. Food Sci. Technol. 40, 1664–1669.
Ma, T., Huang, C., Meng, X., Zhang, Q., Zhang, L., Lv, X., Jin, Y., Xie, J., Li, J., 2011.Fingerprint analysis of Hawk-tea by high-performance liquid chromatography.Food Chem. 129, 551–556.
Martins, L.R.R., Pereira-Filho, E.R., Cass, Q.B., 2011. Chromatographic profiles ofPhyllanthus aqueous extracts samples: a proposition of classification usingchemometric models. Anal. Bioanal. Chem. 400, 469–481.
Mok, D.K.W., Chau, F.T., 2005. Chemical information of Chinese medicines: a chal-lenge to chemist. Chemom. Intell. Lab. Syst. 82, 210–217.
Murugaiyah, V., Chan, K.L., 2007. Determination of four lignans in Phyllanthus niruri L.by a simple high-performance liquid chromatography method with fluorescencedetection. J. Chromatogr. A 1154, 198–204.
Patel, J.R., Tripathi, P., Sharma, V., Chauhan, N.S., Dixit, V.K., 2011. Phyllanthusamarus: ethnomedicinal uses, phytochemistry and pharmacology: a review. J.Ethnopharmacol. 138, 286–313.
Padilla-Gonzalez, G.F., Aldana, J.A., Da Costa, F.B., 2016. Chemical characterizationof two morphologically related Espeletia (Asteraceae) species and chemometricanalysis based on essential oil components. Rev. Bras. Farmacogn. 26, 694–700.
Pramyothin, P., Ngamtin, C., Poungshompoo, S., Chaichantipyuth, C., 2007. Hepato-protective activity of Phyllanthus amarus Schum Thonn extract in ethanol treatedrats: in vitro and in vivo studies. J. Ethnopharmacol. 114, 169–173.
Rafi, M., Wulansari, L., Heryanto, R., Darusman, L.K., Lim, L.W., Takeuchi, T., 2015.Curcuminoid’s content and fingerprint analysis for authentication and discrimi-nation of Curcuma xanthorrhiza from Curcuma longa by high-performance liquidchromatography-diode array detector. Food Anal. Methods 8, 2185–2193.
Shanker, K., Singh, M., Srivastava, V., Verma, R.K., Gupta, A.K., Gupta, M.M., 2011.Simultaneous analysis of six bioactive lignans in Phyllanthus species by reversedphase hyphenated high performance liquid chromatographic technique. ActaChromatogr. 23, 321–337.
Tan, W., Jaganath, I., Manikam, I., 2013. Evaluation of antiviral activities of fourlocal Malaysian Phyllanthus species against Herpes simplex viruses and possibleantiviral target. Int. J. Med. Sci. 10, 1817–1892.
Tang, D.Q., Li, Z., Jiang, X.L., Li, Y.J., Du, Q., Yang, D.Z., 2014. Fingerprint analysisand multi-ingredient quantitative analysis for quality evaluation of Xiaoyanli-
dan tablets by ultra high performance liquid chromatography with diode arraydetection. J. Sep. Sci. 37, 2131–2137.Taiwo, I.A., Oboh, B.O., Francis-Garuba, P.N., 2009. Haematological propertiesof aqueous extracts of Phyllanthus amarus (Schum and Thonn.) and Xylopiaaethiopica (Dunal) a rich in albino rats. Stud. Ethno-Med. 3, 99–103.