hp 34812a benchlink software - california state university, los
TRANSCRIPT

HP 34812A BenchLink Software
User’s Guide
Part Number 34812-90001August 1994
For Warranty and Regulatory information, see the pages behind the Index.
© Copyright Hewlett-Packard Company 1994 All Rights Reserved.

The HP 34812A BenchLink Software (HP BenchLink/Meter) packageprovides a communication link between a personal computer (PC) andthe HP 34401A Multimeter (multimeter) or HP 53131/2A Universal orHP 53181A RF Counter (counters). HP BenchLink/Meter allows you toacquire, analyze, and save measurement data in a Windowsenvironment. HP BenchLink/Meter’s key functions are:
• Acquire measurements from the instrument for real time or post-test analysis.
• Display measurement data graphically in real time strip charts or histograms.
• Scale measurements to reflect engineering units such as temperature,pressure, etc.
• Perform software limit testing on the measurement data.
• Display statistical information.
• Automatic and manual entry of information in the journal whileacquiring measurement data.
• Copy measurement data and graphs to the Clipboard.
• Print measurement data as graphs.
• Import data from other BenchLink applications for analysis (.CSV or .PRN format).
• Export measurements as .CSV or .PRN files that may be read byexternal analysis/charting software applications.
This block diagram shows the flow of data within HP BenchLink/Meter.Solid blocks indicate the components and processes of the application.
HP 34812A BenchLink Software

Conventions Used in this GuideThroughout this guide the following typeface and icon conventions aremaintained to improve readability and enable you to quickly find theinformation you need.
Ctrl+C Italics are used to indicate a hot key (shortcut) to perform a task or togive some useful information.
The Toolbar and some paragraphs in this guide contain icons to representan action.
CANCEL This typeface is used to indicate the label on a button or other control.
b:\setup This typeface indicates that input from the keyboard can be typedliterally or indicates a menu command to be selected. For example:"Type b:\setup" or "Select File | Open Project... from the Menu Bar".File | Open Project... is separated by a bar because you must firstselect the File menu, then select Open.
Recommended ReadingThis guide assumes that you have some experience using MicrosoftWindows. If you don’t know how to use the basic features of Windows orare unfamiliar with terms such as click, double-click, resizing, anddragging, you may want to consult your Microsoft Windows User’s Guide.
If you are new to the HP 34401A Multimeter, HP 53131/2A Universal orthe HP 53181A RF Counter, please read your user’s guide before usingHP BenchLink/Meter.
The READBLM.WRI fileThis file contains up-to-date information about the HP BenchLink/Meterapplication. It is installed as an icon in the BenchLink program groupduring installation. Double-click the icon to view the contents of the file.
2

In This BookChapter 1 - Installation describes how to install HP BenchLink/Meterand configure your instrument for operation.
Chapter 2 - Quick Start describes how to start the software andprovides a brief exercise to help you get started using HP BenchLink/Meter.
Chapter 3 - Using HP BenchLink/Meter describes how to use HP BenchLink/Meter for the acquisition and scaling of measurementdata. Limit testing is also detailed.
Chapter 4 - Feature and Function Reference describes the featuresand functions available in HP BenchLink/Meter. Special file formats aredescribed.
Chapter 5 - Using with Other Applications describes how to use HP BenchLink/Meter with other Windows applications. Copying,importing, and exporting data are explained.
Chapter 6 - Error and Information Messages lists possible HP BenchLink/Meter error and information messages with explanationsand suggested solutions.
3

Table of ContentsConventions Used in this Guide . . . . . . . . . . . . . . . . . . 2Recommended Reading . . . . . . . . . . . . . . . . . . . . . . 2The READBLM.WRI file . . . . . . . . . . . . . . . . . . . . . 2In This Book . . . . . . . . . . . . . . . . . . . . . . . . . . . . 3
Chapter 1 - InstallationEquipment Required . . . . . . . . . . . . . . . . . . . . . . . . 8
Personal Computer Requirements . . . . . . . . . . . . . . . 8Computer Interface Requirements . . . . . . . . . . . . . . . 8
Installing the HP BenchLink/Meter Software . . . . . . . . . . 9If you encounter problems . . . . . . . . . . . . . . . . . . . 11
To Change the HP BenchLink/Meter Icon . . . . . . . . . . . . 12Freeing Disk Space . . . . . . . . . . . . . . . . . . . . . . . . 13To Remove HP BenchLink/Meter . . . . . . . . . . . . . . . . . 14
Chapter 2 - Quick StartHP BenchLink/Meter Components . . . . . . . . . . . . . . . . 16
Title Bar . . . . . . . . . . . . . . . . . . . . . . . . . . . . . 16Menu Bar . . . . . . . . . . . . . . . . . . . . . . . . . . . . 17Toolbar . . . . . . . . . . . . . . . . . . . . . . . . . . . . . . 17Status Bar . . . . . . . . . . . . . . . . . . . . . . . . . . . . 17Project Window . . . . . . . . . . . . . . . . . . . . . . . . . 17Strip Chart Window . . . . . . . . . . . . . . . . . . . . . . . 18Histogram Window . . . . . . . . . . . . . . . . . . . . . . . 18Readout Window . . . . . . . . . . . . . . . . . . . . . . . . 18Statistics Window . . . . . . . . . . . . . . . . . . . . . . . . 18Analysis Window . . . . . . . . . . . . . . . . . . . . . . . . 19
Starting and Closing HP BenchLink/Meter . . . . . . . . . . . 19Running a Sample Test Project . . . . . . . . . . . . . . . . . . 20
Creating a Sample Test Project . . . . . . . . . . . . . . . . 20Displaying Measurement Data . . . . . . . . . . . . . . . . . 23Saving Project and Measurement Data . . . . . . . . . . . . 26
Chapter 3 - Using HP BenchLink/MeterAbout the HP BenchLink/Meter Application . . . . . . . . . . . 30Making Standard Measurements . . . . . . . . . . . . . . . . . 31
Function and Range Options . . . . . . . . . . . . . . . . . . 31Resolution Options . . . . . . . . . . . . . . . . . . . . . . . 33Acquisition Options . . . . . . . . . . . . . . . . . . . . . . . 34
Running a Test with Limits Enabled . . . . . . . . . . . . . . . 36Configuring Limit Testing . . . . . . . . . . . . . . . . . . . 36
Using the BenchLink/Launch Program . . . . . . . . . . . . . . 38
4

Chapter 3 - Using HP BenchLink/Meter (continued)Using HP BenchLink/Meter to Scale Data . . . . . . . . . . . 40
Linear Scaling . . . . . . . . . . . . . . . . . . . . . . . . . 40Lookup Tables . . . . . . . . . . . . . . . . . . . . . . . . . 41Equation Libraries . . . . . . . . . . . . . . . . . . . . . . . 43
Printing Windows and Measurements . . . . . . . . . . . . . . 44Printing Strip Chart, Histogram, or Analysis Windows . . . 44Printing Journal or Statistics Window Information From Other Applications . . . . . . . . . . . . . . . . . . . 44
Saving Project Information . . . . . . . . . . . . . . . . . . . . 45Saving the Project as a .PRJ File . . . . . . . . . . . . . . . 45Saving Measurement Data as .CSV or .PRN Files . . . . . . 46
Using HP BenchLink/Meter Help . . . . . . . . . . . . . . . . 47Configuring the Interface . . . . . . . . . . . . . . . . . . . . . 48Configuring Your Instrument . . . . . . . . . . . . . . . . . . 50
HP 34401A Multimeter . . . . . . . . . . . . . . . . . . . . 50HP 53131A/53132A/53181A Counters . . . . . . . . . . . . 50
Chapter 4 - Feature and Function ReferenceHP BenchLink/Meter Screen Components . . . . . . . . . . . . . 52
Title Bar . . . . . . . . . . . . . . . . . . . . . . . . . . . . 52Menu Bar . . . . . . . . . . . . . . . . . . . . . . . . . . . . 52Toolbar . . . . . . . . . . . . . . . . . . . . . . . . . . . . . 53Status Bar . . . . . . . . . . . . . . . . . . . . . . . . . . . 54Project Window . . . . . . . . . . . . . . . . . . . . . . . . . 55Strip Chart Window . . . . . . . . . . . . . . . . . . . . . . 60Histogram Window . . . . . . . . . . . . . . . . . . . . . . . 63Readout Window . . . . . . . . . . . . . . . . . . . . . . . . 64Statistics Window . . . . . . . . . . . . . . . . . . . . . . . 65Analysis Window . . . . . . . . . . . . . . . . . . . . . . . . 66
File Descriptions . . . . . . . . . . . . . . . . . . . . . . . . . 68HP BenchLink/Meter File Formats . . . . . . . . . . . . . . 68Export Data File Formats . . . . . . . . . . . . . . . . . . . 68
Chapter 5 - Using With Other ApplicationsCopying Data to the Clipboard . . . . . . . . . . . . . . . . . . 70Exporting Data as .CSV or .PRN Files . . . . . . . . . . . . . . 71Importing Data to the Analysis Window . . . . . . . . . . . . . 72
Importing .CSV or .PRN Files . . . . . . . . . . . . . . . . . 72Importing .DAT Files . . . . . . . . . . . . . . . . . . . . . 73
Starting Other BenchLink Applications . . . . . . . . . . . . . 74
Chapter 6 - Error and Information Messages . . . . . . . 75Index . . . . . . . . . . . . . . . . . . . . . . . . . . . . . . . 83
5

1
Installation
1

Equipment RequiredPersonal Computer Requirements • IBM (or compatible) 386 or 486 PC.
• 3.5" 1.44Mb floppy disk drive (high density).
• Microsoft compatible mouse (bus or serial).
• Color VGA or SVGA display.
• 4 MB memory.
• 2 MB free disk space (additional space is required for storage of project and data files).
• Microsoft Windows version 3.1 or higher.
• Microsoft MS-DOS version 5.0 or higher.
• Either RS-232 or IEEE-488 (HP-IB/GPIB) interface (as described below).
Computer Interface RequirementsIEEE-488 Interface Requirements. To use an IEEE-488 interface withHP BenchLink/Meter you must have an HP-IB cable (HP 10833X) and oneof the following IEEE-488 interface cards already installed in your computer:
• HP 27209A HP-IB
• HP 82335A/B HP-IB
• HP 82341A and HP 82340A HP-IB
• National Instruments AT-GPIB
• National Instruments AT-GPIB/TNT
• National Instruments GPIB-PCII/IIA
RS-232 Requirements (HP 34401A Multimeter only). To use RS-232with HP BenchLink/Meter you must have an RS-232 cable and anavailable Asynchronous Serial (COM) port on your PC.
To connect the PC COM port to the HP 34401A Multimeter use anHP 34398A cable kit. See the READBLM.WRI file for more informationon the RS-232 cable pinout configuration.
1 HP-IB is Hewlett-Packard’s implementation of IEEE-488.2
1
Chapter 1 InstallationEquipment Required
8

Installing the HP BenchLink/Meter Software1 Insert the HP BenchLink/Meter floppy disk in your computer disk drive.
2 Save any work in progress. Close unneeded applications. Select File | Run... at the Program Manager. Type a:\setup in theCOMMAND LINE text box and press ENTER or click OK. Change thedrive letter if needed (i.e., b:\setup).
1
Chapter 1 InstallationInstalling the HP BenchLink/Meter Software
9

3 During the installation process, the setup program will prompt you forthe directory to receive the files. Click INSTALL to accept the defaultinstallation directory. Click SET LOCATION and type a new drive anddirectory in the INSTALL TO text box if needed.
HP BenchLink/Meter’s installation program displays the size of the filesyou elect to install. It also verifies that your destination disk drive hasspace available for those files.
4 The installation program will create a new program group in theProgram Manager and add the HP BenchLink/Meter, Help, and Readmeicons to the group.
During the setup program, you will be prompted to enter your name andyour company name. This information will appear in the banner screeneach time you start HP BenchLink/Meter.
1
Chapter 1 InstallationInstalling the HP BenchLink/Meter Software
10

If you encounter problems• Check the READBLM.WRI file for last-minute developments.
• Check the system and interface requirements listed on page 8.
• If you are using RS-232, be sure you are using the correct cable.Cable configurations and model numbers are described in theREADBLM.WRI file.
• Check the error messages described in Chapter 6.
• If your PC is configured to use extended memory management (such asEMM386.EXE) and you are using a Hewlett-Packard HP-IB interfacecard, you must ensure that the memory management does not conflictwith the interface card. This is accomplished by inserting an exclusionstatement such as X=DC00–DFFF in your CONFIG.SYS file. See theinstallation section of your HP-IB interface card user’s manual forsteps to avoid this problem.
• If you are using an IEEE-488 interface card, ensure you have correctlyinstalled the interface software before running HP BenchLink/Meter.Either an HPIB.DLL or GPIB.DLL file must be located in your HP BenchLink/Meter directory, the Windows directory, or a directoryincluded in the PATH command in your AUTOEXEC.BAT file. (If youare using the HP 82341A or HP 82340A HP-IB card, you must havethe SICL16.DLL and SICLUT16.DLL files in your Windows directory.)For specific details, refer to your IEEE-488 interface card installationguide.
1
Chapter 1 InstallationInstalling the HP BenchLink/Meter Software
11

To Change the HP BenchLink/Meter IconYou can change the HP BenchLink/Meter icon appearance in theBenchLink program group.
1 Click the HP BenchLink/Meter icon in the BenchLink program group toselect it (do not double-click to start the application).
2 Select File | Properties... in the Windows Program Manager Menu Bar.The Program Item Properties dialog box is displayed.
3 Click the CHANGE ICON... button. The Change Icon dialog box is displayed.
4 Scroll through the available icons and double-click the icon you want orhighlight the icon and click OK. You will be returned to the Program ManagerItems Properties dialog box which will now show the new icon. Click OK.
You can also select other icons from other program files. Refer to yourWindows documentation for complete details about changing icons.
1
Chapter 1 InstallationTo Change the HP BenchLink/Meter Icon
12
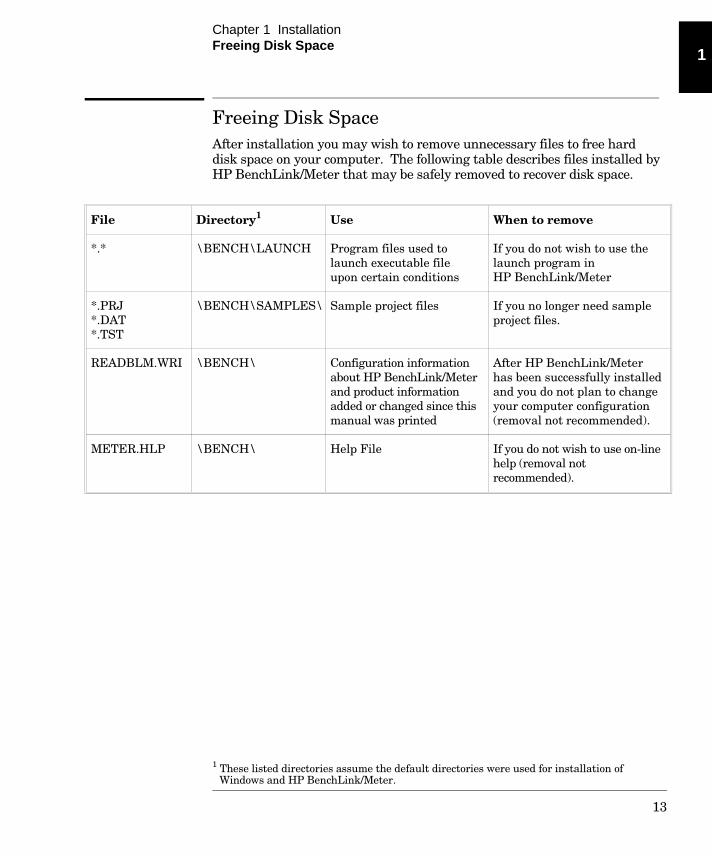
Freeing Disk SpaceAfter installation you may wish to remove unnecessary files to free harddisk space on your computer. The following table describes files installed byHP BenchLink/Meter that may be safely removed to recover disk space.
File Directory1 Use When to remove
*.* \BENCH\LAUNCH Program files used tolaunch executable fileupon certain conditions
If you do not wish to use thelaunch program in HP BenchLink/Meter
*.PRJ*.DAT*.TST
\BENCH\SAMPLES\ Sample project files If you no longer need sampleproject files.
READBLM.WRI \BENCH\ Configuration informationabout HP BenchLink/Meterand product informationadded or changed since thismanual was printed
After HP BenchLink/Meterhas been successfully installedand you do not plan to changeyour computer configuration(removal not recommended).
METER.HLP \BENCH\ Help File If you do not wish to use on-linehelp (removal notrecommended).
1 These listed directories assume the default directories were used for installation of Windows and HP BenchLink/Meter.
1
Chapter 1 InstallationFreeing Disk Space
13

To Remove HP BenchLink/Meter
CAUTION Do not delete the Bench directory or files with the.INI, .DLL, .CSV, or .PRN extensions if you have other BenchLinkapplications installed on your PC.
To remove the HP BenchLink/Meter program from your computer hard disk:
1 Delete the following files from the listed directories:
BENCH directory (or user specified installation directory):METER.EXE BenchLink/Meter executableMETER.HLP BenchLink/Meter Help fileLOOKUP.TBL Lookup table fileREADBLM.WRI BenchLink/Meter read me fileUNITS.CST BenchLink/Meter fileUPDT_INI.EXE INI file update program
BENCH\LAUNCH directory (or user specified installation directory):*.* MS Visual C++ source code files
for launch application
BENCH\SAMPLES directory (or user specified installation directory):*.PRJ Sample test project files*.DAT Sample test project files*.TST Sample test project files
WINDOWS directory:BENCHLNK.INI Benchlink initialization fileBLSCALE.DLL Dynamic Link LibraryHPIB.DLL Dynamic Link LibraryQCBASED.DLL Dynamic Link LibrarySVIEWHP.DLL Dynamic Link LibrarySVIEWNI.DLL Dynamic Link LibraryUPDTBLNK.INI Benchlink update fileSEMAPHOR.DLL Dynamic Link LibrarySVSICL.DLL Dynamic Link Library
WINDOWS\SYSTEM directory:CTLSDV2.DLL Dynamic Link LibraryMSCOMM.VBX Custom control used by BenchlinkSSBC.VBX Custom control used by BenchlinkTOOLHELP.DLL Dynamic Link Library
2 Delete the \BENCH directory.
1
Chapter 1 InstallationTo Remove HP BenchLink/Meter
14

2
Quick Start
2

This chapter provides an overview of HP BenchLink/Meter and gives afew exercises to help you get started using the software. This chapterdoes not describe all the features and functions of HP BenchLink/Meter.See Chapter 4 for more details.
HP BenchLink/Meter ComponentsTitle Bar
Menu Bar
Toolbar
Status Bar
Title BarThe Title Bar provides the standard Windows Control-menu box andsizing buttons. In the Title Bar, HP BenchLink/Meter also displays thename of the open project (.PRJ) file.
2
Chapter 2 Quick StartHP BenchLink/Meter Components
16

Menu BarThe Menu Bar contains pull-down menus. Position your cursor over a menuitem and click the mouse button to view the menu choices. You can alsoaccess the menus by holding the Alt key down and typing the underlinedletter of the menu choice (for example, Alt+F will display the File menu).
ToolbarThe Toolbar contains icons for quick display of dialog boxes and rapidexecution of HP BenchLink/Meter menu options. The icons on theToolbar perform the same tasks as the pull-down menus in the MenuBar, but do so with a single mouse click.
Status BarThe Status Bar provides brief descriptions of the Menu Bar and Toolbaritems currently selected as well as the test status and current time. Itappears at the very bottom of the HP BenchLink/Meter screen anddynamically changes as the various menu commands are selected.
Project Window
This window is where you configure a test. It contains five categories ofsetup information. The project window also displays a button forcategory help. When you click the HELP button, information for theselected category is displayed. The following categories are available:
Function - This category allows you to configure measurement type, range,and resolution. This category varies according to the type of instrumentselected.
Acquisition - This category allows you to configure acquisition andtiming criteria.
Scale Data - This category allows you to scale incoming data and specifydisplay units.
Limit Testing - This category allows you to set limit values, enable limittesting, and failure options.
Journal - This category allows you to automatically or manuallydocument important information about the current project.
2
Chapter 2 Quick StartHP BenchLink/Meter Components
17

Each project has only one project window. The Title Bar at the top of thewindow contains the word ‘Project’ and the name you entered when youcreated the project.
Except for adding journal entries, editing of project information isdisabled while a test is running.
For more information on the content and functionality of projectwindow categories, see Chapter 4 - Feature and Function Reference.
Strip Chart Window
The strip chart window is the data acquisition window in HP BenchLink/Meter. It receives and displays the data as a line graphwith the number of measurements on the X-axis and measurementvalues on the Y-axis. The data in the window is automatically scrolled asnew data is acquired. You have the capability to scroll and zoom in onthe data when the test is paused or stopped.
Histogram Window
This window provides the capability to histogram data acquired from theinstrument. Histogram parameters such as data range and number ofbins can be specified.
Readout Window
The readout window is a ‘simulated LED’ window that displays thecurrent measurement value from the front panel of the connectedinstrument.
Statistics Window
This window displays statistical information for the acquired data.
2
Chapter 2 Quick StartHP BenchLink/Meter Components
18

Analysis Window
The analysis window can be used to display and analyze data copied fromthe strip chart window or from imported data files. This window’sprimary purpose is to provide a temporary workspace for data analysis.The contents of this window is not saved with the test project.
Starting and Closing HP BenchLink/MeterStarting. HP BenchLink/Meter can be started in one of three ways:
• From the BenchLink program group, double-click theBenchLink/Meter icon.
• From the Windows File menu, choose Run... and, assuming HP BenchLink/Meter was loaded in a directory named ‘bench’, enter:\bench\meter.exe.
• From the DOS prompt, assuming HP BenchLink/Meter was loaded ina directory named ‘bench’, type: win \bench\meter.exe.
Once started, the HP BenchLink/Meter screen can be positioned, sized,maximized, or reduced to an icon using the standard Windows controls onthe Title Bar.
Closing. You can exit from HP BenchLink/Meter in one of two ways:
• From the HP BenchLink/Meter Menu Bar, choose File | Exit.
• Double-click the Windows Control-menu box.
HP BenchLink/Meter will prompt you to save a new or unsaved projectwindow.
2
Chapter 2 Quick StartStarting and Closing HP BenchLink/Meter
19

Running a Sample Test ProjectThis exercise demonstrates how to use HP BenchLink/Meter. A sampletest project for an HP 34401A Multimeter is created, displayed, andsaved using the default parameters in the project window. Beforeattempting the sample test, it is recommended you have an instrumentconnected and configured. For information on interface configuration, See Configuring the Interface in Chapter 3.
Creating a Sample Test Project1 To create a new project, click the New Project icon or select
File | New Project... from the Menu Bar. The New Project dialog boxwill be displayed. The PROJECT TYPE drop-down list displays theinstrument types for which a project can be created. Projects can beopened without an attached instrument.
The BROWSE... button can be used to display a list of existing test projects.Use the File | Open Project... command to open existing projects.
Only one project may be opened at a time. If a project is already opened,this command will not be available. Close the current test project andtry step 1 again.
2 Type a filename in the PROJECT NAME text box and click the OK button.The project window will be displayed, indicating your selected filename inthe Title Bar. Project categories are displayed on the left side of thewindow and the options on the right.
If you type a filename that already exists, HP BenchLink/Meter willwarn you that it exists and ask if you want to overwrite it. If you selectYES, then the data and project information from that previous test willbe deleted and the project becomes a new one.
2
Chapter 2 Quick StartRunning a Sample Test Project
20

3 The first category displayed is the Function Category, listing appropriateoptions for the measurement functions, ranges and instrumentresolution. This example of the Function Category displays options forthe multimeter. Counter functions are different. For this sample project,do not change any of the default parameters.
4 Resolution can be optimized for speed or for accuracy in the FunctionCategory. Click the RESOLUTION DETAILS... button to display theResolution Options dialog box. Individual options may be selected or theACCURACY or SPEED buttons may be selected. The ACCURACY buttonselects the greatest amount of resolution. The SPEED button selects thefastest acquisition. Resolution options are downloaded to the attachedinstrument when the test is started. Do not change any of the optionsand click the OK button to close the dialog box.
2
Chapter 2 Quick StartRunning a Sample Test Project
21

5 Click the GET INSTRUMENT SETTINGS? button to query the attachedinstrument and display the results in HP BenchLink/Meter. This willautomatically change the function, range, and resolution to match thosevalues presently in the instrument.
6 Select the Acquisition icon from the category list. The options availablefor this category include trigger setup, completion criteria, and the abilityto set a delayed start time. Do not change any of the default parametersfor the sample test.
The TIMED START check box is used when you want to delay the start ofthe test. The delayed start time can be up to 24 hours in advance.Current time is always shown in the lower right corner of HP BenchLink/Meter’s Status Bar.
You are now ready to collect measurement data from the attachedinstrument with default project parameters.
2
Chapter 2 Quick StartRunning a Sample Test Project
22

If you do not have an instrument attached via IEEE-488 or RS-232cable, you cannot perform the next two sections - Displaying and Savingthe Sample Test.
Displaying Measurement Data1 Click the Strip Chart icon or select Window | Strip Chart from the
Menu Bar to display a strip chart window.
2 Click the Histogram icon or select Window | Histogram from the MenuBar to display the histogram window.
3 Click the Statistics icon or select Window | Statistics from the MenuBar to display the statistics window.
4 Click the Readout icon or select Window | Readout from the Menu Barto display the readout window.
5 Click the Run icon or select Test | Run from the Menu Bar to start thetest. The Run icon is depressed and the data will be displayed in thewindows that you have opened.
6 The test can be paused and resumed at any time during the collection of data by clicking the Pause/Resume icon or by selecting Test | Pause/Resume from the Menu Bar. When a test is temporarilypaused, the strip chart window will adjust the display to show the lastpoints acquired. The Pause/Resume icon remains depressed until thetest is resumed.
CAUTION When a test is paused, measurements taken by the attachedinstrument are not saved.
When displaying real time histogram and statistics windowssimultaneously, the information in the histogram may not match thestatistics displayed in the statistics window. This is because the defaultnumber of bins and data range parameters in the histogram windowmay not be optimized for your data. To make the information in thesewindows match, the histogram should be closed and reopened after thetest has concluded.
2
Chapter 2 Quick StartRunning a Sample Test Project
23

7 Important information about the project such as reasons to perform thetest and particular test conditions can be entered in the journal. TheJournal Category is accessed by clicking on it in the project window or bytyping ‘J’ when the category list of the project window is active. Journalentries are automatically made upon the following conditions:
• the test is started
• the test is paused
• the test is resumed
• the test is stopped
• limit testing is enabled/disabled
• limit values have been changed
• a limit value has been exceeded (if limit testing is enabled andlogging of failures has been selected)
Manual entries can be made in the journal at any time even whilerunning a test. To add an entry, click the ADD ENTRY button, enter thetext and click OK.
2
Chapter 2 Quick StartRunning a Sample Test Project
24

8 Click the Stop icon or select Test | Stop from the Menu Bar to stop thetest. Once you stop the test it cannot be resumed (only a paused test canbe resumed).
Within the strip chart window, an interactive ‘control bar’ providesbrowsing and zooming capability on the acquired data. The control barconsists of three mouse-interactive objects - a data rectangle and a draghandle on each side of the rectangle. The data rectangle is a visualreference used to indicate the location of the strip chart window’s data inrelation to the entire data set.
data rectangle
left drag handle right drag handle
Browsing and/or paging is accomplished by clicking and dragging therectangle or using the PAGE UP, PAGE DOWN, END, and HOME keys onyour keyboard. You can zoom in and out of the data by using a click anddrag motion on either drag handle. Moving a drag handle changes thenumber of measurements viewed in the window, effectively changing theX-axis scale.
9 Select View | Markers from the Menu Bar to enable vertical markers inthe strip chart window. (You can also use the Chart Parameters dialogbox to enable markers) Vertical markers in the strip chart window areused to specify selection boundaries for Edit | Copy operations and tospecify time and reading value information. The time locations of themarkers and the value of the readings are displayed at the bottom of thestrip chart window. The markers can be moved by clicking and draggingthem with your mouse, or you can use the left/right arrow keys on yourkeyboard when you have selected a marker. Use Alt+L to select the leftmargin and Alt+R to select the right margin. For exact markerplacement, select View | Modify Parameters... and type the readingnumbers in the LEFT and RIGHT text boxes of the Chart Parametersdialog box.
Data between the markers is copied to the Clipboard when the Edit | Copy command is selected. A maximum of 4000 readings can becopied at one time. This data can then be pasted into the analysiswindow.
2
Chapter 2 Quick StartRunning a Sample Test Project
25
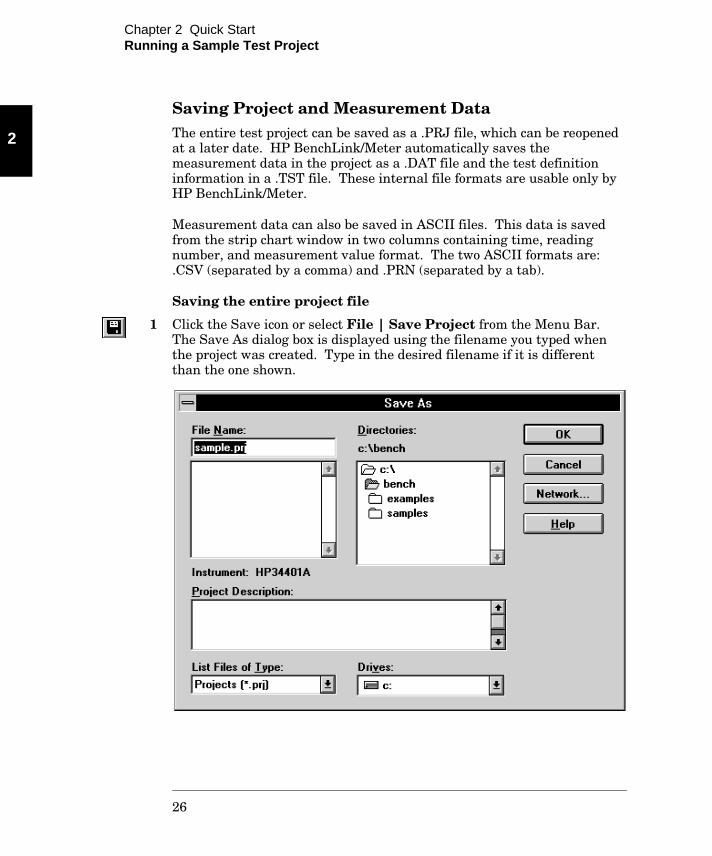
Saving Project and Measurement DataThe entire test project can be saved as a .PRJ file, which can be reopenedat a later date. HP BenchLink/Meter automatically saves themeasurement data in the project as a .DAT file and the test definitioninformation in a .TST file. These internal file formats are usable only byHP BenchLink/Meter.
Measurement data can also be saved in ASCII files. This data is savedfrom the strip chart window in two columns containing time, readingnumber, and measurement value format. The two ASCII formats are:.CSV (separated by a comma) and .PRN (separated by a tab).
Saving the entire project file
1 Click the Save icon or select File | Save Project from the Menu Bar.The Save As dialog box is displayed using the filename you typed whenthe project was created. Type in the desired filename if it is differentthan the one shown.
2
Chapter 2 Quick StartRunning a Sample Test Project
26

2 A description of the project can be typed in the PROJECT DESCRIPTIONtext box. This information is available for display or modification whenyou reopen the file at a later date.
3 When you have finished with the Save As dialog box options, click the OKbutton to save the project file.
The .PRJ project file can be reopened at a later date and the test runagain using the same parameters.
Saving measurement data
1 With the strip chart window as the active window, select File | Export Data... from the Menu Bar. The Export Strip Chart Datadialog box is displayed.
2 Select either .PRN or .CSV from the SAVE FILE AS TYPE drop-down list.Select the correct drive, directory and type a name in the FILE NAME textbox.
3 After your choices have been selected or typed, click the OK button. Thenew file will be saved in the specified directory.
The .CSV or .PRN file can be opened in another application such asMicrosoft Word or Excel to display or annotate test results.
2
Chapter 2 Quick StartRunning a Sample Test Project
27

3
Using HP BenchLink/Meter
3

This chapter describes procedures, components, and features you will usein HP BenchLink/Meter.
About the HP BenchLink/Meter ApplicationThe acquisition of test measurement data is the ultimate goal of the HP BenchLink/Meter application. The project window is the controlcenter. From this window you can configure virtually all aspects of thetest - from measurement data type to the time interval and number ofreadings in the test.
The measurement data can be acquired from a Multimeter (HP 34401A),a Universal Counter (HP 53131/2A), or an RF Counter (HP 53181A).While the data is being captured, it may be viewed graphically byopening a strip chart or histogram window. This data can be scaled usinglinear or other custom algorithms. Limit testing may be performed whilethe test is running with various responses available upon test failure.Statistics information is also available on the data.
After the data has been acquired, it can be copied to and analyzed in theanalysis window, copied to the Clipboard as data & graphics, printed, orsaved as an ASCII data file.
All information in the project window is saved in a proprietary .TST fileas part of the project (.PRJ) file. Desktop information such as windowsize and placement in the HP BenchLink/Meter screen is also saved aspart of the project. Existing projects can be reopened, modified, andsaved for later use; or, the project can be saved as another filename usingthe File | Save As... menu command. This allows you to createstandard test project windows for reuse without performing all the stepsnecessary to create a new project.
Saving and opening project files from a floppy disk can be very slow.It is recommended that all project files be saved on your hard disk.
3
Chapter 3 Using HP BenchLink/MeterAbout the HP BenchLink/Meter Application
30
Making Standard MeasurementsHP BenchLink/Meter collects measurement data from both counters andmultimeters. Running a test project is essentially the same for countersand meters, but configuration options such as measurement functions,ranges, resolutions, and acquisition information vary between the twotypes of instruments. This section explains the operation of HP BenchLink/Meter when configuring measurement functions and acquisition options for both counters and multimeters.
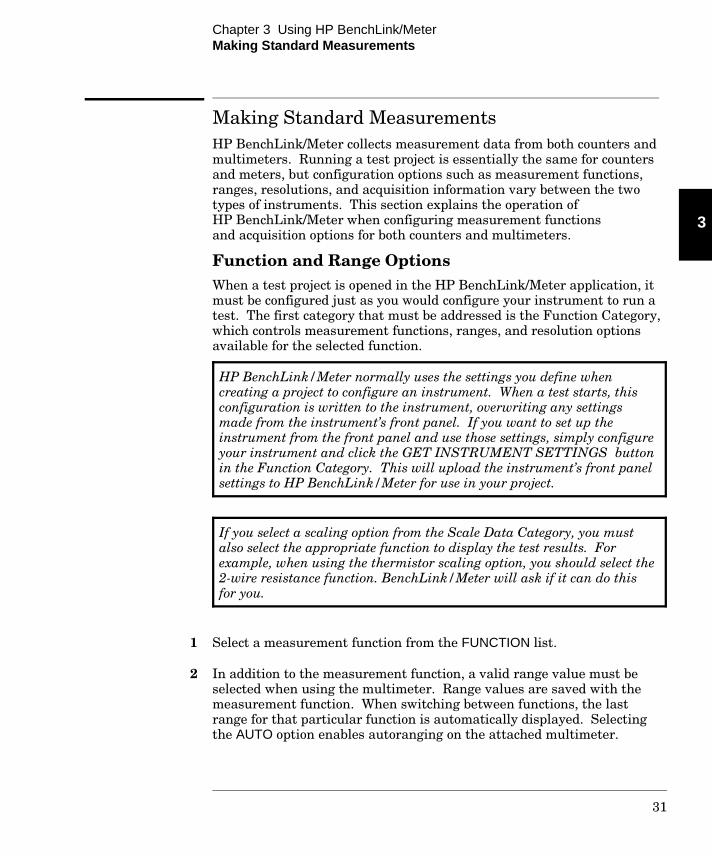
Function and Range OptionsWhen a test project is opened in the HP BenchLink/Meter application, itmust be configured just as you would configure your instrument to run atest. The first category that must be addressed is the Function Category,which controls measurement functions, ranges, and resolution optionsavailable for the selected function.
HP BenchLink/Meter normally uses the settings you define whencreating a project to configure an instrument. When a test starts, thisconfiguration is written to the instrument, overwriting any settingsmade from the instrument’s front panel. If you want to set up theinstrument from the front panel and use those settings, simply configureyour instrument and click the GET INSTRUMENT SETTINGS buttonin the Function Category. This will upload the instrument’s front panelsettings to HP BenchLink/Meter for use in your project.
If you select a scaling option from the Scale Data Category, you mustalso select the appropriate function to display the test results. Forexample, when using the thermistor scaling option, you should select the2-wire resistance function. BenchLink/Meter will ask if it can do thisfor you.
1 Select a measurement function from the FUNCTION list.
2 In addition to the measurement function, a valid range value must beselected when using the multimeter. Range values are saved with themeasurement function. When switching between functions, the lastrange for that particular function is automatically displayed. Selectingthe AUTO option enables autoranging on the attached multimeter.
3
Chapter 3 Using HP BenchLink/MeterMaking Standard Measurements
31

Click the FUNCTION DETAILS... button to display additional details andoptions for the selected function. Counter details include channel ortrigger setup, input impedance, and coupling options. For measurementsthat use two channels, you must select a start source for configuration,then select the stop source for configuration.
Measurement functions and ranges for the HP 34401A Multimeter include:
Function Range
DC Voltage AUTO, 0.1, 1.0, 10.0, 100.0, 1000.0
AC Voltage AUTO, 0.1, 1.0, 10.0, 100.0, 750.0
Resistance (2-wire) AUTO, 100, 1K, 10K, 100K, 1M, 10M, 100M
Resistance (4-wire) AUTO, 100, 1K, 10K, 100K, 1M, 10M, 100M
DC Current AUTO, 0.01, 0.1, 1.0, 3.0
AC Current AUTO, 1.0, 3.0
DC:DC Ratio AUTO, 0.1, 1.0, 10.0, 100.0, 1000.0
Frequency AUTO
Period AUTO
Measurement functions for the HP 53131/2A Universal or HP 53181A RF Counters include some or all of the following:
Functions
Frequency Frequency Ratio 1,2
Period Phase 1,2 2
Risetime 2 Period 2
Falltime 2 Frequency 2
Positive Width 2 Period 3 1, 2
Negative Width 2 Frequency 3 1
Duty Cycle 2 Frequency Ratio (1 to 3) 1
Totalize 2 Frequency Ratio (3 to 1) 3
Time Interval 1,2 2 Frequency Ratio (2 to 1) 3
1 Channel 3 is an option for the HP 53131/2A Universal Counters.2 These options are not available for the HP 53181 RF Counter.3 These options are available for the HP 53131/2A Counters with the latest firmware revision.
3
Chapter 3 Using HP BenchLink/MeterMaking Standard Measurements
32

Resolution OptionsResolution options are also selected in the Function Category. HP BenchLink/Meter’s resolution options contain more than just thenumber of digits resolution to be used. This area also includes otherinformation such as autozero or automatic interpolation mode andenabling/disabling the instrument’s front panel display. When you areusing one of the counters, you can define resolution in terms of gate timeor digits of resolution. Default buttons for speed and accuracy areprovided to automatically select the fastest or most accurate acquisitionof measurement data.
1 Select resolution options for the attached instrument.
Resolution options for the multimeter include:
• Autozero Off - enables/disables autozero mode on the attachedmultimeter. Autozero mode is off when this check box is checked.
• Instrument Display Off - enables/disables the multimeter’s frontpanel display when running a test. Instrument display is disabledwhen this check box is checked. Acquisition of measurement data isfaster when the instrument display is disabled.
• Digits - selects number of digits resolution (and integration time)used by the multimeter. Select one of the following options from thedrop-down list:
DIGITS INTEGRATION TIME (number of power line cycles -
NPLC’s)
4 Fast .02 PLC
5 Fast .2 PLC
5 Slow 1 PLC
6 Fast 10 PLC
6 Slow 100 PLC
Resolution options for the counters include:
• Gate Setup - selecting the Stop Source helps determine theresolution of your measurement. AUTO provides the fastest possiblemeasurements. TIME lets you define resolution by setting thecounter’s gate time. DIGITS lets you directly set the digits ofresolution you want.
3
Chapter 3 Using HP BenchLink/MeterMaking Standard Measurements
33

• Instrument Display Off - enable/disable the counter’s front-paneldisplay when running a test. Acquisition of measurement data isfaster when the instrument display is disabled.
• Set Expected Range After First Reading - This option instructs thecounter to look at its first reading and estimate the frequency rangefrom that reading. Selecting this option increases accuracy at theexpense of a slower first reading.
• Disable Automatic Interpolator Calibration - the automaticinterpolator helps maintain frequency accuracy for precisemeasurements. Disabling allows faster measurements at theexpense of a small amount of accuracy.
• Choosing the "Speed" default setting for the counters also changesthe triggering function from AUTO to ABSOLUTE. AUTO triggeringmode tells the counter to check trigger levels and adjust them ifneeded to a new level. The ABSOLUTE setting gives the counter adefined voltage to trigger on, and you may need to set this triggervoltage for correct triggering on your circuit. Since the counter doesnot examine the incoming signal in ABSOLUTE mode, this mode ismuch faster.
Acquisition OptionsAfter the Function Category has been configured, the AcquisitionCategory information should be selected. This category containsinformation on triggering, the total number of readings to be taken, andthe option to delay the start time of the test. The length of the test canbe specified in time duration or as a total number of readings.
1 Select triggering options:
Triggering for a multimeter or gate arming for a counter can beperformed by the HP BenchLink/Meter application or by a sourceexternal to the instrument. The interval between software triggers (orgates) can also be specified.
Other trigger options for the multimeter include trigger delay (up to 3600seconds), and multiple readings per trigger (1 to 512). Multiple readingscan also be averaged into one reading for each trigger.
3
Chapter 3 Using HP BenchLink/MeterMaking Standard Measurements
34

2 Select readings or duration options:
To configure the test length according to total number of readings to beacquired, click the READINGS button and type a number in the text box.The number of readings in a test is limited to 10 million. This number maybe further limited by the amount of disk space available on your PC. Beforethe test is started, HP BenchLink/Meter will approximate the spacerequired to run the test and verify that enough disk space is available. If aconflict is detected, a warning message will be displayed indicating thepotential problem. HP BenchLink/Meter then estimates the duration of thetest and displays it in the DURATION text boxes in hours, minutes, andseconds.
Duration. To configure the test length in time duration, you must clickthe DURATION button and type the desired numbers in the days, hours,and/or minutes text boxes. HP BenchLink/Meter then estimates the totalnumber of readings to acquire and displays it in the READINGS text box.
Timed Start. Test projects in HP BenchLink/Meter can be configured touse a delayed start time (up to 24 hours). The clock used for the starttime of the test is the PC clock time displayed in the right corner of theStatus Bar. HP BenchLink/Meter uses the time format currentlyselected for your PC (12 or 24 hours). A start time may be selected fromthe TIMED START drop-down list, or you may type a time in the textbox. The time format must be the same as the format displayed in theStatus Bar. After selecting a time from the drop-down list or enteringthe time you wish the test to start, you must click the Run icon or selectTest | Run from the Menu Bar to activate the timed start option. TheRun icon remains depressed and the countdown to the delayed start timeis displayed in the Status Bar. The timed start option can be canceled atany time by clicking the Stop icon or by selecting Test | Stop from theMenu Bar.
If you are working in other applications while running a test, there is apossibility that some readings may not be acquired. This situationoccurs when the PC’s CPU is busy with other operations andcommunications with the attached instrument is delayed.
3
Chapter 3 Using HP BenchLink/MeterMaking Standard Measurements
35
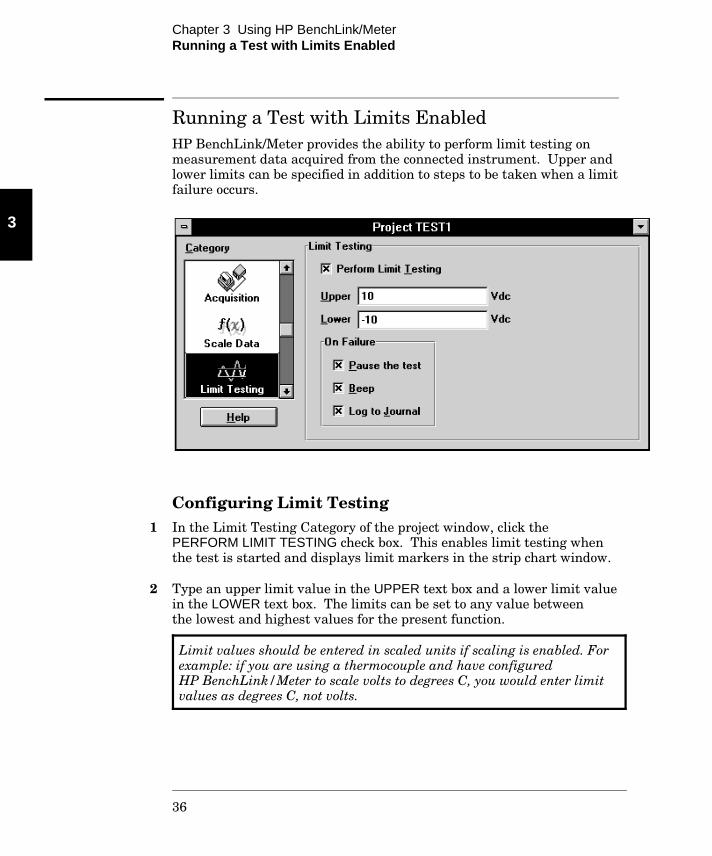
Running a Test with Limits EnabledHP BenchLink/Meter provides the ability to perform limit testing onmeasurement data acquired from the connected instrument. Upper andlower limits can be specified in addition to steps to be taken when a limitfailure occurs.
Configuring Limit Testing1 In the Limit Testing Category of the project window, click the
PERFORM LIMIT TESTING check box. This enables limit testing whenthe test is started and displays limit markers in the strip chart window.
2 Type an upper limit value in the UPPER text box and a lower limit valuein the LOWER text box. The limits can be set to any value between the lowest and highest values for the present function.
Limit values should be entered in scaled units if scaling is enabled. Forexample: if you are using a thermocouple and have configured HP BenchLink/Meter to scale volts to degrees C, you would enter limitvalues as degrees C, not volts.
3
Chapter 3 Using HP BenchLink/MeterRunning a Test with Limits Enabled
36

3 Choose an option to be performed upon failure of the limit test.Any combination or all of the options may be selected for limit testing.The options are:
• PAUSE THE TEST - pauses the test, displays a warning dialog,and updates the Status Bar test condition when a limit failurehas been detected. The test can be resumed by clicking OK inthe dialog box, and clicking the Pause/Resume icon (or selectTest | Pause/Resume from the Menu Bar).
If you select this option with multiple readings per trigger, HP BenchLink/Meter will pause the test immediately after the limitfailure. If there were more readings to be taken for the current trigger,those readings will not be captured or displayed.
• BEEP - causes your PC to beep each time a limit failure has beendetected. The test will continue to run if this is the only optionselected.
• LOG TO JOURNAL - an entry will be recorded in the journal toindicate the type of failure, the time it occurred, and the reading thatfailed. A maximum of 50 failures are logged, but this default can bechanged. See the READBLM.WRI file for instructions to change thisparameter.
4 HP BenchLink/Meter is now ready to perform limit testing on the dataacquired from your connected instrument. The failure options you haveselected will be implemented when you start the test.
HP BenchLink/Meter allows you to change limit values while a test ispaused, but statistics for the data continue to accumulate. Failuresafter the new limit values have been specified will be combined withprevious failures. Limit failure statistics are available through thestatistics window.
3
Chapter 3 Using HP BenchLink/MeterRunning a Test with Limits Enabled
37

Using the BenchLink/Launch ProgramHP BenchLink/Meter provides the capability to launch another softwareapplication when a limit test failure or other selected criteria occurs.This is accomplished by running the BenchLink/Launch application,which is installed as an icon in your BenchLink program group. Thisprogram is installed as an option during HP BenchLink/Meter’sinstallation.
The launch program relies on status messages sent from HP BenchLink/Meter to start your selected application. When the launchprogram detects a selected criteria status message, it sets the state forthat criteria item, and executes the application. The application can beeither a DOS or Windows application, but must have an EXE, BAT, orCOM file extension. After a status message has been detected, thatcriteria item will remain in that state until the launch program isstopped and started again (or the criteria item status is reset). Forexample: after a high limit failure has been detected and the selectedapplication launched, the state for high limit failure remains the sameuntil the launch program is terminated and run again. If you are using astopped test as the launch criteria, the stopped test state is reset whenthe test in HP BenchLink/Meter is restarted.
If you wish to start the selected program upon a limit failure, limittesting must be enabled in HP BenchLink/Meter before running thelaunch program. You do not have to enable limit testing if you wish tolaunch a program based on other non-limit criteria.
1 To start the launch program, double-click the BenchLink/Launch icon.The following application box is displayed. This box can be minimized orleft open and placed by the HP BenchLink/Meter screen.
3
Chapter 3 Using HP BenchLink/MeterUsing the BenchLink/Launch Program
38

2 Select Edit | Launch Options... from the Menu Bar to display theLaunch Options dialog box. From this dialog you can select theapplication you wish to start and choose the applicable launch criteria.Type the path and filename of the application in thePROGRAM TO LAUNCH text box. Click the check box(es) of theapplicable criteria and click the OK button when you are finished.
The launch program is now ready to start the selected application upon alimit failure or other selected criteria in HP BenchLink/Meter. Thecurrent status is displayed in the application box.
Included with the launch program is the source code for the executable,written in Microsoft’s Visual C++. The files are located in the\bench\launch directory (assuming the default bench directory wasused). The source code is provided in the event you would like to modifythe operation of the program on your own.
3
Chapter 3 Using HP BenchLink/MeterUsing the BenchLink/Launch Program
39
Using HP BenchLink/Meter to Scale DataHP BenchLink/Meter provides three methods to scale the measurementdata in the strip chart window: linear, lookup tables, and equationlibraries. Scaling must be chosen before the test is started and data iscollected.
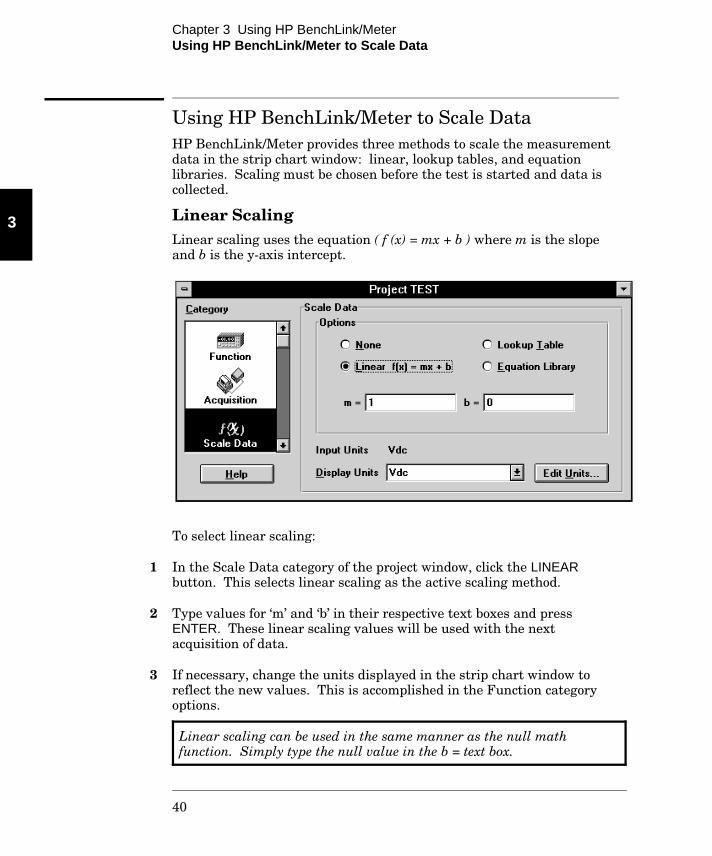
Linear ScalingLinear scaling uses the equation ( f (x) = mx + b ) where m is the slopeand b is the y-axis intercept.
To select linear scaling:
1 In the Scale Data category of the project window, click the LINEARbutton. This selects linear scaling as the active scaling method.
2 Type values for ‘m’ and ‘b’ in their respective text boxes and pressENTER. These linear scaling values will be used with the nextacquisition of data.
3 If necessary, change the units displayed in the strip chart window toreflect the new values. This is accomplished in the Function categoryoptions.
Linear scaling can be used in the same manner as the null mathfunction. Simply type the null value in the b = text box.
3
Chapter 3 Using HP BenchLink/MeterUsing HP BenchLink/Meter to Scale Data
40

Lookup TablesLookup tables are similar to the linear scaling method. This spreadsheet type oftable contains two columns - the first for the input value and the second for theoutput value. HP BenchLink/Meter uses piecewise linear interpolation betweentwo lookup table values or the slope of last two data points for values outside thetable range. Files from applications such as Microsoft Excel in .CSV or .PRN fileformat can be used as lookup tables by saving them with a .TBL extension.
To select scaling with a lookup table:
1 In the Scale Data category of the project window, click the LOOKUPTABLE button. This selects lookup table scaling as the active scalingmethod for the measurement data.
2 Click the BROWSE... button to open an existing lookup table. A sample .TBLfile is included with your HP BenchLink/Meter application. If the desired fileis not listed in the FILE NAME box, you may select another directory or drive tosearch for the file. Click the OK button after selecting your file.
3
Chapter 3 Using HP BenchLink/MeterUsing HP BenchLink/Meter to Scale Data
41

3 Click the EDIT... button to view and change values in the currentlyselected table. For every input value there must be an output valuespecified.
The following keys can be used for navigation within the scaling lookuptable:
Up Arrow Move to the cell above the active cellDown Arrow Move to the cell below the active cellRight Arrow Move to the cell to the right of the active cellLeft Arrow Move to the cell to the left of the active cellShift+Arrows Extend the cell selectionPgUp Move one page upPgDn Move one page downCtrl+PgUp Move one page to the leftCtrl+PgDn Move page to the rightHome Move to the first cell in the rowEnd Move to the last column that has data, staying
within the current rowCtrl+Home Move to row one, column oneCtrl+End Move to the last row and column that has dataTab Move to the next cell. The order is right, then downShift+Tab Move to the previous cell. The order is left, then upShift+Space Select the current row Ctrl+Space Select the current column Shift+Ctrl+Space Select the entire tableEnter Enters data in the active cellEsc Clears entered data from the active cell
4 When you have finished entering the input and output values for yourlookup table, click the OK button to close the table. The selected lookuptable scaling will be used when the next acquisition of data is performed.
Lookup table input values do not have to be entered in sorted ascendingor descending order; HP BenchLink/Meter will automatically sort thetable information and check for inconsistencies.
3
Chapter 3 Using HP BenchLink/MeterUsing HP BenchLink/Meter to Scale Data
42

Equation LibrariesThe third type of scaling used in HP BenchLink/Meter is the equationlibrary. Equation libraries consist of pre-determined equations to scalemeasurement data for thermocouples, thermistors, RTD’s (resistancetemperature detectors), and power (dBm).
To select equation library scaling:
1 In the Scale Data category of the project window, click the EQUATION LIBRARY button. Select your choice from the drop-down listby clicking on it. Each scale equation is intended to be used with aparticular type of measurement. HP BenchLink/Meter will check theselected measurement type and prompt you to change if the selectedequation does not match the selected measurement.
2 Click the DETAILS... button to display options for the selected equation.
The power scaling option can be used in the same manner as the dBmmath function from the multimeter.
3
Chapter 3 Using HP BenchLink/MeterUsing HP BenchLink/Meter to Scale Data
43

Printing Windows and MeasurementsThe strip chart, histogram, and analysis windows can be printed whenactively displayed in HP BenchLink/Meter. Journal and statistics windowdata can be copied to the Clipboard and printed from other applications.Measurements exported as time or reading number/measurement value files(.CSV or .PRN) can also be opened and printed by other applications.
Printing Strip Chart, Histogram, or Analysis Windows1 Click on the strip chart, histogram, or analysis window to make it the
active window.
2 Select File | Print from the Menu Bar or click the Print icon. The activewindow is automatically printed.
Printer information such as default printer, orientation, and paper sizecan be selected in the File | Print Setup... dialog box.
Printing Journal or Statistics Window InformationFrom Other ApplicationsInformation in the journal or the statistics window can be copied to theClipboard and pasted into other applications for printing.
Journal
1 Select the information in the journal by highlighting the informationwith your mouse (click and drag). If you wish to print the entire contentsof the journal do not select anything.
2 Click the COPY button at the bottom of the journal options box.This copies the selected data (or all of it) to the Clipboard as text.
3 Open the destination application (such as Microsoft Word or Write) andselect Edit | Paste from the Menu Bar.
The information is now available to save as a file or print. Consult yourapplication’s documentation for instructions on how to save or print thedata.
3
Chapter 3 Using HP BenchLink/MeterPrinting Windows and Measurements
44

Statistics Window
1 Click the statistics window to make it the active window in HP BenchLink/Meter.
2 Copy the information to the Clipboard by selecting Edit | Copy from theMenu Bar. The data is copied in text format.
3 Open the destination application (such as Microsoft Word or Write) andselect Edit | Paste from the Menu Bar.
The information is now available to save as a file or print. Consult yourapplication’s documentation for instructions on how to save or print the data.
Saving Project InformationInformation from the project window, strip chart data, and the location andsizes of open windows are saved as parts of the HP BenchLink/Meterproject. Three files make up the project; .PRJ is the main project file, .TSTcontains the test definition and desktop information, and the .DAT filecontains the data. This desktop information will remain with the projectwhen it is closed and reopened at a later date. The analysis window is notsaved as part of the desktop because of its temporary nature.
Measurement data in the current project can be exported as time orreading number/measurement value files (.CSV or .PRN). These ASCIIdata files can be imported into an open HP BenchLink/Meter analysiswindow or imported into other applications such as Microsoft Excel,Microsoft Word, or Mathcad.
Saving the Project as a .PRJ FileIf you have opened a new or previously saved project in HP BenchLink/Meter, any new information can be saved by selectingFile | Save Project from the Menu Bar or by clicking the Save icon.The .PRJ file created from the open project can be opened and modified ata later date.
3
Chapter 3 Using HP BenchLink/MeterSaving Project Information
45

Saving Measurement Data as .CSV or .PRN FilesThe measurement data will be saved as two columns of data separated bycommas or tabs. The first column is time, which includes the date andtime the measurement was acquired. The second column displays themeasurement value. The data in the strip chart or analysis window canbe saved (exported) in a .CSV or .PRN file format with the following steps:
1 With the data displayed in the active strip chart or analysis window,select File | Export Data... from the Menu Bar. The Export StripChart Data dialog box will be displayed.
2 Select the desired file format type by clicking on the SAVE FILE AS TYPEdrop-down list and click on your choice of .CSV or .PRN.
3 Enter the desired filename and click the OK button to save the file.
Data exported from the analysis window contains two columns:date/time and measurement value.
3
Chapter 3 Using HP BenchLink/MeterSaving Project Information
46

Using HP BenchLink/Meter HelpHP BenchLink/Meter provides an extensive, easy-to-use,context-sensitive help system. Help is available to guide you through theuse of dialog boxes and to explain the function of menu commands.
HP BenchLink/Meter help is accessed by selecting Help | Index fromthe Menu Bar. Choosing this command will display a list of key topicsand allow you to perform a search of help topics or allow you to jump toothers. Jump topics are green, underlined words found in various areasof the help system.
The Help Search menu can also be displayed by selecting Help | Search... from the Menu Bar.
To obtain help on specific menu commands or icons, first select the Helpicon from the Toolbar, then move the help cursor to the desired menucommand or icon and click. The information for that topic is displayed.
Many of the dialog boxes contain a HELP button. This button provideson-line help for the options in the dialog box. Help can also be obtainedby pressing the F1 key at any time.
If you are new to Help systems and would like a quick, easy-to-usetutorial, select Help | Using Help from the Menu Bar. This is a usefulguide to using the Help system written by Microsoft Corporation.
3
Chapter 3 Using HP BenchLink/MeterUsing HP BenchLink/Meter Help
47

Configuring the InterfaceWhen the HP BenchLink/Meter application is started, it searches for anysupported IEEE-488 interface hardware and software installed in yourPC and any instruments connected to the interface. If no IEEE-488interface card with connected devices is found, HP BenchLink/Meterchecks the serial ports for any devices.
HP BenchLink/Meter will try to connect to a multimeter using HP-IB ataddress 22 or on serial port COM2 at 9600 baud. If any of these defaultsettings do not match the actual interfaces or devices, selectOptions | Configure Interface... to display the Configure Interfacedialog box. This dialog contains information relating to the interface typeand any devices connected to your PC.
Select the interface type by clicking the arrow of the INTERFACEdrop-down list and clicking on your choice. The controller address orserial port displayed is the IEEE-488 controller address or serial portthat HP BenchLink/Meter will use to communicate with your multimeteror counter. Only IEEE-488 interface cards that have been detected inyour PC will be displayed.
If you are using an IEEE-488 interface card, ensure you have correctlyinstalled the interface software before running HP BenchLink/Meter.Either an HPIB.DLL or GPIB.DLL file must be located in your HPBenchLink/Meter directory, the Windows directory, or a directoryincluded in the PATH command in your AUTOEXEC.BAT file (If youare using the HP 82341 HP-IB card, you must have the SICL16.DLLand SICLUT16.DLL files in your Windows directory.) For specificdetails, refer to your IEEE-488 interface card installation guide.
3
Chapter 3 Using HP BenchLink/MeterConfiguring the Interface
48

The RS-232 Settings... option is for RS-232 use with the multimeter onlyand is also grayed out when IEEE-488 interface cards are selected. TheRS-232 Settings dialog displays serial port (COM2), baud rate (9600), andparity (even: 7-bits) parameters.
Devices found by HP BenchLink/Meter are displayed in theINSTRUMENT(S) list box according to the selected available interface.Select the multimeter or counter by highlighting the choice. If you areusing RS-232 (multimeter only), the address refers to the serial port it isattached to.
The SEARCH button is used to initiate a search for all instrumentsattached via HP-IB cables or a single multimeter attached to the COMport identified in the Settings dialog box. All identified instruments willbe displayed in the INSTRUMENT(S) list of the Configure Interface dialogbox.
Choose OK to accept changes to the Configure Interface dialog box orCANCEL to abort. Changes made in the Configure Interface dialog boxwill be used as the default settings the next time you run HP BenchLink/Meter.
3
Chapter 3 Using HP BenchLink/MeterConfiguring the Interface
49

Configuring Your InstrumentHP 34401A MultimeterHP BenchLink/Meter supports both RS-232 and IEEE-488communications from the PC to the HP 34401A Multimeter. This sectiondescribes how to setup your multimeter so that communications can beestablished when you run HP BenchLink/Meter.
Shift
Menu On/Off 1 Turn on the Multimeter menu.
A: MEAS MENU
< < 2 Move across to the I/O Menu.
E: I/O MENU
∨ > 3 Move down and across to the Interface command.
2: INTERFACE
∨ 4 Move down to select HP-IB or RS-232 interface parameters. If choosingRS-232, you must also check the baud rate and parity commands in theI/O Menu. The baud rate default is 9600; the parity default is even with7 data bits.
Enter 5 Save the changes. For more information on accessing these menus, seeyour multimeter’s user’s guide.
HP 53131A/53132A/53181A CountersHP BenchLink/Meter supports only IEEE-488 communications from thePC to the HP 53131/2A Universal Counters or the HP 53181A RFCounter. No interface configuration is needed for these instruments,except to ensure that, if multiple instruments are connected to the bus,each instrument has its own unique HP-IB address.
3
Chapter 3 Using HP BenchLink/MeterConfiguring Your Instrument
50

4
Feature and Function Reference
4

HP BenchLink/Meter Screen ComponentsA typical HP BenchLink/Meter screen is shown on page 16.
Title BarIn the Title Bar, HP BenchLink/Meter displays HP 34812ABenchLink/Meter and the name of the open project file.
Menu BarThe Menu Bar offers the following pull-down menus:
• File Menu - contains commands for opening/importing, closing,saving/exporting, and printing project windows.
• Edit Menu - contains commands for copying data to the Clipboardand pasting data into and deleting data from the analysis window.
• View Menu - contains commands for viewing various options in thestrip chart, histogram, and analysis windows.
• Test Menu - contains commands for running, pausing/resuming,and stopping the acquisition of measurement data, and for clearingthe data from a previous test.
• Options Menu - contains a command to configure thePC-to-instrument interface.
• Window Menu - contains commands for standard Windowsoperations such as cascade, tile, and arrange icons. Also containscommands to enable/disable the viewing of the Toolbar, Status Bar,project window, strip chart, histogram, readout, statistics, andanalysis windows.
• Help Menu - contains commands for the HP BenchLink/Meter Helpsystem including an index, search capability, a help system tutorial,and information about the HP BenchLink/Meter application.
The menus in HP BenchLink/Meter vary depending upon the view orwindow that is currently active.
4
Chapter 4 Feature and Function ReferenceHP BenchLink/Meter Screen Components
52

ToolbarThe Toolbar contains icons for quick display of dialog boxes and rapidexecution of HP BenchLink/Meter commands. The following icons aredisplayed in the Toolbar:
Performs the File | New Project... command.
Performs the File | Open Project... command.
Performs the File | Save Project command.
The Instrument drop-down list displays the model number of all devicesfound on the IEEE-488 bus or serial port. It can also be used to changeinstrument connections. If another BenchLink application is installedand a supported instrument is selected from this list, HP BenchLink/Meter will attempt to switch to that application and, ifnecessary, load and start the application. Instruments not supported byBenchLink software will display the device’s model number and address.Devices that are not compatible with the IEEE-488.2 standard will bedisplayed as UNKNOWN with their address. Attempts to switch tonon-supported or unknown devices will display a warning dialog.
Performs the Edit | Copy command.
Performs the Edit | Paste command. (Available for the analysis window only.)
Performs the File | Print command.
Performs the Window | Project command.
Performs the Window | Strip Chart command.
Performs the Window | Histogram command.
Performs the Window | Readout command.
Performs the Window | Statistics command.
Performs the Window | Analysis command.
Performs the Test | Run command.
4
Chapter 4 Feature and Function ReferenceHP BenchLink/Meter Screen Components
53

Performs the Test | Pause/Resume command.
Performs the Test | Stop command.
Provides context-sensitive help for selected items.
Status BarThe Status Bar is a helpful tool designed to provide brief descriptions ofthe Menu Bar and Toolbar items currently selected and also providesspecific measurement data information. It appears at the bottom of theHP BenchLink/Meter screen and dynamically changes as the variousmenu commands or icons are selected.
menu command information test status reading % test currentnumber complete time
The Status Bar is separated into 5 different sections:
• menu command information - displays description of the selectedmenu item or other information including the status of limit testing.
• test status - reflects the current status of the test (running, paused,stopped, countdown to a future start time, etc.)
• reading number - reflects the total number of readings received.
• % test complete - displays the percentage of the test that has beencompleted.
• current time - displays the current time.
4
Chapter 4 Feature and Function ReferenceHP BenchLink/Meter Screen Components
54

Project Window
The project window contains five categories for test configuration. Eachof the categories, when selected, displays individual characteristics andoptions on the right side of the window. Categories can be selected byclicking the appropriate icon or by typing the first letter of the categorywhen this section of the project window is active.
The project window also displays a button for category help. Helpinformation on the selected category will be displayed when this button isclicked.
The following categories are available in the project window:
Function. The Function Category contains information about themeasurement function, range, and resolution options. Current functionand range settings can be queried from the attached multimeter orcounter by clicking the GET INSTRUMENT SETTINGS button. This isuseful if you have configured your instrument function and would like HP BenchLink/Meter to use those settings.
Click the FUNCTION DETAILS... button to display additional details forthe selected function. Resolution options are displayed by clicking theRESOLUTION DETAILS... button. For more information regardingfunctions, see Making Standard Measurements in Chapter 3.
4
Chapter 4 Feature and Function ReferenceHP BenchLink/Meter Screen Components
55

Acquisition. The Acquisition Category contains information about thetrigger, number of readings or duration of the test, and the ability tostart the test at a later time. The following options are displayed:
TRIGGER SOURCE - select a trigger from HP BenchLink/Meter or anexternal source.
COMPLETION CRITERIA - select the number of readings (limit of 10million or less depending upon your available disk space) or the durationof the test. When numbers are entered in one text box, HP BenchLink/Meter estimates the other.
TIMED START - provides the ability to start the test up to 24 hours later.
FIXED TRIGGER DELAY (multimeter only) - delay the trigger up to amaximum of 3600 seconds.
MULTIPLE READINGS/TRIGGER (multimeter only) - specify the numberof readings per trigger from 2 to 512.
AVERAGE READINGS (multimeter only) - average the readings for eachtrigger event.
4
Chapter 4 Feature and Function ReferenceHP BenchLink/Meter Screen Components
56

Scale Data. The Scale Data Category contains choices for scaling themeasurement data when it is acquired in the strip chart window.Available choices are: none, linear scaling (f (x)=mx+b where m is theslope and b is the y-intercept), lookup table, and equation library(contains thermocouples, thermistors, RTD’s, and power (dBm)).
The units displayed in the open windows are selected by clicking theDISPLAY UNITS drop-down list. Units can be added to the list by clickingthe EDIT UNITS... button.
The Scale Data Category can be used to perform null and dBm functionsin HP BenchLink/Meter similar to the math functions used in themultimeter. Use linear scaling for the null math function and power(dBm) scaling for the dBm math function. 4
Chapter 4 Feature and Function ReferenceHP BenchLink/Meter Screen Components
57

Limit Testing. The Limit Testing Category provides the capability toperform limit testing, set upper and lower limits, and select optionalevents when a failure occurs.
Limit testing provides the following failure options:
• PAUSE THE TEST - pauses the test, displays a warning dialog, and updatesthe Status Bar test condition when a limit failure has been detected. Thetest can be resumed by clicking OK in the dialog box, and clicking thePause/Resume icon (or select Test | Pause/Resume from the Menu Bar).
If you select this option with multiple readings per trigger, HP BenchLink/Meter will pause the test immediately after the limitfailure. If there were more readings to be taken for the current trigger,those readings will not be captured or displayed.
• BEEP - causes your PC to beep each time a limit failure has beendetected. The test will continue to run if this is the only option selected.
• LOG TO JOURNAL - an entry will be recorded in the journal to indicatethe type of failure, the time it occurred, and the reading that failed. Amaximum of 50 failures are logged, but this default can be changed.See the READBLM.WRI file for instructions to change this parameter.
HP BenchLink/Meter is now ready to perform limit testing on the dataacquired from your connected instrument. The failure options you haveselected will be implemented when you start the test.
HP BenchLink/Meter allows you to change limit values while a test ispaused, but statistics for the data continue to accumulate. Failures after thenew limit values have been specified will be combined with previous failures.Limit failure statistics are available through the statistics window.
4
Chapter 4 Feature and Function ReferenceHP BenchLink/Meter Screen Components
58

Journal. This category displays a journal in which automatic entriesare made when the test is started, paused, resumed, stopped, a change tothe upper or lower limits, or a limit failure occurs. Once 50 limit failureshave been logged, a log entry will indicate that too many limit failureshave occurred. This is done to prevent the journal from filling up withlimit failures.
Manual entries may be made by clicking the ADD ENTRY... button andare allowed a maximum of 1,000 characters per entry. Manual entriesalso contain the date and time the information was logged in the journal.
The journal may contain a maximum of 30,000 characters. After thismaximum has been reached, no further entries will be recorded.
CAUTION The journal entries are permanently erased when thecurrent test has been stopped and a new test is restarted.
Information from the journal may be copied to the Clipboard and pasted intoother applications for printing and file saving purposes by clicking the COPYbutton. This button will copy any selected text, or if no text is selected, theentire contents will be copied. If you wish to delete text from the journal,select the text by clicking and dragging your mouse, then click the CUTbutton. The UNDO button will undo the cut command only.
4
Chapter 4 Feature and Function ReferenceHP BenchLink/Meter Screen Components
59
Strip Chart Window
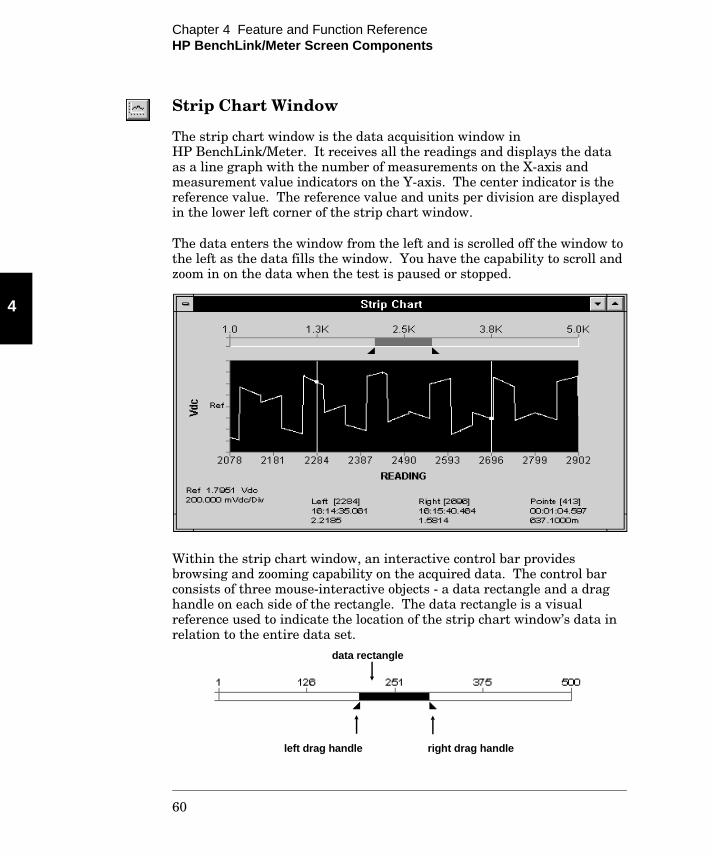
The strip chart window is the data acquisition window in HP BenchLink/Meter. It receives all the readings and displays the dataas a line graph with the number of measurements on the X-axis andmeasurement value indicators on the Y-axis. The center indicator is thereference value. The reference value and units per division are displayedin the lower left corner of the strip chart window.
The data enters the window from the left and is scrolled off the window tothe left as the data fills the window. You have the capability to scroll andzoom in on the data when the test is paused or stopped.
Within the strip chart window, an interactive control bar providesbrowsing and zooming capability on the acquired data. The control barconsists of three mouse-interactive objects - a data rectangle and a draghandle on each side of the rectangle. The data rectangle is a visualreference used to indicate the location of the strip chart window’s data inrelation to the entire data set.
data rectangle
left drag handle right drag handle
4
Chapter 4 Feature and Function ReferenceHP BenchLink/Meter Screen Components
60

Browsing and/or paging is accomplished by clicking and dragging therectangle or using the PAGE UP, PAGE DOWN, END, and HOME keys onyour keyboard. You can zoom in and out of the data by using a click anddrag motion on either drag handle. Moving a drag handle changes thenumber of readings viewed in the window, effectively changing the X-axisscale.
Vertical markers in the strip chart window are used to select datareadings. Select View | Markers from the Menu Bar or press Ctrl+M toenable vertical markers in the strip chart window. The time locations anddata values of the markers and the difference between them aredisplayed at the bottom of the strip chart window. The markers can bemoved by clicking and dragging them with your mouse, or by using theleft/right arrow keys on your keyboard when you have selected a marker.For exact marker placement, select View | Modify Parameters... fromthe Menu Bar to display the Chart Parameters dialog box, then type thereading numbers in the POSITION MARKERS text boxes.
Data between the markers is copied to the Clipboard when theEdit | Copy command is selected. This data can then be pasted into the analysiswindow.
The specific behavior of the strip chart window depends on the state of atest. When a test is running, data is placed in the window from left to rightwith the rightmost data being the most current. As data is acquired, thecontrol bar objects (data rectangle and drag handles) show the progress ofthe test and their current position relative to the entire test. When a test ispaused, the control bar rescales itself and repositions the rectangle and draghandles to reflect the current number of measurements and the relativeposition within the data. For example, if a user is running a 5000 readingtest and decides to pause after half the data has been collected, the controlbar will scale the X-axis to 2500 and position the rectangle and drag handlesat the end so the user is viewing the most current page of data. In pausemode, users are allowed to zoom and browse the acquired data. After a testis resumed, the control bar will normalize back to the pre-paused state,showing the progress of the test.
Selecting the View | Zoom To Fit command for the strip chart window,when a test is running, calculates the reference value (the center of theminimum and maximum values) from all acquired data, then calculatesthe units per division in a 1-2-5 sequence. The reference value isdisplayed in the center of the window. When the test has been paused orstopped, the zoom to fit command calculates the reference value andunits per division from only the data displayed in the window.
4
Chapter 4 Feature and Function ReferenceHP BenchLink/Meter Screen Components
61

Upon completion of the test the control bar stops incrementing and goesinto the zoom and browse mode of operation. The strip chart window candisplay a maximum of 16,000 readings.
Select View | Modify Parameters... from the Menu Bar or pressAlt+Enter to display strip chart window parameters. The ChartParameters dialog box provides the following capabilities:
• Specify the first reading to be displayed
• Specify the number of readings to be displayed (maximum of 16,000)
• Enable/disable vertical markers and define their positions
• Enable/disable the grid
• Change the reference value
• Change the units per division value
4
Chapter 4 Feature and Function ReferenceHP BenchLink/Meter Screen Components
62
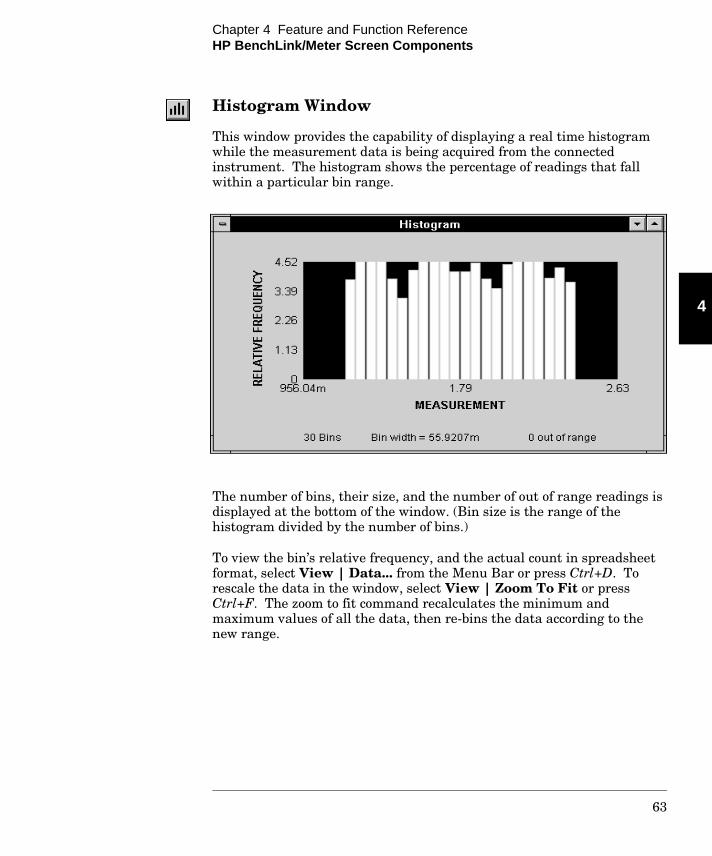
Histogram Window
This window provides the capability of displaying a real time histogramwhile the measurement data is being acquired from the connectedinstrument. The histogram shows the percentage of readings that fallwithin a particular bin range.
The number of bins, their size, and the number of out of range readings isdisplayed at the bottom of the window. (Bin size is the range of thehistogram divided by the number of bins.)
To view the bin’s relative frequency, and the actual count in spreadsheetformat, select View | Data... from the Menu Bar or press Ctrl+D. Torescale the data in the window, select View | Zoom To Fit or pressCtrl+F. The zoom to fit command recalculates the minimum andmaximum values of all the data, then re-bins the data according to thenew range.
4
Chapter 4 Feature and Function ReferenceHP BenchLink/Meter Screen Components
63

Select View | Modify Parameters... from the Menu Bar or pressAlt+Enter to display histogram window parameters. The HistogramParameters dialog box provides the following capabilities:
• Change the number of bins
• Specify the maximum Y-axis value
• Specify the range of the histogram by changing X Min and X Max values
• Change the number of labels displayed on the X- and Y-axes
Readout Window
The instrument readout window displays the current measurement valuefrom the front panel of the connected instrument. This window can beresized, minimized, or moved anywhere in the HP BenchLink/Meterscreen. User-defined units are displayed when the data is using a scalingequation.
To select automatically adjusting units for the readout window, selectView | Auto Adjust Units from the Menu Bar. This will display unitssuch as 1KVdc instead of 1000 Vdc.
4
Chapter 4 Feature and Function ReferenceHP BenchLink/Meter Screen Components
64

Statistics Window
The statistics window allows you to display statistical information for the acquired measurement data. The statistics are calculatedsimultaneously during measurement acquisition from the attachedinstrument. Statistics information displayed includes:
• Total readings - total number of measurements currently in the stripchart window
• Overload - number of overload measurements acquired during thetest. (Overload conditions occur when the input signal is greaterthan the present range can measure.) Overload measurementsreceived from the multimeter or counter do not contain an actualvalue, so HP BenchLink/Meter calculates the value as an order ofmagnitude greater than the currently selected range. These valuesare not used in the calculation of statistical data, but they will bedisplayed in the test data.
• Units - type of measurement units
• Maximum - maximum measurement value in the acquired data
• Minimum - minimum measurement value in the acquired data
• Mean - average value of the total readings
• Standard deviation - amount of deviation from the mean value
• Upper limit - upper limit value specified for limit testing (if enabled)
• % above upper - percentage of measurements that exceeded theupper limit value
• Lower limit - lower limit value specified for limit testing (if enabled)
• % below lower - percentage of measurements that exceeded the lowerlimit value
4
Chapter 4 Feature and Function ReferenceHP BenchLink/Meter Screen Components
65

Statistics can be copied to the Clipboard as text information using theEdit | Copy command from the Menu Bar when the statistics window isthe active window.
Changing limit test values when a test is paused does not clear thestatistics already accumulated. The statistics will display a combinationof limit test failures from before and after the changes were made.
Analysis Window
The analysis window is a temporary workspace used to analyze datacopied from the strip chart window, import previously saved HP BenchLink/Meter .DAT files, or to import data saved from otherapplications in .CSV or .PRN file format. New data pasted (using theEdit | Paste command) or imported (File | Import Data...) into thiswindow is appended to the end of any existing data.
The bottom of the analysis window displays the reading number andvalue of the vertical markers, when they are enabled.
To view the actual reading number and data values in spreadsheetformat, select View | Data... from the Menu Bar or press Ctrl+D. To rescale the analysis window, select View | Zoom To Fit or pressCtrl+F. The zoom the fit command calculates the reference value (thecenter of the minimum and maximum values) from the data displayed inthe window, then calculates the units per division in a 1-2-5 sequence.The reference value is displayed in the center of the window.
4
Chapter 4 Feature and Function ReferenceHP BenchLink/Meter Screen Components
66

Select View | Modify Parameters... from the Menu Bar or pressAlt+Enter to display the analysis window parameters. The ChartParameters dialog box provides the following capabilities:
• Specify the first reading to be displayed
• Specify the number of readings to be displayed
• Enable/disable grid and number of lines
• Enable/disable vertical markers and define their positions
• Change the reference value
• Change the units per division value
Before the data is displayed in the analysis window, it is processedthrough the existing scaling algorithm and statistics are calculated.To view the statistics, select View | Statistics... from the Menu Bar orpress F7. A histogram of the data can also be displayed by selectingView | Histogram... from the Menu Bar or pressing F6.
The data in the window can be cleared by selecting Edit | Delete fromthe Menu Bar. This command deletes all of the data from the window.
This error message occurs when you have tried to copy more than 4000readings to the Clipboard. Use the vertical markers to decrease the selection oruse the analysis window and its contents are not saved as part of thedesktop workspace when the project is saved as a file. You must copythe window to the Clipboard as a graphic or export the data to anASCII .CSV or .PRN file if you wish to save the information.
4
Chapter 4 Feature and Function ReferenceHP BenchLink/Meter Screen Components
67
File DescriptionsHP BenchLink/Meter File FormatsHP BenchLink/Meter uses a variety of proprietary and common fileformats. The entire project can be saved as a .PRJ file with proprietarydata and test definition files included. Lookup tables can be created inother applications and saved for use in HP BenchLink/Meter.
.PRJ
This file extension is used to designate a binary project file. This file canbe reopened in HP BenchLink/Meter for later use. The project fileconsists of desktop window placement in addition to the two followingfiles:
.DAT - This file extension is used to designate binary test datasaved from the test.
.TST - This file extension is used to designate a test definition file.
.TBL
This file extension is used to designate an ASCII scaling lookup table.Custom lookup tables can be created in other applications such asMicrosoft Excel or Word as two-column files (such as raw value/scaledvalue pairs) and can be separated by either a tab or a comma. Columnsin excess of two will be ignored. The file must be saved with the .TBLextension for use in HP BenchLink/Meter.
Export Data File FormatsData can also be exported from HP BenchLink/Meter as .CSV or .PRNfiles for use in other applications.
.CSV
The comma-separated values file format includes date/time andmeasurement value for each reading in the test. Data exported from theanalysis window contains two columns: reading number andmeasurement value. The two columns are separated by a comma.
.PRN
The PRN file format includes date/time and measurement value for eachreading in the test. Data exported from the analysis window containstwo columns: reading number and measurement value.The two columns are separated by a tab.
4
Chapter 4 Feature and Function ReferenceFile Descriptions
68

5
Using With Other Applications
5

The HP BenchLink/Meter application can copy measurement data to theClipboard for use in other applications, export measurement data as.CSV or .PRN files, or import data saved from another application in.CSV or .PRN file format. It also can switch to other BenchLinkapplications by selecting another instrument from the Instrument list onthe Toolbar.
Copying Data to the ClipboardThe Edit | Copy command copies the active strip chart, histogram, oranalysis window to the Clipboard in a graphical Windows Metafileformat and as text. This graphic or text can be pasted into anotherapplication for annotation or display. The statistics window is copied astext only. When markers are displayed in the strip chart or analysiswindow, only the data between the markers (maximum 4000 readings) iscopied as text to the Clipboard, in addition to the graphical format.
Copying information from the journal requires that you use the COPYbutton located at the bottom of the journal. This button copies theselected text to the Clipboard. If no text is selected, the entire contents ofthe journal are copied.
1 Click on the desired window (strip chart, histogram, analysis, orstatistics) to make it the active window.
2 Click the Copy icon, select Edit | Copy from the Menu Bar, or typeCtrl+C. The selected window is copied to the Clipboard in a WindowsMetafile graphical format and/or as text). The maximum number ofreadings that can be copied as text is 4000.
3 Open the destination application and paste the graphic or text into it.Check your application’s user’s manual for instructions on pastinginformation from the Clipboard. In some applications, using the Edit | Paste Special... command will give you a choice of picture or text format.
In the strip chart window, the copy command copies data locatedbetween the vertical markers. This data can then be pasted into theanalysis window using the Edit | Paste command.
5
Chapter 5 Using With Other ApplicationsCopying Data to the Clipboard
70

Exporting Data as .CSV or .PRN FilesInformation may be exported from HP BenchLink/Meter incomma-separated value (.CSV) or tab separated (.PRN) file format.These files may be opened in other applications for display. Dataexported from the strip chart window contains two columns: date/timeand measurement value. Data exported from the analysis windowcontains two columns: reading number and measurement value.
1 Click on the strip chart or analysis window to make it the active window.(You must have measurement data in the window).
2 Select File | Export Data... from the Menu Bar or press Ctrl+E. TheExport Data dialog box will be displayed, prompting you to select afilename and type of format (.CSV or .PRN) in which to save the data.You may also change the drive and directory in which the file is saved.
3 After you have made your choices, click the OK button to export the dataor CANCEL to abort the process.
The data will be saved in the selected file format. This file can then beopened in another application such as Microsoft Word or Excel.
5
Chapter 5 Using With Other ApplicationsExporting Data as .CSV or .PRN Files
71

Importing Data to the Analysis WindowImporting .CSV or .PRN FilesData saved in time/measurement data value pair format from otherapplications such as Mathcad or Excel can be imported and appended toother measurement data in the analysis window. Data must be saved in the.CSV or .PRN format. To import the data file into the analysis window:
1 Click the analysis window to ensure it is the active window.
2 Select File | Import Data... from the Menu Bar. The Import AnalysisData dialog box will be displayed, prompting you to enter the name of thefile you wish to open.
Choose the appropriate file extension from the LIST FILES OF TYPE list,select the desired file, and click the OK button. If the file is displayed inthe FILE NAME list, double-click on it to open the file. Click the CANCELbutton to abort the command or the HELP button for more information.
4 The file information will be imported into the analysis window and scaledaccording to the previous scaling information. Units displayed in theanalysis window can be changed by selecting View | Scale... from theMenu Bar. The data can also be rescaled by selecting a scaling optionfrom this dialog box.
A histogram or statistics chart of the data may be displayed by selectingView | Histogram... or View | Statistics... from the Menu Bar.
5
Chapter 5 Using With Other ApplicationsImporting Data to the Analysis Window
72

Importing .DAT FilesMeasurement data from a previous HP BenchLink/Meter session isautomatically saved as a .DAT file when the project is saved. The .DATfiles may be imported into the analysis window:
1 Select File | Import Data... from the Menu Bar or press Ctrl+I. TheImport Analysis Data dialog box will be displayed, prompting you toenter the filename of the file you wish to open.
3 Choose the .DAT file extension from the LIST FILES OF TYPE list, selectthe desired file and click the OK button. If the file is displayed in theFILE NAME list, double-click it to open the file. Click the CANCEL buttonto abort the command or the HELP button for more information.
4 The file information will be imported into the analysis window and scaledaccording to the previous scaling information. Units displayed in theanalysis window can be changed by selecting View | Scale... from theMenu Bar. The data can also be rescaled by selecting a scaling optionfrom this dialog box.
A histogram or statistics chart of the data may be displayed by selectingView | Histogram... or View | Statistics... from the Menu Bar.
5
Chapter 5 Using With Other ApplicationsImporting Data to the Analysis Window
73

Starting Other BenchLink ApplicationsIEEE-488 Interface Only. If you select another instrument in theInstrument drop-down list, HP BenchLink/Meter will attempt to switchto a BenchLink application that supports the instrument chosen.For example, selecting an HP 54602A Oscilloscope will switch to the HP BenchLink/Scope application. If the application is not alreadyrunning, HP BenchLink/Meter will load the application. A warningdialog is displayed if the selected instrument is not supported or theapplication could not be found.
The BenchLink applications must be located in the current workingdirectory, the Windows directory, or a directory in the path section ofyour AUTOEXEC.BAT file.
5
Chapter 5 Using With Other ApplicationsStarting Other BenchLink Applications
74

6
Error and Information Messages
6
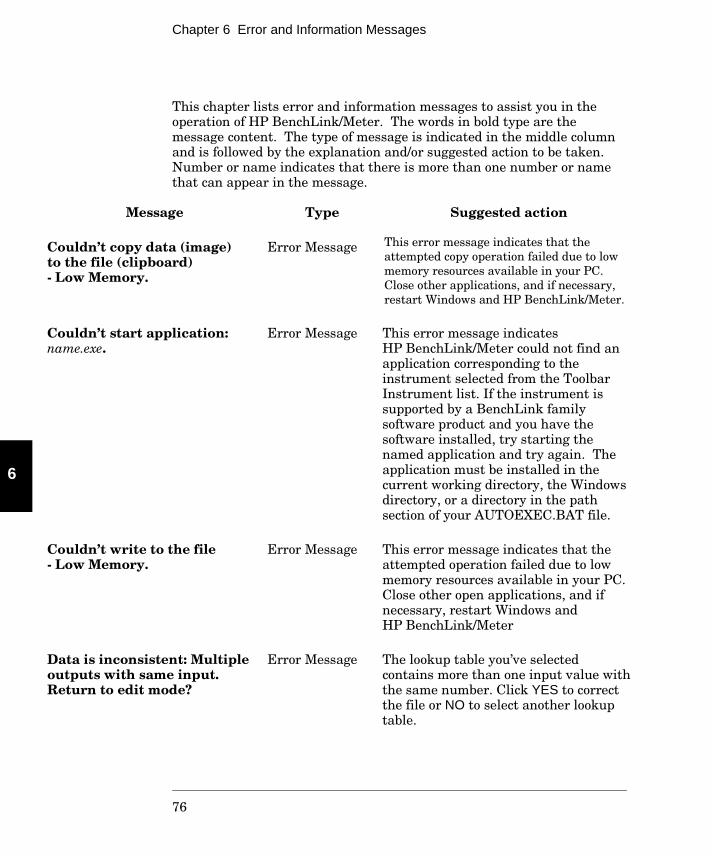
This chapter lists error and information messages to assist you in theoperation of HP BenchLink/Meter. The words in bold type are themessage content. The type of message is indicated in the middle columnand is followed by the explanation and/or suggested action to be taken.Number or name indicates that there is more than one number or namethat can appear in the message.
Message Type Suggested action
Couldn’t copy data (image)to the file (clipboard)- Low Memory.
Error Message This error message indicates that theattempted copy operation failed due to lowmemory resources available in your PC.Close other applications, and if necessary,restart Windows and HP BenchLink/Meter.
Couldn’t start application:name.exe.
Error Message This error message indicates HP BenchLink/Meter could not find anapplication corresponding to theinstrument selected from the ToolbarInstrument list. If the instrument issupported by a BenchLink familysoftware product and you have thesoftware installed, try starting thenamed application and try again. Theapplication must be installed in thecurrent working directory, the Windowsdirectory, or a directory in the pathsection of your AUTOEXEC.BAT file.
Couldn’t write to the file- Low Memory.
Error Message This error message indicates that theattempted operation failed due to lowmemory resources available in your PC.Close other open applications, and ifnecessary, restart Windows and HP BenchLink/Meter
Data is inconsistent: Multipleoutputs with same input.Return to edit mode?
Error Message The lookup table you’ve selectedcontains more than one input value withthe same number. Click YES to correctthe file or NO to select another lookuptable.
6
Chapter 6 Error and Information Messages
76

Message Type Suggested action
Details do not apply to thisfunction.
InformationMessage
This message indicates that there is nofurther information to be displayed forthe selected function.
Initialization is taking longerthan expected. This may bedue to a long gate time or amissing input signal.
InformationMessage
This message indicates that theattached counter is waiting for a gate oris not receiving an input signal. ClickOK to continue waiting for the gate, orstop the test and find the cause of thedelay. You may also receive an HPIBerror 230 on the counter, but this errorshould be ignored.
Instrument address orcontroller settings do notmatch initialization file. Doyou want to change interfacesettings now?
InformationMessage
This information message indicates thatupon startup, HP BenchLink/Meter didnot find the controller or instrumentdefault address(es) as listed in theinitialization file. Choose YES todisplay the Interface Setup dialog boxor NO to cancel.
Instrument at address numbernot responding.
Error Message HP BenchLink/Meter was unable toperform the attempted operation withthe displayed instrument. SelectOptions | Configure interface... from the Menu Bar and establishcommunications to that instrumentbefore resuming.
Insufficient disk space toexport data (or store readings).
InformationMessage
This warning indicates that there is notenough disk space available on your PCto perform the requested command.Free some disk space and try again.
Low/High limit test valueexceeded. Test paused.
InformationMessage
HP BenchLink/Meter detected a limitfailure while running a test and pausedthe test. Click the OK button andresume the test by clicking thePause/Resume icon on the Toolbar.
6
Chapter 6 Error and Information Messages
77

Message Type Suggested action
Modifying the test definitionafter data has been acquiredwill erase the existing testdata. Are you sure you wantto modify the test definition?
InformationMessage
Changing test definition parameters inthe project window after data has beenacquired requires you to either erase thedata or cancel the changes to the testdefinition.
No instruments found. Makesure all cables are properlyinstalled and instruments arepowered-on.
Error Message This error message indicates HP BenchLink/Meter cannot find anattached instrument. If you are usingRS-232 with a multimeter, be sure thecorrect 9- or 25-pin cables have beenused, the instrument is powered on, andthe RS-232 settings of the multimetermatch the settings in the ConfigureInterface | RS-232 Settings... dialogbox. If you are using HP-IB, ensure thatthe cables are securely fastened and theinstrument is powered on. Also verifythat the instrument interface is set toHP-IB and all attached instrumentscontain a unique address.
Please enter a numberbetween number and number.
Error Message This error message indicates thenumber entered in the text box is notvalid. Change the number to a valid oneand click OK.
Please enter a validmeasurement range.
Error Message This error message indicates that thevalue entered in the RANGE text box isnot a valid range for the selectedfunction. Select a value from thedrop-down list.
Please enter a valid start time.
Error Message This error message indicates that thetime entered in the TIMED START textbox is not recognizable. Type a numberand use a colon between the hour andminutes, or select a time from thedrop-down list.
6
Chapter 6 Error and Information Messages
78

Message Type Suggested action
Save changes to name? InformationMessage
This information message indicates thatthe specified project you wish to close isnew or has been changed. Click YES tosave the new project information, NO todelete or not make changes, or CANCELto cancel the command.
The current project(instrument) is not compatiblewith the selected instrument(project type).
InformationMessage
This information message indicates that the instrument in the ToolbarInstrument list is not compatible with the current project.HP BenchLink/Meter will allowyou to view and change the projectinformation, but you cannot acquiremore data until you select anotherinstrument or open another project.
The data file requires numberKB of disk space. There areonly number KB available.Change drives or make spaceavailable and try again.
Error Message This error message indicates there is not enough disk space availableon the drives selected drive to savethe HP BenchLink/Meter data file.Select another drive or free some diskspace before you continue.
The following required fileswere not found in your\windows\system directory:(Names).
Error Message This error message indicates that thenamed files should be installed by HP BenchLink/Meter. Reinstall HP BenchLink/Meter.
The selected instrument is not compatible with thisapplication. Use theInstrument list in the Toolbarto switch to other BenchLink applications.
InformationMessage
This information message indicates thatthe instrument selected in the ConfigureInterface dialog box is not supported byHP BenchLink/Meter. Choose anotherinstrument (multimeter or counter). Ifyou wish to switch to anotherBenchLink application, use theInstrument list on the Toolbar.
This file already exists.Replace existing file?
Error Message This error message indicates that thenamed file will be overwritten by newdata if you choose YES.
6
Chapter 6 Error and Information Messages
79
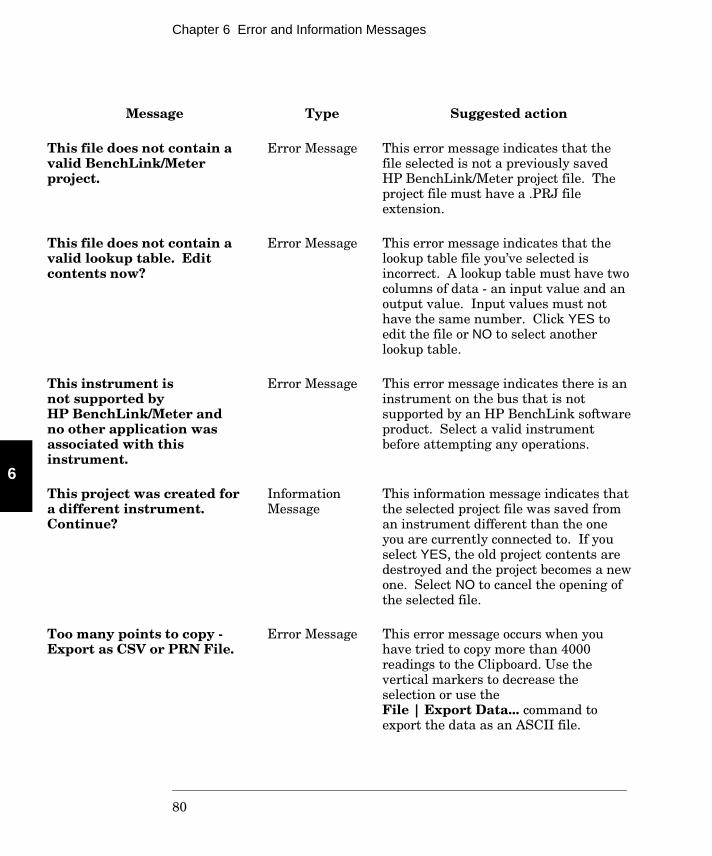
Message Type Suggested action
This file does not contain avalid BenchLink/Meter project.
Error Message This error message indicates that thefile selected is not a previously saved HP BenchLink/Meter project file. Theproject file must have a .PRJ fileextension.
This file does not contain avalid lookup table. Editcontents now?
Error Message This error message indicates that thelookup table file you’ve selected isincorrect. A lookup table must have twocolumns of data - an input value and anoutput value. Input values must nothave the same number. Click YES toedit the file or NO to select anotherlookup table.
This instrument is not supported by HP BenchLink/Meter and no other application wasassociated with thisinstrument.
Error Message This error message indicates there is aninstrument on the bus that is notsupported by an HP BenchLink softwareproduct. Select a valid instrumentbefore attempting any operations.
This project was created for a different instrument.Continue?
InformationMessage
This information message indicates thatthe selected project file was saved froman instrument different than the oneyou are currently connected to. If youselect YES, the old project contents aredestroyed and the project becomes a newone. Select NO to cancel the opening ofthe selected file.
Too many points to copy -Export as CSV or PRN File.
Error Message This error message occurs when youhave tried to copy more than 4000readings to the Clipboard. Use thevertical markers to decrease theselection or use theFile | Export Data... command toexport the data as an ASCII file.
6
Chapter 6 Error and Information Messages
80

Message Type Suggested action
Too many readings expectedin this test. Decrease the testlength.
Error Message This error message indicates that the specified duration and readinginterval of the test will exceed themaximum number of readings HP BenchLink/Meter can acquire(10 million). Decrease the duration orthe time between reading intervals toproceed.
Unable to import this file. It’snot a BenchLink/Meter .DATfile.
Error Message This error message indicates that the selected file cannot be importedbecause it’s not a proprietary HP BenchLink/Meter file. If you aretrying to import a .CSV or .PRN file,change the file type in the ImportAnalysis Data dialog box before tryingagain.
Unsuccessful copy to theClipboard - Low Memory (or Try again).
Error Message This error message indicates that theattempt to copy information to theClipboard failed. Try closing all openapplications and restart Windows.
Unsuccessful export to file -Low Memory.
Error Message This error message indicates that yourPC does not have enough memoryavailable to export the data to a file.Try closing other open applications andtry again.
6
Chapter 6 Error and Information Messages
81

IndexAAcquisition Category 17, 22, 34-35, 56analysis window 19, 66-67ASCII files 26, 30, 46, 67 - 68Autozero 33
CClipboard 30, 59, 66, 67, 70closing HP BenchLink/Meter 19configuration
instrument 50interface 48 - 49
control bar 25, 60conventions used 2counter (See HP 53131/2A UniversalCounters or HP 53181A RF Counter) CSV 26, 41, 45 - 46, 66, 68, 70 - 72
DDAT 26, 45, 66, 68, 73data flow diagram 1disk space 10, 13duration 35
EEdit | Copy 45, 53, 61, 66, 70Edit | Delete 67Edit | Paste 45, 53, 70equation libraries 43equipment required 8error messages 75 - 81
FFile | Export Data... 27, 46, 71File | Import Data... 66, 72 - 73File | New Project 53File | Open Project... 20, 53File | Print 44, 53File | Save As... 30File | Save Project 45, 53file descriptions 13, 68Function Category 17, 21, 31-32
GGET INSTRUMENT SETTINGS? 22GPIB interface card 8
HHelp 47, 54, 55Help | Index 47Help | Search... 47Help | Using Help 47histogram window 18, 63HP 34401A Multimeter configuration 50HP 53131/2A Universal Counters 50HP 53181A RF Counter configuration 50HP-IB
cable 8interface card 8requirements 8
IIEEE-488 8, 48information messages 75 - 81installing HP BenchLink/Meter 9 - 11Instrument list 74interface configuration 8, 48 - 49
JJournal Category 17, 24, 37, 59
Llaunch program 38 - 39Limit Testing Category 17, 36, 58linear scaling 40log to journal 37lookup table 41
Mmarkers
limit 36limit 66vertical 25, 62, 67
Mathcad 45Menu Bar 16 - 17, 52Microsoft
Excel 27, 41, 45Visual C++ 39Word 27, 44 - 45
MS-DOS version 8
83

NNational Instruments 8null measurements 40
OOptions | Configure Interface... 48
Ppausing/resuming a test 23, 37PC requirements 8power scaling 43printing windows 44PRJ 16, 27, 30, 45, 68PRN 26, 41, 46, 66, 68, 70 - 72project
description 27sample 20 - 28save 26, 45window 17-18, 55
Rrange 31READBLM.WRI file 2, 11, 37, 58readings 35readout window 18, 64removing files 13resolution 33-34resuming a test 23, 37RS-232 (multimeter only) 8, 49RTD scaling 43running a test 23
Ssample test project 20 - 28saving a test project 26saving measurement data 26scale data category 17, 40 - 43, 57SICL interface card 8, 48starting HP BenchLink/Meter
from the DOS prompt 19from Windows 19with the BenchLink Icon 19
statistics window 18, 23, 65-66Status Bar 17, 54stopping a test 25strip chart window 18, 25, 60
TTBL 41, 68Test | Pause/Resume 37, 54Test | Run 23, 53Test | Stop 25, 54thermistor scaling 31, 43thermocouple scaling 43time/voltage pairs 68, 71 - 72timed start 22, 35Title Bar 16, 52Toolbar 16 - 17, 53triggering 34TST 26, 30, 45, 68typeface conventions used 2
VView | Data... 63View | Histogram... 67, 73View | Markers 25, 61View | Modify Parameters... 62, 64, 67View | Scale... 72 - 73View | Statistics... 67, 72 - 73View Zoom To Fit 61, 63, 66
WWindow | Analysis 53Window | Histogram 23, 53Window | Project 53Window | Readout 23, 53Window | Statistics 23, 53Window | Strip Chart 23, 53Windows 3.1 8Windows Metafile 70
Index
84

WARRANTYA copy of the specific warranty terms applicable to your Hewlett-Packard product and replacement parts can be obtained fromyour local Sales and Service Office.
EXCLUSIVE REMEDIESTHE REMEDIES PROVIDED HEREIN ARE BUYER’S SOLE AND EXCLUSIVE REMEDIES. HP SHALL NOT BELIABL E FOR ANY DIRECT, INDIRECT, SPECIAL, INCIDENTAL, OR CONSEQUENTIAL DAMAGES, WHETHERBASED ON CONTRACT, TORT, OR ANY OTHER LEGAL THEORY.
NOTICEThe information contained in this document is subject to change without notice. HEWLETT-PACKARD (HP) MAKES NOWARRANTY OF ANY KIND WITH REGARD TO THIS MATERIAL, INCLUDING, BUT NOT LIMITED TO, THEIMPLIED WARRANTIES OF MERCHANTABILITY AND FITNESS FOR A PARTICULAR PURPOSE. HP shall not beliable for errors contained herein or for incidental or consequential damages in connection with the furnishing, performanceor use of this material. This document contains proprietary information which is protected by copyright. All rights are reserved.No part of this document may be photocopied, reproduced, or translated to another language without the prior written consentof Hewlett-Packard Company. HP assumes no responsibility for the use or reliability of its software on equipment that is notfurnished by HP.
Restricted Rights LegendUse, duplication, or disclosure by the Government is subject to restrictions as set forth in subdivision (b)(3)(ii) of the Rights in Technical Dataand Computer Software clause at 52.227-7013. Hewlett-Packard Company; 3000 Hanover Street; Palo Alto, California 94304
Use of this manual and magnetic media supplied for this product are restricted. Additional copies of the software can be made for securityand backup purposes only.
Copyright © 1994 Hewlett-Packard Company.
Printing HistoryThe Printing History shown below lists all Editions and Updates of this manual and the printing date(s). The first printing ofthe manual is Edition 1. The Edition number increments by 1 whenever the manual is revised. Updates, which are issuedbetween Editions, contain replacement pages to correct the current Edition of the manual. Updates are numbered sequentiallystarting with Update 1. When a new Edition is created, it contains all the Update information for the previous Edition. Eachnew Edition or Update also includes a revised copy of this printing history page. Many product updates or revisions do notrequire manual changes and, conversely, manual corrections may be done without accompanying product changes. Therefore,do not expect a one-to-one correspondence between product updates and manual updates.
Edition 1 (Part Number 34812-90001) . . . . . . . . August 1994
Microsoft® , MS® , MS-DOS®. , Word® , and Excel® are registered trademarks of Microsoft Corporation.
Windows is a trademark of Microsoft Corporation.
IBM® is a registered trademark of International Business Machines Corporation.
HP and LaserJet® are registered trademarks of Hewlett-Packard Company.
Mathcad® is a registered trademark of MathSoft, Incorporated.
National Instruments® is a registered trademark of National Instruments Corporation.
Manual Part Number: 34812-90001 Printed: August 1994 Edition 1Microfiche Part Number: 34812-99001 Printed in U.S.A.