howard county u.s. 87 railroad overpass bridge big … · 2. raychem ferex 100 (bridge deck-zones...
TRANSCRIPT
----~-·-
\ .}
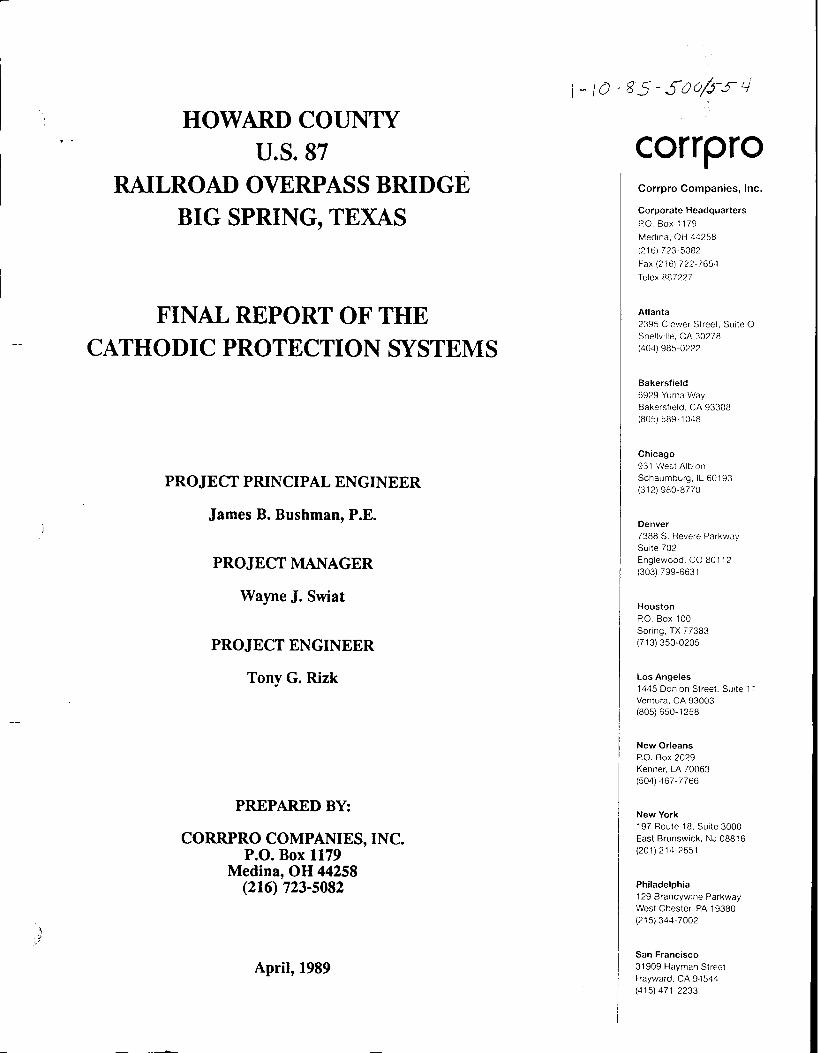
HOWARD COUNTY u.s. 87
RAILROAD OVERPASS BRIDGE BIG SPRING, TEXAS
FINAL REPORT OF THE CATHODIC PROTECTION SYSTEMS
PROJECT PRINCIPAL ENGINEER
James B. Bushman, P.E.
PROJECT MANAGER
Wayne J. Swiat
PROJECT ENGINEER
Tony G. Rizk
PREPARED BY:
CORRPRO COMPANIES, INC. P.O. Box 1179
Medina, OH 44258 (216) 723-5082
April, 1989
1 -fu- '65- soojrs4
corrpro Corrpro Companies, Inc.
Corporate Headquarters
PO. Box 1179
Med1na. OH 44258
121li) 723-5082
f'ax (216) 722-7654
Telex B87227
Atlanta 2395 Clower Street. Suite 0 Snellville. GA 30?78 (404) 985-02?2
Bakersfield 6929 Yuma Way Bakersfield, CA 93308 (805) 589-1048
Chicago 931 West Alb1on Schaumburg, IL 60193 (:312) 980-8770
Denver 7388 S. Revere Parkway Su1te 702 Englewood, CO 80112 (303) 799-6631
Houston P.O. Box 100 Spnng, TX 77383 (713) 350-0205
Los Angeles 1445 Donlon Street. Su1te 11 Ventura. CA 93003 (805) 650-1258
New Orleans P.O. Box 2029 Kenner, LA 70063 (504) 467-7766
New York 197 Route 18, Su1te 3000 East Brunswick, NJ 08816 (201) 21,1-2651
Philadelphia 129 Brandywine Parkway West Chester, PA 19380 (215) 344-7002
San Francisco 31909 Hayman Street Hayward. CA 94544 (415) 471-2233
' .I
\ j
) )
SUMMARY
REPORT
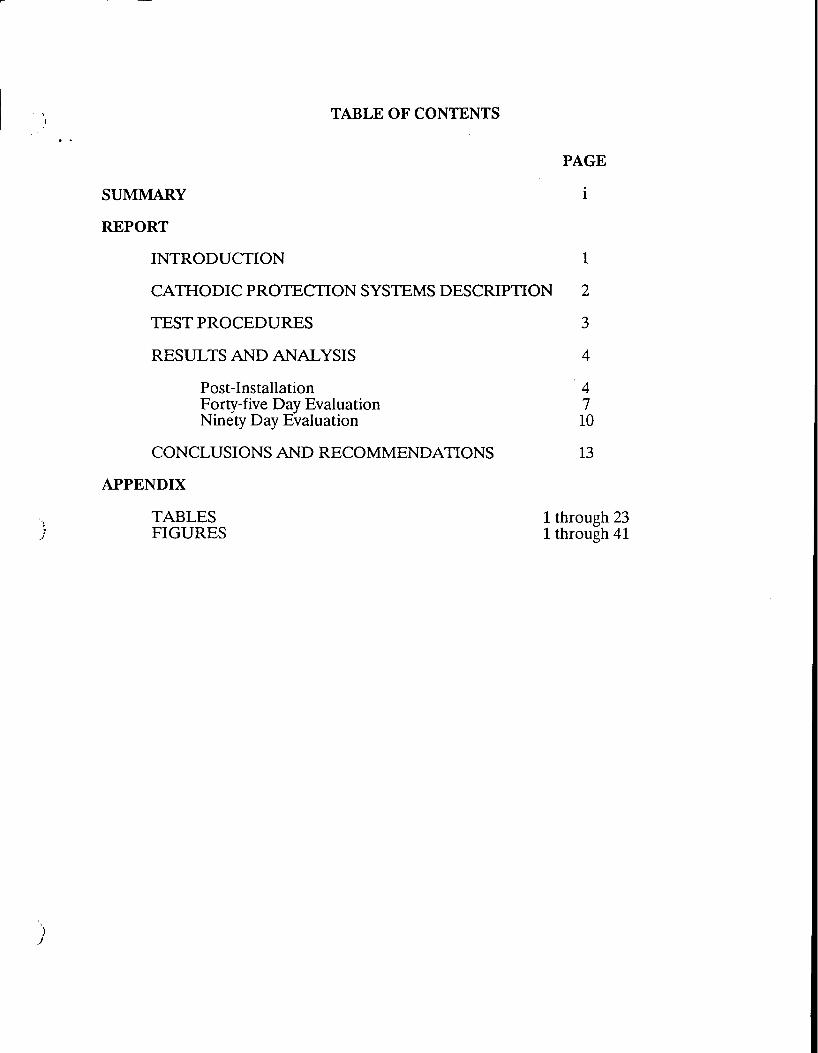
TABLE OF CONTENTS
PAGE
INTRODUCTION 1
CATHODIC PROTECTION SYSTEMS DESCRIPTION 2
TEST PROCEDURES 3
RESULTS AND ANALYSIS 4
Post-Installation 4 Forty-five Day Evaluation 7 Ninety Day Evaluation 10
CONCLUSIONS AND RECOMMENDATIONS 13
APPENDIX
TABLES FIGURES
1 through 23 1 through 41

REPORT
)
)

)
SUMMARY
A cathodic protection system for corrosion mitigation of the reinforcing steel was installed
on US 87 railroad overpass bridge in Big Spring, Texas. Five anode materials were used as
a research effort to study their performance under similar operating condition. The five
anode materials are as follows:
1. Elgard 150 mesh (Bridge deck- Zones A1-A4; Rectifier circuits 1-4)
2. Raychem Ferex 100 (Bridge deck- Zones B1-B4; Rectifier circuits 5-8)
3. Rescon conductive polymer concrete (Bridge deck - Zones C1-C2; Rectifier
circuits 9-10)
4. Sprayed zinc (Sidewalks and median- Zones D1-D6; Rectifier circuits 11-16)
5. Porter DAC-85 (Pier cap - Zone E; Rectifier circuit 17)
Upon completion of the installations, Corrpro Companies, Inc. conducted post-installation
testing and energizing of the systems. Evaluation of each system performance in mitigating
corrosion was then conducted 45 days and 90 days after initial energization. The results
are as follows:
- Post-installation
All system components were checked and tested for proper installation and
operation.
Embedded silver/silver chloride reference cell potential and macro-cell rebar
probe current baseline measurements were obtained for each system.
Corrosion rate measurements were taken in accordance with the
manufacturers instructions, K.C. Clear Inc. These measurements will serve
as baseline data for future analysis.
E Log I testing conducted for all zones provided the suggested protection
current for each zone.

)
) /
Each system was energized under the constant current control of the
rectifier.
Rectifier meter malfunctions and rebar probe measuring circuit corrections
were determined and corrected by manufacturer.
Electrical contact between the zinc anode and the rebar was detected in
zones Dl, D2, D3 and D6. These contact points were found and eliminated.
Electrical isolation of the zinc anode was found in zone D3. Anode
continuity was re-established.
- 45 Day Evaluation
All system components were re-checked for proper operation.
Depolarization testing conducted after 45 days of continuous system
operation confirmed that the reinforcing steel is being cathodically protected
by meeting or exceeding the 100 millivolt polarization decay criterion.
Higher than needed potential shifts were calculated for all zones except
zones Al, A4 and C2 (rectifier circuits 1, 4 and 10). The current settings
were reduced for these zones.
Corrosion rate measurements suggest that the reinforcing steel showed no
further corrosion.
Disbonded areas of the Sika Top 122 overlay for the zinc anode on the
median and the sidewalk were detected.
The repair technique used to re-establish electrical continuity of the zinc
anode on zone D3 was still operational.
ll

' )
- 90 Day Evaluation
All system components were re-checked for proper operation.
Depolarization testing conducted after 90 days of continuous system
operation confirmed that the reinforcing steel is being cathodically protected
by meeting or exceeding the 100 millivolt polarization decay criterion.
The reduction in current output adopted for some zones during the 45 day
evaluation period were effective in reducing the high polarization shift.
Again, corrosion rate measurements showed no increase in rebar corrosion
rate.
Disbandments of the Sika top 122 overlay from the zinc anode on the
median and sidewalk increased from the previous evaluation.
Erratic behavior of the zinc anode was found in several areas of the
sidewalks, especially in zones Dl and D3. This behavior was determined to
be erratic electrical isolation of the zinc anodes were concrete cracks
beneath the zinc reflected through the zinc. Long term cathodic protection
for the entire area of the sidewalk and median is therefore considered
questionable and future maintenance of this system is expected.
The rectifier operating data should be recorded monthly. Should any discrepancies be
noted, a qualified corrosion engineer should be contacted in order to insure continuous
protection of the reinforcing steel structure. It is also recommended to conduct a detailed
evaluation of the systems on a yearly basis to insure optimum system performance and
corrosion control of the reinforcing steel.
lll
)
)
I. INTRODUCTION
After the cathodic protection system installations were completed, the post-installation and
activation testing was performed by Corrpro Companies, Inc. The testing included the
following.
1. Inspection of the cathodic protection system components to meet
specification requirements.
2. Electrical resistance measurements between the various components of the
cathodic protection system.
3. Embedded reference cell potential and macro-cell rebar probe current
baseline measurements.
4. Rate of corrosion measurements using both embedded and portable
corrosion rate probes.
5. E Log I testing.
6. System adjustment and initial activation.
The cathodic protection systems were adjusted and energized for continuous operation
based on the evaluation of the data collected during the post-installation testing and
performance criteria set forth in the project specifications. All data collected during the
testing are included in this report.
At approximately 45 days and 90 days after initial energization, evaluation testing of each
systems performance was conducted. The testing included the following:
1. Inspection of the cathodic protection systems.
2. Depolarization testing.
1

3. Macro-cell rebar probes current measurements.
4. Rate of corrosion measurements.
5. Electrical resistance measurements.
6. System adjustments.
The cathodic protection systems were then re-energized based on data analysis of the data
collected. All data collected during the 45 and 90 day evaluation periods are included in
this report.
II. CATHODIC PROTECTION SYSTEMS DESCRIPTION
Five cathodic protection systems for corrosion mitigation of the reinforcing steel were
installed on the U.S. 87, Howard County, railroad overpass bridge in Big Spring, Texas.
The bridge structure was divided into seventeen zones using five anode materials as
follows:
1. Elgard 150 mixed metal oxide mesh anode (Zones A1-A4, deck slab; rectifier
circuits 1-4)
2. Raychem Ferex 100 flexible conductive polymer anode (Zones B1-B4, deck
slab; rectifier circuits 5-8)
3. Rescon rigid conductive polymer anode (Zones C1-C2, deck slab; rectifier
circuits 9 and 10)
4. Metallized spray zinc anode (Zones D1-D6, sidewalks and median; rectifier
circuits 11-16)
5. Porter DAC-85 conductive paint anode (Zone E, pier cap; rectifier circuit
17)
The different anode materials were employed as a research effort to study their
performance under the same operational conditions. The protective current is supplied
using a rectifier manufactured by Goodall Electric Inc.
2

....-----------·· --···
} ·'·'
)
The performance of each cathodic protection system is monitored using embedded and
fixed location portable monitors. One silver/silver chloride reference cell and one macro
cell rebar probe is embedded in every zone. In addition, two corrosion rate probes are
embedded in every zone (except for zones Dl through D6 and zone E where portable
corrosion rate probes are used) and periodically tested according to the manufacturer's test
procedures to monitor corrosion control effectiveness by cathodic protection.
III. TEST PROCEDURES
The following test procedures were used during the post-installation and activation testing:
1. Inspection of the Cathodic Protection Systems- All system wiring was tested for
proper installation. The rectifier was also inspected to insure proper operation.
2. Electrical Resistance Measurements- Electrical resistance measurements were
taken between the various components of the cathodic protection system at the
rectifier. The measurements were obtained using a Nilsson Model 400 AC
resistance meter.
3. Reference Cell Potential and Rebar Probe Current Measurements -The static
potential of all reference electrodes and the corrosion current of all macro-cell
rebar probes were measured using a Miller model LC-4 voltmeter.
4. Rate of Corrosion Measurements - Corrosion rate measurements were conducted
using the K.C. Clear Inc. 3LP corrosion rate instrument and probes. The
measurements were taken according to the manufacturer's instructions and
recommendations.
5. E Log I Testing - E Log I testing was performed for each zone using its embedded
silver/silver chloride reference cell and a portable test rectifier capable of reading
"IR-drop free" potentials. The protective currents were increased at approximately
two minute intervals. Instant-off reference cell potential, current and voltage
3

)
between the anode and the reinforcing steel were recorded at each current
increment. Analysis was done by computer.
The following test procedures were used 45 days and 90 days after initial system
energization.
1. Depolarization Testing - After the cathodic protection systems were energized with
protective current, depolarization testing was conducted for all cathodic protection
zones. Depolarization potentials were measured with respect to the embedded
silver/silver chloride reference cells. The potential decays were recorded every 30
seconds and monitored for 4 hours using two Omnidata data loggers connected to
the reference cell terminals at the rectifier.
2. Rebar Probe Current Measurements- Each rebar probe current was measured just
before and during depolarization testing. The measurements were taken at the
rectifier across a 10 ohm-shunt resistor using a Miller Model LC4 voltmeter. The
positive lead of the meter was connected to the rebar probe and the negative lead to
the bridge reinforcing steel.
3. Electrical Resistance Measurements - Electrical resistance measurements were
taken between the various components of each cathodic protection system at the
rectifier. The measurements were obtained using a Nilsson Model 400 AC
resistance meter.
IV. RESULTS AND ANALYSIS
POST INSTALLATION
1. Inspection of the Cathodic Protection System Components - System wiring errors
were found and corrected at the rectifier. In addition, wiring errors were found and
corrected in the junction boxes corresponding to zones Bl (Raychem anode system)
and D3 (Zinc sprayed anode system).
4

\
)
)
Direct electrical contact between the anode and the reinforcing steel were detected
in zones D1, D2, D3 and D6 (these zones are zinc sprayed anode material) during
testing. These contact points were located and eliminated.
The rectifier unit was inspected to insure proper operation. The rectifier meter was
found unable to display circuit voltage and current. In addition, the rectifier did not
measure the voltage drop across the 10 ohm resistor of the macro-cell rebar probes.
Instead, the rectifier meter was displaying the direct potential difference between
the macro-cell rebar probe and the reinforcing steel. The contractor notified the
rectifier manufacturer for correction of these malfunctions.
During testing of the zinc systems, some areas of zinc coating were found
electrically isolated (zone D3). Further investigation revealed that concrete stress
cracks running transverse and full width of the sidewalk reflected through the thin
zinc anode coating. Electrical continuity of the zinc anode coating was re
established using flame sprayed zinc. The system repair would be evaluated during
the next two evaluation visits.
2. Electrical Resistance Measurements - Table 1 documents the resistance data taken
between the various components of each cathodic protection system.
The anode-to-system negative resistance measurement for each zone verifies that
the systems will operate within the rectifier's design capacity. The zinc zones
(circuits 11-16) displayed high circuit resistance due to the small size of these zones.
The reference cell-to-reference cell ground resistances as well as the macro-cell
rebar probe to rebar probe ground resistances were considered normal for
continuous operation. All other resistance measurements documented in table 1
verify that the system is able to provide protective current to the reinforcing steel of
this structure. All the resistance measurements recorded will serve as a baseline for
future system monitoring.
5

)
)
3. Anode Potential. Reference Cell Potential and Rebar Probe Current Measurements
- Shown in table 1 are potential measurements taken between the anode and the
system negative of each zone. This "open circuit potential" verifies that the anode
and the reinforcing steel network are electrically isolated and installed correctly.
Also included in table 1 are the corrosion potentials of the embedded reference cell
and each macro-cell rebar probe corrosion current. The negative value of the rebar
probe corrosion current is an indication of the anodic (corroding) behavior of the
rebar probe to the surrounding reinforcing steel. The corrosion potential of the
embedded reference cells indicate the cells are installed near corroding rebars.
4. Corrosion Rate Measurements - Two permanent corrosion rate probes are
embedded in each of the 10 zones in the bridge deck (circuits 1-10). Portable
probes are being used to measure corrosion rates on the sidewalk, median and pier
cap. Table 2 documents the corrosion rate data results. Presently, there is no
definite corrosion rate threshold value for reinforcing steel in concrete above which
concrete corrosion damage occurs. Such criteria has not yet been clearly
established, but is being researched. However, the rate of corrosion measured and
calculated on this project will serve as a baseline for future monitoring of the system
and can be used to assess and evaluate the effectiveness of each cathodic protection
system.
5. E Log I Tests -The polarization data collected during E Log I testing is plotted by
computer and shown in figures 1 through 17. TheE Log I tests were conducted
using the embedded silver/silver chloride reference cell in each zone. The purpose
of performing the E Log I test is to determine corrosion and cathodic protection
data. According to theory, as increments of current are applied to a structure,
oxidizing and reduction reactions occur on the steel surface. When the reduction
reaction dominates, a plot of the applied current versus the polarized structure
potentials on a semi-log graph gives a straight line called Tafel behavior. The
polarized potential at the beginning of the Tafel segment is the value which
indicates cathodic protection is achieved. Using the above theory, the amount of
cathodic protection current is determined for each zone. The interpretation of the
linear portion of the curve and the break is subject to individual opinion.
6
)
Therefore, to obtain the best fit straight line of the Tafel slope, a linear regression
technique using a computer was adapted by Corrpro Companies, Inc. This
computerized method enables evaluation of all possible linear portion of the graph
to determine the most linear portion of the curve. The linear regression program
then calculates the Tafel slope (Be), corrosion current (I-corr), corrosion potential
(E-corr), cathodic protection current (1-prot), cathodic protection potential (E
prot), standard deviation of potential estimate (standard error), closeness of fit of
the estimated data to actual data (R 2) and the number of observations used. Table
3 summarizes the results of the E Log I test for each zone. Table 3 also shows
protective current requirements as determined by the E Log I test.
6. Initial Rectifier Setting and Operating Data - This project utilized different anode
material which have.different anode current density limitations. The operational
current density was kept approximately equal to or less than two milliamperes per
square foot of concrete surface area (as shown in table 4) except for the Elgard 150
anode material where anode current limitations necessitated a current density limit
of approximately 1.5 milliamperes per square foot of concrete surface area. The
effectiveness of the systems in mitigating corrosion of the reinforcing steel would be
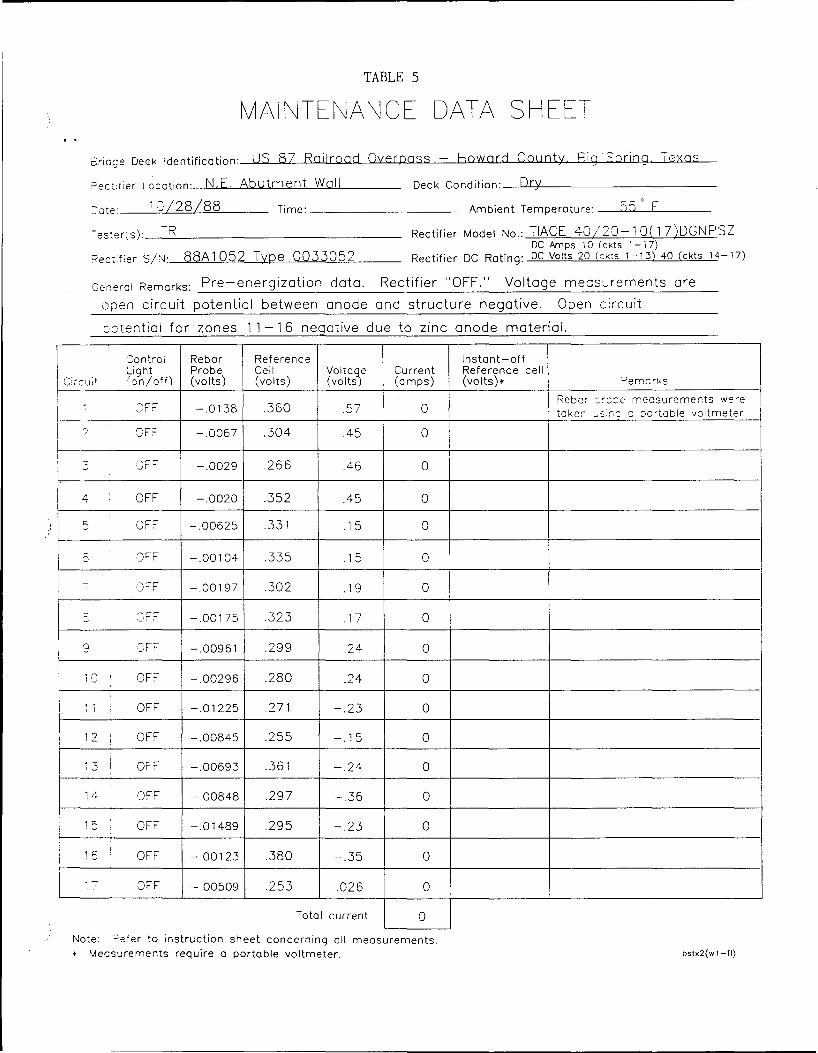
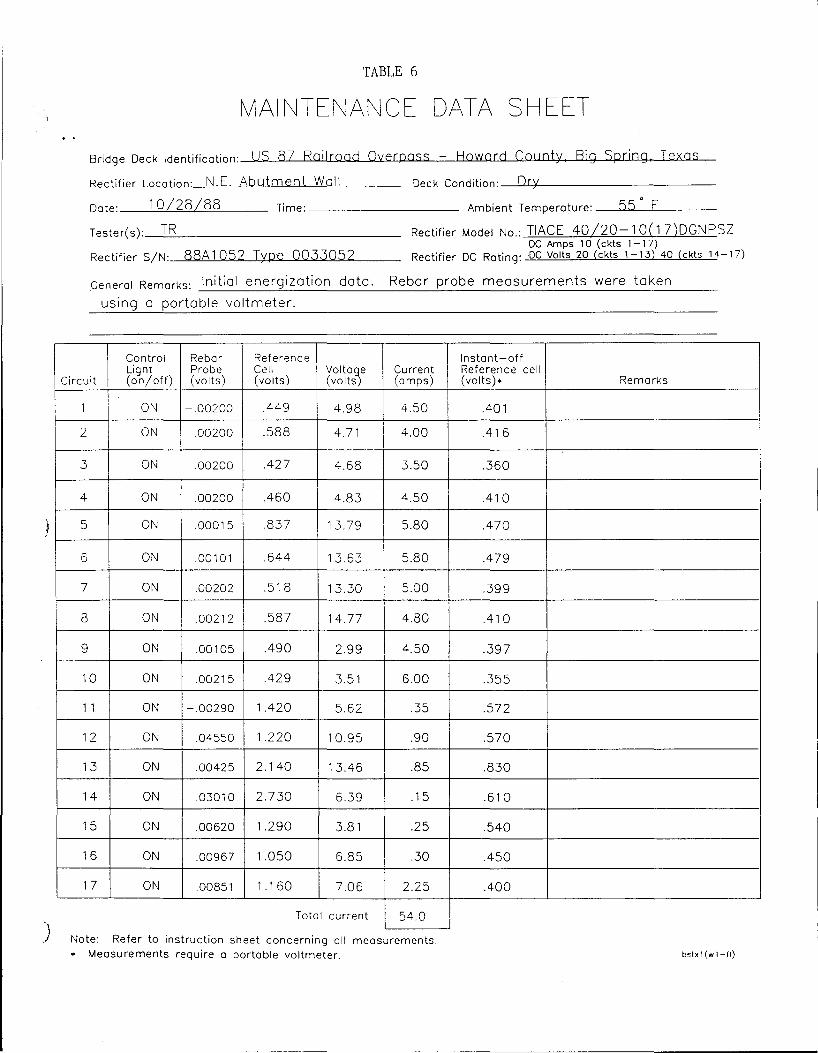
evaluated 45 days after initial energization. Tables 5 and 6 show rectifier operating
data taken before and after initial energization, respectively.
FORTY-FIVE DAY EVALUATION
1. Inspection of the Cathodic Protection System - After 45 days of initial system
energization, the rectifier was inspected for proper operation. No rectifier
malfunctions were detected during this inspection.
A visual inspection of the cathodic protection zones yielded the following:
In zone D3 (zinc anode with Sika top 122 thin cementatious coating), two
areas of Sika top disbandments were detected.
7

' )
A small number of dot like rust stains were observed at the east most bottom
face of the pier cap (Porter DAC 85 anode system). The development of
these dots will be monitored during the next evaluation visit.
The repair technique adopted during the post-installation testing on zone D3
anode was still providing effective electrical continuity of the zinc anode
coating. The repairs will again be evaluated during the next evaluation visit.
2. Depolarization Testing - The specified criterion required that the half-cell potential
depolarize at least 100 millivolts more positive from the "instant-off" potential of
the reinforcing steel when the cathodic protection current is first turned off. The
polarization shift should occur in a reasonable time period which is generally
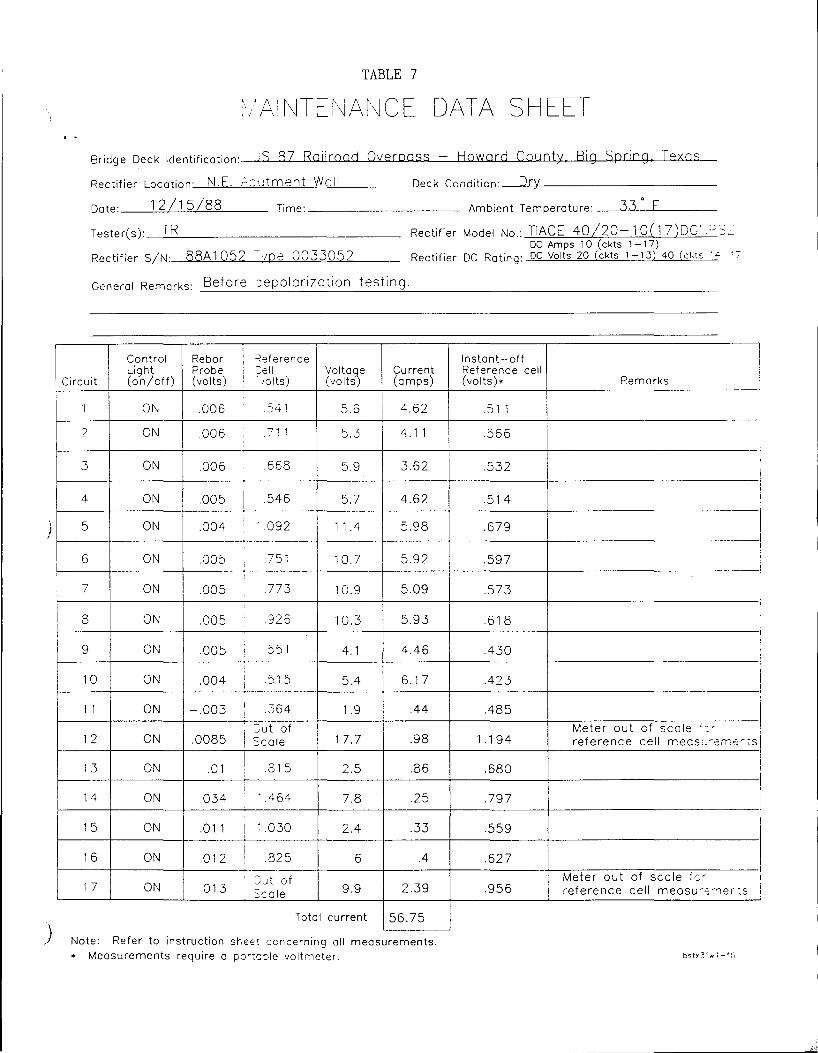
accepted to be 4 hours maximum. Table 7 documents rectifier operating data taken
before depolarization testing. Depolarization testing was then conducted using two
Omnidata data loggers connected to the embedded silver/silver chloride reference
cell terminals at the rectifier. Instant-off reference cell potentials were obtained by
momentarily interrupting the current for every zone. After power shut off, the
potential decay was automatically recorded by the data loggers at 30 second
intervals. However, potential data logging was terminated after 3 hrs and 4 minutes
for circuits 11 through 17 due to instrument malfunction. The data for these circuits
were then recorded by hand. Figures 18 through 23, show computer generated plots
of the data collected for each zone. The depolarization graphs showed typical
potential decay behavior.
Table 8 summarizes the 4 hour polarization shift on each reference cell for all
zones. The specifications recommend a depolarization range of 100-150 millivolts.
Current settings were re-adjusted accordingly. It should be noted, however, that
recent research has shown that the 100 millivolts may be too conservative and that
higher polarization shift may be desired.
Depolarization testing will also be conducted approximately 90 days after initial
system energization.
8

)
)
3. Rebar Probe Current Measurements - Rebar probe current measurements were
taken before and during the depolarization test as shown in table 9. By monitoring
the electrical current produced by electrochemical reactions on the probe and the
surrounding reinforcing steel, whether or not the probe is an anode (corroding,
negative polarity) or a cathode (non-corroding, positive polarity) is determined. All
rebar probes (except rebar probe 11, zone D 1) were cathodic with the protective
current applied. When the cathodic protection current was first interrupted, all
rebar probes drifted anodic or less cathodic as expected. This shows that the for
cathodic protection is effective, and that continuous system operation is vital.
Rebar probe 11, although anodic at the beginning of the test, drifted considerably
more anodic by the end of the test. Rebar probe 17 drifted anodic after the current
was turned off, but then went cathodic. This behavior suggests that the rebar probe
is no longer anodic to its surrounding rebar and therefore can no longer be used to
observe current reversal. Since other tests indicate that rebar probe 17 is functional,
whether this behavior is due to condition at the time of the test or polarization due
to protection current is unknown. Figures 24 through 29 show computer generated
plots of the rebar probe current data collected during the depolarization testing.
It should be noted that there is no set criteria for macrocell rebar probes' behavior
or a recommended maximum corrosion current value. Rebar probes are used as an
indication that the cathodic protection current is being effective in supplying
protection to the steel rebar. By forcing this artificial, highly anodic corrosion cell
to be cathodic or to drift considerably less anodic, it can be assessed that the
cathodic protection current is providing corrosion control to the reinforcing steel.
4. Rate of Corrosion Measurements - Rate of corrosion measurements were
conducted 24 hours after the depolarization. Table 10 documents the results of the
data collected. Table 11 shows a comparison between the corrosion rate results
obtained during the post-installation testing and this test. Table 11 shows that no
significant change in corrosion rate was measured.
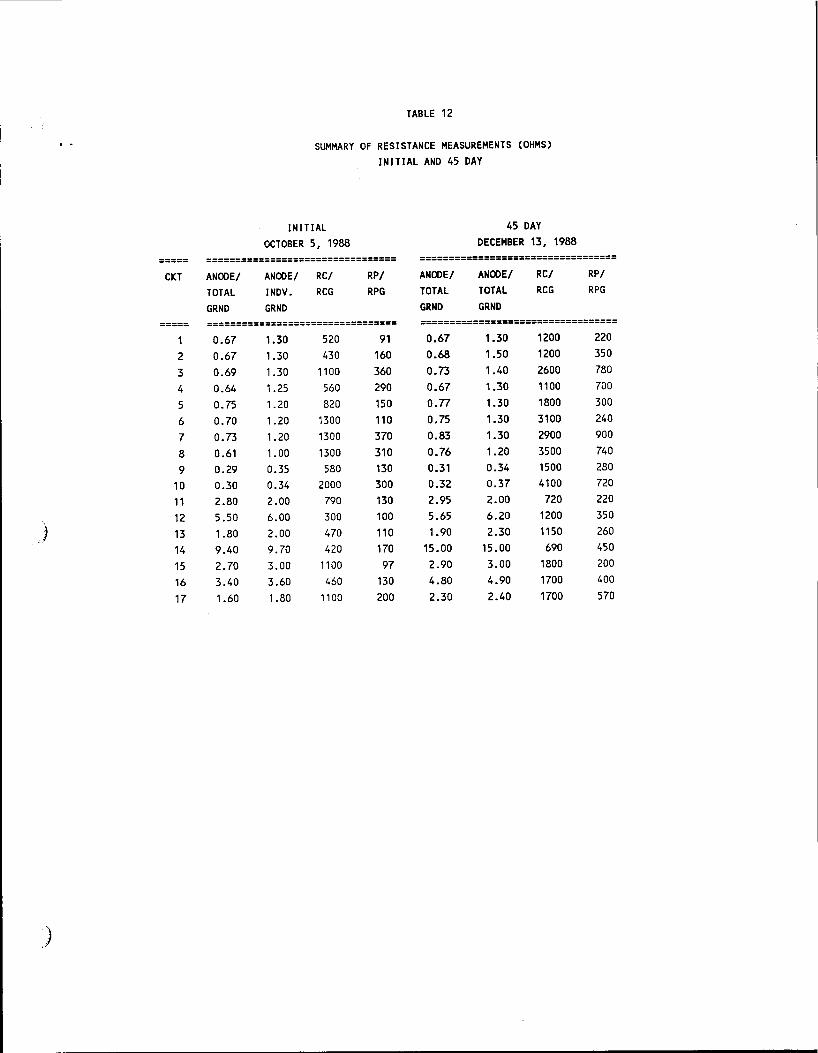
5. Electrical Resistance Measurements - Table 12 documents electrical resistance
measurements taken between the different components of the system during this
test period and during the post-installation testing. The resistance between each
9

)
reference cell and its ground and between each rebar probe and its ground
increased, a well expected behavior. All monitors are still considered normal for
operation.
A slight increase in anode to system negative is also noted for most of the cathodic
protection circuits. This increase was expected due to curing of the concrete and
temperature effects.
6. System Adjustments - A preliminary analysis of all the data collected during the 45
day evaluation period necessitated protective current adjustments. Table 13
documents the new current settings adopted as well as a summary of the initial
settings. The rectifier control for zone D5 (rectifier circuit 15) was unable to
maintain constant current at the very low current requirement. Slightly higher
current was set to insure continuous current control for this zone. Lower protective
currents were adopted for 77 percent of the circuits due to higher than specified
reference cell polarization shifts. The effectiveness of the new current settings will
be evaluated during the final (90 day) evaluation visit.
Table 14 documents rectifier operating data taken after re-energization of the
system for continuous operation at the 45 day site evaluation.
NINETY DAY EVALUATION
1. Inspection of the Cathodic Protection System- After 90 days of initial system
energization (and 45 days after completion of the first evaluation study of the
systems), the rectifier was inspected for proper operation. No malfunctions were
detected as the rectifier was able to effectively control the current output of every
circuit.
Inspection of the cathodic protection zones yielded the following:
The number and size of Sika top disbandments and cracks increased on the
zinc anode zones (zone D).
10

)
)
A large number of dot like rust stains were found on the bottom face of the
pier cap (zone E). The number of these "dots" increased during the past 45
days of system operation.
The repair technique adopted on zone D3 anode during the post-installation testing
and evaluated during the 45 day evaluation period was again tested during this visit.
The repairs made are still providing electrical continuity of the anode. However,
more cracked areas were found especially in zones D1 and D3. Effective cathodic
protection of these zones becomes questionable due to the possible electrical
isolation of the anode at active cracks.
2. Depolarization Testing - Table 15 documents rectifier operating data taken before
depolarization testing. The rebar probe embedded in zone 12 displayed a negative
voltage drop reading across the 10-ohm shunt. The cathodic protection current
supplied to this zone did not overcome the exceptionally strong corrosion cell of
this rebar probe.
Depolarization testing was then conducted using two Omnidata data loggers
connected to all the silver/silver chloride reference cell terminals at the rectifier.
Instant-off reference cell potential for every zone were taken and the potential
decays were automatically recorded by the data loggers. Figures 30 through 35
show computer generated plots of the data collected for each zone. The
depolarization graphs show expected potential decay shifts for all the reference
cells. All zones are considered to be cathodically protected as per the minimum 100
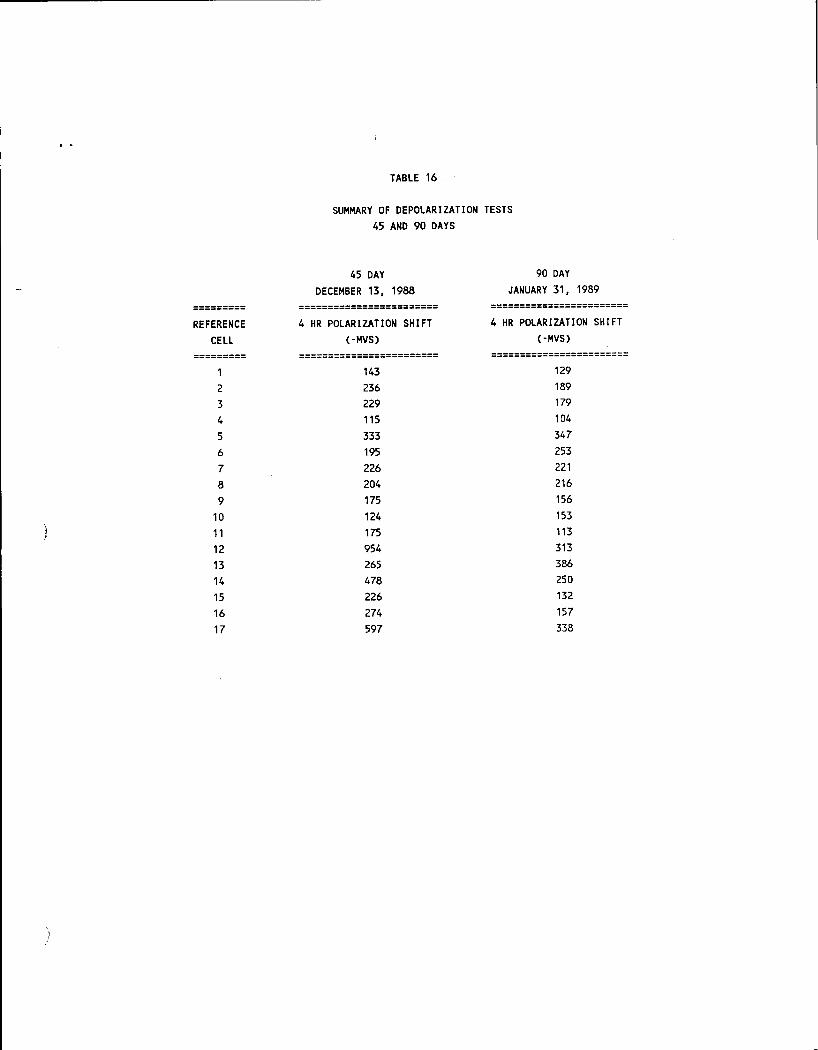
millivolts polarization shift specification. The 4 hour polarization shift data is
summarized in table 16 along with the previous test re&ults of the 45 day evaluation.
3. Rebar Probe Current Measurements - Rebar probe current measurements were
taken before and during depolarization testing. The change in polarity and
magnitude of each macrocell current is documented in table 17. All rebar probes
(except rebar probe 11, zone D1) were cathodic with the protective current applied.
With the cathodic protection current turned off, the macrocell rebar probes drifted
cathodic or less anodic as expected.
11

)
Figures 36 through 41 show the computer generated plots of the rebar probe current
data collected.
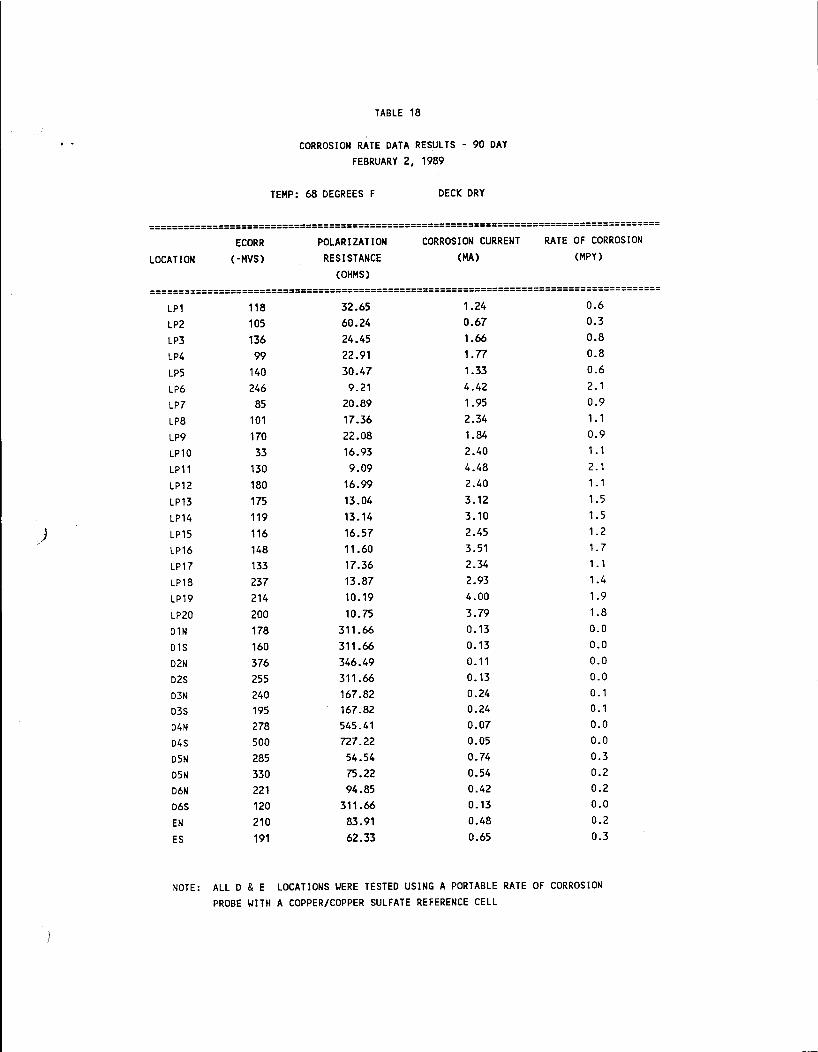
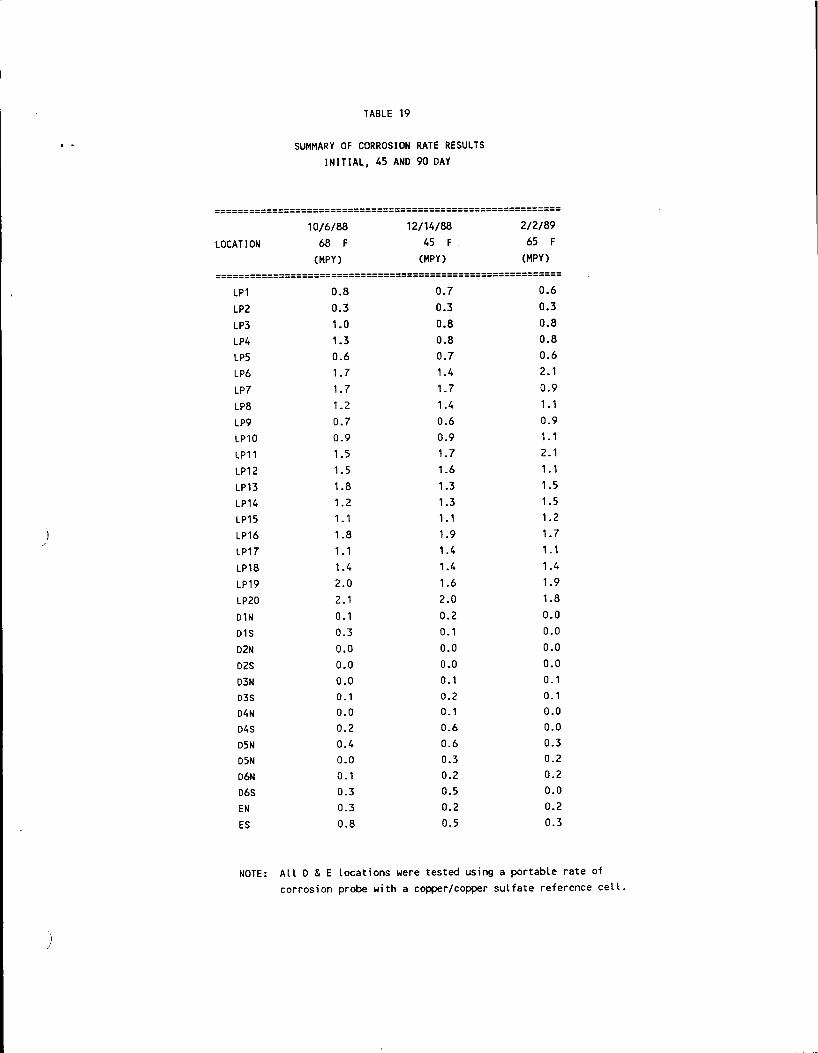
4. Rate of Corrosion Measurements - Corrosion rate measurements were conducted
24 hours after the depolarization tests. Table 18 documents the results of the data
collected. Table 19 shows a comparison of all the corrosion rate data obtained
according to specifications for the three test periods. It is noted that no significant
change in corrosion rate was measured during our evaluation periods.
5. Electrical Resistance Measurements - Table 20 documents electrical resistance
measurements taken between the different components of the cathodic protection
system and after the 90 day depolarization test and during the previous tests. All
resistance measurements obtained between each reference cell and reference cell
ground and between each rebar probe and rebar probe ground are considered
normal for operation. The resistance measured between the anodes and the system
negative are within acceptable limits except for zones 11, 12 and 14 which show a
large increase in circuit resistance. This increase is due to a combination of factors
such as the small size of the zones and the erratic behavior of the zinc anode due to
temporary electrical isolation by reflective concrete cracking.
6. System Adjustments- Based on the data collected during our testing, the current
output of specific zones was re-adjusted to provide optimum performance as shown
in table 21. The new current settings are believed to provide effective corrosion
mitigation of the reinforced steel structure. Table 22 documents rectifier operating
data taken the day after final re-energization. Reference cell 11 and rebar probe 11,
although found normally operating before depolarization testing started, show no
sign of receiving cathodic protection current despite the fact that the rectifier is
supplying a current output to that zone. This erratic behavior is believed to be
caused by the active concrete cracks of the sidewalk and future performance of this
zone is questionable.
Table 23 documents the current setting for every zone throughout the specified
three testing periods.
12

)
i I
V. CONCLUSION AND RECOMIVIENDATIONS
1. The cathodic protection systems can provide effective corrosion mitigation to the
reinforced concrete structure.
2. Depolarization test results conducted for all zones during both evaluation periods
meet the specified minimum 100 millivolt polarization shift criterion.
3. The corrosion cells produced by the rebar probes were greatly reduced by the
cathodic protection current.
4. The corrosion rate measurements taken before and during the evaluation periods
suggest that no further corrosion is occurring. It is recommended to periodically
conduct this test to establish a statistical record of the corrosion rate of the
reinforcing steel and the effectiveness of the systems in preventing further corrosion
damage.
5. General appearance of the cathodic protection systems are in good condition.
However, cracking of the Sika Top overlay applied over the zinc anode was visible
especially in zones D3 and D6.
6. Cathodic protection of the entire area of the median and the sidewalk are
considered questionable due to the discovery of several erratic electrical isolations
in the zinc anode coating.
7. The rectifier operating data should be collected monthly. This data provides
important information about the operation of the systems and will alert the
existence of any malfunction. These data sheets should be reviewed by a qualified
engineer should any discrepancy or abnormality be noted. It is also recommended
to conduct a yearly detailed evaluation of the systems to insure optimum protection
of the reinforcing steel structure.
tr004(70)
13

TABLES
)
)

TABLE 1
POST INSTALLATION SYSTEM DATA OCTOBER 5, 1988
ANODE REFERENCE CELLS REBAR PROBES
--- =================== ======================================================= ======================================== CKT RESISTANCE RESISTANCE
OPEN RESISTANCE ~------------------------------------------ ------------------------------CKT ANODE GRND/ CORROSION RC/ RC GRND/ RC GRND/ RC GRND/ CORROSION RP/ RP GRND/ RP GRND/
POT TOTAL GRND POTENTIAL RCG TOTAL GRND RP GRND/ !NOV GRND/ CURRENT RPG TOTAL GRND !NOV GRND
(mv) (ohm) (-MV) (ohm) (ohm) (ohm) (ohm) (MA) * (ohm) (ohm) (ohm)
------------------- ------------------------------------------------------- ----------------------------------------572 0.67 363 520 4.0 4.50 4.1 -1.376 91 0.780 1.40
2 454 0.67 310 430 3.2 3.70 3.9 -0.671 160 0.620 1.30
3 460 0.69 263 1100 3.1 3.60 3.7 -0.291 360 0.640 1.30
4 452 0.64 259 560 3.7 4.20 4.3 -0.199 290 0.690 1.40
5 153 0.75 331 820 2.8 3.00 3.2 -0.624 150 0.710 1.20
6 147 0.70 346 1300 2.8 4.00 3.3 -1.040 110 0.900 1.10
7 190 0. 73 318 1300 2.6 2.90 3.0 -0.197 370 0.550 0.96
8 172 0.61 331 1300 2.8 3.20 3.2 -0.175 310 0.560 0.96
9 244 0.29 301 580 1.5 1.70 1.5 -0.961 130 0.340 0.40
10 -236 0.30 285 2000 1.3 1.40 1.4 -0.296 300 0.280 0.38
11 -232 2.80 192 790 3.2 3.60 3.8 -1.225 130 0.610 1.20
12 -149 5.50 372 300 2.3 2.40 2.7 -0.845 100 1.060 1.30
}13 -239 1.80 386 470 2.3 2.70 3.2 -0.693 110 0.610 1.20
14 -357 9.40 252 420 1.3 1.50 2.2 -0.848 170 0.340 0.88
15 -231 2.70 214 1100 1.3 1.20 2.0 -1.489 97 0.470 1.00
16 -349 3.40 330 460 4.6 0.89 1.4 -1.234 130 0.260 0.49
17 26 1.60 279 1100 2.5 0.95 1.8 -0.509 200 0.340 1.10
* NOTE: (-) Negative current indicates macro-cell rebar probe is anode (corroding)
)

)
TABLE 2
CORROSION RATE DATA RESULTS - INITIAL OCTOBER 16, 1988
TEMP: 68 DEGREES F DECK DRY
==================================================================================== ECORR POLARIZATION CORROSION CURRENT RATE OF CORROSION
LOCATION (-MVS) RESISTANCE (MA) (MPY)
(ohm)
==================================================================================== LP1 170 23.20 1.75 0.8
LP2 162 54.54 0.74 0.3
LP3 180 19.83 2.05 1.0
LP4 88 14.70 2.77 1.3
LP5 209 31.34 1.30 0.6
LP6 278 11.65 3.49 1.7
LP7 144 11.45 3.55 1.7
LP8 165 16.18 2.51 1.2
LP9 238 25.13 1.62 0.7
LP10 38 20.89 1.95 0.9
LP11 181 13.17 3.09 1.5
LP12 216 12.62 3.23 1.5
LP13 218 11.01 3.70 1.8
LP14 175 16.23 2.51 1.2
LP15 178 17.48 2.33 1.1
LP16 216 10.80 3.77 1.8
LP17 167 17.36 ~.34 1.1
LP18 243 13.77 2.96 1.4
LP19 234 9.91 4.11 2.0
LP20 256 9.37 4.35 2.1
D1N 337 122.24 0.33 0.1
D1S 507 53.71 0.75 0.3
D2N 251 221.57 0.18 0.0
D2S 223 590.86 0.06 0.0
D3N 165 590.86 0.06 0.0
D3S 396 17.37 2.34 1.1
D4N 197 1181.73 0.03 0.0
D4S 167 90.90 0.44 0.2
DSN 230 49.23 0.82 0.4
DSN 197 354.52 0.11 0.0
D6N 230 177.26 0.23 0.1
D6S 260 54.54 0.74 0.3
EN 305 53.71 0.75 0.3
ES 285 22.72 1.79 0.8
NOTE: ALL D & E LOCATIONS ~ERE TESTED USING A PORTABLE RATE OF CORROSION
PROBE ~ITH A COPPER/COPPER SULFATE REFERENCE CELL

TABLE 3
SUMMARY OF ELOGI TEST RESULTS
(INITIAL ENERGIZATION) ( 1 0!11 - 10/13 1988)
========================================================== ZONE TAFEL SLOPE ICORR ECORR I PROT EPROT
MV/DECADE (MA) (-MV) (MA) (-MV)
========================================================== 183.67 2724.6 360 5123.6 410.4
2 249.00 1225.4 312 4098.7 442.6
3 205.90 1113.3 262 4894.8 394.5
4 168.80 3019.3 361 7746.1 430.1
5 163.80 1914.9 330 5996.7 411.2
6 152.80 3152.8 347 9246.4 418.2
7 274.70 2085.9 309 6697.9 448.2
8 222.50 2262.7 325 6696.9 429.9
9 187.70 1156.2 303 4847.9 419.8
10 156.10 1727.6 282 6797.1 374.8
11 1403.90 451.9 274 589.9 432.6
12 1060.99 386.2 301 939.8 710.8
13 343.51 291.0 410 729.4 547.1
14 872.30 188.8 307 344.7 535.1
15 307.60 116.4 242 424.3 414.8
16 239.30 71.0 355 219.8 472.5
17 507.30 1951.7 264 4298.9 438.0
\
)

TABLE 4
PROTECTIVE CURRENT SETTINGS - INITIAL
NOVEMBER 1988
========== ============================================= CONCRETE ELOGI ELOGI ACTUAL CURRENT SURFACE CURRENT CURRENT CURRENT DENSITY
CKT AREA (A) DENSITY SETTING (MA/SQ FT)
( FT SQ) (mA/SQ FT) (A)
---- ========== ============================================= 1 2884 5.124 1.78 4.5 1.56
2 2884 4.099 1.42 4.0 1.39
3 2884 4.899 1.70 3.5 1.21 4 2884 7.746 2.69 4.5 1.56 5 2884 5.997 2.08 5.8 2.01 6 2884 9.246 3.21 5.8 2.01 7 2884 6.697 2.32 5.0 1.73
8 2884 6.697 2.32 5.8 2.01
9 4704 4.845 1.03 4.5 0.96
10 4704 6.797 2.36 6.0 1.28
11 412 0.590 1.43 0.4 0.85
12 1648 0.940 0.57 0.9 0.55
13 1854 0.730 0.39 0.9 0.46
' 14 168 0.345 2.05 0.2 0.89 ) 15 672 0.424 0.63 0.3 0.37
16 756 0.220 0.29 0.3 0.4 17 1180 4.299 3.64 2.3 1.91
* MINIMUM CURRENT OUTPUT ALLOYED BY THE CONTROL CARD OF THE CIRCUIT
)
i
i
TABLE 5
MAINTENANCE DATA SHEET
2rioge Deck Identification: LJS 87 Railroad Overpass - Howard County P,jg :::oring !exos
Kec:fier Location: N.E. Abutment Wall Deck Condition :-..LLJL¥-------------
.I :J/28/88 =:ate· ----"'J---=:=.t....--=.:==----- Time:---------- Ambient Temperature: _ _...,c...L._j_ ___ _
Tester( s):_....:.7..:...R.:..__ ______________ _ Rectifier Model No.: TIACE 40/20-1 0( 1 7)DGNPSZ DC Amps 10 (cKts 1-17)
=<:eccifier S/0J: 88A 1052 Type 0033052 Rectifier DC Rating: DC Volts 20 kkts 1 -13) 40 (ckts 14-17)
General Remarks: Pre-energization data. Rectifier "OFF." Voltage measurements are
open circuit potential between anode and structure negative. Open circuit
::::·otential for zones 11 -1 6 negative due to zinc anode material
Controi Rebar Reference :...ight Probe Cell Voltoi)e Current
Circuit '0n/ o'f) (volts) (volts) (volts (amps)
·v--vr: -.0138 .360 .57 0
2 OF~ - 0067 .304 .45 0
-. ·JF~ -.0029 .266 .46 0
4 OFF -.0020 .352 .45 0
5 OFF -.00625 .331 .15 0
v OF::- -.00104 .335 .15 0
- 1JFF -.00197 .302 .19 0
r-. r- ~ -.00175 .323 .17 0 ~
._,r ~
9 JFF -.00961 .299 .24 0
it) I OFF -.00296 .280 .24 0
i j OFF -.01225 .271 -.23 0
12 I OFF -.00845 .255 -.15 0
13 i orr rr -.00693 .361 -.24 0 I I
1.-1 I ""t
I OFF -.00848 .297 -.36 0
15 OFF -.01489 .295 -.23 0
15 I
OFF I -.00123 .380 -.35 0
'- OFF -.00509 .253 .026 0 . '
Total current 0
Note: :;efer to instruction sheet concerning all measurements. + tAeasurements require a portable voltmeter.
Instant-off Reference cell (volts)*
Reber toke;
0 emorks
c'coe measurements were '_.S.i'"'1C c oortable voltmeter
bstx2(w 1-fl)
I
I
)
)
TABLE 6
MAINTENANCE DATA SHEET
Bridge Deck Identification: lJS 87 Railroad Overpass - Howard Cotmty, Big Spring, Texas
Rectifier Location: N.E. Abutment Wall Deck Condition :-.l..LLf---------------
Dote: _ __:_1.:::.0t-/-=.2.:::.8t-/.:=.8.:::.8 __ _ Time:--------- Ambient Temperature: __ 5>..L..,!5_0
_LF ___ _
Tester( s): _ _.:_T:...:R _____________ _ Rectifier Model No.: TIACE 40/20-1 0( 17)DGNPSZ DC Amps 10 (ckts 1-17)
Rectifier S/N: 88A 1 052 Type 0033052 Rectifier DC Rating: DC Volts 20 (ckts 1-13) 40 (ckts 14-17)
General Remarks: Initial energization data. Rebar probe measurements were taken
using a portable voltmeter.
Control Rebar Reference Light Probe Cell Voltai)e Current
Circuit (on/off) (volts) (volts) (volts (amps)
1 ON -.00200 .449 4.98 4.50
2 ON .00200 .588 4.71 4.00
3 ON .00200 .427 4.68 3.50
4 ON .00200 .460 4.83 4.50
5 ON .00015 .837 13.79 5.80
6 ON .00101 .644 13.63 5.80
7 ON .00202 .518 13.30 5.00
8 ON .00212 .587 14.77 4.80
9 ON .00105 .490 2.99 4.50
10 ON .00215 .429 3.51 6.00
11 ON -.00290 1.420 5.62 .35
12 ON .04550 1.220 10.95 .90
13 ON .00425 2.140 13.46 .85
14 ON .03010 2.730 6.39 .15
15 ON .00620 1.290 3.81 .25
16 ON .00967 1.050 6.85 .30
17 ON .00851 1.160 7.06 2.25
Total current 54.0
Note: Refer to instruction sheet concerning all measurements. * Measurements require a portable voltmeter.
Instant-off Reference cell (volts)• Remarks
I
.401
.416
.360
.410
.470
.479
.399
.410
.397
.355
.572
.570
.830
.610
.540
.450
.400
bstxl(wl-fl)
)
)
TABLE 7
~ ',AINTEf'~,DJ~CE DATA SHEET
Bridge Deck Identification: ;S 87 Railroad Overpass - Howard Co1mty, Big Spring, Texas
Rectifier Location: r--.J.E. .~::::utment Wall Deck Condition :-.L.LL+------------
Dote: _ ___;_1 =2~/-'-1-=5~/-=8-=8 __ _ Time:---------- Ambient Temperature: -~'""-3,_,_3_0
_j_F ___ _
Tester(s):_...:..I:....:R _____________ _ Rectifier Model No.: TIACE 40/20-1 0( 17)DG: _::::;::;:::: DC Amps 1 0 ( ckts 1- 1 7)
Rectifier S/N: 88A 1 052 -·;pe 0033052 Rectifier DC Rating: DC Volts 20 (ckts 1-13) 40 (ckts ·.:.-'-:-
General Remarks: Before :epolarization testing.
Control Rebar ! =:(eference Instant-off Light Probe :ell Current Reference cell
Circuit (on/off) (volts) I :olts) Voltoi)e (volts (amps) (volts)• Remarks
i I
i I
I I
'
1 ON .006 541 5.6 4.62
2 ON .006 7 1 1 5.3 4.11
3 ON .006 .668 5.9 3.62 '
I I 4 ON .005 .546 5.7 4.62 I
5 ON .004 i
.092 11 .4 5.98 i I
6 ON .005 i
.751 10.7 5.92 i
7 ON .005 .773 10.9 5.09
8 ON .005 .926 10.3 5.93
9 ON .005 I .551 4.1 4.46
10 ON .004 i .515 5.4 6.17
11 ON -.003 I .364 1.9 .44
i ~ut of
12 ON .0085 Scale 17.7 .98
13 ON .01 I '
.815 2.5 .86
i 14 ON .034 .464 7.8 .25
15 ON .011 I ~ .030 2.4 .33 I I
16 ON .012 I .825 6 .4
i Jut of 17 ON .013 ' 9.9 2.39 Scale
Total current 56.75
Note: Refer to instruction shee! concerning all measurements. • Measurements require a por:c:c·le voltmeter.
.511 I
.566
.532
.514
.679
.597
.573
.618
.430
.423
.485
Meter out of scale':' 1.194 reference cell meas~ '-:;rl"'-::~,;:s
.680
.797
.559
.627
Meter out of scale fer .956 reference cell measu~-::.....,er :s
I I
'
' I
I
i I
:
I
'
i
i !

)
TABLE 8
DEPOLARIZATION TEST - 45 DAYS
========= REFERENCE
CELL
=========
2
3
4
5
6
7
8
9
10 11 12 13 14 15 16
17
DECEMBER 13, 1988
======================== 4 HR POLARIZATION SHIFT
(-MVS)
======================== 143 236 229 115 333 195 226 204 175 124 175 954 265 478 226 274 597
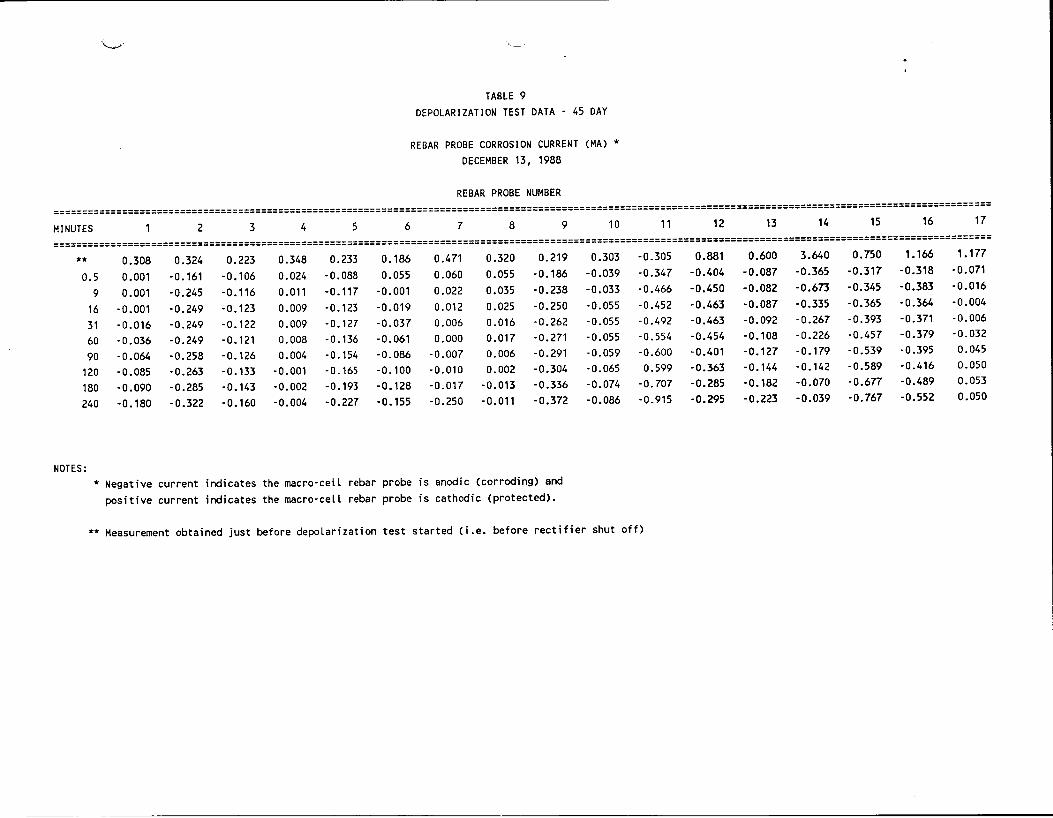
·~
TABLE 9 DEPOLARIZATION TEST DATA - 45 DAY
REBAR PROBE CORROSION CURRENT (MA) * DECEMBER 13, 1988
REBAR PROBE NUMBER
================================================================================================================================================================== MINUTES 1 2 3 4 5 6 7 8 9 10 11 12 13 14 15 16 17
================================================================================================================================================================== ** 0.308 0.324 0.223 0.348 0.233 0.186 0.471 0.320 0.219
0.5 0.001 -0.161 -0.106 0.024 -0.088 0.055 0.060 0.055 -0.186
9 0.001 -0.245 -0.116 0.011 -0.117 -0.001 0.022 0.035 -0.238
16 -0.001 -0.249 -0.123 0.009 -0.123 -0.019 0.012 0.025 -0.250
31 -0.016 -0.249 -0.122 0.009 -0.127 -0.037 0.006 0.016 -0.262
60 -0.036 -0.249 -0.121 0.008 -0.136 -0.061 0.000 0.017 -0.271
90 -0.064 -0.258 -0.126 0.004 -0. 154 -0.086 -0.007 0.006 -0.291
120 -0.085 -0.263 -0.133 -0.001 -0.165 -0.100 -0.010 0.002 -0.304
180 -0.090 -0.285 -0.143 -0.002 -0.193 -0.128 -0.017 -0.013 -0.336
240 -0.180 -0.322 -0.160 -0.004 -0.227 -0.155 -0.250 -0.011 -0.372
NOTES: * Negative current indicates the macro-cell rebar probe is anodic (corroding) and
positive current indicates the macro-cell rebar probe is cathodic (protected).
0.303 -0.305 -0.039 -0.347 -0.033 -0.466
-0.055 -0.452 -0.055 -0.492 -0.055 -0.554 -0.059 -0.600 -0.065 0.599 -0.074 -0.707 -0.086 -0.915
**Measurement obtained just before depolarization test started (i.e. before rectifier shut off)
0.881 0.600 3.640 0.750 1.166 1.177
-0.404 -0.087 -0.365 -0.317 -0.318 -0.071
-0.450 -0.082 -0.673 -0.345 -0.383 -0.016
-0.463 -0.087 -0.335 -0.365 -0.364 -0.004
-0.463 -0.092 -0.267 -0.393 -0.371 -0.006
-0.454 -0.108 -0.226 -0.457 -0.379 -0.032
-0.401 -0. 127 -0.179 -0.539 -0.395 0.045
-0.363 -0.144 -0.142 -0.589 -0.416 0.050
-0.285 -0.182 -0.070 -0.677 -0.489 0.053
-0.295 -0.223 -0.039 -0.767 -0.552 0.050

)
)
TABLE 10
CORROSION RATE DATA RESULTS - 45 DAYS DECEMBER 14, 1988
TEMP: 45 DEGREES F DECK DRY
====================================================================================== ECORR POLARIZATION CORROSION CURRENT RATE OF CORROSION
LOCATION ( -MVS) RESISTANCE (MA) (MPY)
(OHM)
====================================================================================== LP1 145 28.25 1.44 0.7
LP2 137 51.94 0.78 0.3
LP3 166 24.34 1.67 0.8
LP4 145 22.63 1.80 0.8
LP5 174 28.11 1.45 0.7
LP6 280 14.24 2.86 1.4
LP7 117 11.26 3.61 1.7
LP8 143 13.80 2.95 1.4
LP9 202 29.16 1.39 0.6
LP10 89 20.89 1.95 0.9
LP11 156 11.26 3.61 1. 7
LP12 202 12.45 3.27 1.6
LP13 193 14.74 2.76 1.3
LP14 127 14.35 2.84 1.3
LP15 139 16.83 2.42 1.1
LP16 164 10.04 4.05 1.9
LP17 157 14.20 2.87 1.4
LP18 272 13.30 3.05 1.4
LP19 233 11.90 3.42 1.6
LP20 232 9.95 4.09 2.0
D1N 382 94.39 0.43 0.2
D1S 352 160.71 0.38 0.1
D2N 491 409.06 0.09 0.0
D2S 360 245.43 0.16 0.0
D3N 290 153.39 0.26 0.1
D3S 219 93.39 0.43 0.2
D4N 494 144.37 0.28 0.1
D4S 485 29.21 1.39 0.6
D5N 238 31.46 1.29 0.6
D5N 263 35.78 0.73 0.3
D6N 258 90.90 0.44 0.2
D6S 178 33.62 1.21 0.5
EN 326 76.69 0.53 0.2
ES 301 33.62 1.22 0.5
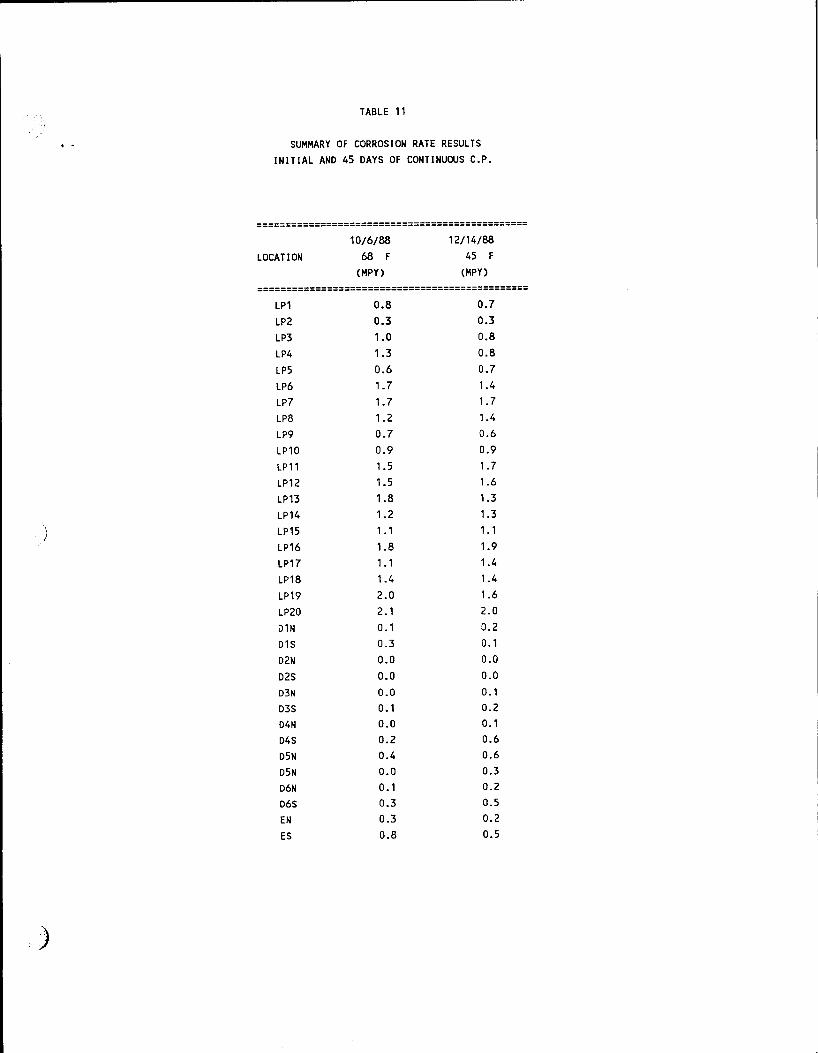
TABLE 11
SUMMARY OF CORROSION RATE RESULTS INITIAL AND 45 DAYS OF CONTINUOUS C.P.
===============================================
LOCATION 10/6/88
68 F
CMPY>
12/14/88 45 F
(MPY)
=============================================== LP1 0.8 0.7
LP2 0.3 0.3
LP3 1.0 0.8
LP4 1.3 0.8
LP5 0.6 0.7
LP6 1. 7 1.4
LP7 1.7 1.7
LP8 1.2 1.4
LP9 0.7 0.6
LP10 0.9 0.9
LP11 1 .5 1.7
LP12 1.5 1.6
LP13 1.8 1.3
LP14 1.2 1.3
LP15 1.1 1. 1
LP16 1.8 1.9
LP17 1.1 1.4
LP18 1.4 1.4
LP19 2.0 1.6
LP20 2.1 2.0
D1N 0.1 0.2
D1S 0.3 0.1
D2N 0.0 0.0
D2S 0.0 0.0
D3N 0.0 0.1
D3S 0.1 0.2
D4N 0.0 0.1
D4S 0.2 0.6
D5N 0.4 0.6
D5N 0.0 0.3
D6N 0.1 0.2
D6S 0.3 0.5
EN 0.3 0.2
ES 0.8 0.5
-----CKT
===== 1 2 3 4 5 6 7 8
9 10 11 12
) 13 14 15 16 17
)
TABLE 12
SUMMARY OF RESISTANCE MEASUREMENTS (OHMS) INITIAL AND 45 DAY
INITIAL 45 DAY
OCTOBER 5, 1988 DECEMBER 13, 1988
================================= ================================== ANODE/ ANODE/ RC/ RP/ ANODE/ ANODE/ RC/ RP/
TOTAL INDV. RCG RPG TOTAL TOTAL RCG RPG
GRND GRND GRND GRND
================================= ================================== 0.67 1.30 520 91 0.67 1.30 1200 220
0.67 1.30 430 160 0.68 1.50 1200 350
0.69 1.30 1100 360 0.73 1.40 2600 780
0.64 1.25 560 290 0.67 1.30 1100 700
0.75 1.20 820 150 0.77 1.30 1800 300
0.70 1.20 1300 110 0.75 1.30 3100 240
0.73 1.20 1300 370 0.83 1.30 2900 900
0.61 1.00 1300 310 0.76 1.20 3500 740
0.29 0.35 580 130 0.31 0.34 1500 280
0.30 0.34 2000 300 0.32 0.37 4100 720
2.80 2.00 790 130 2.95 2.00 720 220
5.50 6.00 300 100 5.65 6.20 1200 350
1.80 2.00 470 110 1.90 2.30 1150 260
9.40 9.70 420 170 15.00 15.00 690 450
2.70 3.00 1100 97 2.90 3.00 1800 200
3.40 3.60 460 130 4.80 4.90 1700 400
1.60 1.80 1100 200 2.30 2.40 1700 570

TABLE 13
SUMMARY OF PROTECTIVE CURRENT SETTINGS INITIAL AND 45 DAYS
INITIAL 45 DAYS
NOVEMBER 1988 DECEMBER 1988
---- ========== ============================================ ===================== CONCRETE ELOGI ELOGI ACTUAL CURRENT CURRENT
SURFACE CURRENT CURRENT CURRENT DENSITY CURRENT DENSITY
CKT AREA (A) DENSITY SETTING (MA/SQ FT) SETTING (MA/SQ FT)
(FT SQ) (mA/sq ft) (A) (A)
---- ========== ============================================ ===================== 1 2884 5.124 1.78 4.5 1.56 4.50 1.56
2 2884 4.099 1.42 4.0 1.39 3.50 1 .21
3 2884 4.899 1. 70 3.5 1.21 3.20 1.11
4 2884 7.746 2.69 4.5 1.56 4.50 1.56
5 2884 5.997 2.08 5.8 2.01 5.00 1.73
6 2884 9.246 3.21 5.8 2.01 5.50 1. 91
7 2884 6.697 2.32 5.0 1. 73 4.70 1.63
8 2884 6.697 2.32 5.8 2.01 5.50 1.91
9 4704 4.845 1.03 4.5 0.96 4.20 0.89
10 4704 6.797 2.36 6.0 1.28 6.00 1.28
11 412 0.590 1.43 0.4 0.85 0.30 0. 73
12 1648 0.940 0.57 0.9 0.55 0.35 0.21
13 1854 0.730 0.39 0.9 0.46 0.50 0.27 \
) 14 168 0.345 2.05 0.2 0.89 0.10 0.60
15 672 0.424 0.63 0.3 0.37 0.25 * 0.37
16 756 0.220 0.29 0.3 0.4 0.20 0.26
17 1180 4.299 3.64 2.3 1.91 1.50 1.27
* MINIMUM CURRENT OUTPUT ALLOWED BY THE CONTROL CARD OF THE CIRCUIT
)

)
)
TABLE 14
MAINTENAI~CE DATA SHEET
Bridge Deck Identification: US 87 Railroad Overpass - Howard County, Big Spring, Texas
Rectifier Location: N.E. Abutment Wall Deck Condition:-..L-l.l.-7------------
Dote: ---'--1 =2 ,_/-'--1 =5,_/=8=8 __ _ Time:---------- Ambient Temperature: -~3'-'-3'--o---'-F ___ _
Tester(s):_..:..T:....:R _____________ _ Rectifier Model No.: TIACE 40/20-1 0(17)DGNPSZ DC Amps 10 (ckts 1-17)
Rectifier S/N: 88A 1052 Type 0033052 Rectifier DC Rating: DC Volts 20 (ckts 1-13) 40 (ckts 14-17)
General Remarks: Re-energization data taken after testing was completed.
Control Rebar Reference Light Probe Cell VoltaGe Current
Circuit (on/off) (volts) (volts) (volts (cm::Js)
1 ON .010 .501 5.20 L.50
2 ON .007 .640 4.60 3.48
3 ON .004 .596 5.10 3.19
4 ON .005 .510 5.20 4.50
5 ON .004 .978 10.20 5.01
6 ON .004 .758 10.40 5.50
7 O~J .004 .628 11.20 ..!..7i
8 ON .004 .825 11.00 5.51
9 ON .004 .536 3.50 4.20
10 ON .004 .487 4.90 6.03
11 ON .010 .700 2.40 .38
12 ON .041 Out of
7.20 .33 Scale
13 ON .011 .758 2.10 .49
14 ON .016 .926 2.40 .08
15 ON .011 .712 1.50 .24
16 ON .012 .605 2.70 .20
17 ON .011 1.945 7.30 1 .52
Total current 49.90
Note: Refer to instruction sheet concerning all measurements. * Measurements require a portable voltmeter.
Instant-off Reference cell (volts)• Remarks
.450
.489
.461
.456
.612
.558
.479
.545
.426
.404
.490
.917 Meter out of scale cell measurement.
.624
.499
.491
.479
.691
for reference
bstx4(w1-fl)

)
I
TABLE 15
iv1AINTENANCE DATA SHEET
Bridge Deck Identification: lJS 87 Railroad Overpass - Howard Cmmty Big Spring, Iexa"
Rectifier Location: N.E. Lbutment Wall Deck Condition:-.LLL-f------------
Date:_-----'-1._/=3--'-1._/=8-=-9 __ _ Time: ---"'8'-'-: .=.2.::0---'--'AC!.!M_,__ __ _ Am bien t Temperature: ----'4_,_5,_0
---~..F ___ _
Tester(s): _ _:_I:....:R'--------------
Rectifier S/N: 88A 1 052 Type 0033052
General Remarks: Before depolarization testing.
Control Rebar I
Reference I
Rectifier Model No.: TIACE 40/20-1 0( 1 7)DG~:PSZ DC Amps 10 (ckts 1-17)
Rectifier DC Rating: DC Volts 20 (ckts 1-13) 40 (ckts 14-17)
Instant-off Cell Current Reference cell Light Probe i Volta~{ I Circuit (on/ off) (volts) fvolts) (volts (amps) (volts)• Remarks
i I
i I i I
i
i
1 ON .005 .::08 5.4 4.44
2 ON .004 .616 4.8 3.44
3 ON .002 !
.557 5.4 3.15
4 ON .004 i .505 5.5 4.44 I :
5 ON .004 1.055 10.0 4.97
6 ON .003 .822 9.8 5.45
7 ON .006 .734 10.4 4.67
8 ON .006 .840 9.7 5.46
9 ON .004 ! .522 3.6 4.13
10 ON !
.005 ' .511 5.0 5.96 '
11 ON -.002 .451 9.2 .36
12 ON .010 ' .661 24.8 .22
13 ON .011 I .774 4.7 .47 i
14 ON .011 .676 5.1 .11 ' I
15 ON .006 I .52.3 2.1 .25 I 16 ON .008 i
I .508 3.0 .19
' 17 ON .011 I 1.929 7.9 1.49
Total current 48.9
Note: Refer to instruction sneet concerning all measurements. • Measurements require a portable voltmeter.
.440
.465
.425
.443
.636
.596
.520
.563
.411
.434
.359
.530
.673
.500
.405
.440
.795
bst:.c:.' Nl-fl)
I I
'
========= REFERENCE
CELL
=========
2 3
4
5
6
7
8
9
10 11 12 13
14 15 16 17
TABLE 16
SUMMARY OF DEPOLARIZATION TESTS 45 AND 90 DAYS
45 DAY DECEMBER 13, 1988
======================== 4 HR POLARIZATION SHIFT
(-MVS)
======================== 143 236 229 115 333 195 226 204 175 124 175 954 265 478 226 274 597
90 DAY JANUARY 31, 1989
======================== 4 HR POLARIZATION SHIFT
(-MVS)
======================== 129 189 179 104 347 253 221 216 156 153 113 313 386
250 132 157 338

'"----' · .... __.__-·
TABLE 17 DEPOLARIZATION TEST DATA - 90 DAY
REBAR PROBE CORROSION CURRENT (MA) JANUARY 31, 1989
REBAR PROBE NUMBER
==================================================================================================================================================================== 17
MINUTES 1 2 3 4 5 6 7 8 9 10 11 12 13 14 15 16
==================================================================================================================================================================== 0 0.299 0.243 0.210 0.364 0.306 0.085 0.496 0.329 0.223 0.336 -0.015 0. 773 0.829 1.023 0.298 0.556 0.980
0.5 0.040 0.001 -0.105 0.040 -0.039 0.030 0.082 0.061 -0.113 -0.037 -0.892 0.455 -0.138 -0.199 -0.300 -0.214 -0.062
1 0.025 -0.234 -0.150 0.005 -0.108 -0.012 0.048 0.023 -0.145 -0.064 -0.938 -0.053 -0.139 -0.214 -0.304 -0.247 -0.035
5 0.024 -0.259 -0.156 0.001 -0.114 -0.033 0.031 0.011 -0.214 -0.069 -0.961 0.045 -0.141 -0.212 -0.306 -0.264 -0.009
15 0.012 -0.279 -0.155 -0.002 -0.113 -0.070 0.012 0.003 -0.234 -0.067 -1 . 011 0.048 -0.136 -0.198 -0.326 -0.267 0.022
30 0.000 -0.280 -0.155 -0.002 -0.113 -0.098 0.006 -0.001 -0.244 -0.063 -1.061 0.106 -0.138 -0.178 -0.345 -0.264 0.055
60 -0.030 -0.289 -0. 155 -0.004 -0.112 -0.129 -0.001 -0.006 -0.257 -0.062 -1 . 140 0.027 -0. 152 -0.103 -0.362 -0.260 0.081
120 -0.087 -0.311 -0.165 -0.011 -0.147 -0.187 -0.008 -0.019 -0.288 -0.069 -1.327 0.013 -0.184 -0.003 -0.406 -0.241 0.095
180 -0.133 -0.342 -0.182 -0.015 -0.173 -0.227 -0.016 -0.028 -0.319 -0.079 -1.417 -0.003 -0.202 -0.015 -0.446 -0.243 0.097
240 -0.190 -0.387 -0.209 -0.025 -0.209 -0.277 -0.027 -0.043 -0.359 -0.095 -1.418 -0.016 -0.219 -0.016 -0.520 -0.250 0.095
)
TABLE 18
CORROSION RATE DATA RESULTS - 90 DAY FEBRUARY 2, 1989
TEMP: 68 DEGREES F DECK DRY
======================================================================================== ECORR POLARIZATION CORROSION CURRENT RATE OF CORROSION
LOCATION (-MVS) RESISTANCE (MA) (MPY)
(OHMS)
======================================================================================== LP1 118 32.65 1.24 0.6
LP2 105 60.24 0.67 0.3
LP3 136 24.45 1.66 0.8
LP4 99 22.91 1.77 0.8
LP5 140 30.47 1.33 0.6
LP6 246 9.21 4.42 2.1
LP7 85 20.89 1.95 0.9
LP8 101 17.36 2.34 1.1
LP9 170 22.08 1.84 0.9
LP10 33 16.93 2.40 1.1
LP11 130 9.09 4.48 2.1
LP12 180 16.99 2.40 1.1
LP13 175 13.04 3.12 1.5
LP14 119 13.14 3.10 1.5
LP15 116 16.57 2.45 1.2
LP16 148 11.60 3.51 1. 7
LP17 133 17.36 2.34 1.1
LP18 237 13.87 2.93 1.4
LP19 214 10.19 4.00 1.9
LP20 200 10.75 3.79 1.8
D1N 178 311.66 0.13 0.0
D1S 160 311.66 0.13 0.0
D2N 376 346.49 0.11 0.0
D2S 255 311.66 0.13 0.0
D3N 240 167.82 0.24 0.1
D3S 195 167.82 0.24 0.1
D4N 278 545.41 0.07 0.0
D4S 500 727.22 0.05 0.0
D5N 285 54.54 0.74 0.3
D5N 330 75.22 0.54 0.2
D6N 221 94.85 0.42 0.2
D6S 120 311.66 0.13 0.0
EN 210 83.91 0.48 0.2
ES 191 62.33 0.65 0.3
NOTE: ALL D & E LOCATIONS YERE TESTED USING A PORTABLE RATE OF CORROSION PROBE YITH A COPPER/COPPER SULFATE REFERENCE CELL
i
I /
TABLE 19
SUMMARY OF CORROSION RATE RESULTS INITIAL, 45 AND 90 DAY
============================================================ 10/6/88 12/14/88 2/2/89
LOCATION 68 F 45 F 65 F
(MPY) (HPY) (HPY)
============================================================ LP1 0.8 0.7 0.6
LP2 0.3 0.3 0.3
LP3 1.0 0.8 0.8
LP4 1.3 0.8 0.8
LP5 0.6 0.7 0.6
LP6 1.7 1.4 2.1
LP7 1. 7 1.7 0.9
LP8 1.2 1.4 1.1
LP9 0.7 0.6 0.9
LP10 0.9 0.9 1.1
LP11 1.5 1. 7 2.1
LP12 1.5 1.6 1.1
LP13 1.8 1.3 1.5
LP14 1.2 1.3 1.5
LP15 1. 1 1.1 1.2
LP16 1.8 1.9 1.7
LP17 1.1 1. 4 1 . 1
LP18 1.4 1.4 1.4
LP19 2.0 1.6 1.9
LP20 2.1 2.0 1.8
D1N 0.1 0.2 0.0
D1S 0.3 0.1 0.0
D2N 0.0 0.0 0.0
D2S 0.0 0.0 0.0
D3N 0.0 0.1 0.1
D3S 0.1 0.2 0.1
D4N 0.0 0.1 0.0
D4S 0.2 0.6 0.0
D5N 0.4 0.6 0.3
D5N 0.0 0.3 0.2
D6N 0.1 0.2 0.2
D6S 0.3 0.5 0.0
EN 0.3 0.2 0.2
ES 0.8 0.5 0.3
NOTE: All D & E locations were tested using a portable rate of corrosion probe with a copper/copper sulfate reference cell.

TABLE 20
SUMMARY OF RESISTANCE MEASUREMENTS (OHMS) INITIAL, 45 AND 90 DAY
INITIAL 45 DAY 90 DAY OCTOBER 5, 1988 DECEMBER 13, 1988 JANUARY 31, 1989
----- ================================= ================================== ================================== CKT ANODE/ ANODE/ RC/ RP/ ANODE/ ANODE/ RC/ RP/ ANODE/ ANODE/ RC/ RP/
TOTAL !NOV. RCG RPG TOTAL TOTAL RCG RPG TOTAL INDV. RCG RPG GRND GRND GRND GRND GRND GRND
----- ================================= ================================== ================================== 0.67 1.30 520 91 0.67 1.30 1200 220 0.68 1.40 1100 185
2 0.67 1.30 430 160 0.68 1.50 1200 350 0.68 1.45 1200 207 3 0.69 1.30 1100 360 0.73 1.40 2600 780 0.78 1.40 2300 585 4 0.64 1.25 560 290 0.67 1.30 1100 700 0.67 1.30 1100 520 5 0. 75 1. 20 820 150 0.77 1.30 1800 300 0.73 1.20 1500 250 6 0.70 1.20 1300 110 0.75 1.30 3100 240 0.67 1.20 3400 190 7 0.73 1.20 1300 370 0.83 1.30 2900 900 0.75 1.20 2400 750 8 0.61 1.00 1300 310 0.76 1.20 3500 740 0.63 1.05 3200 560 9 0.29 0.35 580 130 0.31 0.34 1500 280 0.30 0.38 1400 230
10 0.30 0.34 2000 300 0.32 0.37 4100 720 0.35 0.40 3900 525 11 2.80 2.00 790 130 2.95 2.00 720 220 14.00 15.50 890 165 12 5.50 6.00 300 100 5.65 6.20 1200 350 31.00 31.00 1050 250 13 1.80 2.00 470 110 1.90 2.30 1150 260 2.80 3.10 1050 220
) 14 9.40 9.70 420 170 15.00 15.00 690 450 18.00 17.50 590 350 15 2.70 3.00 1100 97 2.90 3.00 1800 200 2.00 2.10 1200 175 16 3.40 3.60 460 130 4.80 4.90 1700 400 4.50 2.10 1300 330 17 1.60 1.80 1100 200 2.30 2.40 1700 570 2.30 2.30 1500 550
)

)
)
'·
I
TABLE 21
MAINTEI~ANCE DATA SHEET
Briage Deck Identification: lJS 87 Railroad Overpass - Howard Cotmty, Big Spring, Texas
Rec:'fier Location: N.E. Abutment Wall Deck Condition:-..L..Ll.-'f------------
Dote: ----=--2'-/-'-1'-/.::.8.:::..9 ___ _ Time· ---=2'-'-:=2-"'0---'-P...:..:M..:........ __ _ Ambient Temperature: --'-"--.....J...._-__ _
Tester(s):_..:._T;....:R _____________ _
Rect:fier S/t-.J: 88A 1 052 Type 0033052
General Remarks: Re-energization data.
Control Rebar Reference
Rectifier Model No.: TIACE 40/20-10(17)DGNPSZ DC Amps 10 (ckts 1-17)
Rectifier DC Rating: DC Volts 20 (ckts 1-13) 40 (ckts 14-17)
Instant-off I ~ .
I Light Probe Cell Voltai)e Current Reference cell ' - -:~.Jit !on/off) (volts) (volts) (volts (amps) (volts)+ Remarks
I
i i
I
I
I I
: I I
I
i
!
I
I
! I
! i
I
I I
l
ON .002 .404 5.4 4.80
-, ON .005 .508 4,6 3.55 -
-, ON .005 .441 4.8 3.26 -
1 ON .005 .428 5.3 4.81 ..,. '
5 ON .005 .521 6.4 4.88
s ON .002 .372 6.5 5.32
- ON .006 .482 6.8 4.78
::: ON .005 .577 6.7 5.56 -
~ ON .003 .406 2.7 4.26
~0 i ON .005 .379 3.6 6.07
~ 1 : ON -.012 .311 9.7 .36
~ 2 ON .006 .353 15.8 .32
. 3 ON .011 .653 2.5 .45
i 14 I ON .028 .864 3.0 .13
15 i ON .002 .349 .8 .41 ! I
16 I ON .014 .434 1.9 .25 I
"7 ON .013 1.335 5.5 1.29
Total current 50.2
· ;ote: :::efer to instruction sheet concerning all measurements. - Measurements require a portable voltmeter.
.371
.395
.380
.389
.420
.337
.388
.451
.351
.325
.312
.328
.569
.554
.289
.365
.690
bstx6(w 1-fl)

) J
TABLE 22
MAINTENANCE. DATA SHEET
Bridge Deck Identification: lJS 87 Railroad Overpass - Howard Cotmty, Big Spring, Texas
Rectifier Location: N.E. Abutment Wall Deck Condition:-.LJ.L:j-------------
Date:_-=2~.-/=2~.-/=8=9 ___ _ Time: _ __,8""':-"'3'-'=0'---'-'AC.!M_,__ ___ _ C.:-: 0 F Ambient Temperature: _ _.>.L,J..:..L_L ____ _
Tester(s):_..:.T:...:R,__ ____________ _ Rectifier Model No.: TIACE 40/20-1 0( 17)DGNPSZ DC Amps 10 (ckts 1-17)
Rectifier S/N: 88A 1052 Type 0033052 Rectifier DC Rating: DC Volts 20 (ckts 1-13) 40 (ckts 14-17)
General Remarks: ---------------------------------
Control Rebar Reference
I Light Probe Cell Voltai)e Current Circuit (on/ off) (volts) (volts) (volts (amos)
1 ON .004 .479 5.5 ! 4.85
2 ON .004 .574 4.7 I 3.56
3 ON .005 .501 5.1 I
3.28 I 4 ON .004 .485 5.5 4.86
5 ON .003 .901 9.3 I
4.91 I !
6 ON .007 .692 9.3 I 5.34 I
7 ON .005 .666 9.6 j 4.81
8 ON .003 .710 9.0 i 5.61 !
9 ON .005 .475 3.4 I 4.29
10 ON .005 .463 4.5 6.13
1 1 ON -.010 .318 19.5 0.42
12 ON .008 .337 24.9 I 0.25
13 ON .015 .675 4.1 I 0.46
14 ON .015 .752 5.6 0.15
15 ON .000 .315 0.9 0.45
16 ON .008 .518 3.3 0.28
17 ON .009 1.209 7.0 1.31
Total current 50.70
Note: Refer to instruction sheet concerning all measurements. * Measurements require a portable voltmeter.
Instant-off Reference cell (volts)• Remarks
I .418
.449
.392
.433
.570
.499
.482
.506
.387
.395
.311
.317
.596
.536
.285
.444
.740
bstx7(w 1-fl)
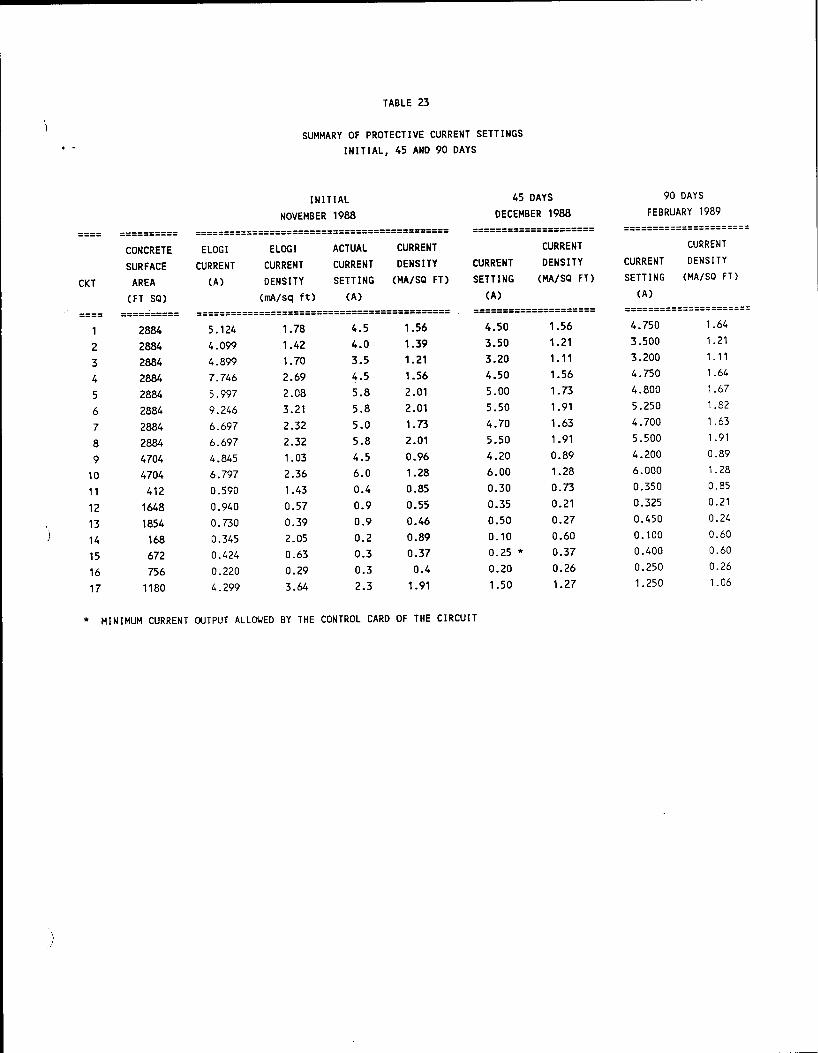
TABLE 23
SUMMARY OF PROTECTIVE CURRENT SETTINGS INITIAL, 45 AND 90 DAYS
INITIAL 45 DAYS 90 DAYS
NOVEMBER 1988 DECEMBER 1988 FEBRUARY 1989
---- ========== ============================================ ===================== ====================== CONCRETE ELOGI ELOGI ACTUAL CURRENT CURRENT CURRENT
SURFACE CURRENT CURRENT CURRENT DENSITY CURRENT DENSITY CURRENT DENSITY
CKT AREA (A) DENSITY SETTING (MA/SQ FT) SETTING (MA/SQ FT) SETTING (MA/SO FT)
(FT SQ) (mA/sq ft) (A) (A) (A)
---- ========== ============================================ ===================== ====================== 1 2884 5.124 1.78 4.5 1.56 4.50 1.56 4.750 1.64
2 2884 4.099 1.42 4.0 1.39 3.50 1.21 3.500 1. 21
3 2884 4.899 1. 70 3.5 1.21 3.20 1.11 3.200 1.11
4 2884 7.746 2.69 4.5 1.56 4.50 1.56 4.750 1.64
5 2884 5.997 2.08 5.8 2.01 5.00 1.73 4.800 1.67
6 2884 9.246 3.21 5.8 2.01 5.50 1.91 5.250 1.82
7 2884 6.697 2.32 5.0 1.73 4.70 1.63 4.700 1.63
8 2884 6.697 2.32 5.8 2.01 5.50 1.91 5.500 1. 91
9 4704 4.845 1.03 4.5 0.96 4.20 0.89 4.200 0.89
10 4704 6.797 2.36 6.0 1.28 6.00 1.28 6.000 1.28
11 412 0.590 1.43 0.4 0.85 0.30 0.73 0.350 0.85
12 1648 0.940 0.57 0.9 0.55 0.35 0.21 0.325 0.21
13 1854 0. 730 0.39 0.9 0.46 0.50 0.27 0.450 0.24
14 168 0.345 2.05 0.2 0.89 0.10 0.60 0.100 0.60
15 672 0.424 0.63 0.3 0.37 0.25 * 0.37 0.400 0.60
16 756 0.220 0.29 0.3 0.4 0.20 0.26 0.250 0.26
17 1180 4.299 3.64 2.3 1.91 1.50 1.27 1.250 1.06
* MINIMUM CURRENT OUTPUT ALLOWED BY THE CONTROL CARD OF THE CIRCUIT

FIGURES

b==================================================================== ELOGI COMPUTED CORROSION AND CATHODIC PROTECTION DATA
BIG SPRING - TX ZONE A1
TAFEL SLOPE ICORR ECORR I PROTECT EPROTECT
= = = = =
183.67 MILLIVOLTS/DECADE 2724.63 MILLIAMPS
-360 MILLIVOLTS 5123.58 MILLIAMPS -410.38 MILLIVOLTS
=====================================================================
j
\ )
/
EVALUATION OF DATA FOR TAFEL LINE OF BEST FIT
STANDARD ERROR OF Y ESTIMATE COEFFICIENT OF DETERMINATION (R SQUARED) NO. OF OBSERVATIONS USED
= = =
0.428166 0.999061
11 =====================================================================
490
480
470
460
450 ,_....,_ Ill > 440 E I
'--" 430 _j
<(
I- 420 z w I- 410 0 ()_
400
390
380
370
360
0
EPROTECT
0
MEASURED CURRENT
ELOGI ZONE A 1
2
LOG OF CURRENT (m.a.)
3
I I
ICR IPRT 4
+ LIN REG. CURRENT
FIGURE 1

'.)===================================================================== ELOGI COMPUTED CORROSION AND CATHODIC PROTECTION DATA
BIG SPRING - TX ZONE A2
TAFEL SLOPE ICORR ECORR I PROTECT EPROTECT
= = = = =
248.99 MILLIVOLTS/DECADE 1225.44 MILLIAMPS
-312 MILLIVOLTS 4098.69 MILLIAMPS -442.56 MILLIVOLTS
=====================================================================
EVALUATION OF DATA FOR TAFEL LINE OF BEST FIT
STANDARD ERROR OF Y ESTIMATE COEFFICIENT OF DETERMINATION (R SQUARED) NO. OF OBSERVATIONS USED
= = =
0.432262 0.999685
15 ===============================~=====================================
ELOGI ZONE A2
580
560 ~ I
I 540 _;
) J
520 J I
5CO .J I I
"' 480 -If)
~ 460 -I '.../
7 EPROTECT _j 440 1 <(
' f-z 420 ~ w f-0
400 ' ()_
I
380 -1 i I
360 - I I
340 ~ i
320 _; ~
300
0 2 3 )
LOG OF CURRENT (m.o.) r-, MEASURED CURRENT + LIN REG. CURRENT
FIGURE 2

h ...
-=====================================================================
)
ELOGI COMPUTED CORROSION AND CATHODIC PROTECTION DATA BIG SPRING - TX ZONE A3
TAFEL SLOPE ICORR ECORR I PROTECT EPROTECT
= = = = =
205.94 MILLIVOLTS/DECADE 1113.33 MILLIAMPS
-262 MILLIVOLTS 4898.84 MILLIAMPS -394.52 MILLIVOLTS
=====================================================================
EVALUATION OF DATA FOR TAFEL LINE OF BEST FIT
STANDARD ERROR OF Y ESTIMATE COEFFICIENT OF DETERMINATION (R SQUARED) NO. OF OBSERVATIONS USED
= = =
0.574852 0.999392
14 ===========================================================~=========
ELOGI ZONE A3
470 460
450
440 430 420 410
/"'. 400 EPROTECT
Ill 390 >
t 380 I '--'
_j 370
<( 360 i= z 350 w 1- 340 0 ()_
330 320 310 300
290
280 270 260
0 2 ~R IPRT 4
LOG OF CURRENT (m.o.) 0 MEASURED CURRENT + LIN REG. CURRENT
FIGURE 3

===================================================================== ELOGI COMPUTED CORROSION AND CATHODIC PROTECTION DATA
BIG SPRING - TX ZONE A4 -~~------------------------------------------------------------------
TAFEL SLOPE ICORR ECORR !PROTECT EPROTECT
= = = = =
168.84 MILLIVOLTS/DECADE 3019.33 MILLIAMPS
-361 MILLIVOLTS 7746.05 MILLIAMPS -430.09 MILLIVOLTS
=====================================================================
EVALUATION OF DATA FOR TAFEL LINE OF BEST FIT
STANDARD ERROR OF Y ESTIMATE COEFFICIENT OF DETERMINATION (R SQUARED) NO. OF OBSERVATIONS USED
= = =
0.261714 0.999568
8 ================~====================================================
ELOGI ZONE A4
470
460
I 450 ~
440
"""' EPROTECT
(j) 430 > t I 420 '-./
__j <(
i= 410 z w f-0 400 Q_
390
380
370
360
0 2 3 ICR IPRT4
LOG OF CURRENT (m.o.) 0 MEASURE0 CURRENT + LIN REG. CURRENT
FIGURE 4

===================================================================== ELOGI COMPUTED CORROSION AND CATHODIC PROTECTION DATA
BIG SPRING - TX ZONE B1
TAFEL SLOPE ICORR ECORR I PROTECT EPROTECT
= =
= =
163.79 MILLIVOLTS/DECADE 1914.98 MILLIAMPS
-330 MILLIVOLTS 5996.69 MILLIAMPS -411.20 MILLIVOLTS
=====================================================================
)
EVALUATION OF DATA FOR TAFEL LINE OF BEST FIT
STANDARD ERROR OF Y ESTIMATE COEFFICIENT OF DETERMINATION (R SQUARED) NO. OF OBSERVATIONS USED
= = =
0.398491 0.998958
10 =====================================================================
470
460
450
440
430
- 420 > - EPROTECT -- 410
< 400 -..,. :.J 390 --' 380
370
360
350
340
330
0
0 MEASURED CURRENT
ELOGI ZONE 81
2 3
LOG OF CURRENT (m.a.)
J! :J +
!:J-/-__;J .
,;... + 0 I
:J . + 0 . Zi +
:zj t
I / f
ICR
+ LIN REG. =uRPC:';T
FIGURE 5
I I
IPRT 4

',
!===================================================================== ELOGI COMPUTED CORROSION AND CATHODIC PROTECTION DATA
BIG SPRING - TX ZONE B2
TAFEL SLOPE ICORR ECORR I PROTECT EPROTECT
= = = = =
152.85 MILLIVOLTS/DECADE 3152.79 MILLIAMPS
-347 MILLIVOLTS 9246.39 MILLIAMPS -418.43 MILLIVOLTS
=====================================================================
;
EVALUATION OF DATA FOR TAFEL LINE OF BEST FIT
STANDARD ERROR OF Y ESTIMATE COEFFICIENT OF DETERMINATION (R SQUARED) NO. OF OBSERVATIONS USED
= = =
0.411787 0.998130
6 =====================================================================
E~:JGI zc~~E B2
440
430
420 EPROTECT
410 /'-,
If)
> t 400 I
'-'
_j 390 <(
f-z w
380 f-0 (l_
370
360
350
340
0 2 3 ICR IP~T
LOG OF CURRENT (m.a.) 0 MEASURED CURRENT + LIN REG. CURRENT
FIGURE 6

===================================================================== ELOGI COMPUTED CORROSION AND CATHODIC PROTECTION DATA
BIG SPRING - TX ZONE B3
TAFEL SLOPE ICORR ECORR !PROTECT EPROTECT
= = = = =
274.73 MILLIVOLTS/DECADE 2085.94 MILLIAMPS
-309 MILLIVOLTS 6697.10 MILLIAMPS -448.18 MILLIVOLTS
=====================================================================
EVALUATION OF DATA FOR TAFEL LINE OF BEST FIT
STANDARD ERROR OF Y ESTIMATE COEFFICIENT OF DETERMINATION (R SQUARED) NO. OF OBSERVATIONS USED
= = =
0.730709 0.999438
14 =====================================================================
ELOGI ZONE 83
540
520
500
480 ~ !
/'"'-460 ~
I]) W EPROTECT > t 440 I
I '--./
_I 420 <t: i= z w 400 f--0 (l_
380
360
340
320
300
0 2 3 ICR IPRT 4
LOG OF CURRENT (m.o.) 0 MEASURED CURRENT + LIN REG. CURRENT
FIGURE 7

===================================================================== ELOGI COMPUTED CORROSION AND CATHODIC PROTECTION DATA
BIG SPRING - TX ZONE B4
TAFEL SLOPE ICORR ECORR I PROTECT EPROTECT
= = = = =
222.54 MILLIVOLTS/DECADE 2262.67 MILLIAMPS
-325 MILLIVOLTS 6696.92 MILLIAMPS -429.88 MILLIVOLTS
=====================================================================
EVALUATION OF DATA FOR TAFEL LINE OF BEST FIT
STANDARD ERROR OF Y ESTIMATE COEFFICIENT OF DETERMINATION (R SQUARED) NO. OF OBSERVATIONS USED
= = =
0.463674 0.998732
7 ==========~==========================================================
ELOGI ZONE 84
510
500
490
480
470
460
450 '"" G1 440 > EPROTECT (""
t 430 I '-./ 420 _j
< 410 i= z 400 w 1-0 390 Q_
380
370
360
350
340
330
320
0 2 3 ICR IPRT 4
LOG OF CURRENT (m.o.) 0 MEASURED CURRENT + WI REG. CURRENT
FIGURE 8

===================================================================== ELOGI COMPUTED CORROSION AND CATHODIC PROTECTION DATA
BIG SPRING - TX ZONE C1
TAFEL SLOPE ICORR ECORR I PROTECT EPROTECT
= = = = =
187.69 MILLIVOLTS/DECADE 1156.16 MILLIAMPS
-303 MILLIVOLTS 4847.87 MILLIAMPS -419.84 MILLIVOLTS
=====================================================================
EVALUATION OF DATA FOR TAFEL LINE OF BEST FIT
STANDARD ERROR OF Y ESTIMATE COEFFICIENT OF DETERMINATION (R SQUARED) NO. OF OBSERVATIONS USED
= = =
0.394872 0.999651
15 =====================================================================
ELOG\ ZONE C1
500
490
480
) 470
460
450
440 /'"'. 430
U1 EPROTECT > t 420 I 410 '-./
_j 400 <! f= 390 z w
380 1-0 Q_ 370
360
350
340
330
320
310
300
0 2 !fR IPRT 4
LOG OF CURRENT (m.a.) 0 MEASURED CURRENT + LIN REG. CURRENT
FIGURE 9

===================================================================== ELOGI COMPUTED CORROSION AND CATHODIC PROTECTION DATA
BIG SPRING - TX ZONE C2
TAFEL SLOPE ICORR ECORR I PROTECT EPROTECT
= = = = -
156.06 MILLIVOLTS/DECADE 1727.57 MILLIAMPS
-282 MILLIVOLTS 6797.11 MILLIAMPS -374.84 MILLIVOLTS
=====================================================================
EVALUATION OF DATA FOR TAFEL LINE OF BEST FIT
STANDARD ERROR OF Y ESTIMATE COEFFICIENT OF DETERMINATION (R SQUARED) NO. OF OBSERVATIONS USED
= = =
0.732743 0.997992
12 =====================================================================
/'.
Ill > E I
_j
<(
fz w f-0 o_
ELOGI ZONE C2
~20 -----------------------------------------------------------,
'"10 ~ I
J.QO ~ l
390 ~
I -~n ' ~: ·J --; EP.:::OTECT
350 ~ i
340 ---i
I 330 --1
I 320 l
! 310 l 300 ~ 'iOO I '-~ l
I ±
1 f
J --f
J :::r
ril + + +
I
280 ~~====~~==~====~====~~~====~==t=~====~--~ 0 2 3
ICR
LOG OF CURRENT (m.a.) MEASURED CURRENT + LIN REG. CURRnn
FIGURE 10
===================================================================== ELOGI COMPUTED CORROSION AND CATHODIC PROTECTION DATA
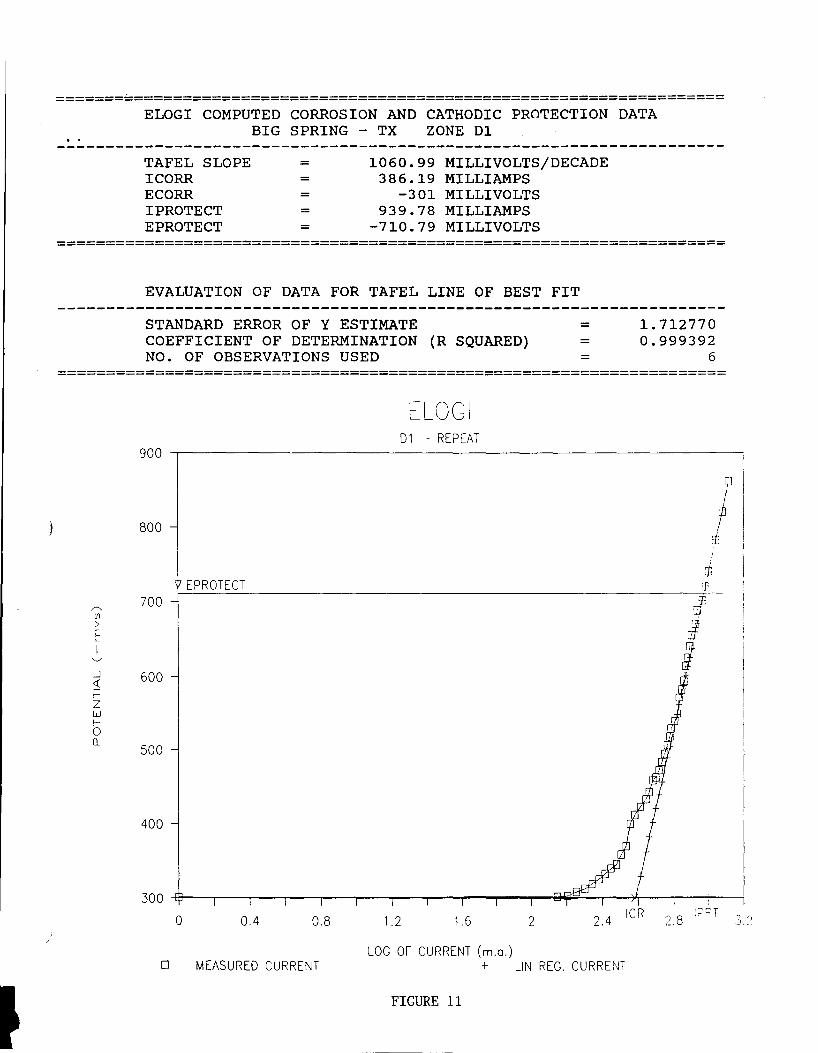
BIG SPRING - TX ZONE D1
TAFEL SLOPE = 1060.99 MILLIVOLTS/DECADE ICORR = 386.19 MILLIAMPS ECORR = -301 MILLIVOLTS I PROTECT = 939.78 MILLIAMPS EPROTECT = -710.79 MILLIVOLTS
=====================================================================
EVALUATION OF DATA FOR TAFEL LINE OF BEST FIT
STANDARD ERROR OF Y ESTIMATE COEFFICIENT OF DETERMINATION (R SQUARED) NO. OF OBSERVATIONS USED
= = =
1. 712770 0.999392
6 =====================================================================
r-. U1 > E I
_j
<1: f= z w 1-0 (l_
ELOGI 01 - REPEAT
900 ,---------------------------------------------------------~
800
EPROTECT 700
600
500
400
0 0.4 0.8
0 MEASURED CURRENT
1.2 1.6 2
LOG OF CURRENT (m.o.) + LIN REG. CURRENT
FIGURE 11
I I
'!

)
!
===================================================================== ELOGI COMPUTED CORROSION AND CATHODIC PROTECTION DATA
BIG SPRING - TX ZONE D2
TAFEL SLOPE = ICORR = ECORR = !PROTECT = EPROTECT =
1543.24 MILLIVOLTS/DECADE 328.06 MILLIAMPS
-342 MILLIVOLTS 589.92 MILLIAMPS
-735.27 MILLIVOLTS =====================================================================
EVALUATION OF DATA FOR TAFEL LINE OF BEST FIT
STANDARD ERROR OF Y ESTIMATE COEFFICIENT OF DETERMINATION (R SQUARED) NO. OF OBSERVATIONS USED
=
= =
0.849529 0.999707
7 =====================================================================
/"'.
Ul > t I
_j
<{
1-z w 1-0 0...
ELOGI 02-REPEAT
900 ~---------------------------------------------------------
800 I EPROTECT
700
600
500
400
0 0.4 0.8 1.2 1.6 2 2.4 2.8
LOG OF CURRENT (m.a.) D MEASURED CURRENT + LIN REG. CURRENT
FIGURE 12

===================================================================== ELOGI COMPUTED CORROSION AND CATHODIC PROTECTION DATA
BIG SPRING - TX ZONE D3
TAFEL SLOPE ICORR ECORR I PROTECT EPROTECT
= =
= =
343.51 MILLIVOLTS/DECADE 290.96 MILLIAMPS
-410 MILLIVOLTS 729.39 MILLIAMPS
-547.11 MILLIVOLTS =====================================================================
EVALUATION OF DATA FOR TAFEL LINE OF BEST FIT
STANDARD ERROR OF Y ESTIMATE COEFFICIENT OF DETERMINATION (R SQUARED) NO. OF OBSERVATIONS USED
= =
=
0.841697 0.999096
8 ==============================================================.=======
680
660
640
620
600
" 580 :~
> -~
560 i '.._./ EPROTECT
< 540 -z 520 w ,___
c 500 ~
480
460
440
420
400
0 0.4 0.8 )
D MEASURED CURRENT
ELOGI 03 - REPEAT
1.2 1. 6 2 2.4
LOG OF CURRENT (m.a.) + LIN REG. CUR::?::m
FIGURE 13
2.8
t 10 /I
-+8 ! /
3.2

' . ..!=====================================================================
I I
ELOGI COMPUTED CORROSION AND CATHODIC PROTECTION DATA BIG SPRING - TX ZONE D4
TAFEL SLOPE = ICORR = ECORR = I PROTECT = EPROTECT =
872.33 MILLIVOLTS/DECADE 188.79 MILLIAMPS
-307 MILLIVOLTS 344.67 MILLIAMPS
-535.06 MILLIVOLTS =====================================================================
EVALUATION OF DATA FOR TAFEL LINE OF BEST FIT
STANDARD ERROR OF Y ESTIMATE COEFFICIENT OF DETERMINATION (R SQUARED) NO. OF OBSERVATIONS USED
= = =
2.717033 0.998199
6 =====================================================================
ELOGI ZONE 04 (REPEAT)
700 ,---------------------------------------------------------~
""' If)
> E I
650
600
550
_j 500 <{
f--z w t-o 450 tl..
400
350
0 0.4
D MEASURED CURRENT
0.8 1.2 1.6 2 ICR
2_4 IPRT 2_8
LOG OF CURRENT (m.a.) + LIN REG. CURRENT
FIGURE 14

===================================================================== ELOGI COMPUTED CORROSION AND CATHODIC PROTECTION DATA
BIG SPRING - TX ZONE D5
TAFEL SLOPE = ICORR = ECORR = I PROTECT = EPROTECT =
EVALUATION OF DATA FOR TAFEL LINE OF BEST FIT
STANDARD ERROR OF Y ESTIMATE COEFFICIENT OF DETERMINATION (R SQUARED) NO. OF OBSERVATIONS USED
= = =
1.603983 0.996958
7 =====================================================================
ELOGI ZONE 05
650
600 \ l
550 l /""'-.
500 -J Ill ! > I
E I
I 450 I '--'
_j
<1: f= 400 z w 1-0 Q_
350
300
250
200
0 0.4 0.8 1.2 1.6 2 2.4 2.8 /
LOG OF CURRENT (m.a.) [l ~EASURED CURRENT + LIN REG. CURRENT
FIGURE 15

b==================================================================== ELOGI COMPUTED CORROSION AND CATHODIC PROTECTION DATA
BIG SPRING - TX ZONE D6
TAFEL SLOPE = ICORR = ECORR = !PROTECT = EPROTECT =
239.34 MILLIVOLTS/DECADE 71.00 MILLIAMPS
-355 MILLIVOLTS 219.78 MILLIAMPS
-472.45 MILLIVOLTS =====================================================================
)
EVALUATION OF DATA FOR TAFEL LINE OF BEST FIT
STANDARD ERROR OF Y ESTIMATE COEFFICIENT OF DETERMINATION (R SQUARED) NO. OF OBSERVATIONS USED
= = =
1.641657 0.998120
8 =====================================================================
ELOGI ZONE 06
800
750 l I
700 I . ~ T +' II
650 ~
/""'-. -t/ I!! ,0 > +/ c:: )J '- u I 600
'-'
..J <i I-
550 z w 1--0 il
500 EPROTECT
450
0 0.4 0.8 1.2 1.6 ICR 2 IP~.~ 2.8 .3.2
D MEASURED CURRENT LOG OF CURRENT (m.o.)
+ !_IN PEG. CURRENT
FIGURE 16
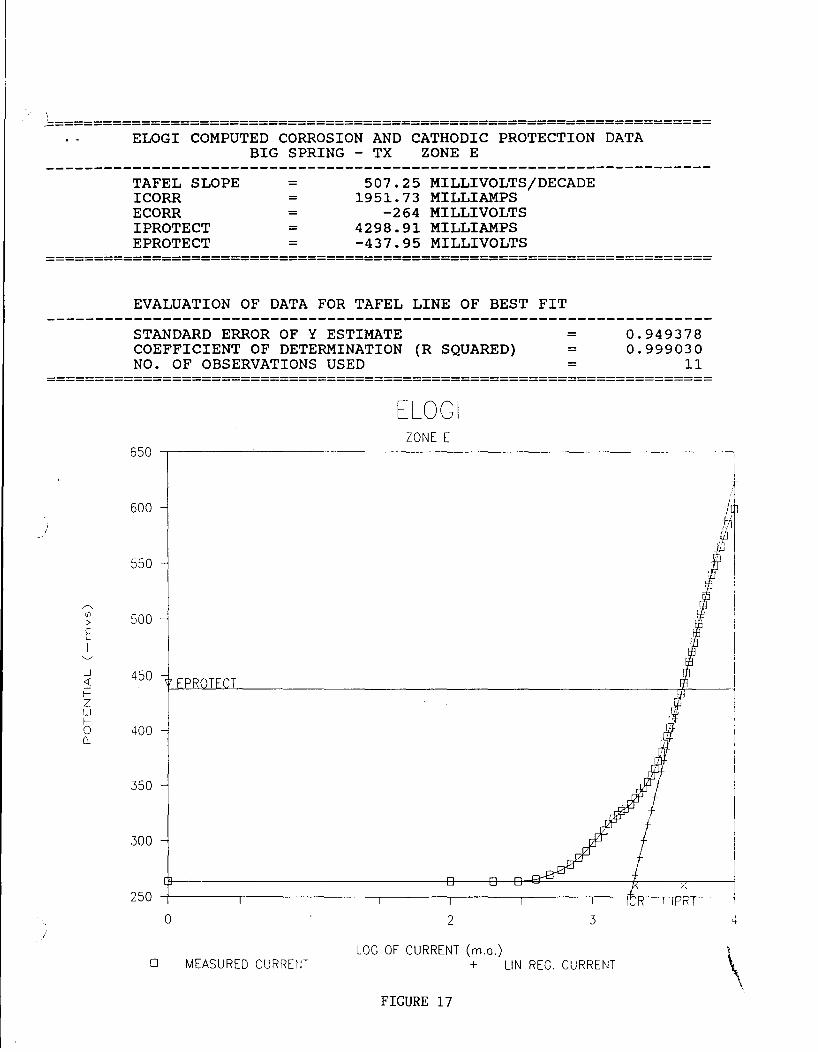
/
1==================================================================== ELOGI COMPUTED CORROSION AND CATHODIC PROTECTION DATA
BIG SPRING - TX ZONE E
TAFEL SLOPE ICORR ECORR I PROTECT EPROTECT
= = = = =
507.25 MILLIVOLTS/DECADE 1951.73 MILLIAMPS
-264 MILLIVOLTS 4298.91 MILLIAMPS -437.95 MILLIVOLTS
=====================================================================
EVALUATION OF DATA FOR TAFEL LINE OF BEST FIT
STANDARD ERROR OF Y ESTIMATE COEFFICIENT OF DETERMINATION (R SQUARED) NO. OF OBSERVATIONS USED
= = =
0.949378 0.999030
11 =====================================================================
ELOGI ZONE E
650 ,---------------------------------------------------------~
I
/"-.
Ill > t I
_j
<{
f-z w f---
600
550
500
450
0 400 Q_
350
300
0
D MEASURED CURRUfT
2 3
LOG OF CURRENT (m.o.) + LIN REG. CURRENT \
\
FIGURE 17

"' . ..__ __ _ ·___.,
DEPOLARIZATION TEST DATA 12/88
REFERENCE CELLS 1 - 4 (ELCARD SYSTEMS) 1200 ~------------ --------------~
1100 -
1000 -
900 -,.-... (/)
> 800 -~ I ...._,
_J 4: 700 --1
f--z w b 600 -0....
500
400 ~ J . ·=-~ -~:~·~:-:::~:~~~~~~:~:~:~ :~ :~ :~:~ :~:~:~:~:~:~~:~:~:~ :~:~:~~~:~:~:~~~~~:~:~:~:·~-~~~:~:~:~:: ...............................................................................................................
Note: x,y
300 -
200 1 T
0 1
40 so 120 160 200
CELL 1 (511, 368)
CELL 2 (566, 330)
x: Instant-off reference cell potential measurement
TIME (MINUTES)
y: Reference cell potential measurements taken after 4 hrs of system power shut-off.
FIGURE 18
CELL 3 (532, 303)
-- 1
CELL 4 (514, 399)
240

if
1200
100 -
1000 -1
900 -,.-.., (/)
> 800 -2 I
'--" _J
< fz w 5 0...
700 -
600 -
~-~--
DEPOLARIZATION TEST DATA 12/88
REFERENCE CELLS 5 - 8 (RAYCHEM SYSTEMS)
\~~ .. ~~.''
50 0 ' ~ ·:::': '· '''·'·'· '·' ''· '· '· .............. '· •. '• .................. ---.. -----•.•.•.•.••. , .•.•. ,., .•. , •• '., ., ,.,., ., ., '., ., ., ,., '., ., ,.,., ,.,.' ., .,.,.,., -.... ........ ___ _ ---... ________ _ 400 -l
300 -
200 I
0 40 80 120 160 200 240
TIME (MINUTES) CELL 5 ---- CELL 6 -- CELL 7 ........ CELL 8
(679, 346) (597, 402) (573, 347) (618, 414)
Note: x,y x: Instant-off reference cell potential measurement
y: Reference cell potentialmeasuremenrs taken after 4 hrs of system power shut-off.
FIGURE 19

"'-----
1200
1100 -
1000 -
900 -,.......___ (/)
> 800 -2 I ......__,
;j_ 700 -1-z w b 600 -o._
500 -
400 _:
-~-
DEPOLARIZATION TEST DATA 12/88
REFERD~CE CELLS 9 & 10 (RES CON SYSTEMS)
,, ... ___ ... _ .. _____ _
300 --' ··· ....... .. -~--•v---------~-,--~----,------~--------~------~--------*•••---•----------
Note: x.y
.. ..................................... .
200 0
T T
40 -I I
80
CELL 9 (430, 255)
x: Instant-off reference cell potential measurement
I T
120
TIME (MINUTES)
y: Rcfen:ncc cell potcntialmc:asurcmcnts t;1kcn ;li'tcr 4 ilrs of" system power sllllt-orf.
FIGURE 20
-, I
160
CELL 10 ( 423. 299)
T T
200 T
240

;.."-
'-......_ __
DEPOLARIZATION TEST DATA 12/88
REFERENCE CELLS 11 - 13 (ZINC SYSTEMS) 1200
1100
1000
900 ,..-.... (f)
> 800 :::2: I ........,
_J 700 <(
1-z w 1- 600 0 0....
500
400 . ·-......... -.· ........ ,.;::: ... ·-·· .: ...... ::: ~:~~::::: ::::: :~ :~: ~:: :~::: ~:~· ... ·: ·: ·_ -................ 1
--- --. 300
200 I
0 40 so 120 160 200 240
TIME (MINUTES) CELL 11 -- CELL 12 ········ CELL 13 (485, 310) (1194, 240) (680, 415)
Note: x,y x: Instant-off reference cell potential measurement y: Reference cell potential measurements taken after 4 hrs of system power shut-off.
FIGURE 21

w
-...__~
~
(f)
> 2~
i-2 ....___., c _jo <!C/l _:::J 1-0 z..c WI-I-'-.../ 0 CL
Note: x,y
'·-..._~
DEPOLARIZATION TEST DATA 12/88
REFERENCE CELLS 14 - 16 (ZINC SYSTEfv1S) 1.2 --.-------------___:_ __________ ____,
1 . 1
0.9
0.8
0.7
0.6
0.5
0.4
0.3
0.2 0 40
CELL 14 (797, 319)
x: Instant-off reference cell potential measurement
80
.............................................
120
TIME (MINUTES) CELL 15
(559, 333)
y: Reference cell potential measurements taken after 4 hrs of system power shut-off.
FIGURE 22
····························· ·························
160 200
CELL 16 (627, 353)
240
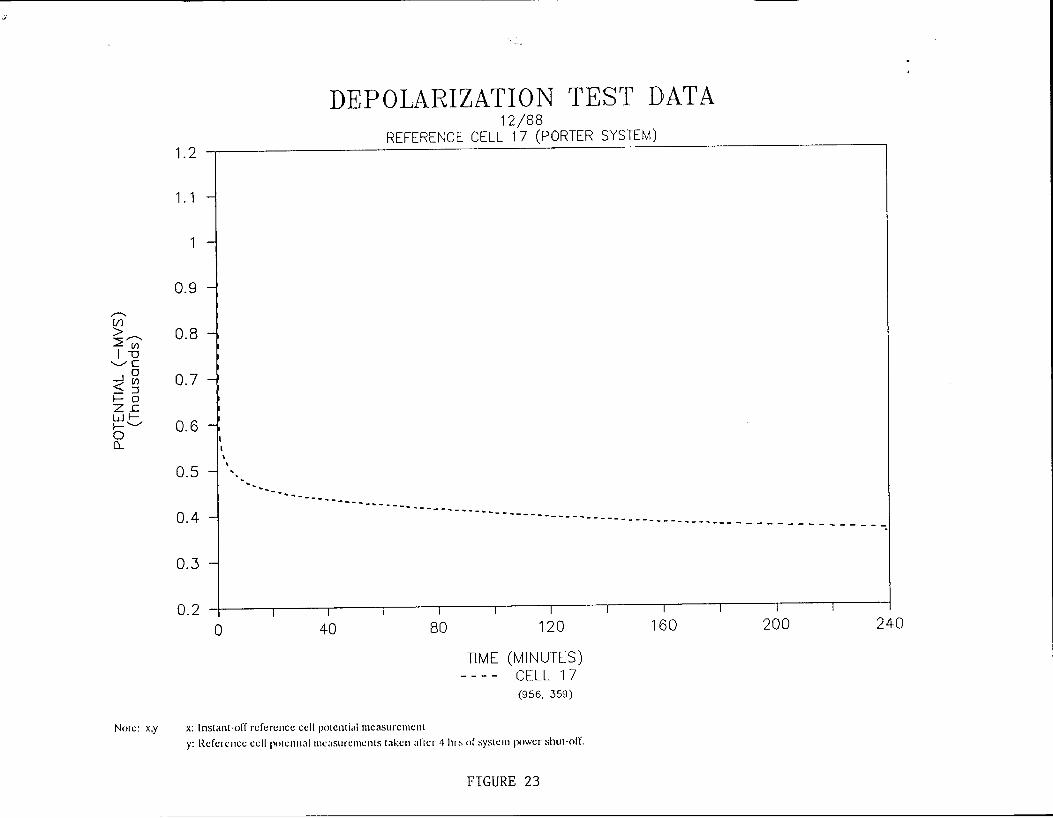
:-·
1.2
1. 1 -
1 -
0.9 -
---.... (/)
~---.... 0.8 -I~
"-..../C 0
~ ~ 0.7 -1-0 z..c Wl-b"-..../ 0.6-CL II
\
0.5 -j ',
DEPOLARIZATION TEST DATA 12/88
REFERENCE CELL 17 (PORTER SYSTEM)
0.4- ------- ...... ·--- ........ -............................... ---.---.----.. - - -- . -- . - -- - - - --
Note: x,y
0.3-
0.2 0
I I
40 I
x: Instant-off reference cell potential measurement
I
80 I I
120
TIME (MINUTES) CELL 17 (956, 359)
y: Reference cellpotcnti~l measurements t:~ken after 4 hrs of system power shut-off.
FIGURE 23
I I I
160 I
200 I
240

;;
\..__/
REBAR PROBE- DECEMBER 1988 REBAR PROBES ZONES 1 - 4
0.4 ~----------------------------------------------------------~
0.3
0.2
"'"" 0 ~ 0.1 .._ 1-z w 0:::
0 0::: :J 0
~ -0.1 (I) w 0:::
-0.2
-0.3
-0.4 ~--~r---~--~----~--~----li---,----,---~~--~----~--~ 0 40 80 120 160 200 240
D #1 TIME (MINUTES)
+ #2 0 #3 /.::,. #4
FIGURE 24

II'
\ · . ...._....
'-..
REBAR PROBE- DECEMBER 1988 REBAR PROBES ZONES 5 - 8
0.5 ~----------------------------------------------------------,
0.4
0.3
r-.. 0
2 0.2 .....__,
1-z w n: n: 0.1 :J (..)
n: <{ 0 co w n:
-0.1
-0.2
-0.3 ~----~--~----.----.-----.----~--~----~~----r---~----~---j
0 40 80 120 160 200 240
0 #5 Tltv1E (tv11NUTES)
+ #6 <> #7 /::,. #8
FIGURE 25

~
\.___.
REBAR PROBE DECE!v1BER 1988 REBAR PROBES ZONES 9 & 10
0.4 ~----------------------------------------------------------------~
0.3 -=
0.2 j _,....... 0
2 0.1 -'-../
~ w [t
0 [t
~ ::J 0 [t
-0.1 -<{ ID w [t
-0.2
~
-0.3- 0
------ ~
-0.4 ~----~----~----~----~----~----~----~----~----~----~--~~--~
0 40 80 120 160 200 240
TIME (MINUTES) 0 #9 + #10
FIGURE 26

;;-
-.... __ _ -~------
REBAR PROBE- DECEMBER 1988 REBAR PROBES ZONES 11 - 13
0.9
0.8
0.7
0.6
0.5
0.4
,..... 0.3 0 L 0.2 '-'
1- 0.1 z w rt: 0 rt: ::J -0.1 0 rt: -0.2 <{ OJ -0.3 w rt: -0.4
-0.5
-0.6
-0.7
-0.8
-0.9
-1
0 40 80 120 160 200 240
D #11 TIME (MINUTES)
+ #12 <> #13
FIGURE 27

F'""
"--
4
3.5
3
2.5 r-.,
0 2 "../
1-2
z w 0:.: 0:.: 1.5 :J ()
0:.: <{ 1 ((] w 0:.:
0.5
0
-0.5
-1
,, __
REBAR PROBE DECEMBER 1988
[] -
-
-
-
-
<
-
-
,....., ,...., ...... D---""'" ':;:'
L
7 y
-
I I I
0 40
0
REBAR PROBES ZONES 14 - 16
I
80
#14
,...., ,...., ~
~
/'-v v
I I
120
TIME (MINUTES) + #15
FIGURE 28
I
......
A
I I
160
() #16
I I
200 240
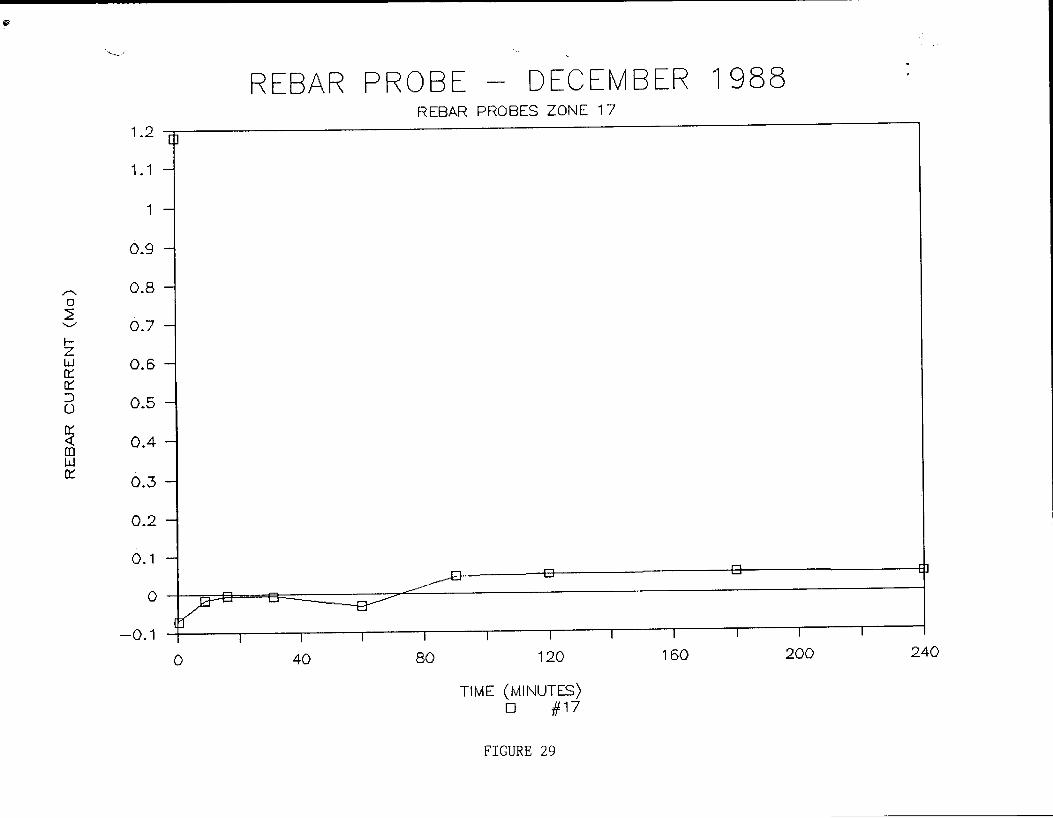
"' '-'---/-
REBAR PROBE- DECEMBER 1988 REBAR PROBES ZONE 17
1.2 .,
1.1 -
1 -
0.9 -
/"'. 0.8 -0 ~ ..._,., 0.7-I-z w 0.6 -n:: n:: ::J 0.5-0
n:: 4: 0.4-(I) w n:: 0.3-
0.2-
0.1 -
-0.: -h ......,-
~ 0 0
' ---w--T
0 40 80 120 160 200 240
TIME (MINUTES) 0 #17
FIGURE 29

f
·-.__...
DEPOLARIZATION TEST DATA 1/89
REFERENCE CELLS 1 - 4 (ELGARD SYSTEMS) 700
600
,.......,. (/)
> 500 2 I ..._,
4! i= z w b Q_
Note: x,y
400 ··---··~--- .. - .. ~--.. - .. -.. _.__,_,_,_,_ .. _ .. ____ ,_ .. ~ .. --·-··-"-"'-··- .. _,_,_,,_,_,,_,_,_ .. _ .. _,_,_,_ .. _ .. _ .. _ .. -.................. _ ...
·· ... ----~--~,·-·,~--,
·· .............................................. . ...- ......... _,_
300
200 0
CELL 1 (476, 347)
40 so
CELL 2 (500, 311)
x: Instant-off reference cell potential measurement
·················
120
TIME (MINUTES)
y: Reference cell potential measurements taken after 4 hrs of system power shut-off.
FIGURE 30
~----- .... --,,~- ... -... ____ ._, ... ____ ,~-------
CELL 3 (463, 284)
160
····························:·······
200
CELL 4 (487,383)
240

''--~· .
,.......__ (/)
> ~ I ....._,.,
_J
<t: 1-z w b 0....
Note: x,y
DEPOLARIZATION TEST DATA 1/89
REFERENCE CELLS 5 - 8 (RAYCHEtv1 SYSTEMS) 700
600
500 ·~ .. , .. , . .,., ~.,
·~ ..... "'~,
·;,;.-,.~~··········· .............. .. ~-~--~-~----~-.. __ _ -..
400 ~-~.:-.~.~ ~.:. :-_- -.:.:.:.~.7.~.7:: -~.:::.~ .:.";.~ -~·"'·~-~-~ .......... --- ~-- ------·
300
200 0
CELL 5 (672. 325)
40 80
CELL 6 (638, .385)
x: Instant-off reference cell potentialmcasurcllll:nt
---
120
TIME (MINUTES) CELL 7 (552. 3.)1)
y: Reference cell potcmialmcasurcmcms t;~kcn <tftcr 4 ilrs or system power shut-off.
FIGURE 31
---------------
160 200
CELL 8 (603, 387)
240

~-
'-.......-
,........ U')
> ::2 I
'-../
_j <(
i= z w b D...
Note: x,y
700
600 -
500 -
400 -
' ' . '•.
~ '•.
300 -l ··· ................. ..
-... ,. ..
-~._-·
DEPOLARIZATION TEST DATA 1/89
REFERENCE CELLS 9 & 10 (RESC0~1 SYSTEMS)
·- ... -- ........ -"'-- .. "'- ..... -- ... -- .... ~~-- .......... ____ .. _
----~- ......... _ .... _ .. -----~~--- ... ~-- .... ~~------
. ................................................................................................................................................................... ..
200 I I
0 40 I I
80
CELL 9 (410, 254)
x: Instant-off reference cell potential measurement
I I
120
TIME (MINUTES)
y: Reference cell potential measurements taken after 4 hrs of system power shut-off.
FIGURE 32
I I
160
CELL 10 (442, 289)
I I I
200 240

''---·
700
600 -
,.--.._ U1 > 500 -~ I
"-./
~ ~ ~ z ~ wo~ 0
DEPOLARIZATION TEST DATA 1/89
REFERENCE CELLS 11 - 13 (ZINC SYSTEMS)
n_ . . ·· .. . ·.
·--~~~~~~~;:::~~::~~~~~~~~-·-------·-----·-····----------·----------------·--------·----·--·-----300 - ............................................................................................................................
Note: x,y
200 I
0 I
40
CELL 11 (436, 323)
~
I
x: Instant-off reference cell potential measurement
I
80 I I
120
TIME (MINUTES) CELL 12
(555, 242)
y: Reference cell potential measurements taken after 4 hrs of system power shut-off.
FIGURE 33
-'-'
I I
160 I I
200
CELL 13 (679, 293)
I
240

,. "-._··
700
600
,---.. (/)
> 500 2 I ..___,
~ 1-z w b 400 Q_
.. ........__.
DEPOLARIZATION TEST DATA 1/89
REFERE~·ICE CELLS 14 - 16 (Zit'-IC SYSTDv1S)
~-,-'~~-~---'---------•-~----------'----·------------,, ___ v~_,,,--~~-•
Note: x,y
300
200 0 40
CELL 14 (491, 241)
x: Instant-off reference cell potential measurement
80
................................ --.--.-,....--.
120
TIME (MINUTES) CELL 15
(451, 319)
160
y: Reference cell potential measurements taken after 4 hrs of system power shut-off.
FIGURE 34
200
CELL 16 (407, 250)
240
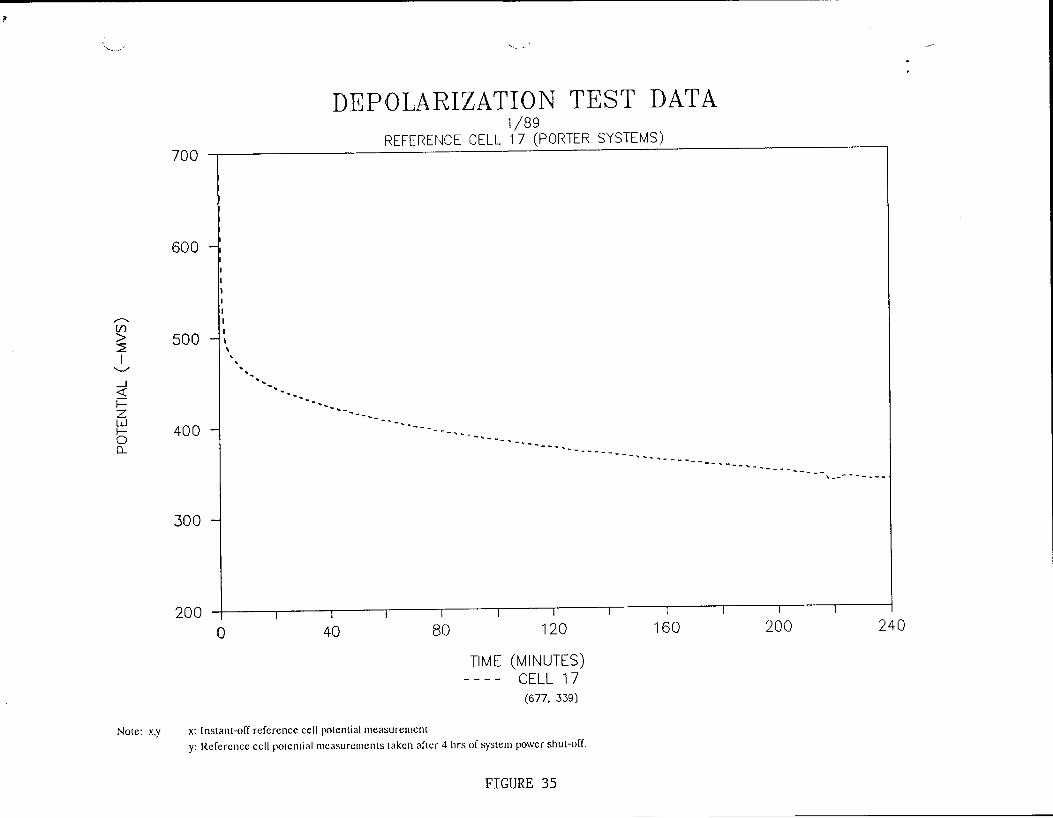
1
.._____,
,.--... [/)
> ::2: I ...__.,
<l! f= z w b (l_
Note: x,y
700
600 -
500 I
--l, \
400 -
300 -
200 0
·. · .. ~
T
DEPOLARIZATION TEST DATA
.................. _ ~--
I
40
1/89 REFERENCE CELL 17 (PORTER SYSTEMS)
-...... __
T I
80
. -- -... __ -~- ..
T
-~ ... ' ..
I
120
TIME (MINUTES) CELL 17 (677, 339)
T
..... __ .... __
T
160
x: Instant-off reference cell potential measurement
y: Reference cell potential measurements taken after 4 hrs of system power shut-ofL
FIGURE 35
......... _ .. ' ... --- -- .. --
T I I
200 240

r
."-----
REBAR PROBE JAf~ UARY 1 9 89 REBAR PROBES ZONES 1 - 4
0.4 -r------------------------------------------------------------------~
0.3
0.2
/"""..
0
~ 0.1 '"-./
1-z w 0::: 0::: 0 :J ()
0::: ~ -0.1 co w 0:::
-0.2
-0.3
-0.4~r--~----~--~----~---r----r----r---.----~--~----~~~ 0 40 80 120 160 200 240
0 #1 TIME (MINUTES)
+ #2 <> #3 b. #4
FIGURE 36

, ~,____ __ .
"----'
REBAR PROBE JANUARY 1989 REB.A.R PROBES ZONES 5 - 8
0.5 ~------------------------------------------------------------~
0.4
0.3
/'""'..
0 ~ 0.2 --f-z w 0::: 0::: 0.1 :J (.)
0::: <{
0 CD w 0:::
-0.1
-0.2
-0.3 -+---.---y---,---,----r--~---y----"T-----r--r-----,-----j
0 40 80 120 160 200 240
0 #5 TIME (MINUTES)
+ #6 <> #7 /::, #8
FIGURE 37
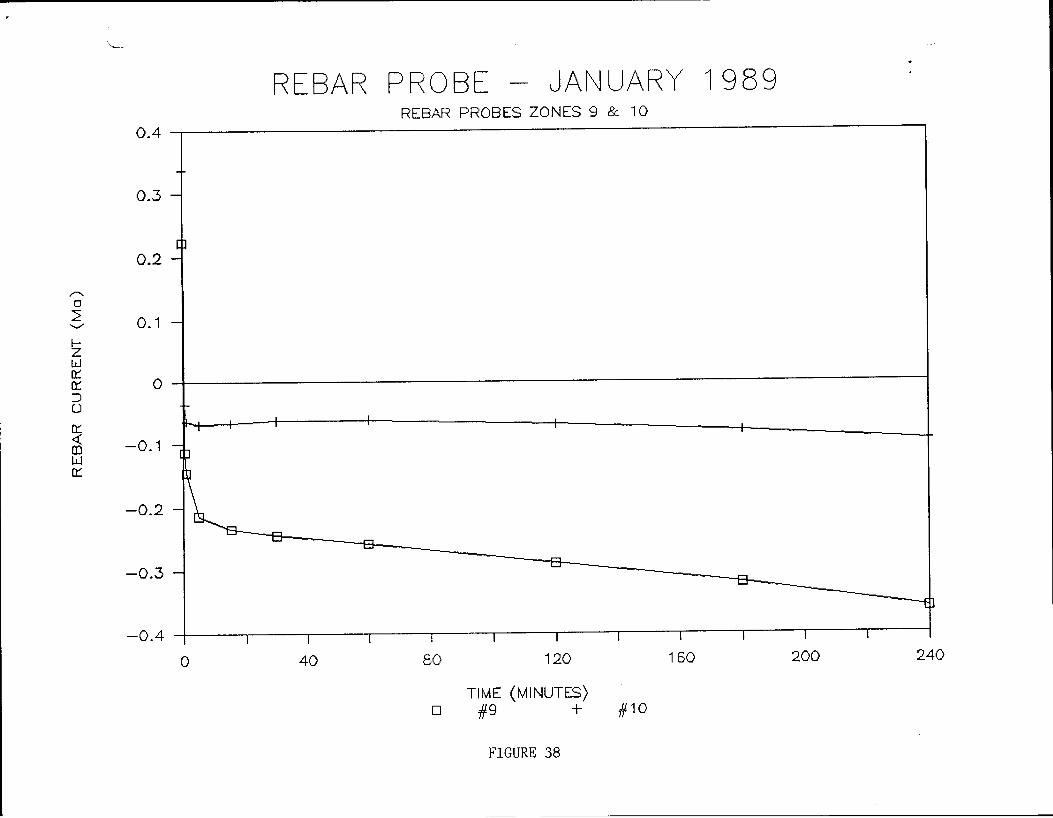
REBAR PROBE- JANUARY 1989 REBAR PROBES ZONES 9 & 10
0.4
0.3 -
cp 0.2 -
.,.,...., 0
2 0.1 '-../ -1-z w 0:::
0 0::: :J 0
0::: T
-0.1 <{ OJ w
-p 0:::
-0.2 -~ ...... .I'""'>
-0.3 - ...... ........
-0.4 I I I I I I I I I I I
0 40 80 120 160 200 240
TIME (MINUTES) D #9 + #10
FIGURE 38

REBAR PROBE - JANUARY 1989 REBAR PROBES ZONES 11 - 13
1
0.8
0.6
0.4
,--.. 0.2 0 2 ......., 0 f-z w -0.2 ~ ~ ::J -0.4 ()
~ <( -0.6 Q) w ~
-0.8
-1
-1.2
-1.4
-1.6
0 40 80 120 160 200 240
TIME (MINUTES) 0 # 11 + #12 <) #13
FIGURE 39

,
REBAR PROBE - JANUARY 1989 REBAR PROBES ZONES 14 - 1 5
1.1
1
0.9
0.8
0.7
0.5 ""' 0
0.5 2 ......,.,
1- 0.4 z w
0.3 0:: 0:: :J 0.2 ()
0:: <{
0.1 m
0 w 0::
-0.1
-0.2
-0.3
-0.4
-0.5
-0.5 '
0 40 80 120 150 200 240
TIME (MINUTES) 0 #14 + #15 <) #15
FIGURE 40
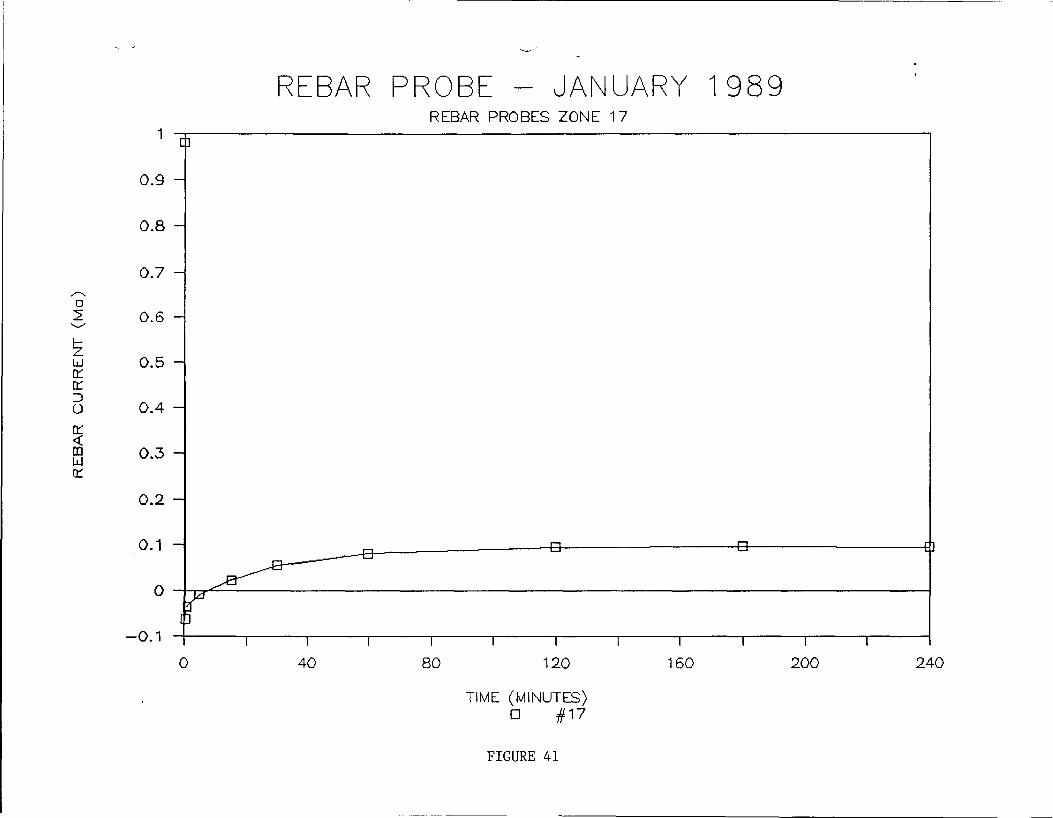
REBAR PROBE - JANUARY 1989 REBAR PROBES ZONE 1 7
1r 0.9-
0.8-
0.7-~
0 2 0.6--f-z w 0.5-cr cr :::)
0.4-()
cr 4: m 0.3-1.&..1 cr
0.2-
o. 1 J ___...--[] 0 0 ~
-O.~t~ 1 1 I I I I I I I I
0 40 80 120 160 200 240
TIME (MINUTES) 0 #17
FIGURE 41
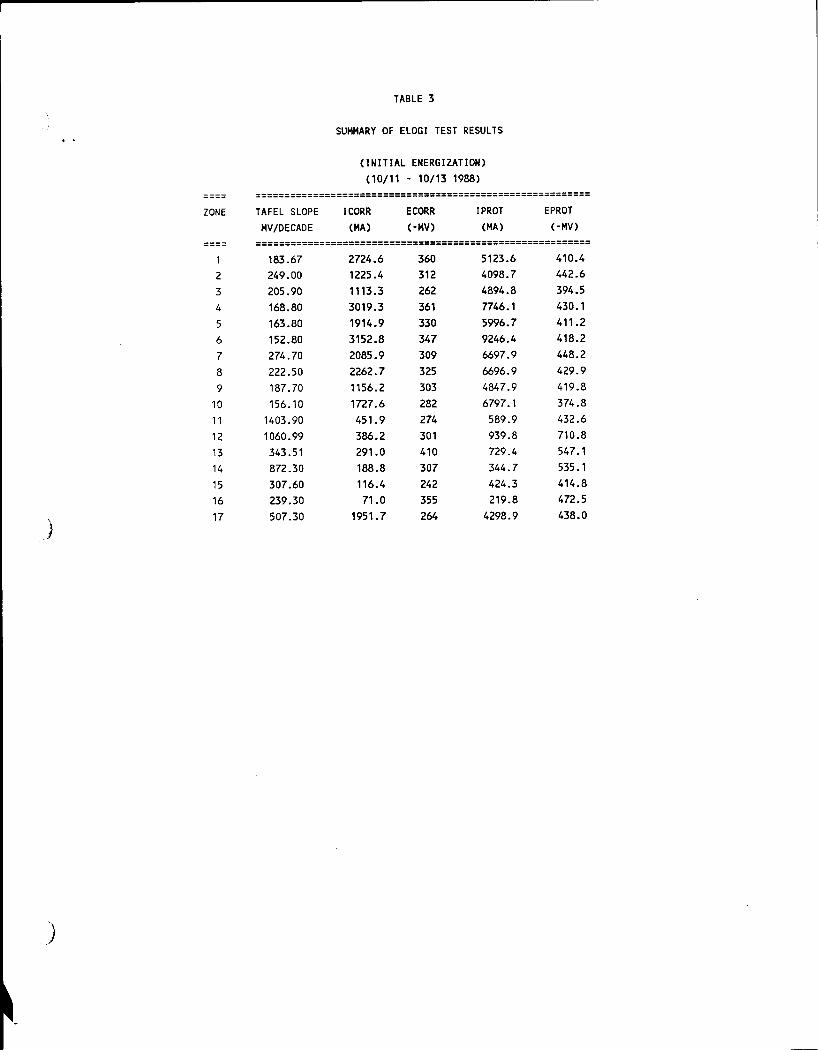
TABLE 3
SUMMARY OF ELOGI TEST RESULTS
(INITIAL ENERGIZATION) (10/11 - 10/13 1988)
========================================================== ZONE TAFEL SLOPE ICORR ECORR !PROT EPROT
MV/DECADE (MA) (-MV) (MA) (-MV)
========================================================== 183.67 2724.6 360 5123.6 410.4
2 249.00 1225.4 312 4098.7 442.6
3 205.90 1113.3 262 4894.8 394.5
4 168.80 3019.3 361 7746.1 430.1
5 163.80 1914.9 330 5996.7 411.2
6 152.80 3152.8 347 9246.4 418.2
7 274.70 2085.9 309 6697.9 448.2
8 222.50 2262.7 325 6696.9 429.9
9 187.70 1156.2 303 4847.9 419.8
10 156.10 1727.6 282 6797.1 374.8
11 1403.90 451.9 274 589.9 432.6
12 1060.99 386.2 301 939.8 710.8
13 343.51 291.0 410 729.4 547.1
14 872.30 188.8 307 344.7 535.1
15 307.60 116.4 242 424.3 414.8
16 239.30 71.0 355 219.8 472.5
) 17 507.30 1951.7 264 4298.9 438.0
)
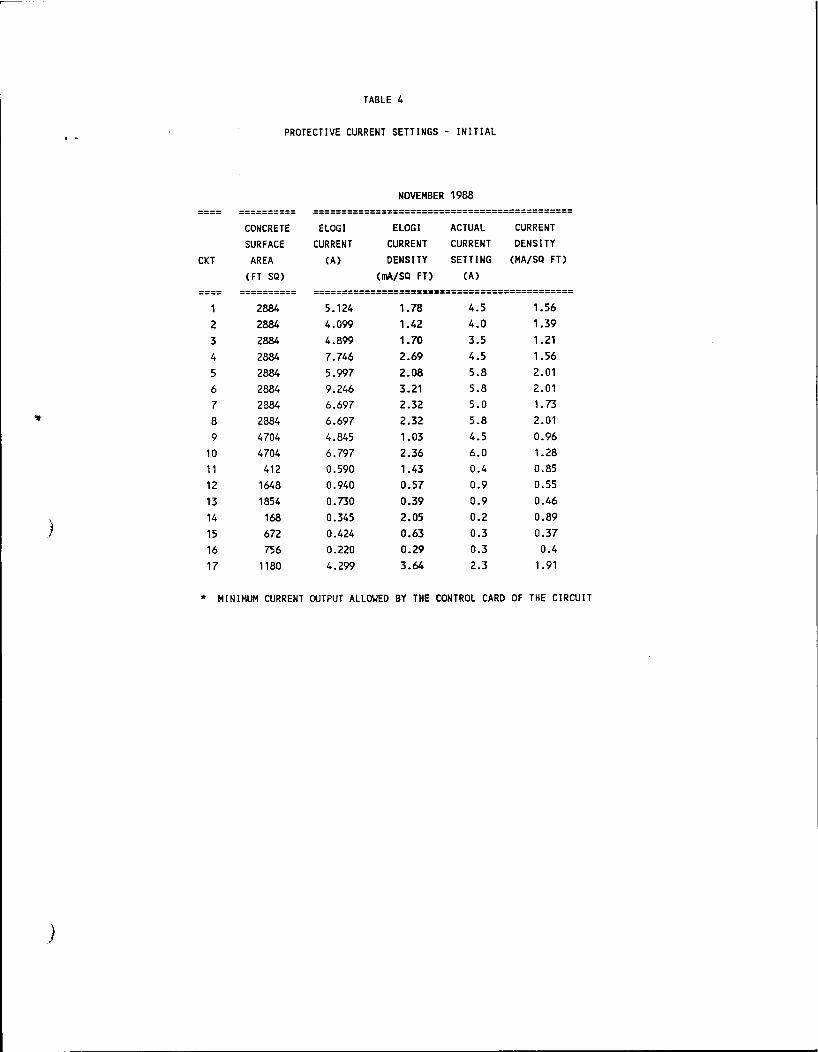
TABLE 4
PROTECTIVE CURRENT SETTINGS - INITIAL
NOVEMBER 1988
========== ============================================= CONCRETE ELOGI ELOGI ACTUAL CURRENT SURFACE CURRENT CURRENT CURRENT DENSITY
CKT AREA (A) DENSITY SETTING (MA/SQ FT) (FT SQ) (mA/SQ FT) (A)
---- ========== ============================================= 1 2884 5.124 1.78 4.5 1.56 2 2884 4.099 1.42 4.0 1.39 3 2884 4.899 1.70 3.5 1.21 4 2884 7.746 2.69 4.5 1.56 5 2884 5.997 2.08 5.8 2.01 6 2884 9.246 3.21 5.8 2.01 7 2884 6.697 2.32 5.0 1.73 8 2884 6.697 2.32 5.8 2.01 9 4704 4.845 1.03 4.5 0.96
10 4704 6.797 2.36 6.0 1.28 11 412 0.590 1.43 0.4 0.85 12 1648 0.940 0.57 0.9 0.55 13 1854 0.730 0.39 0.9 0.46
) 14 168 0.345 2.05 0.2 0.89 15 672 0.424 0.63 0.3 0.37 16 756 0.220 0.29 0.3 0.4 17 1180 4.299 3.64 2.3 1.91
* MINIMUM CURRENT OUTPUT ALL~ED BY THE CONTROL CARD OF THE CIRCUIT
)

I
)
)
TABLE 5
MAINTENANCE DATA SHEET
oriac;e Deck identification: lJS 87 Railroad Overpass -- Howard Colmty Big c::oring Texas
?ec:fier Location: N.E. Abutment Wall Deck Condition:-..l..Ll-1---------------
::ate: _ ______:1_,0'4/_,2=..:8~/-==8-=8'------- Time:----------~ 0
Ambient Temperature: _ ___c..L"''""--L----
-:-R -:-ester\ s ):_...:..:....: ______________ _ Rectifier Model No.: TIACE 40/20-10(17)DGNPSZ DC Amps 10 (ckts 1-17)
?ectifier S/N: 88A 1 052 Type 0033052 Rectifier DC Rating: DC Volts 20 lckts 1-13) 40 (ckts 14-17)
General Remarks: Pre-energization data. Rectifier "OFF." Voltage measurements are
open circuit potential between anode and structure negative. Open circuit
ootential for zones 11 -1 6 negative due to zinc anode material.
Control Rebar Reference Instant-off :_ight Probe Cell Voltai)e Current Reference cell
Circu;t (on/off) (volts) (volts) (volts (amps) (volts)+ 0 emorks
Rebar ::~cce measurements were JFF -.0138 . .360 .57 0 taken ~s:r-10 a cortable voltmeter
2 OFF -0067 . .304 .45 0
' OFF -.0029 .266 .46 0
4 I OFF -.0020 . .352 .45 0
5 OFF -.00625 . .331 .15 0
0 OFF -.00104 .3.35 .15 0
- OFF - 00197 .302 . i 9 0
~ 2-,FF - 00175 . .323 .17 0
9 JFF -.00961 .299 .24 0
10 I OFF -.00296 .280 .24 0
, - OFF -.01225 .271 -.23 0 I I I
12 I OFF -.00845 .255 -.15 0 !
I I
13 I OFF -.00693 .361 -.24 0 ' I
14 I OFF -.00848 .297 -.36 0 I
1 -.:) ! OFF -.01489 .295 -.2.3 0
16 I OFF - 00123 . .380 - . .35 0
'- OFF -.00509 .25.3 .026 0
Total current 0
Note: ::;efer to instruction sheet concerning all measurements. • I·Jieosurements require a portable voltmeter. bstx2(w 1-fl)
I

I
!
) I
I I
i I l
' ' ~ ' i !
! i I I I '
I
)
TABLE 6
MAINTENANCE DATA SHEET
Bridge Deck Identification: LJS 87 Railroad Overpass - Howard CotJnty, Big Spring, Texas
Rectifier Location: N.E. Abutment Wall Deck Condition:-.J..LL*-__________ _
Dote: _ ___:_1 .::::.0~.-/:::.2-""8'-/-'='8-'='8 __ _ Time:--------- "'C: o F Ambient Temperature: _ ____,_,_,J'"",.l_L_ ____ _
Tester( s):_...:...T:....:R _____________ _ Rectifier Model No.: TIACE 40/20-10(17)DGNPSZ DC Amps 10 (ckts 1-17)
Rectifier S/N: 88A 1 052 Type 0033052 Rectifier DC Rating: DC Volts 20 (ckts 1-13) 40 (ckts 14-17)
General Remarks: Initial eoergization data. Rebar probe measurements were taken
using a portable voltmeter.
Control Rebar Reference Light Probe Cell Volta({ Current
Circuit (on/off) (volts) (volts) (volts (amos)
1 ON -.00200 .449 4.98 4.50
2 ON .00200 .588 4.71 4.00
3 ON .00200 .427 4.68 3.50
4 ON .00200 .460 4.83 4.50
5 ON .00015 .837 13.79 5.80
6 ON .00101 .644 13.63 5.80
7 ON .00202 .518 13.30 5.00
8 ON .00212 .587 14.77 4.80
9 ON .00105 .490 2.99 4.50
10 ON .00215 .429 3.51 6.00
11 ON -.00290 1.420 5.62 .35
12 ON .04550 1.220 10.95 .90
13 ON .00425 2.140 13.46 .85
14 ON .03010 2.730 6.39 .15
15 ON .00620 1.290 3.81 .25
16 ON .00967 1.050 6.85 .30
17 ON .00851 1 .160 7.06 2.25
Total current 54.0
Note: Refer to instruction sheet concerning all measurements. + Measurements require a portable voltmeter.
Instant-off Reference cell (volts)+ Remarks
I
.401
.416
.360
.410
.470
.479
.399
.410
.397
.355
.572
.570
.830
.610
.540
.450
.400
bstxl(wl-11)
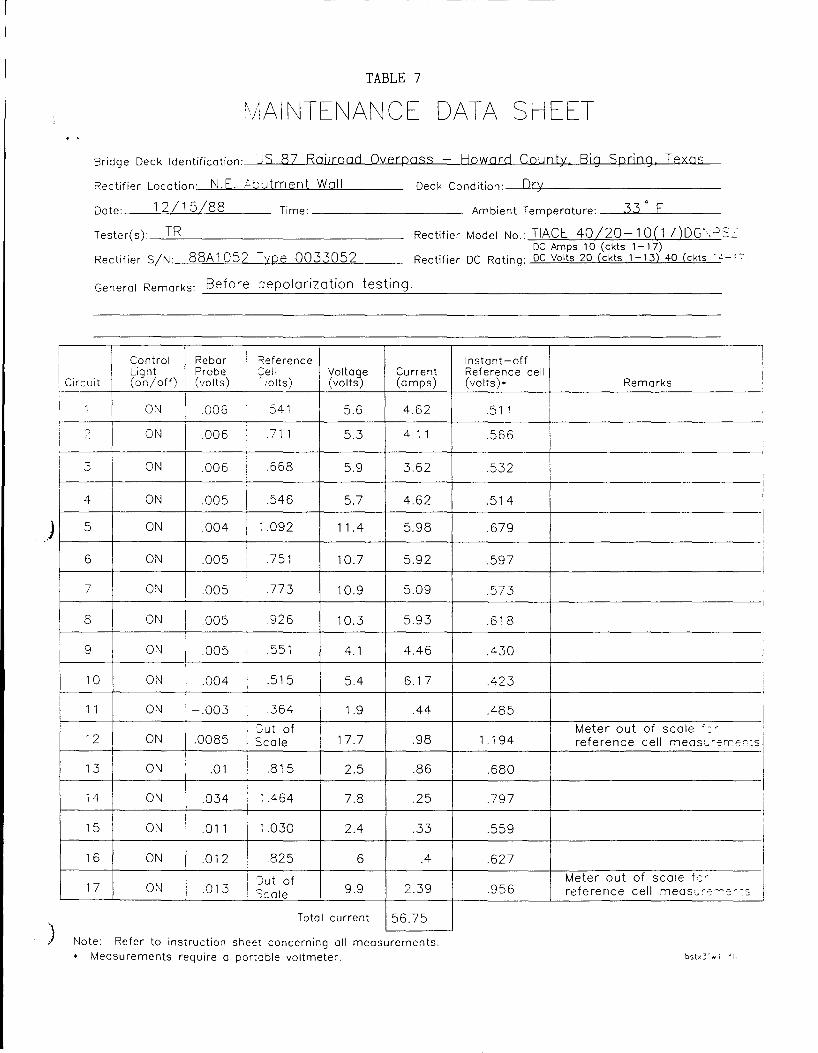
I I i
I
)
I
)
TABLE 7
~/1AINTENANCE DATA SHEET
Bridge Deck Identification: JS 87 Railroad Overpass - Howard Cotmty Big Spring, Texas
Rectifier Location: N.E. ;.:::;utment Wall Deck Condition:-...I...Ll..:j------------
Dote: _ ___:..1 .=.2.t.-/-'-1 =5.t.-/=8=8 __ _ Time:---------- Ambient Temperature: __ ..... 3;...~.3_0
-'--F ___ _
Tester(s):_...:.T-'-R'---------------
Rectifier S/N: 88A 1 052 -;;pe 0033052
Rectifier Model No.: TIACE 40/20-1 0( 1 7)DG~ ,:::;::::::: DC Amps 10 (ckts 1-17)
Rectifier DC Rating: DC Volts 20 (ckts 1-13) 40 (ckts '.:.-;-;-
General Remarks: Before -=:epolarization testing.
Control Rebar I :::(eference Light Probe :ell Volta0e Current
Circuit (on/off) (volts) ' .·olts) (volts (amps)
1 ON .006 .541 5.6 4.62
2 ON .006 .711 5.3 4.11
3 ON .006 ! .668 5.9 3.62
I
4 ON .005 I .546 5.7 4.62 I
5 ON .004 i
i .092 11.4 5.98 f
! 6 ON .005 i .751 10.7 5.92 i
7 ON .005 .773 10.9 5.09
8 ON .005 926 10.3 5.93
9 ON .005 ; .551 4.1 4.46
10 ON .004 I I
.515 5.4 6.17
11 ON -.003 I .364 1.9 .44 I
:::-ut of 12 ON .0085 i Scale 17.7 .98
13 ON .01 l .815 2.5 .86
14 ON .034 I
~ .464 7.8 .25 ' I
15 ON .011 ~ .030 2.4 .33
16 ON .012 .825 6 .4
i Jut of 17 ON .013 I Scale 9.9 2.39
'
Total current 56.75
Note: Refer to instruction sheet concerning all measurements. • Measurements require a portcble voltmeter.
Instant-off Reference cell (volts)+ Remarks
.511
.566
.532
.514
.679
.597
.573
.618
.430
.423
.485
Meter out of scale':-1 .194 reference cell meas:_-~m-::~:s
.680
.797
.559
.627
Meter out of scale fc-.956 reference cell measu~-::--:-::r ·.s
I I !
;
i ;
I
I
I I
i i :
I I '
i

,
TABLE 8
DEPOLARIZATION TEST · 45 DAYS
DECEMBER 13, 1988
========= ======================== REFERENCE 4 HR POLARIZATION SHIFT
CELL (·MVS)
========= ======================== 143
2 236 3 229 4 115 5 333 6 195 7 226 8 204 9 175
10 124 11 175
) 12 954 13 265 14 478 15 226 16 274 17 597
)