how to use data to inform your design and drive your business
TRANSCRIPT

Brent Summers, Director of Marketing at Digital Telepathy
Using Data and Design toDrive Your Business June 25, 2015

@thuelmadsen #Kisswebinar
Join the conversation on Twi!er

Brent Summers - Digital Telepathy - @brentsummers
Brent Summers is a marketer at Digital Telepathy where he gets to indulge in data and design on a daily basis. His background in project management and business analysis helps him to produce measurable results and constantly improve performance.
Your presenter
@brentsummers #Kisswebinar
Join the conversation on Twi!er
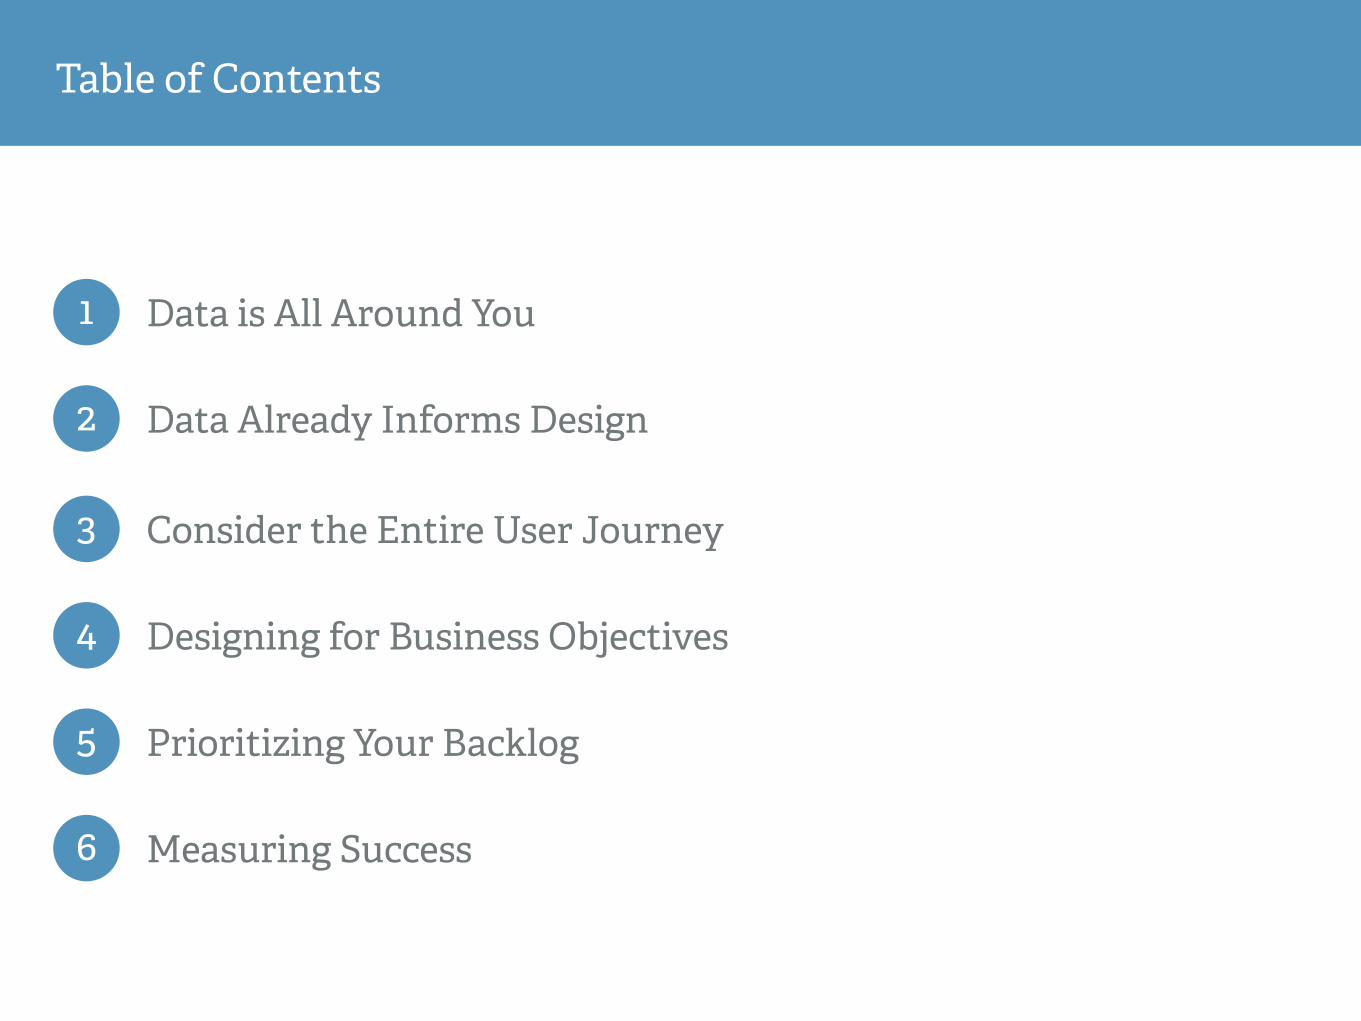
1 Data is All Around You
2 Data Already Informs Design
3 Consider the Entire User Journey
Table of Contents
4 Designing for Business Objectives
5
6
Prioritizing Your Backlog
Measuring Success

WATCH WEBINAR RECORDING NOW

Data is All Around You
1

A Rose By Any Other Name How many data scientists (by any name) are there today?
“…there are many data scientists with the title so!ware engineer, research scientist, etc., so the number of people who match on a skill and education basis regardless of official job title is probably in the 150K-250K range.”
— Peter Skomoroch, Sr. Data Scientist & LinkedIn— Peter Eckert
h!p://www.quora.com/How-many-data-scientists-by-any-name-are-there-today
Data is All Around You

Quantitative Data Sales Reports
Data is All Around You
Sources might include: Google Spreadsheets, Excel, Salesforce, Magento, Bigcommerce
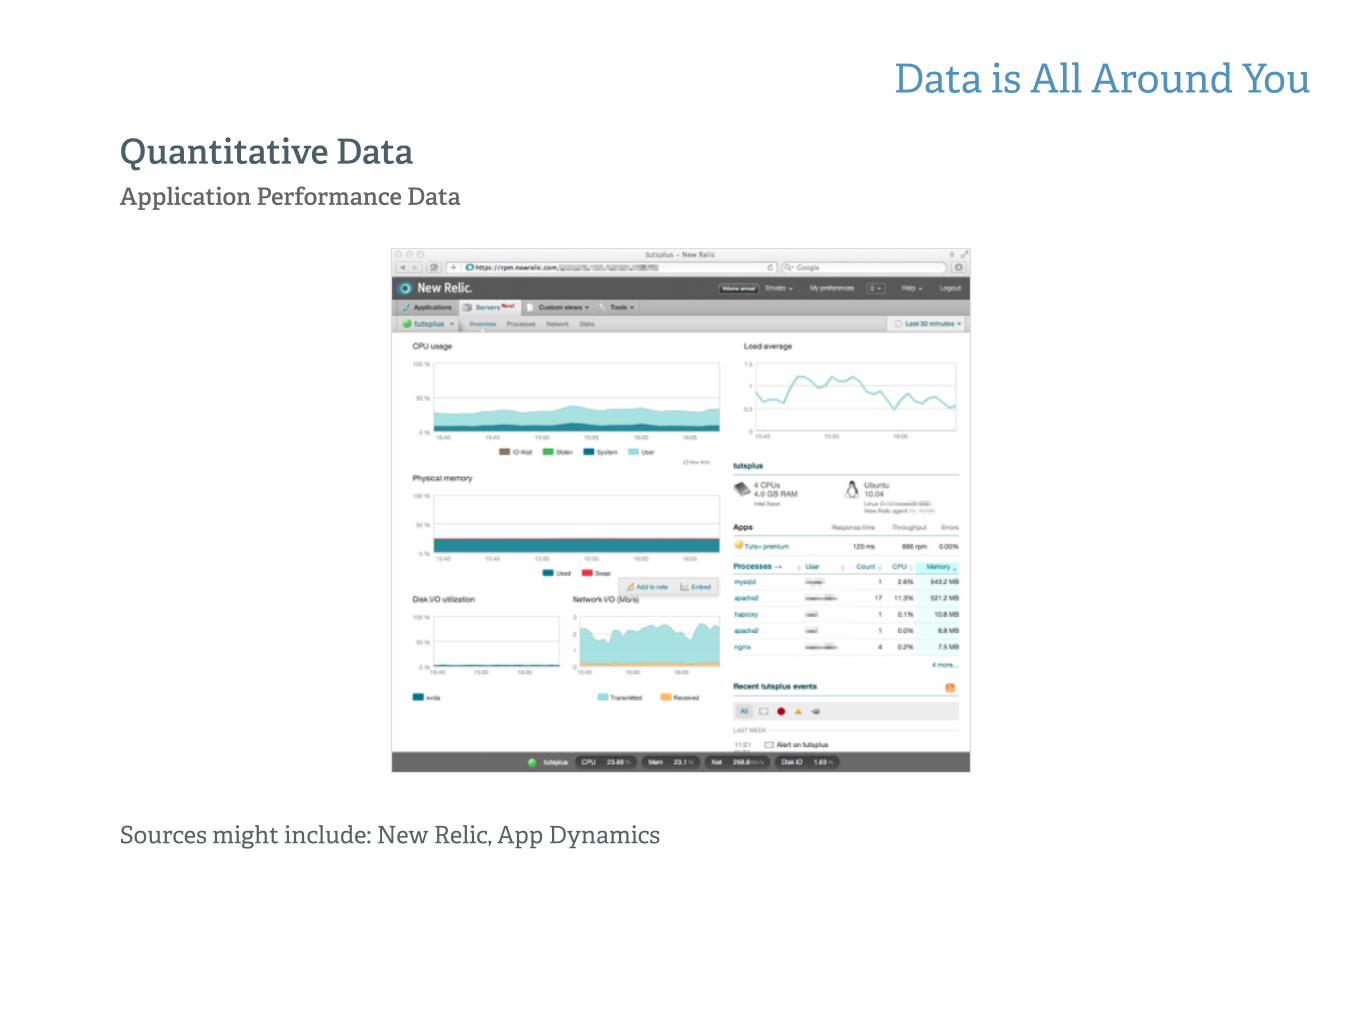
Quantitative Data Application Performance Data
Data is All Around You
Sources might include: New Relic, App Dynamics
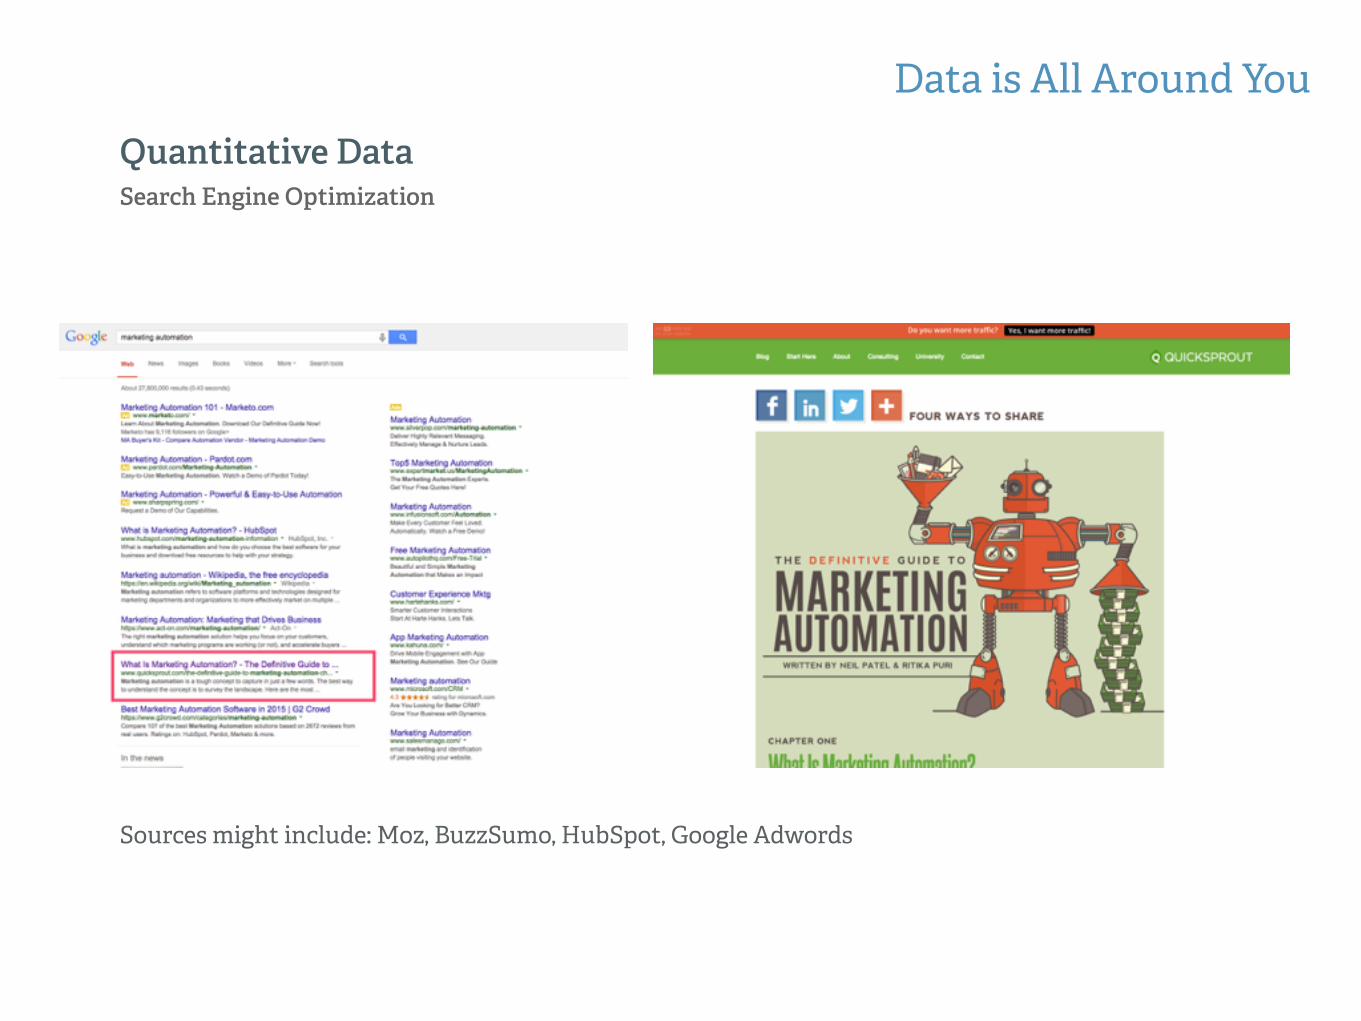
Quantitative Data Search Engine Optimization
Data is All Around You
Sources might include: Moz, BuzzSumo, HubSpot, Google Adwords
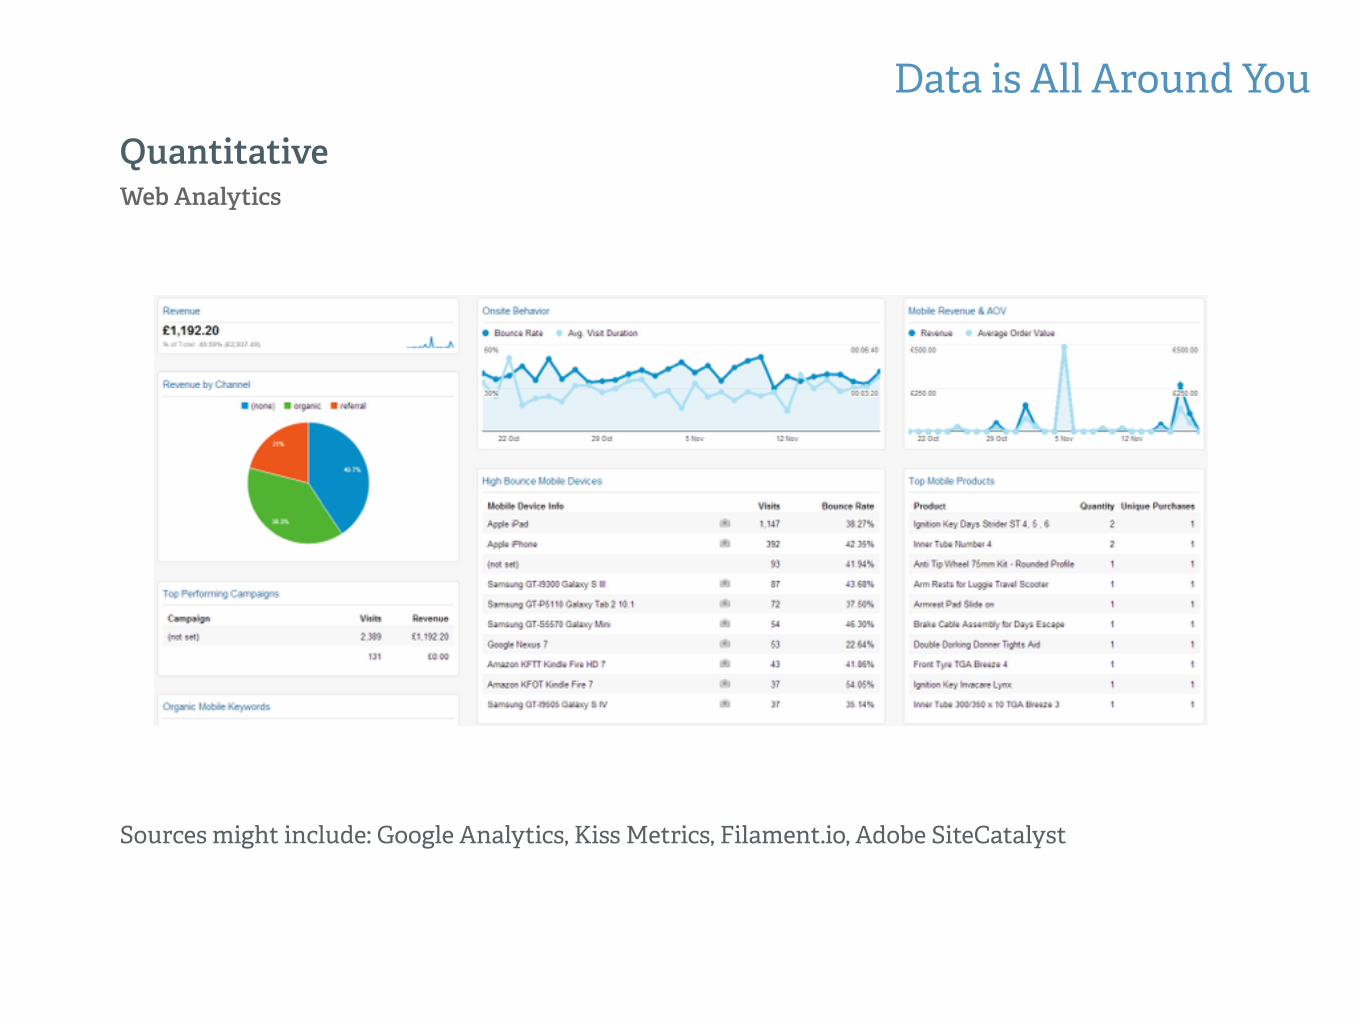
Quantitative Web Analytics
Data is All Around You
Sources might include: Google Analytics, Kiss Metrics, Filament.io, Adobe SiteCatalyst

Qualitative Data Customer Surveys
Data is All Around You
Sources might include: Qualaroo, Intercom, Customer.io

Qualitative Data Customer Interviews
Data is All Around You
Get more info at: goo.gl/Jeol7v

Qualitative Data Personas
Data is All Around You
Get more info at: goo.gl/UW8mgQ
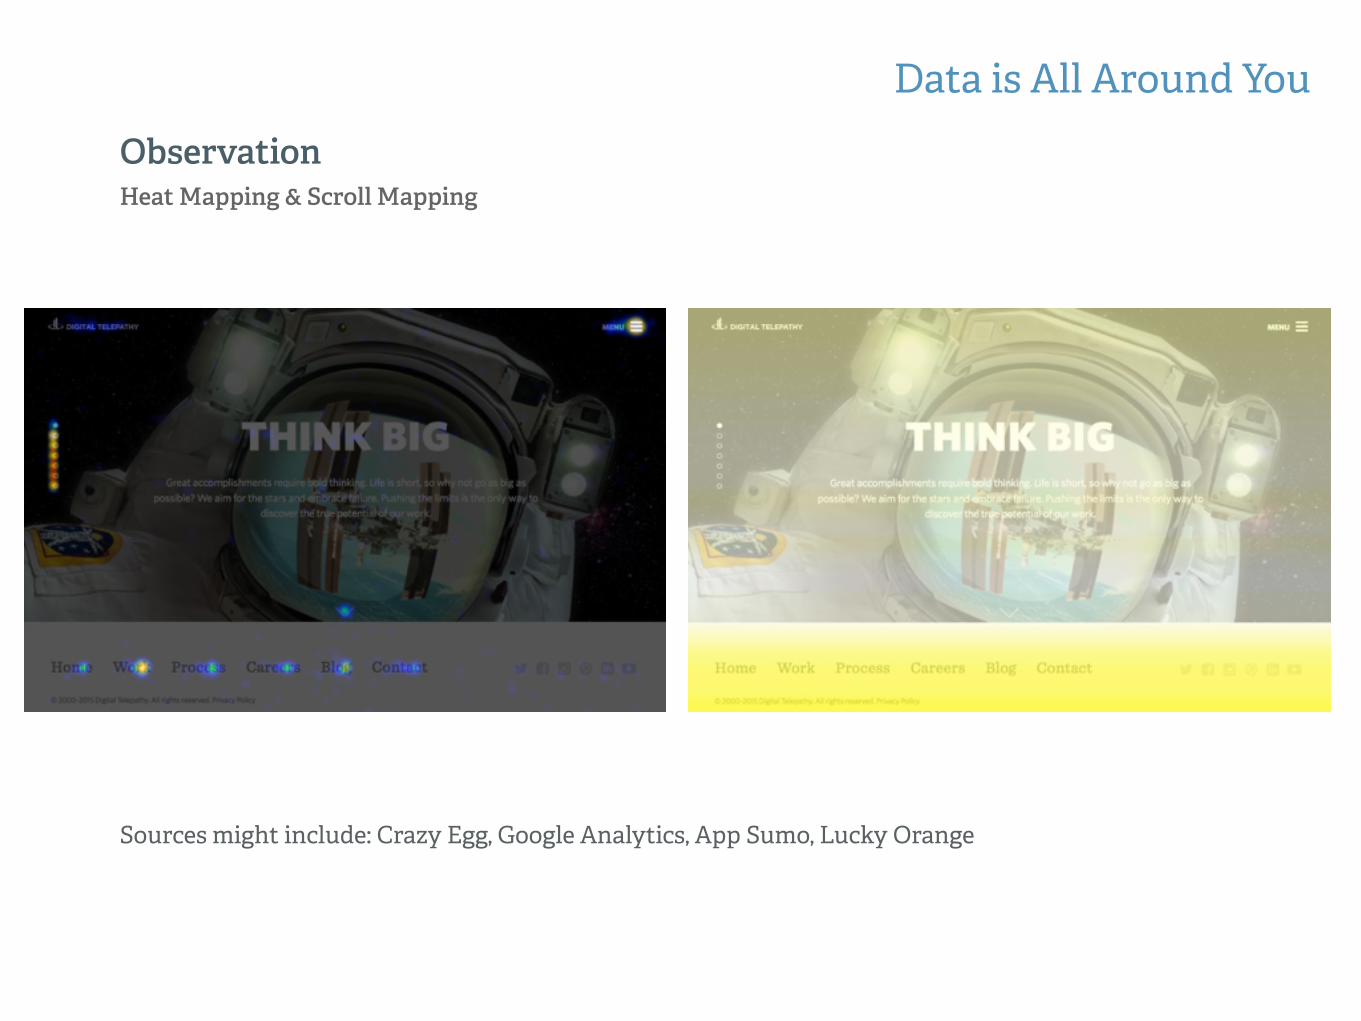
Observation Heat Mapping & Scroll Mapping
Data is All Around You
Sources might include: Crazy Egg, Google Analytics, App Sumo, Lucky Orange
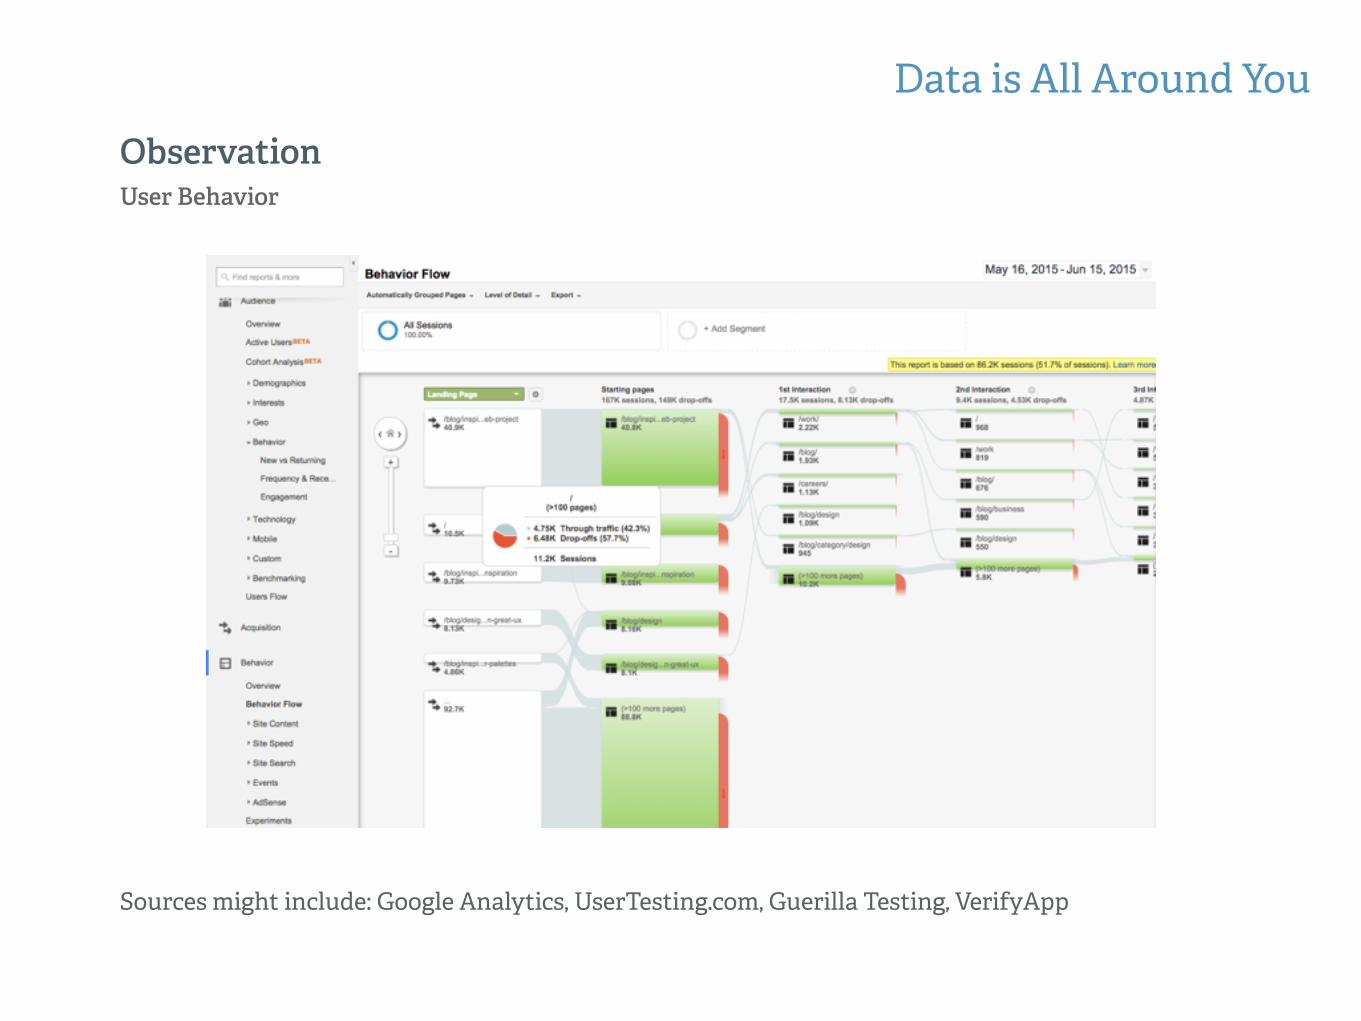
Observation User Behavior
Data is All Around You
Sources might include: Google Analytics, UserTesting.com, Guerilla Testing, VerifyApp

Studies Census, eBooks, Industry Reports
Data is All Around You
Sources might include: Forester, Gartner, Harvard Business Review
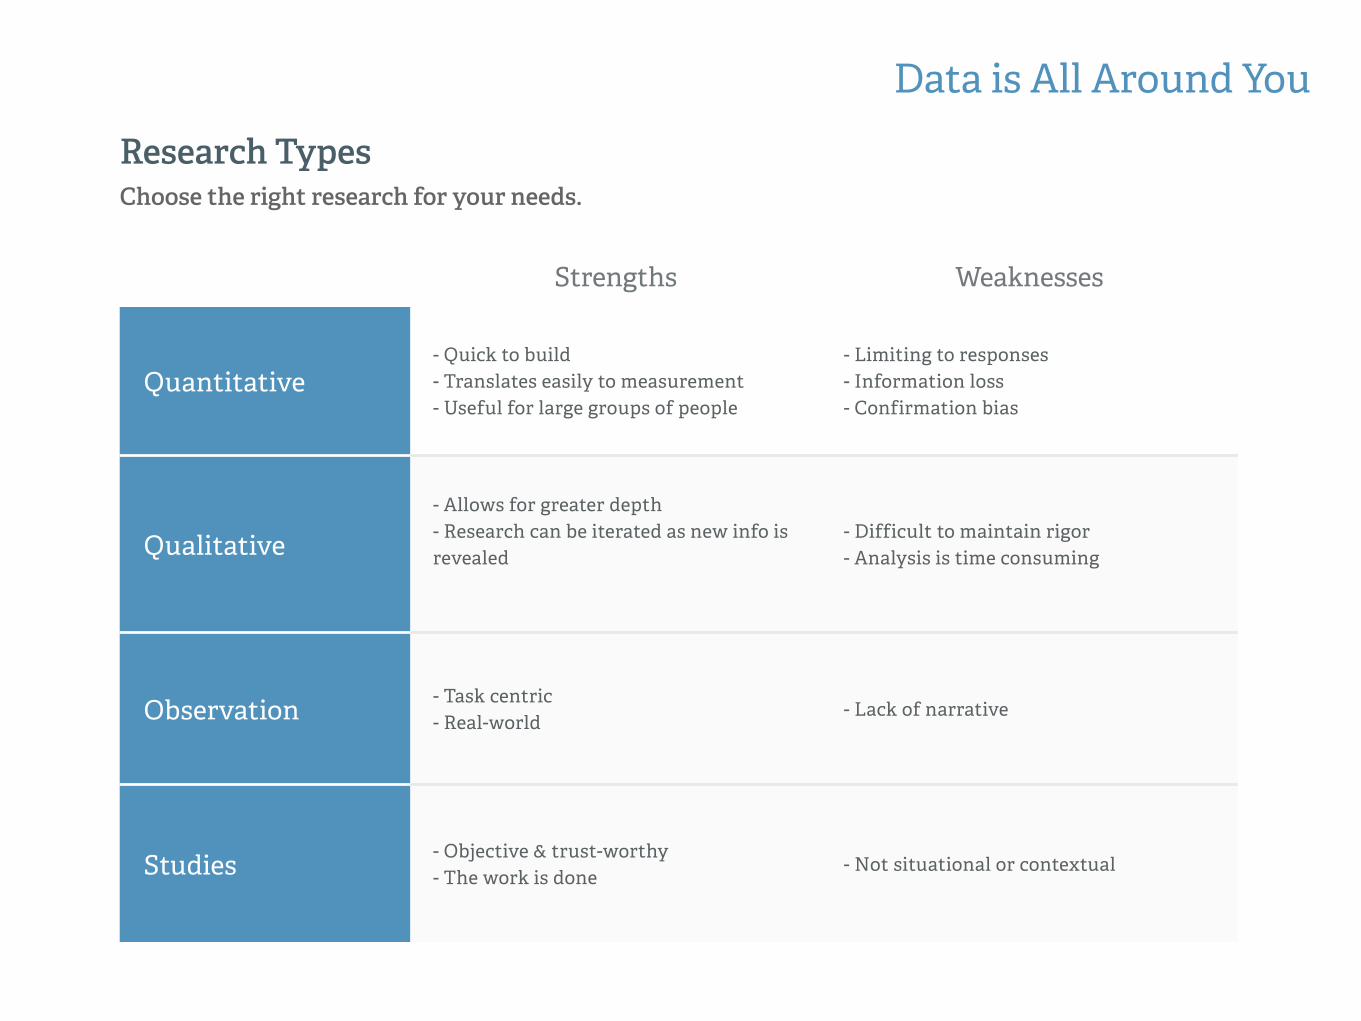
Research Types Choose the right research for your needs.
Data is All Around You
Quantitative- Quick to build - Translates easily to measurement - Useful for large groups of people
- Limiting to responses - Information loss - Confirmation bias
Qualitative- Allows for greater depth - Research can be iterated as new info is revealed
- Difficult to maintain rigor - Analysis is time consuming
Observation - Task centric - Real-world
- Lack of narrative
Studies - Objective & trust-worthy - The work is done
- Not situational or contextual
Strengths Weaknesses

Data Already Informs Design
2

A/B Testing Optimize for conversions.
Data Already Informs Design

Eye Tracking People read in F-Shaped Pa!erns
Data Already Informs Design
h!p://www.nngroup.com/articles/f-shaped-pa!ern-reading-web-content/

Eye Tracking People look where people look.
Data Already Informs Design
h!ps://blog.kissmetrics.com/eye-tracking-studies/

Vertical Rhythm There’s a reason paper is ruled.
Data Already Informs Design
h!p://www.smashingmagazine.com/2009/04/03/8-simple-ways-to-improve-typography-in-your-designs/

Color Psychology What does your brand color say about your business?
Data Already Informs Design
h!p://www.helpscout.net/blog/psychology-of-color/
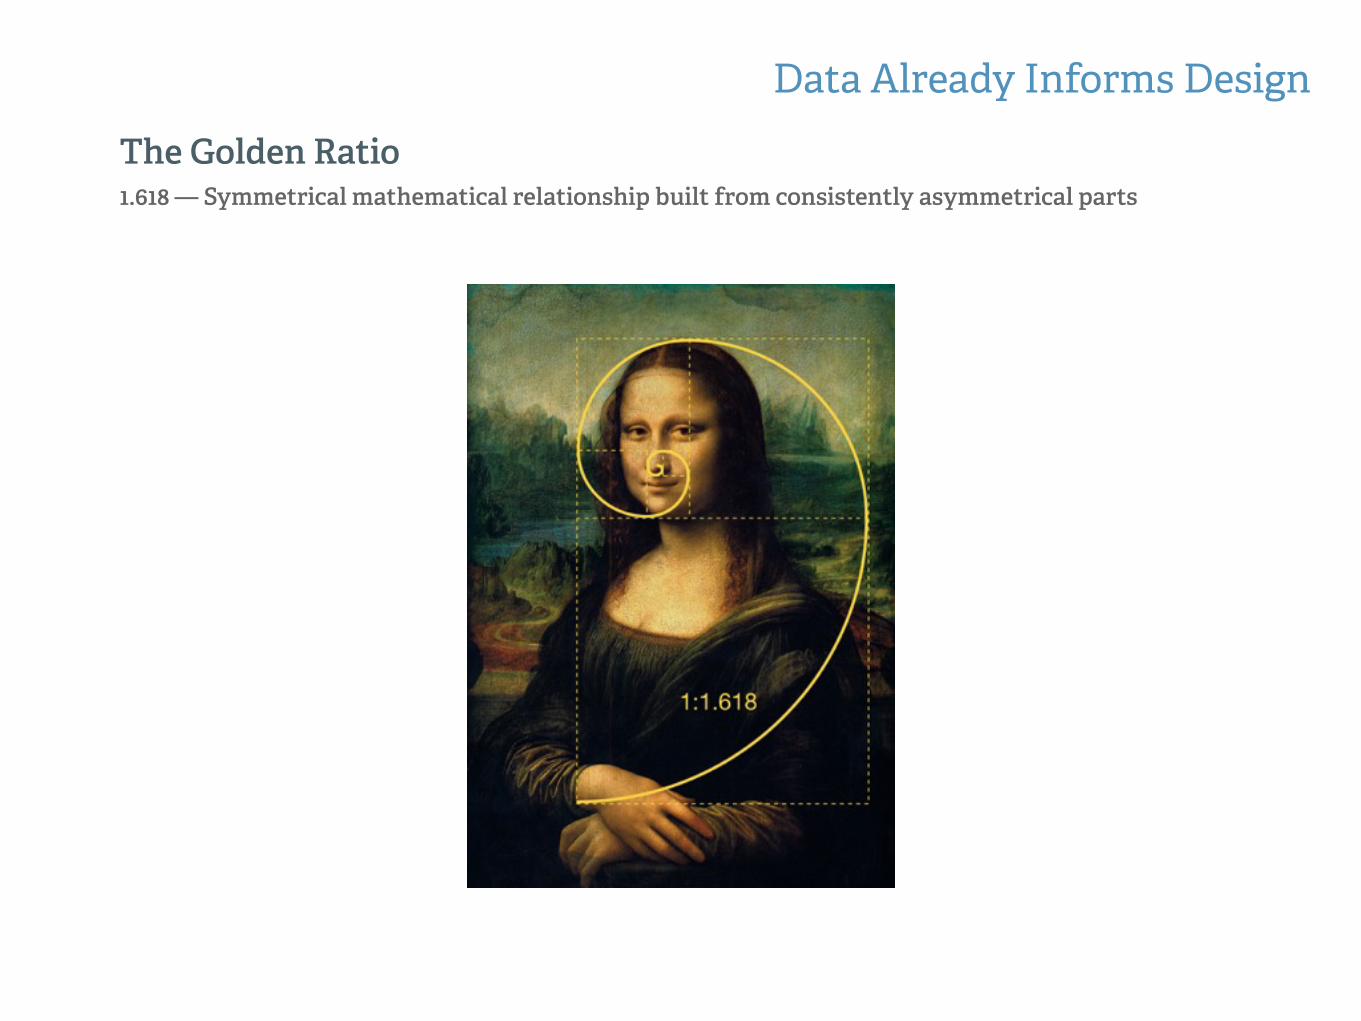
The Golden Ratio 1.618 — Symmetrical mathematical relationship built from consistently asymmetrical parts
Data Already Informs Design

Consider the Entire User Journey
3

Identify the Friction Evaluate sentiment/friction at each stage of the user journey.
Consider the Entire User Journey

Defining the User Journey Each stage represents a unique opportunity to impact your bo!om line.
Consider the Entire User Journey
Awareness User becomes aware of their problem, or your product or service (happens off-site)
Coverage Mentions
Consideration You communicate your unique value proposition to your userBounce Rate Time on Site / PPV
Acquisition The point at which an anonymous visitor becomes named. Trial Signups Subscriptions
Conversion The act of purchasing a product or service through self service or a sales process.
Sales Upgrades
Activation Interaction with product/site/service post signup Churn Upgrades
Retention Post-purchase. Activities that drive further product engagement, adoption and upgrades.
Renewal
Advocacy When users of your product or service promote your product on behalf of your brand.
Social Shares Referrals
Definition Common Metrics

LOG IN WITH GOOGLE
Start Your Free KISSmetrics Trial

Designing forBusiness Objectives
4

Identify the Friction Where can you make the biggest impact?
Designing for Business Objectives

User Journey Consideration: You communicate your unique value proposition to your user.
Designing for Business Objectives
Designing for Business Objectives
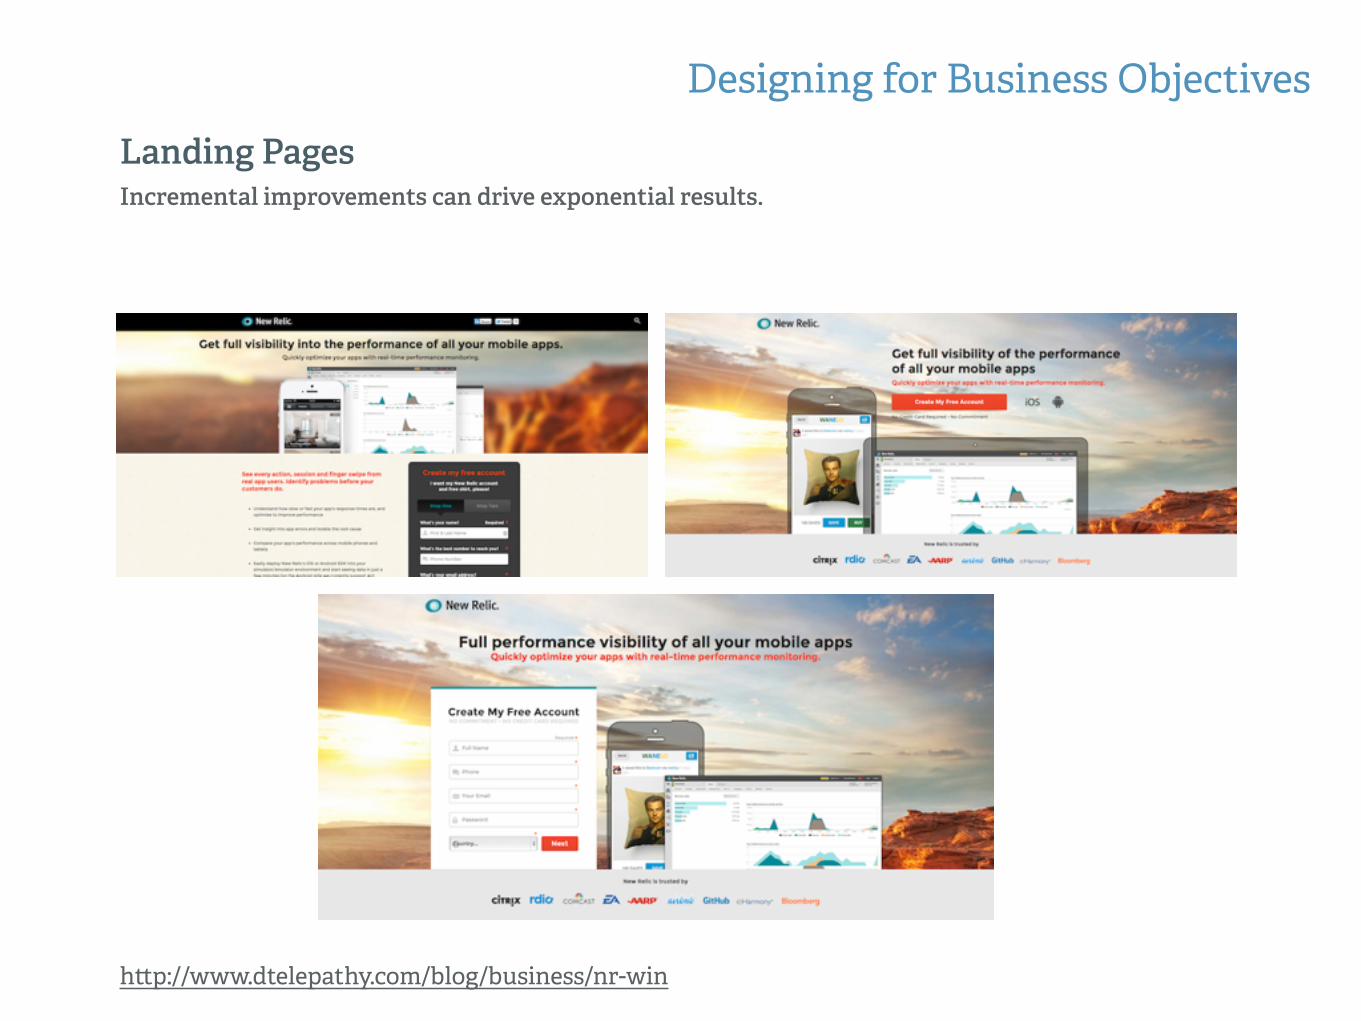
Landing Pages Incremental improvements can drive exponential results.
h!p://www.dtelepathy.com/blog/business/nr-win

Designing for Business Objectives
Be!er Social Sharing Social sharing + content performance insights.
h!p://www.filament.io/flare

Designing for Business Objectives
Animations Scroll is the new click.

Designing for Business Objectives
Change Language Try different value proposition, calls to action, etc.
Designing for Business Objectives
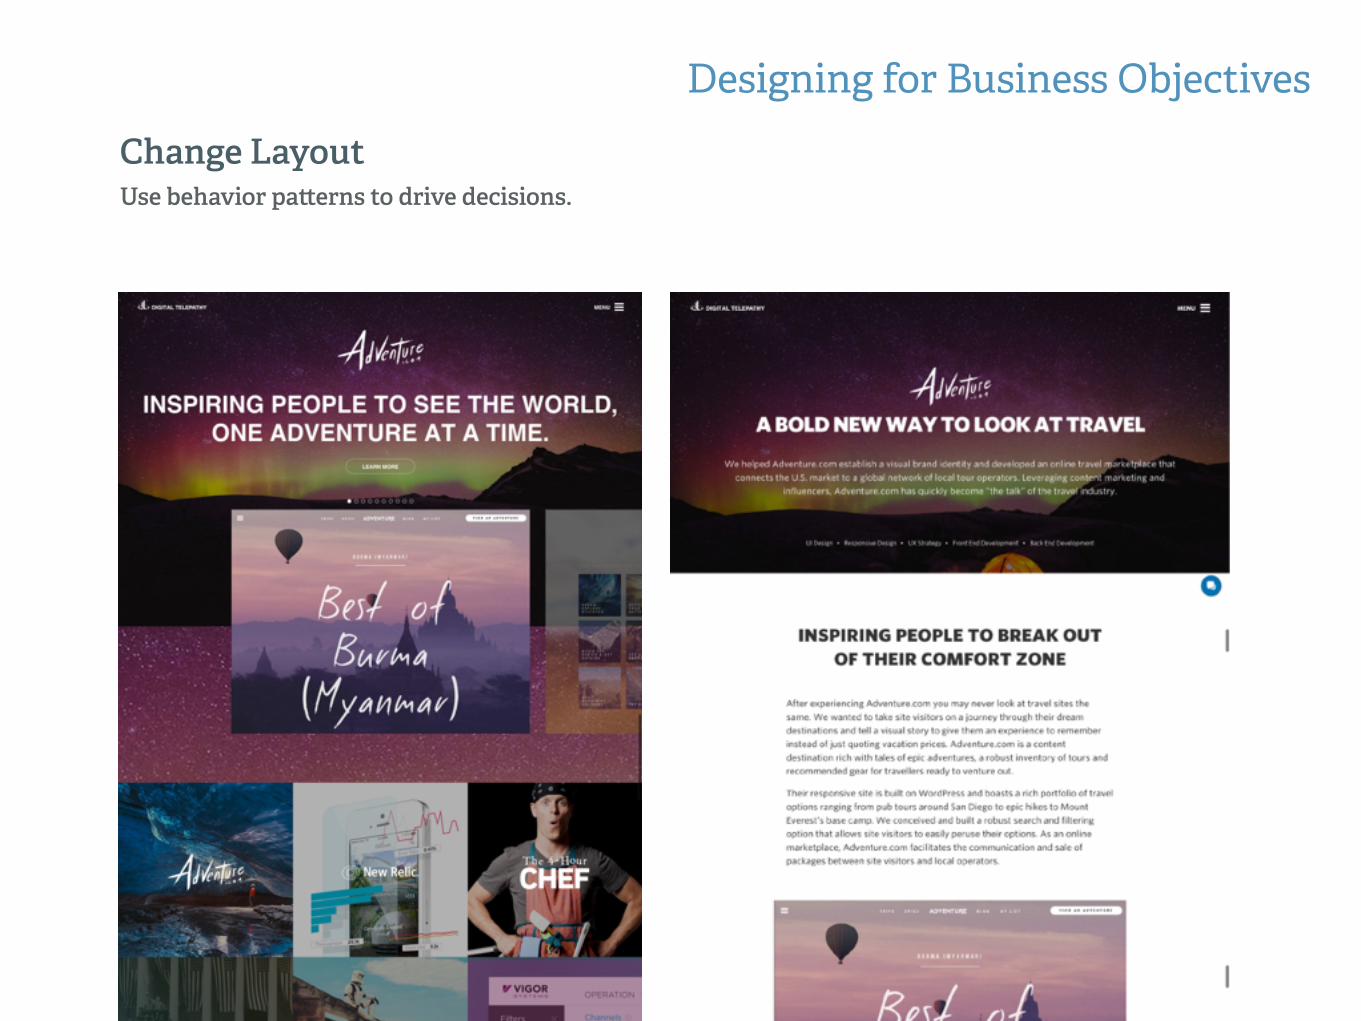
Change Layout Use behavior pa!erns to drive decisions.

User Journey Conversion: The act of purchasing a product or service through self service or a sales process.
Designing for Business Objectives
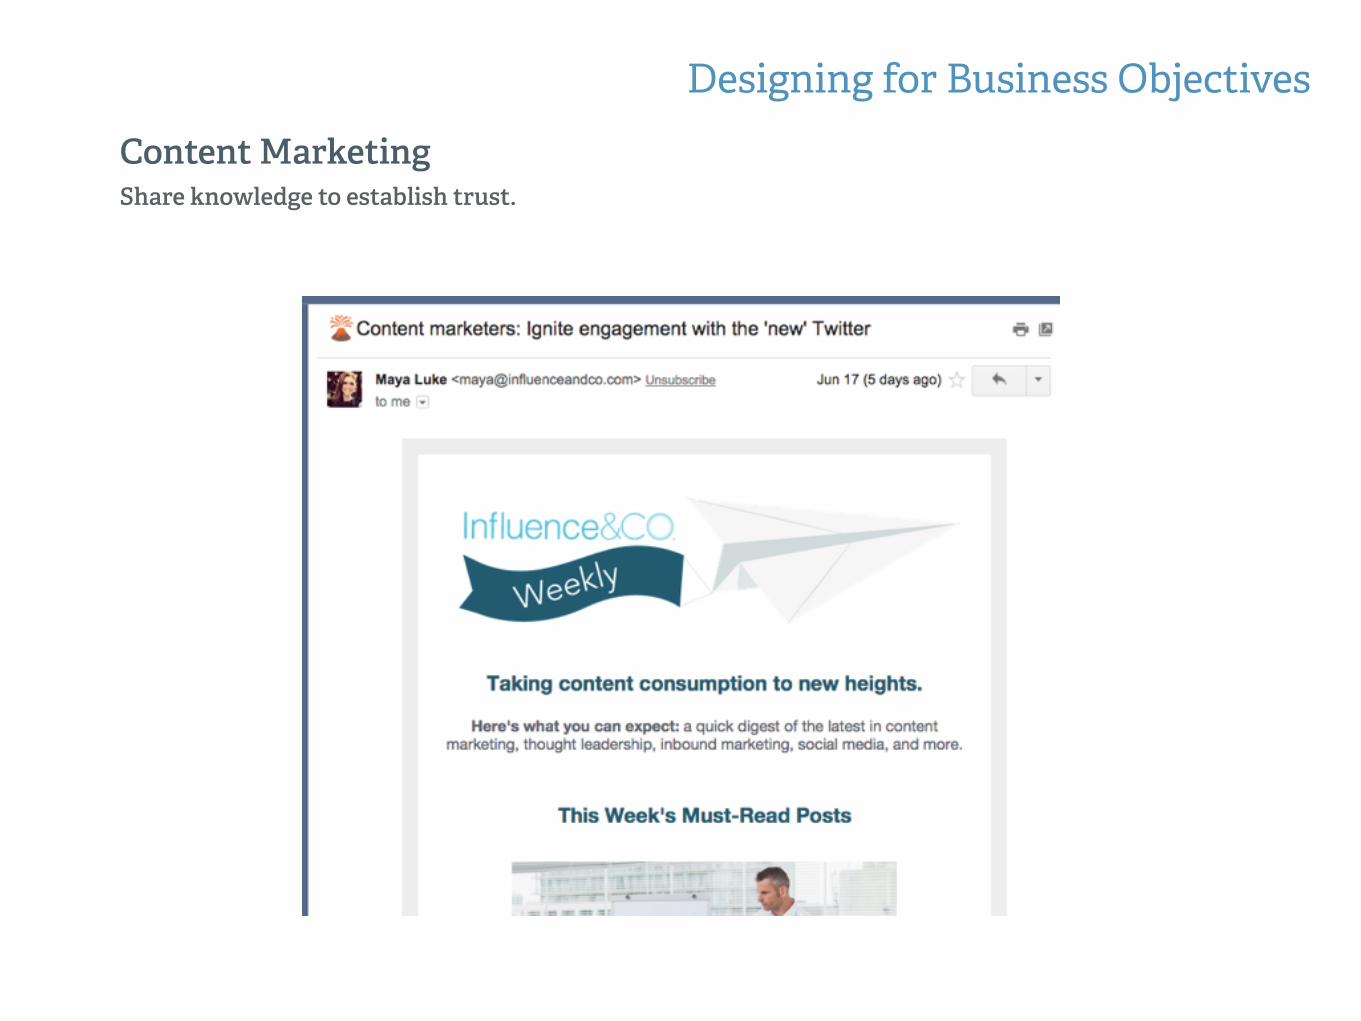
Content Marketing Share knowledge to establish trust.
Designing for Business Objectives

Onboarding Step-by-step walkthroughs for new users.
Designing for Business Objectives
h!p://www.dtelepathy.com/blog/design/ux-flows-onboarding

Get the First Click Break through psychological barriers.
Designing for Business Objectives

User Journey Retention: Post-purchase. Activities that drive further product engagement, adoption and upgrades.
Designing for Business Objectives
Designing for Business Objectives
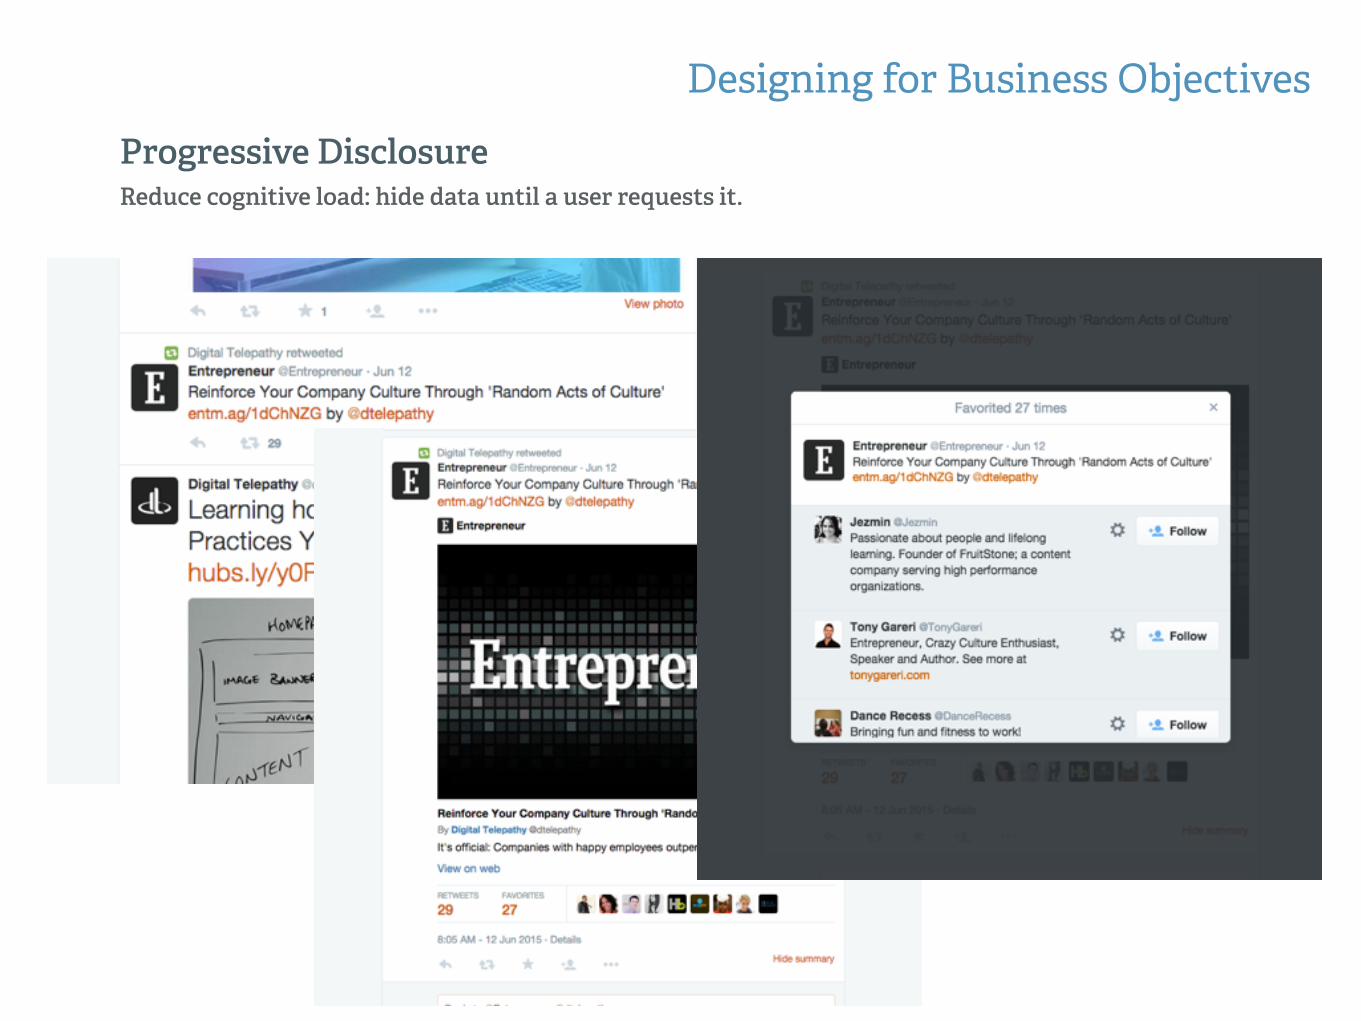
Progressive Disclosure Reduce cognitive load: hide data until a user requests it.

Designing for Business Objectives
Progressive Reduction Simplify your user interface for experienced users.
h!p://blog.invisionapp.com/the-challenges-with-progressive-reduction/

Designing for Business Objectives
Testimonials “Who doesn’t love social proof?” - Brent Summers

Prioritizing Your Backlog
5

Keep Track of Experiments At Digital Telepathy we like Trello, Spreadsheets, and Post-Its.
Prioritizing Your Backlog

Prioritizing Your Backlog

Practical Advice Use a formula to assess which experiments to do first.
Prioritizing Your Backlog

Sample Experiments Which of these experiments should be implemented first?
Prioritizing Your Backlog
Experiment 1 Experiment 2 Experiment 3
Observation I’m not meeting my sales forecastsOpen-rates are very low on some blog posts.
People aren’t understanding how to get started in my app.
Hypothesis Site visitors don’t understand my product.
“How to” post titles work better than “## Listicle” titles.
People aren’t understanding how to get started in my app.
Experiment Try different value propositions.Rewrite a former listicle topic as a “How to”.
Send a drip explaining product features over the course of the trial period.
Effectiveness Rating
8 / 4 = 2 2 / 4 = 0.5 10 / 4 = 2.5
KPIsBounce rate Time on site Acquisition rate
Open rate Click-thru rate Share rate
Churn rate Paid conversions

What does the data tell you? Identify where can design make the biggest impact.
Prioritizing Your Backlog

Rounding Out the Process Your implementation method is unique. Measure the results. Repeat.
Prioritizing Your Backlog

Measuring Success
6
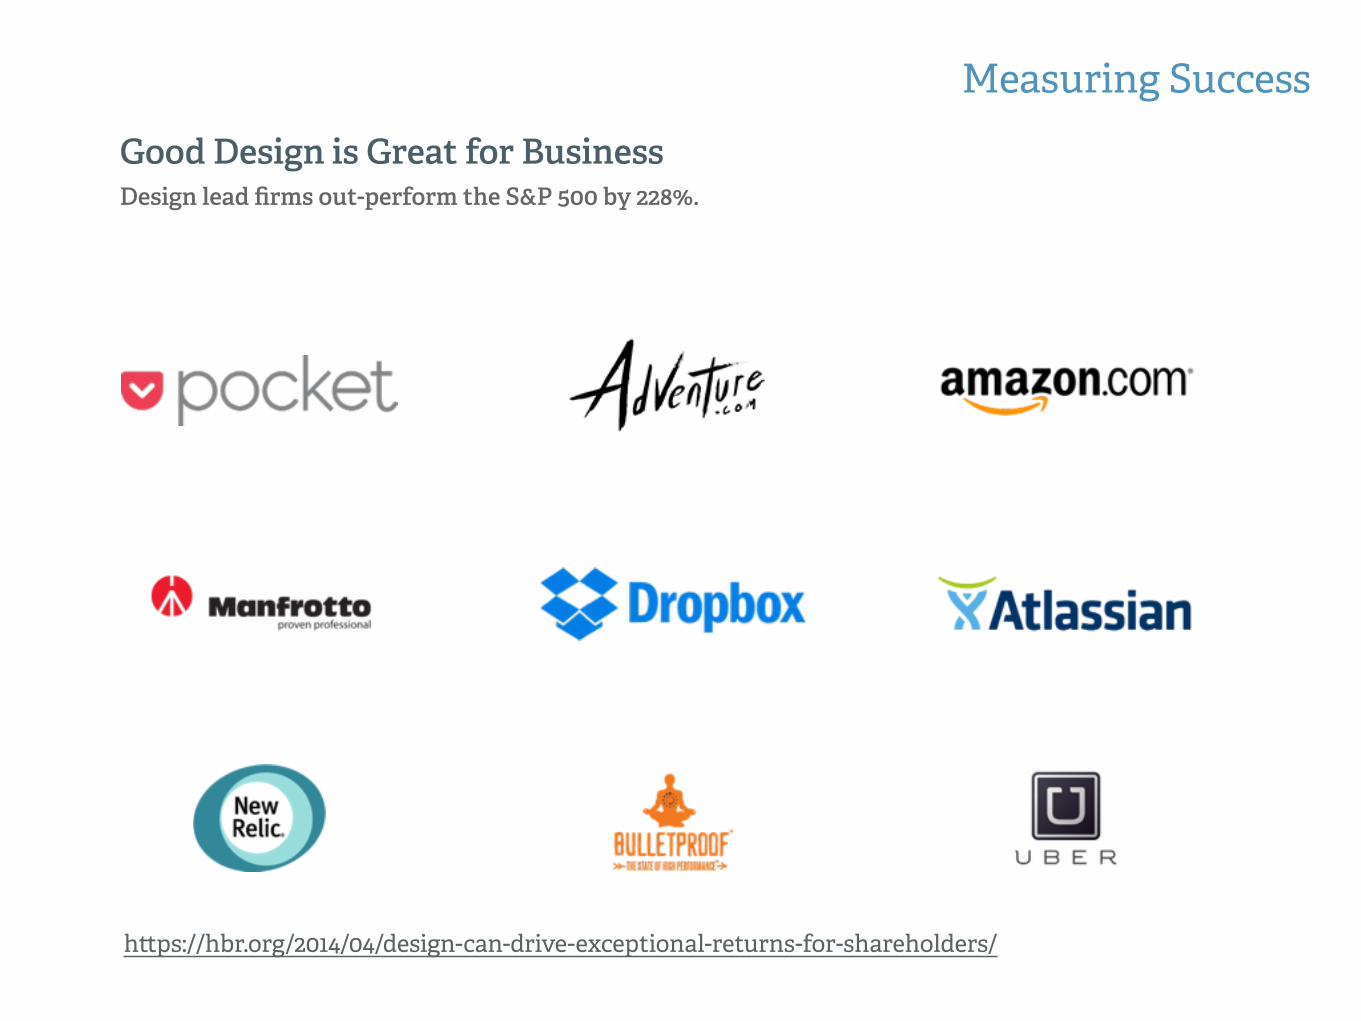
Good Design is Great for Business Design lead firms out-perform the S&P 500 by 228%.
Measuring Success
h!ps://hbr.org/2014/04/design-can-drive-exceptional-returns-for-shareholders/

Spend A Li!le to Get A Lot That’s one helluva return.
“Numerous industry studies have stated that every dollar spent on UX brings in between $2 and $100 dollars in return”
— Peter Eckert
h!p://www.fastcodesign.com/1669283/dollars-and-sense-the-business-case-for-investing-in-ui-design
Measuring Success

Questions?
Brent Summers Director of Marketing & Content
Digital Telepathy @brentsummers
Thue Madsen Marketing Operations
KISSmetrics @thuelmadsen

THANK YOU
Brent Summers Director of Marketing & Content @ Digital Telepathy