how to put momentum strategies in context to achieve high percentage ... · how to put momentum...
TRANSCRIPT
How to put momentum strategies in context to achieve high percentage
winning trades
Suzanne Bodlovic [email protected]
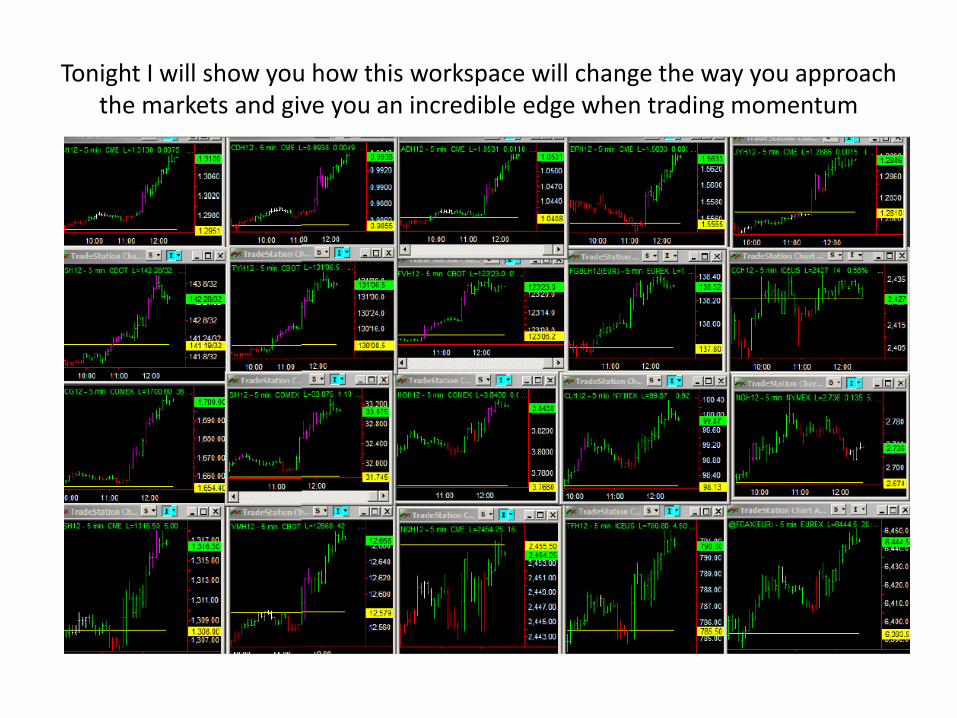
Tonight I will show you how this workspace will change the way you approach the markets and give you an incredible edge when trading momentum
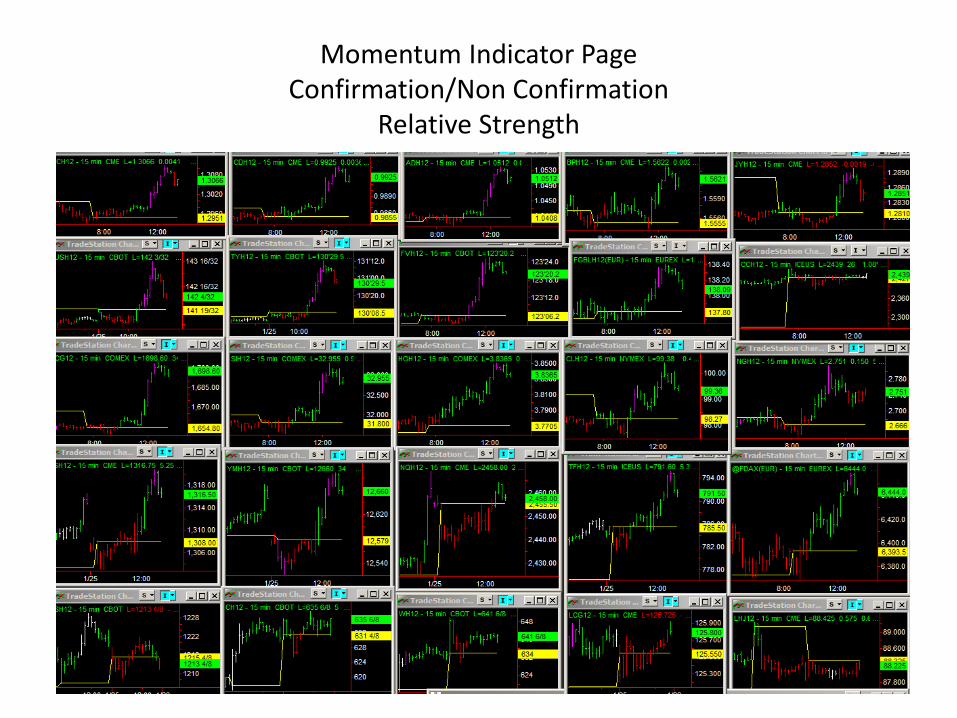
Momentum Indicator Page Confirmation/Non Confirmation
Relative Strength

Put your momentum strategy in context to add a new dimension to your trading and increase your bottom line!
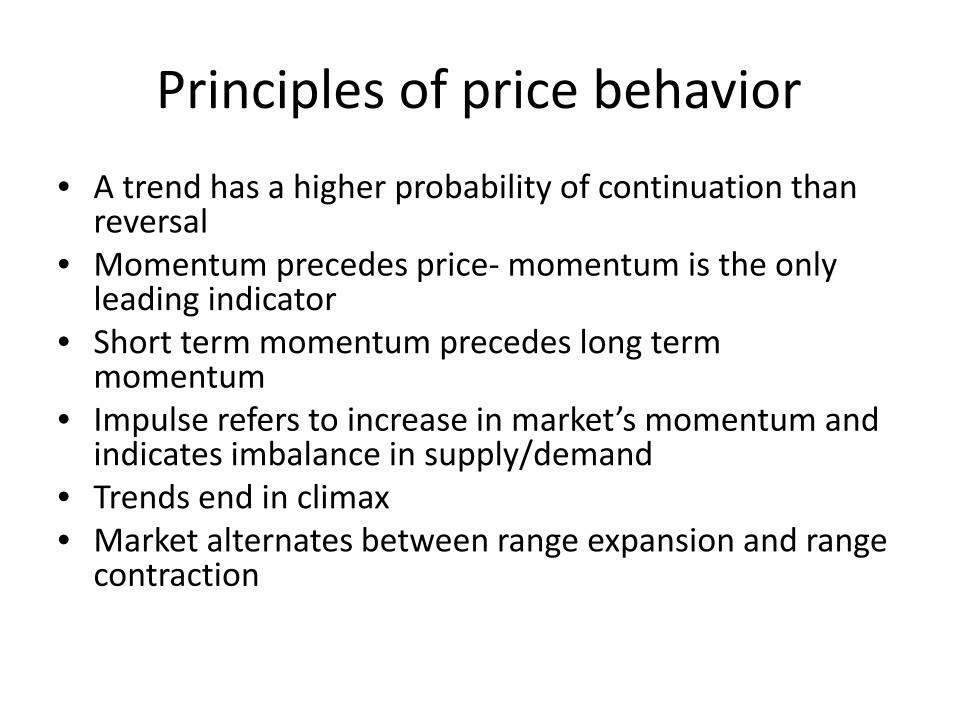
Principles of price behavior • A trend has a higher probability of continuation than
reversal • Momentum precedes price- momentum is the only
leading indicator • Short term momentum precedes long term
momentum • Impulse refers to increase in market’s momentum and
indicates imbalance in supply/demand • Trends end in climax • Market alternates between range expansion and range
contraction
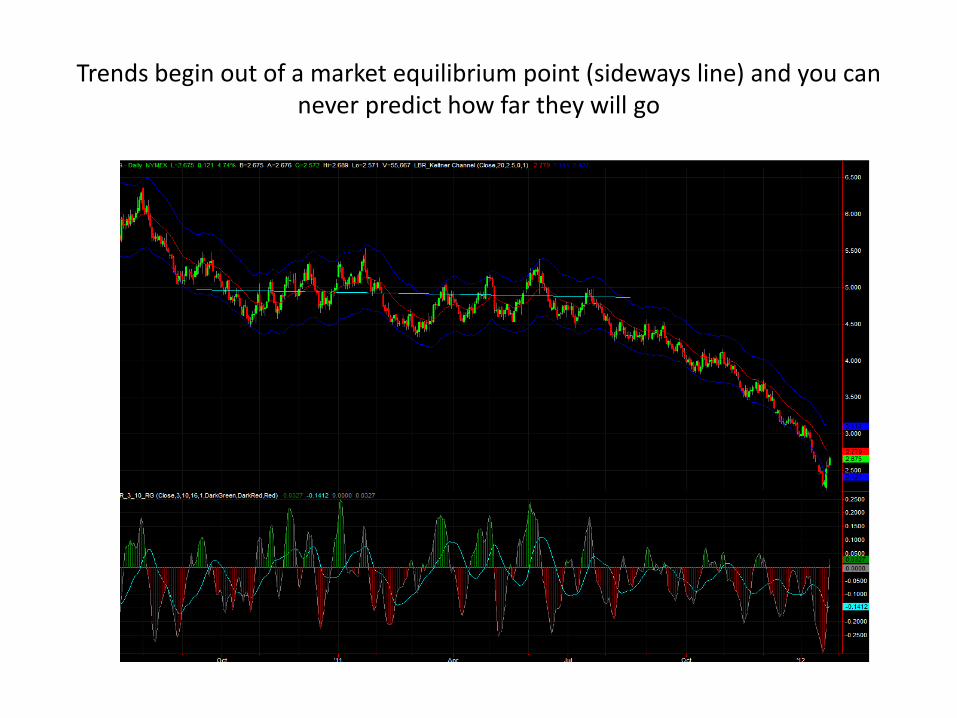
Trends begin out of a market equilibrium point (sideways line) and you can never predict how far they will go
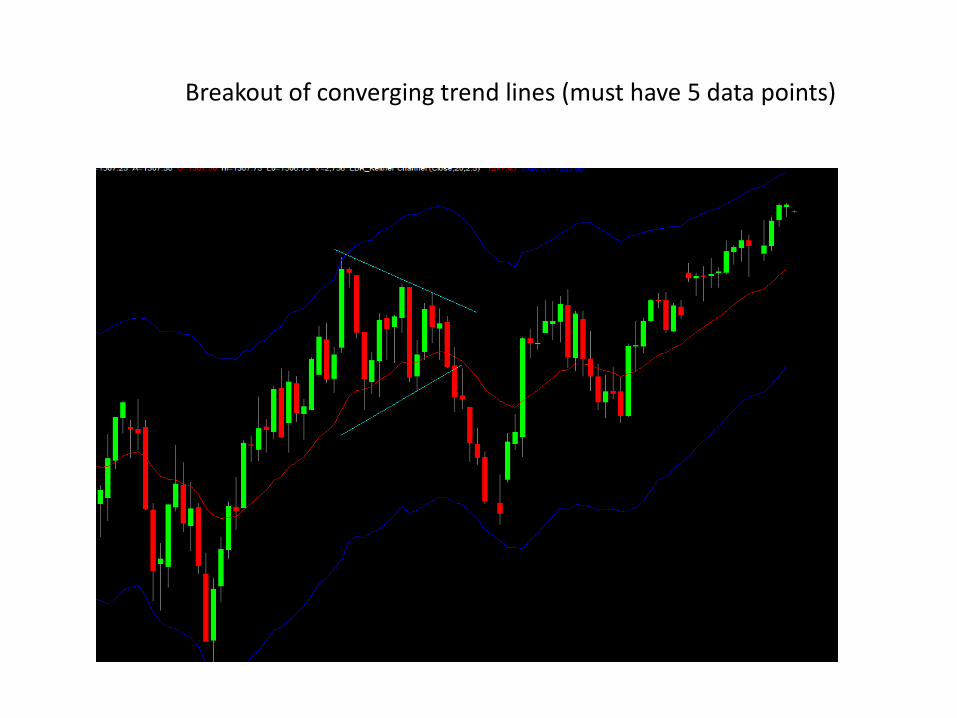
Breakout of converging trend lines (must have 5 data points)
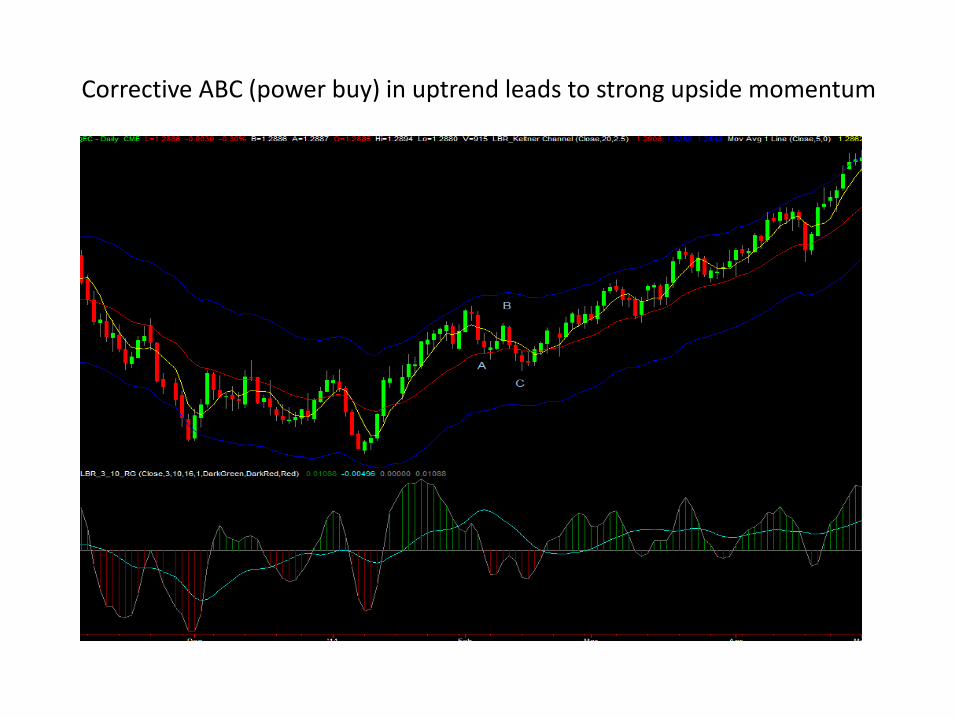
Corrective ABC (power buy) in uptrend leads to strong upside momentum
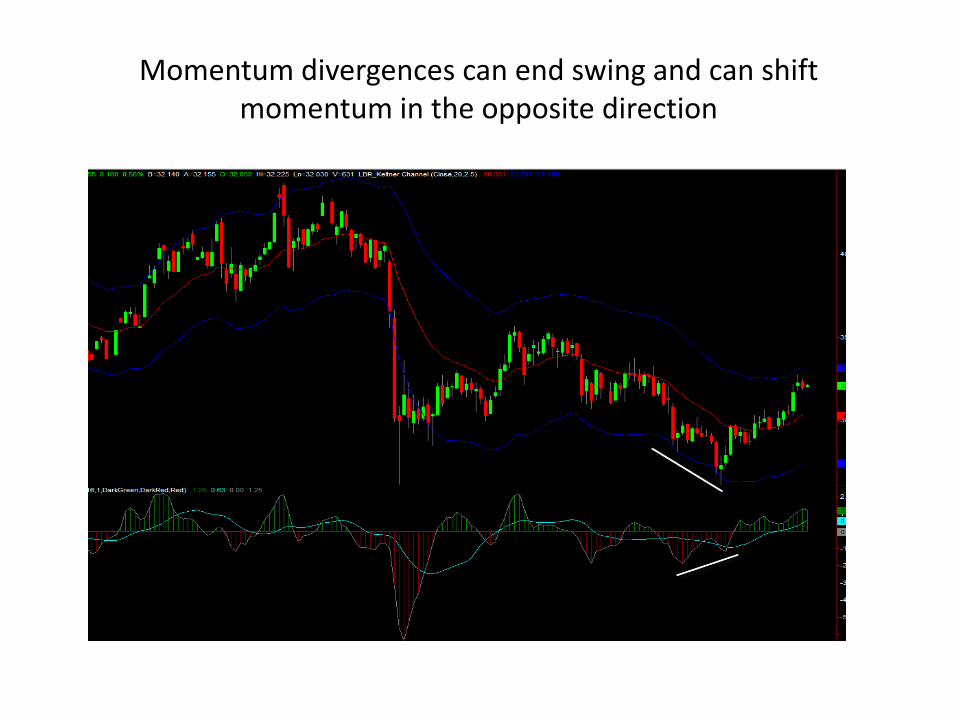
Momentum divergences can end swing and can shift momentum in the opposite direction
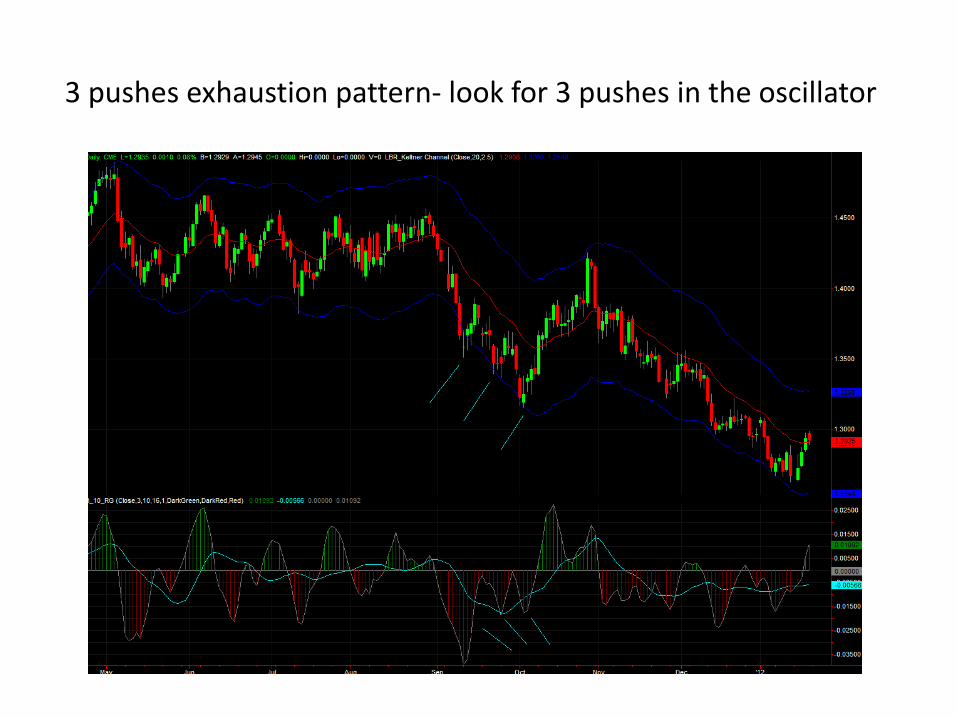
3 pushes exhaustion pattern- look for 3 pushes in the oscillator
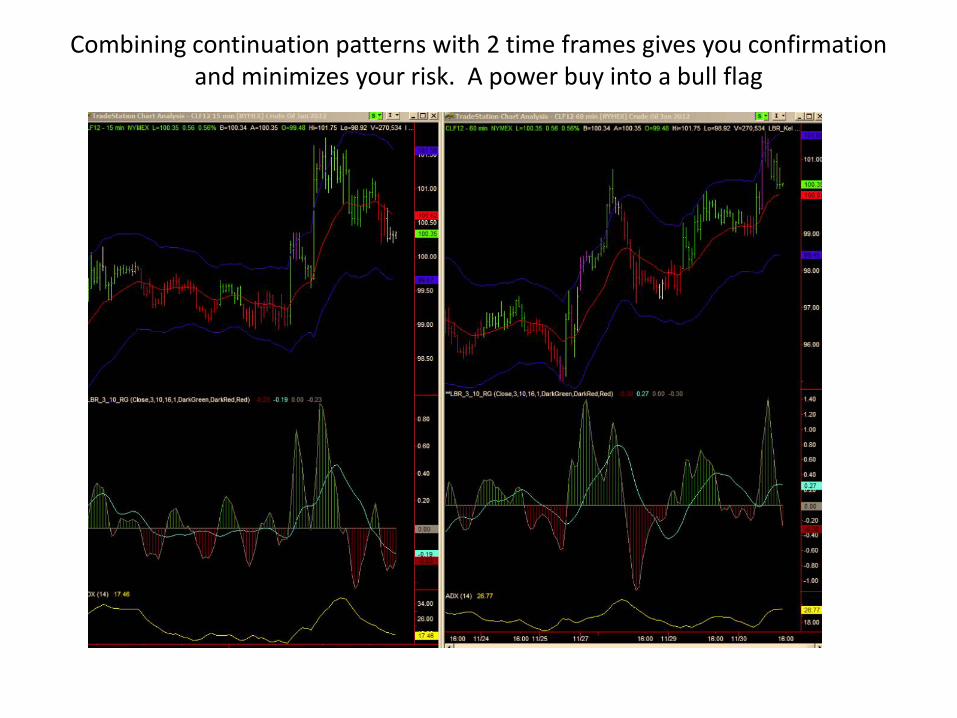
Combining continuation patterns with 2 time frames gives you confirmation and minimizes your risk. A power buy into a bull flag
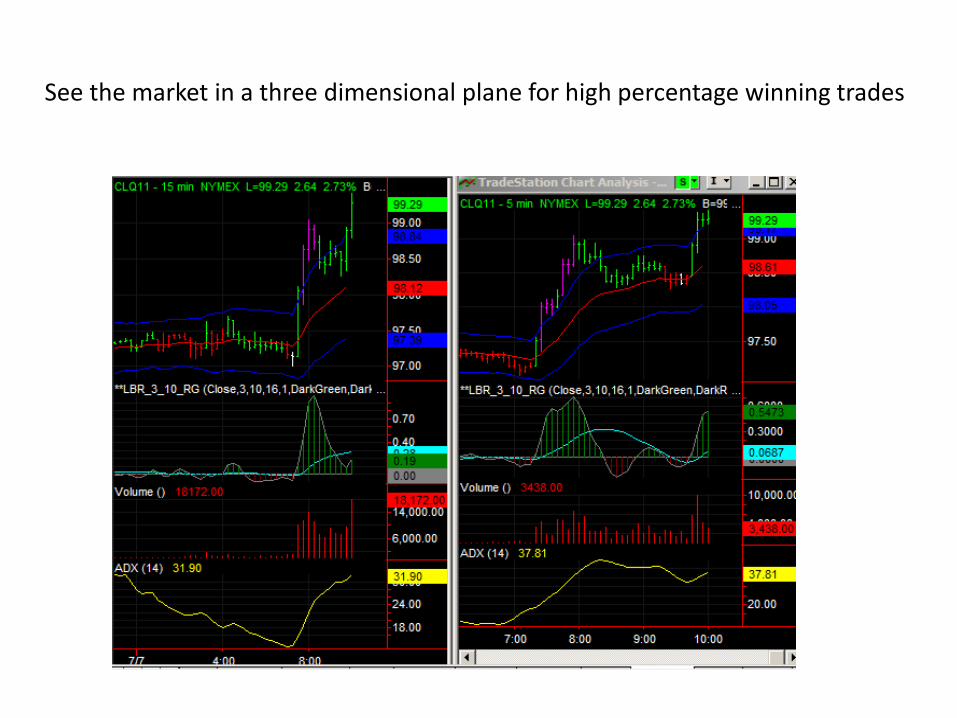
See the market in a three dimensional plane for high percentage winning trades
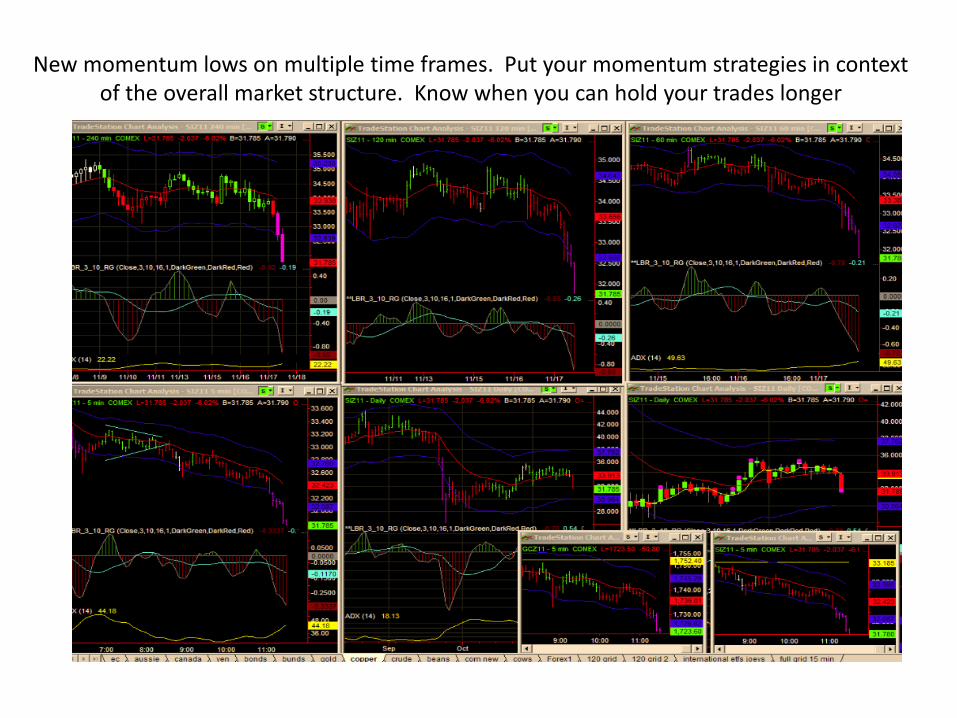
New momentum lows on multiple time frames. Put your momentum strategies in context of the overall market structure. Know when you can hold your trades longer
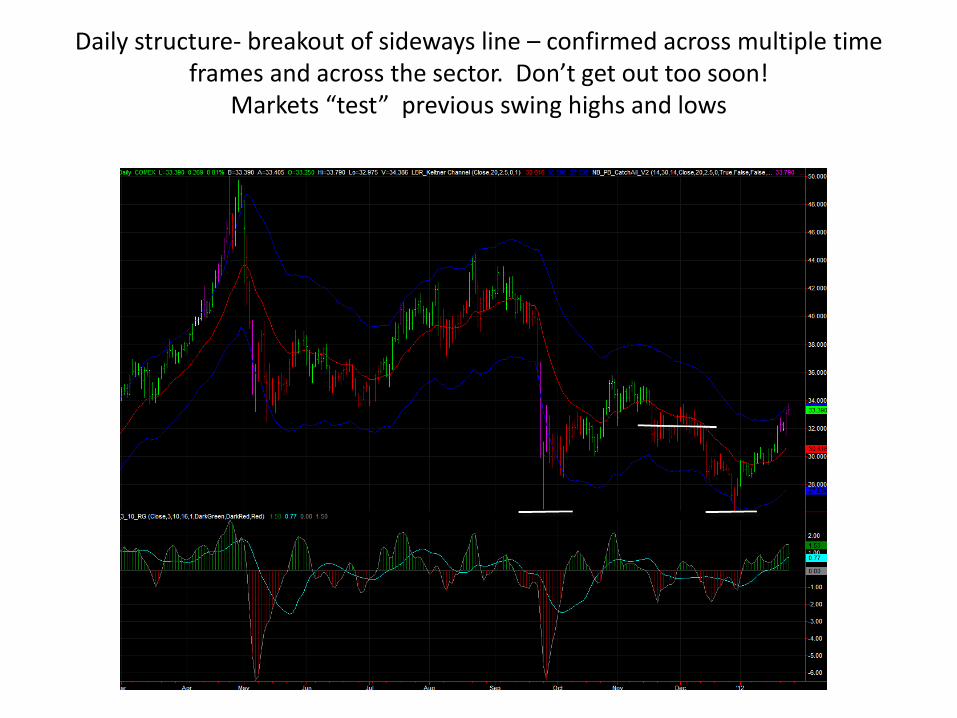
Daily structure- breakout of sideways line – confirmed across multiple time frames and across the sector. Don’t get out too soon!
Markets “test” previous swing highs and lows
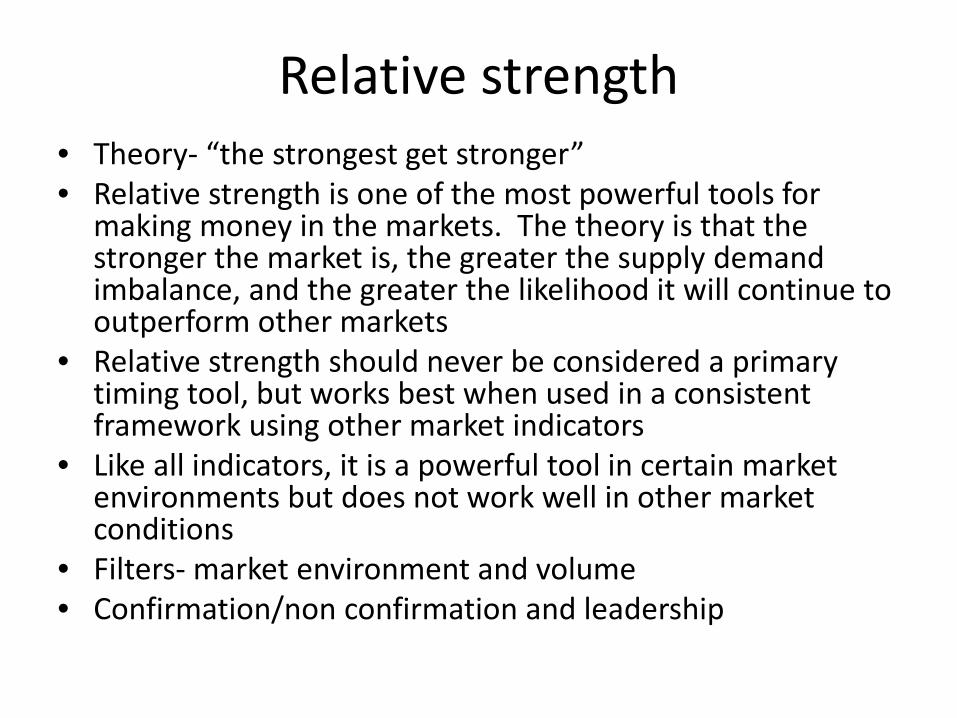
Relative strength • Theory- “the strongest get stronger” • Relative strength is one of the most powerful tools for
making money in the markets. The theory is that the stronger the market is, the greater the supply demand imbalance, and the greater the likelihood it will continue to outperform other markets
• Relative strength should never be considered a primary timing tool, but works best when used in a consistent framework using other market indicators
• Like all indicators, it is a powerful tool in certain market environments but does not work well in other market conditions
• Filters- market environment and volume • Confirmation/non confirmation and leadership
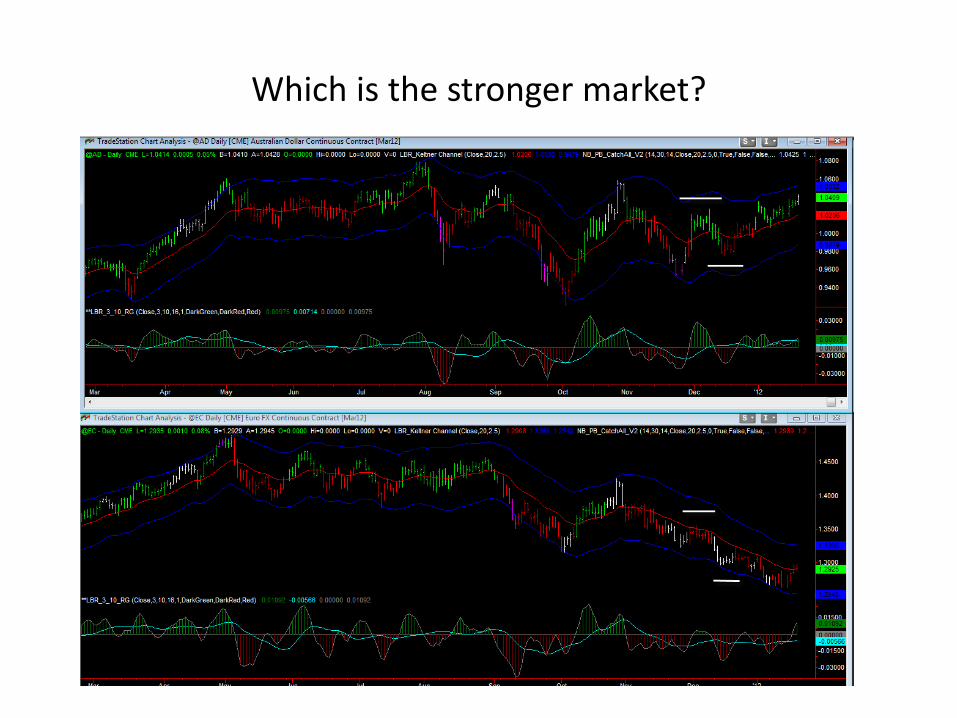
Which is the stronger market?
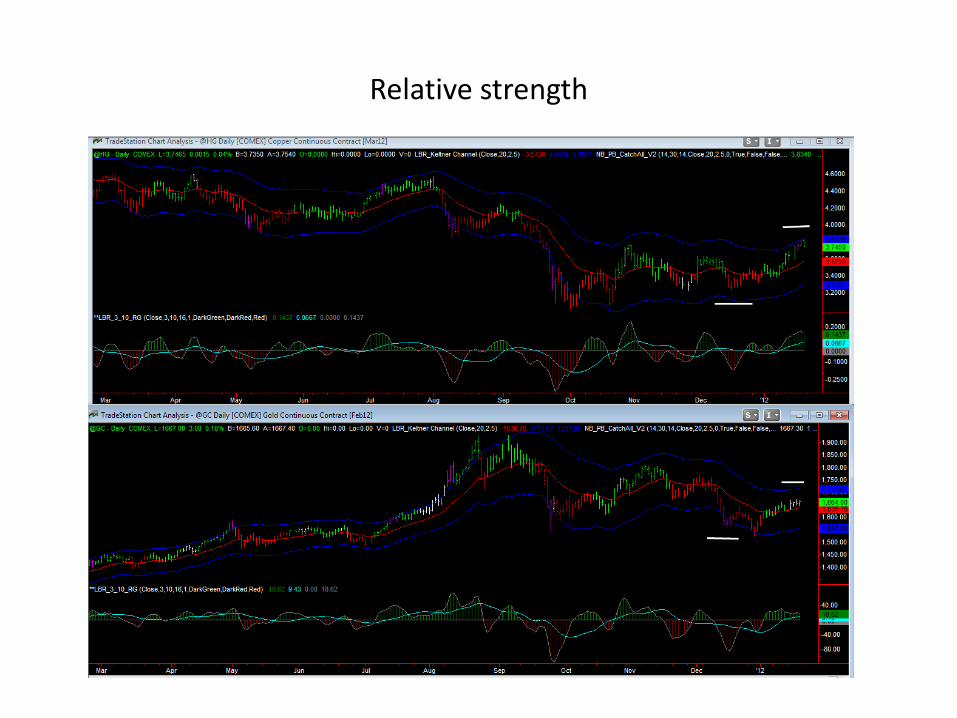
Relative strength
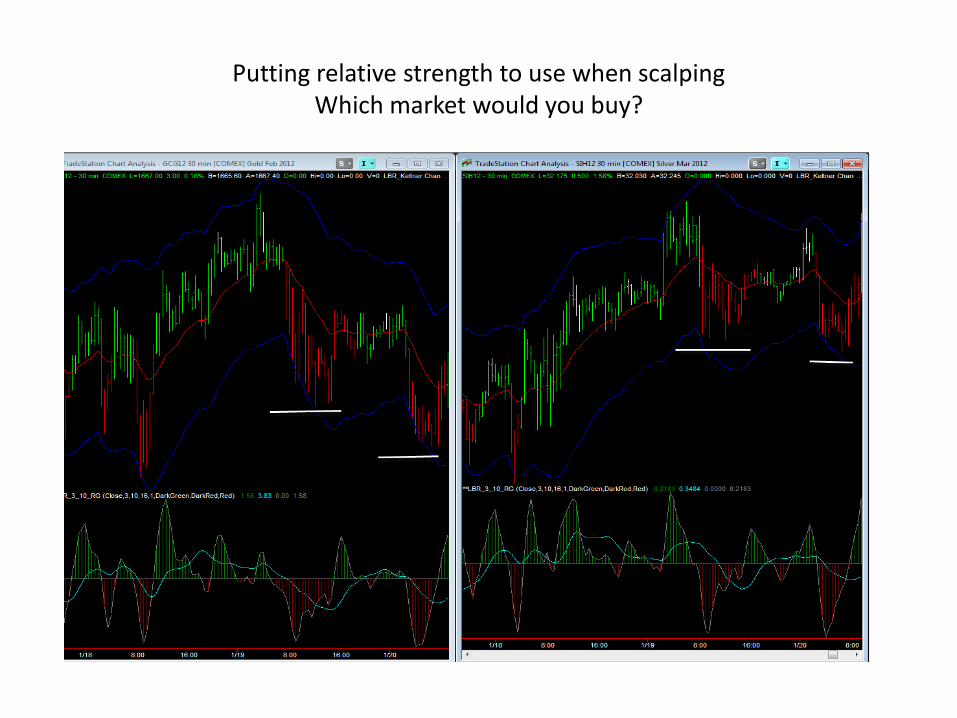
Putting relative strength to use when scalping Which market would you buy?
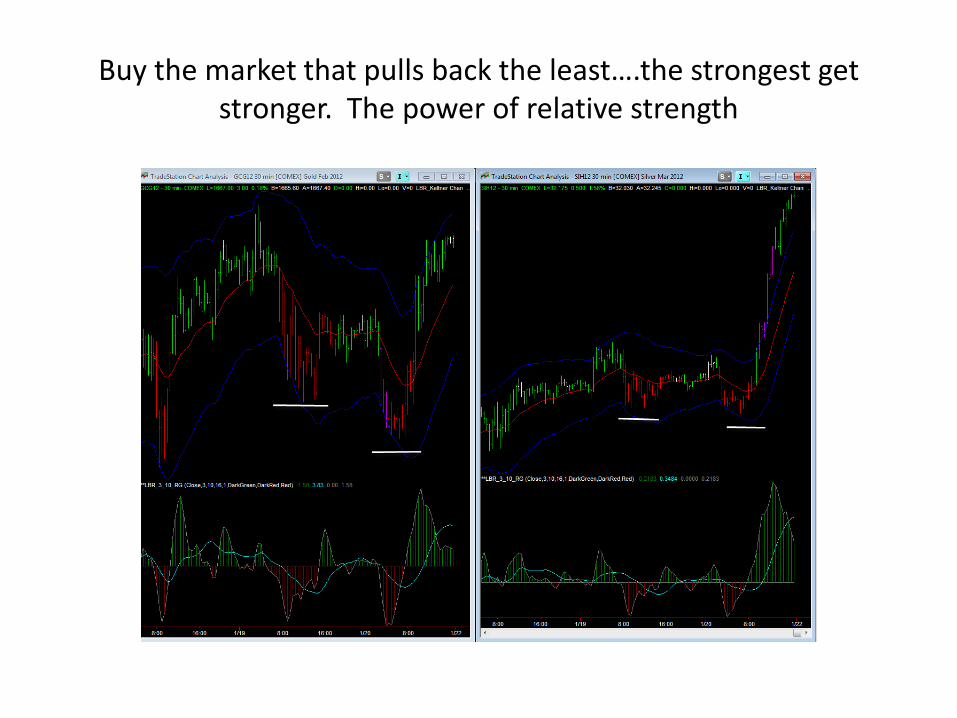
Buy the market that pulls back the least….the strongest get stronger. The power of relative strength
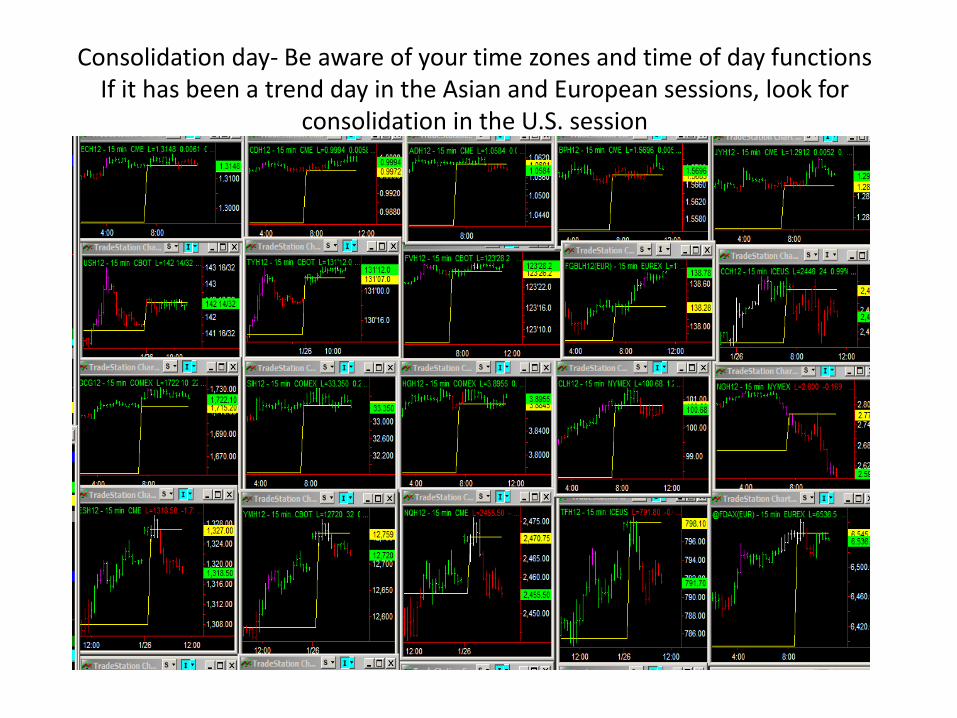
Consolidation day- Be aware of your time zones and time of day functions If it has been a trend day in the Asian and European sessions, look for
consolidation in the U.S. session

Trade your continuation patterns Is there confirmation or non confirmation?
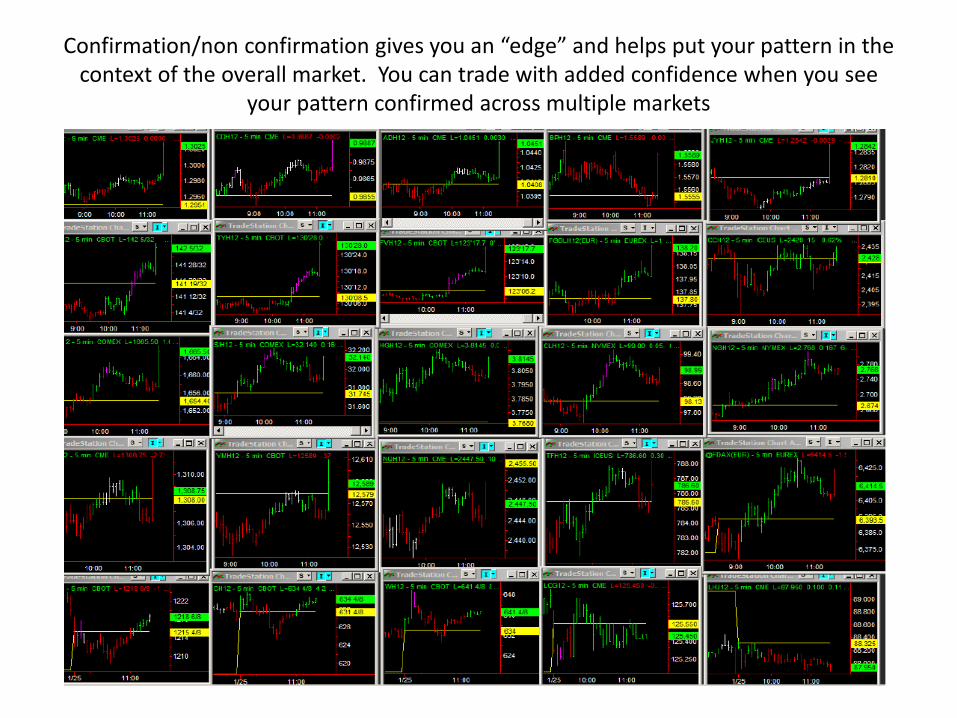
Confirmation/non confirmation gives you an “edge” and helps put your pattern in the context of the overall market. You can trade with added confidence when you see
your pattern confirmed across multiple markets
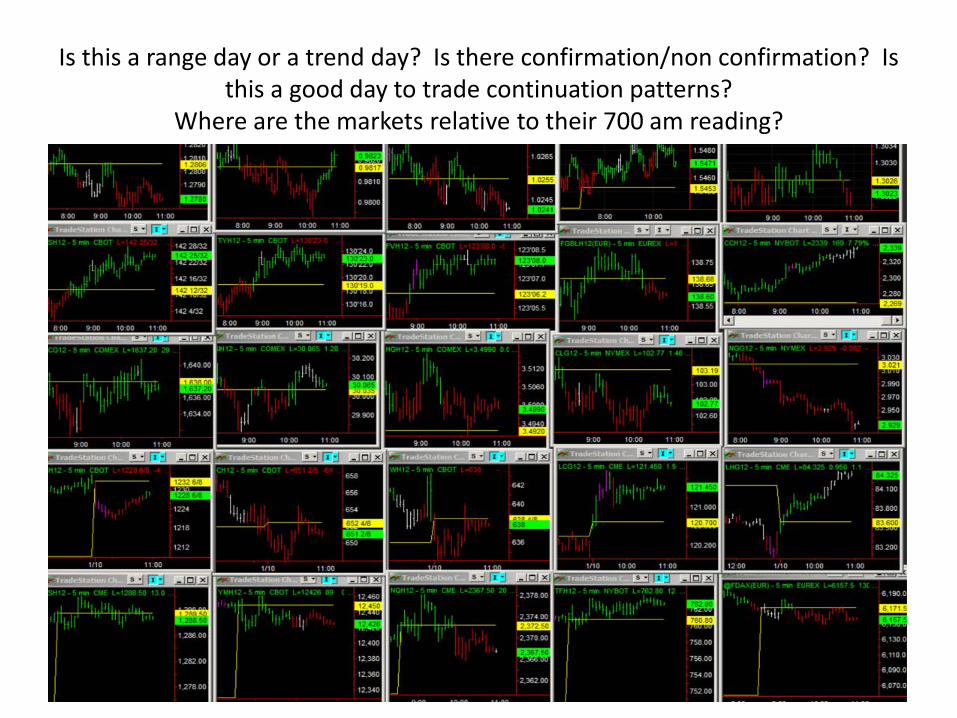
Is this a range day or a trend day? Is there confirmation/non confirmation? Is this a good day to trade continuation patterns?
Where are the markets relative to their 700 am reading?
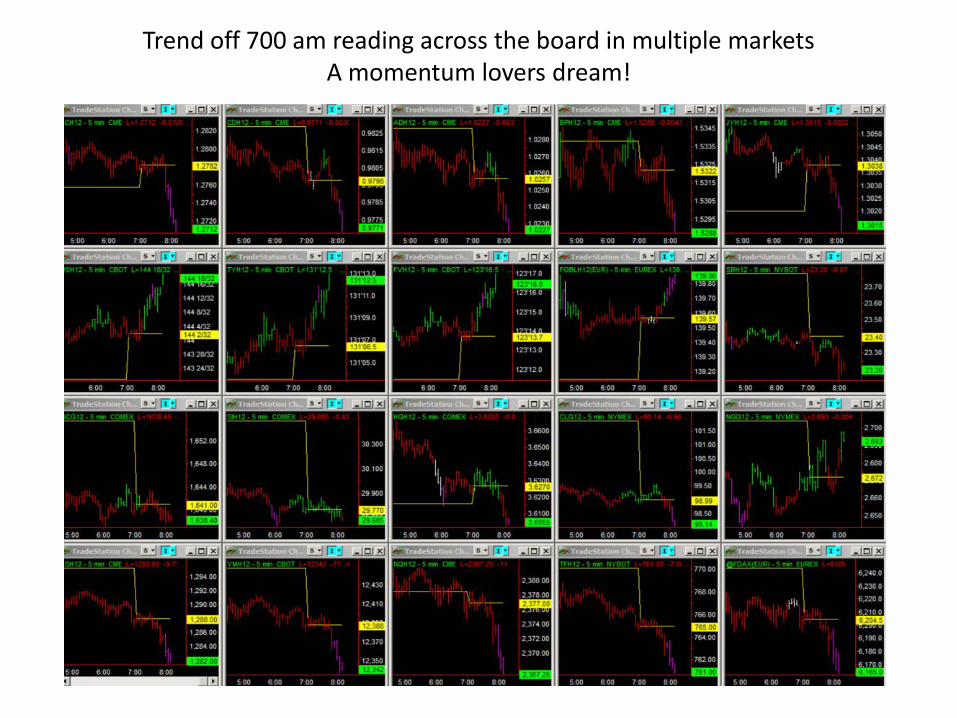
Trend off 700 am reading across the board in multiple markets
A momentum lovers dream!
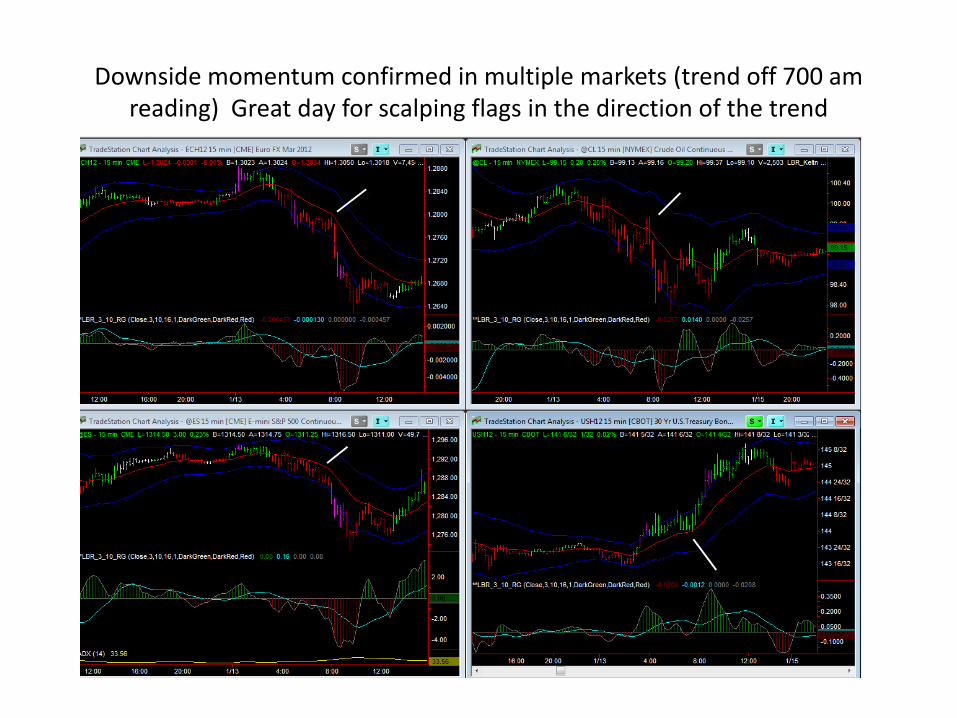
Downside momentum confirmed in multiple markets (trend off 700 am reading) Great day for scalping flags in the direction of the trend
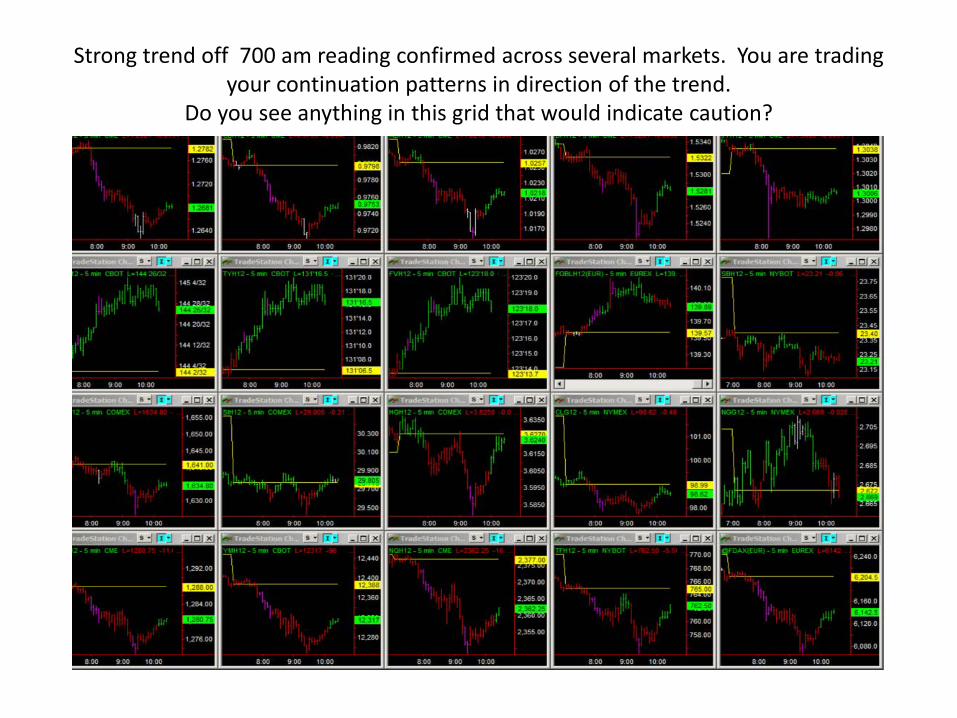
Strong trend off 700 am reading confirmed across several markets. You are trading your continuation patterns in direction of the trend.
Do you see anything in this grid that would indicate caution?

Shift in momentum confirmed across all markets. Which market do you want to buy?
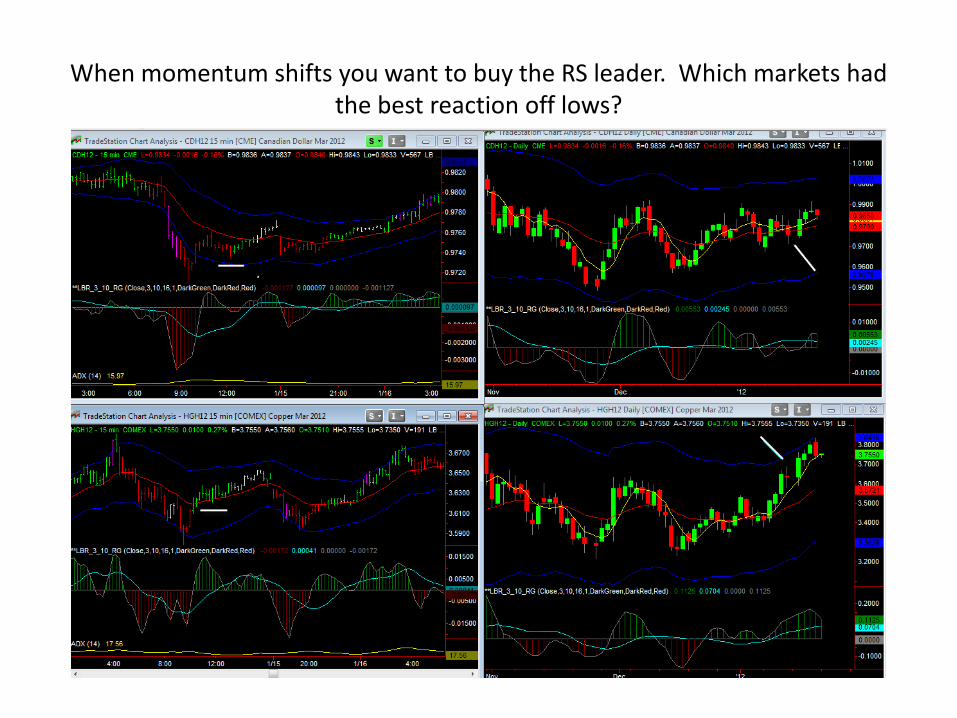
When momentum shifts you want to buy the RS leader. Which markets had the best reaction off lows?

Which market had least bounce?

Crude had least bounce and also did not have a HTF momentum play. Do your homework and know which market will give you more play!
Putting it all together! Trading daily momentum setups using relative strength,
confirmation/non confirmation and trend off 700 am reading across multiple markets to achieve high percentage winning trades
• Which market has nice daily pattern that can lead to strong momentum?
• Is there trend of 700 am reading confirmed across ALL markets? (signaling good volume for the day and higher odds of continuation)
• Which market are you going to trade? Which market is the RS leader?
• Is there confirmation/non confirmation across all markets? • Are you looking for momentum trend day to support your
HTF pattern? Or are you on the lookout for a shift in momentum to end swing? (buying a pullback in an uptrend)
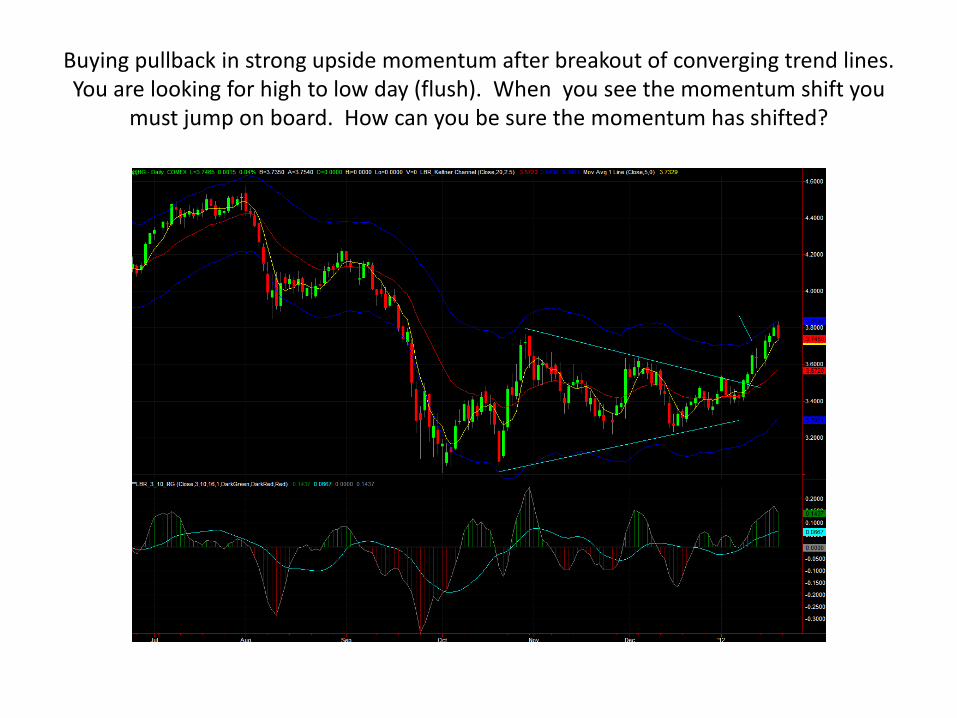
Buying pullback in strong upside momentum after breakout of converging trend lines. You are looking for high to low day (flush). When you see the momentum shift you
must jump on board. How can you be sure the momentum has shifted?
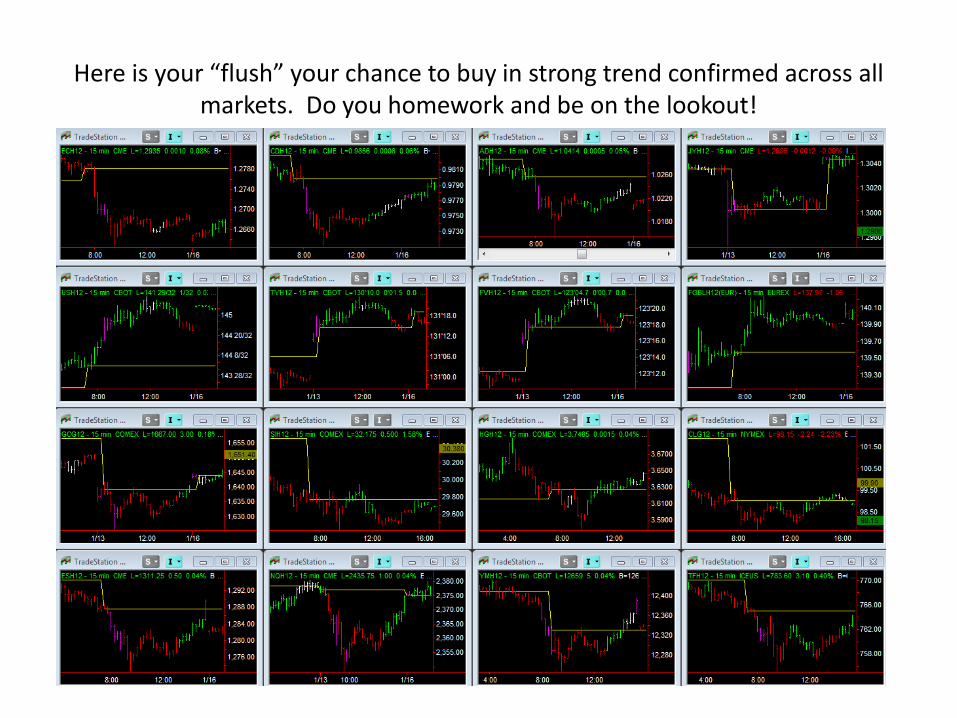
Here is your “flush” your chance to buy in strong trend confirmed across all markets. Do you homework and be on the lookout!
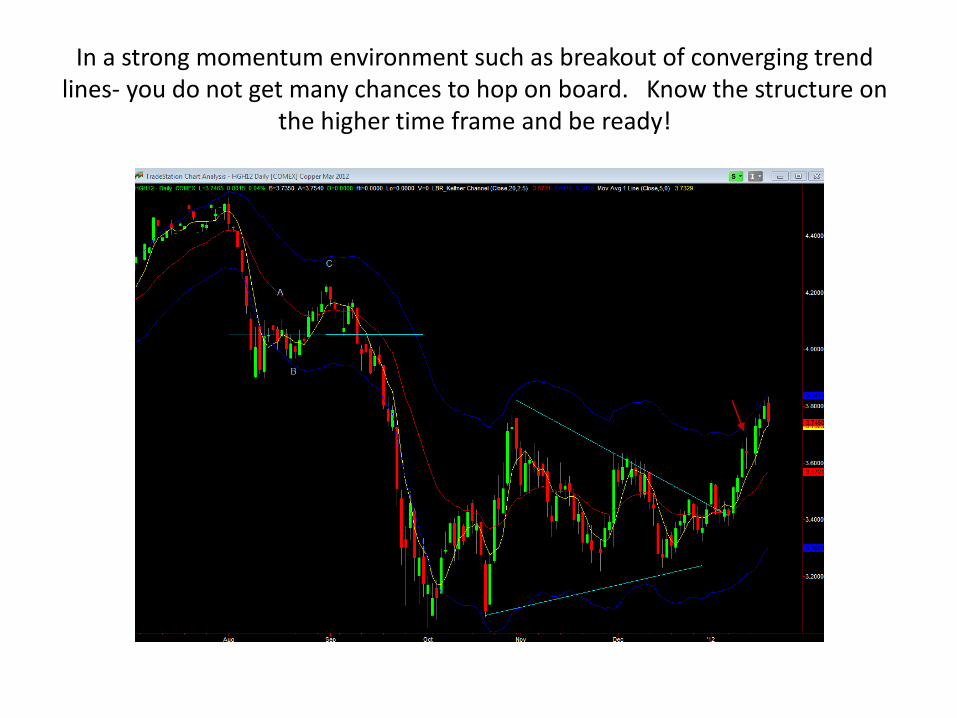
In a strong momentum environment such as breakout of converging trend lines- you do not get many chances to hop on board. Know the structure on
the higher time frame and be ready!

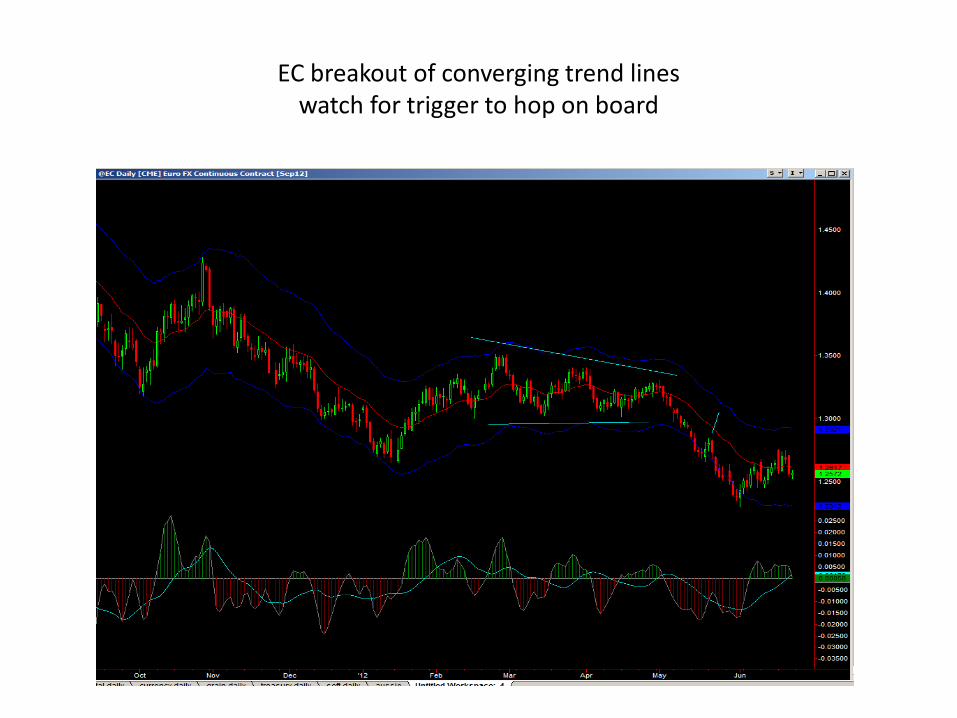
EC breakout of converging trend lines watch for trigger to hop on board
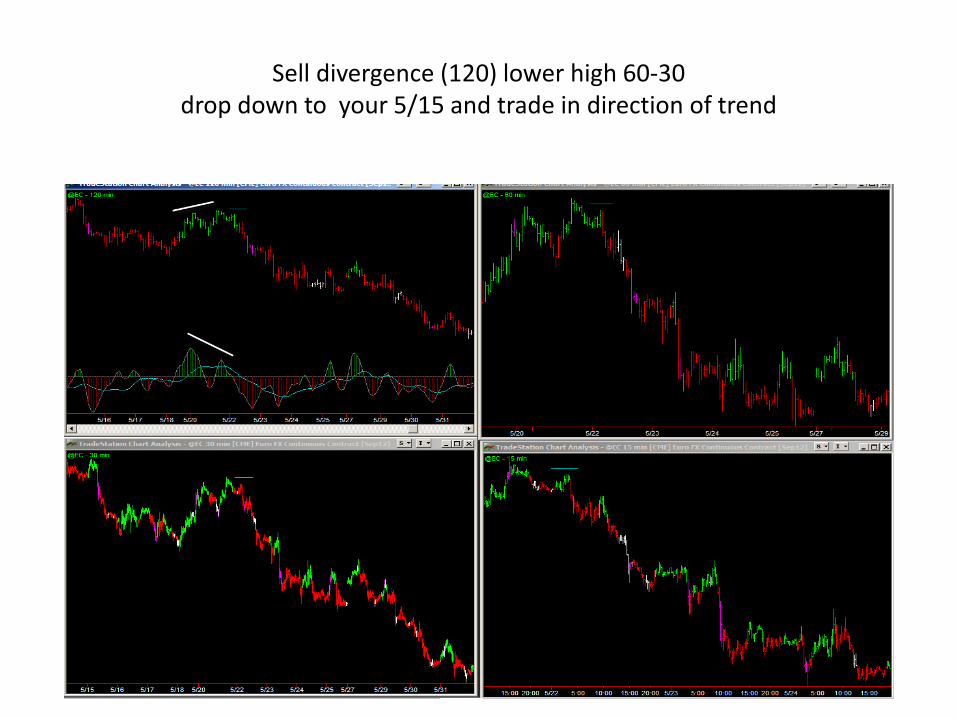
Sell divergence (120) lower high 60-30 drop down to your 5/15 and trade in direction of trend
EC breakout of converging trend lines watch for trigger to hop on board
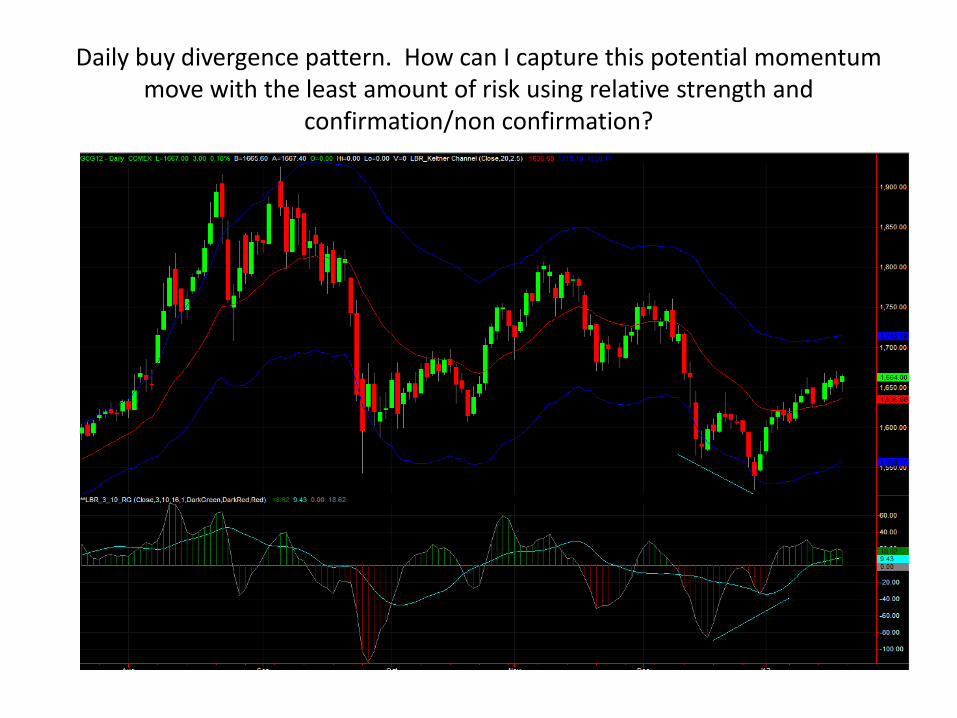
Daily buy divergence pattern. How can I capture this potential momentum move with the least amount of risk using relative strength and
confirmation/non confirmation?
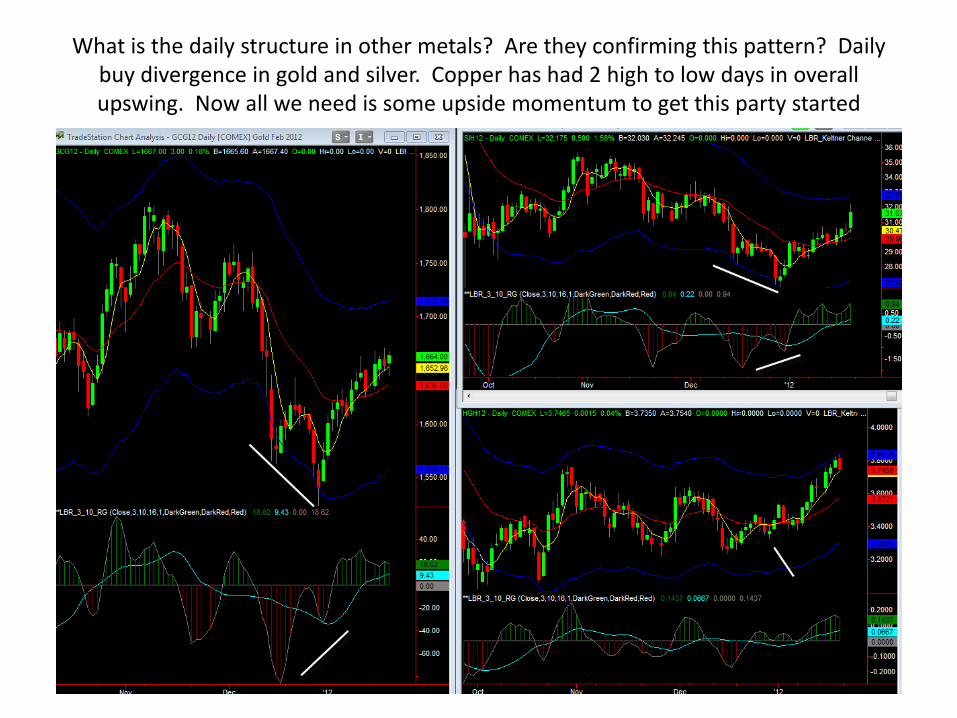
What is the daily structure in other metals? Are they confirming this pattern? Daily buy divergence in gold and silver. Copper has had 2 high to low days in overall upswing. Now all we need is some upside momentum to get this party started
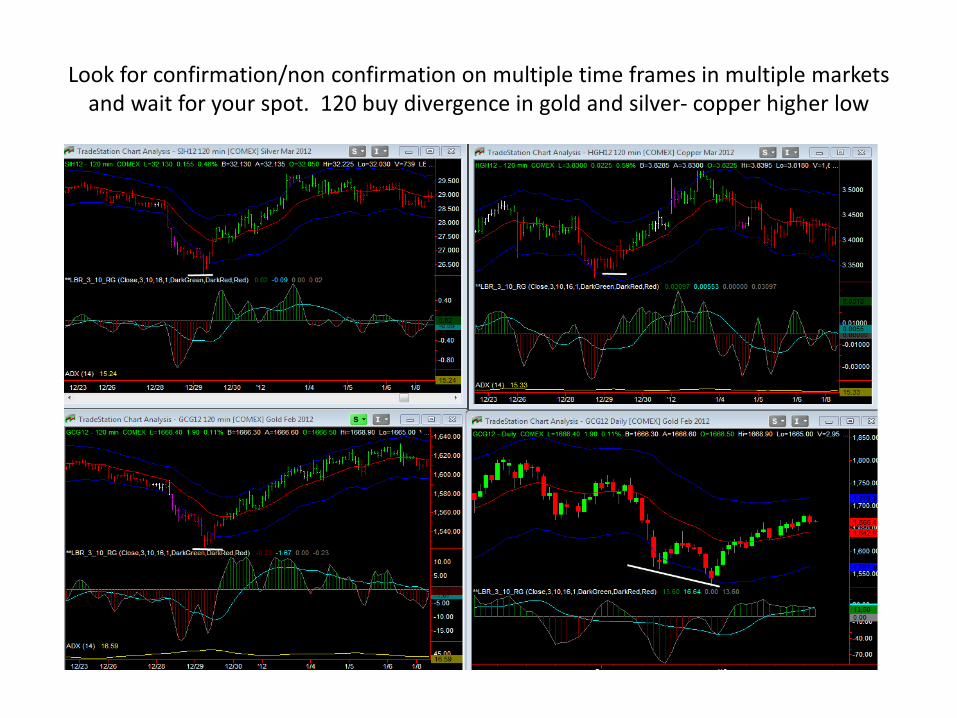
Look for confirmation/non confirmation on multiple time frames in multiple markets and wait for your spot. 120 buy divergence in gold and silver- copper higher low
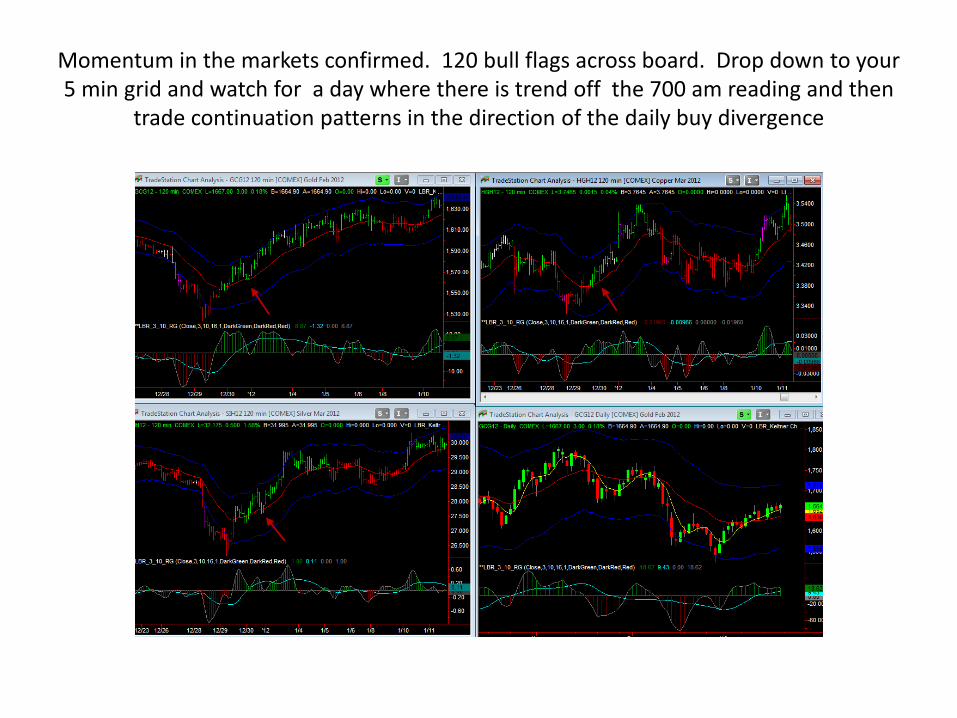
Momentum in the markets confirmed. 120 bull flags across board. Drop down to your 5 min grid and watch for a day where there is trend off the 700 am reading and then
trade continuation patterns in the direction of the daily buy divergence
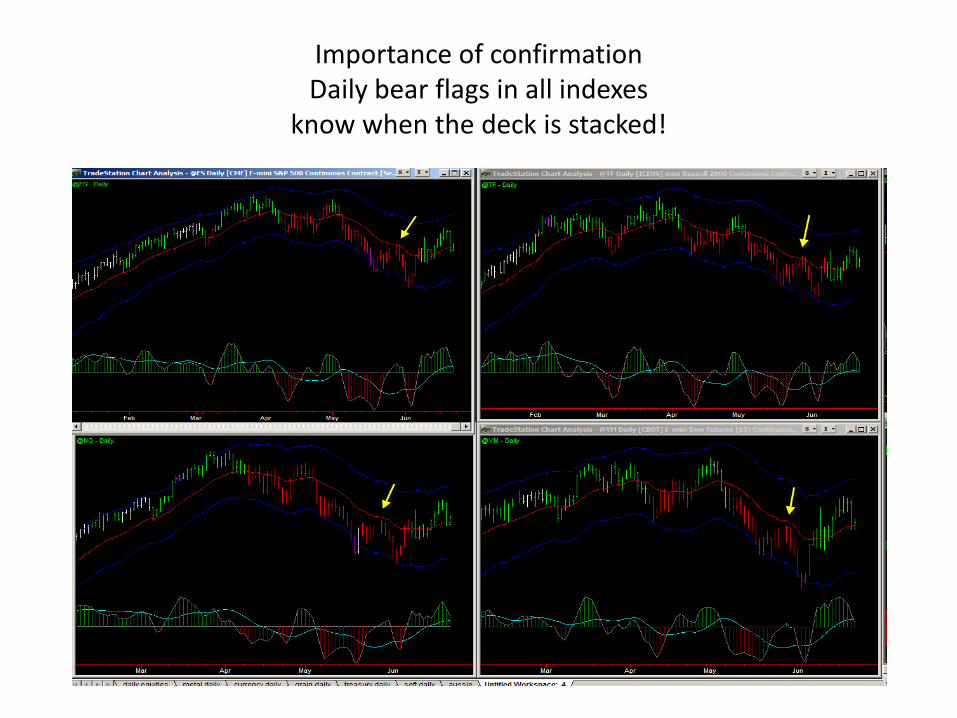
Importance of confirmation Daily bear flags in all indexes
know when the deck is stacked!
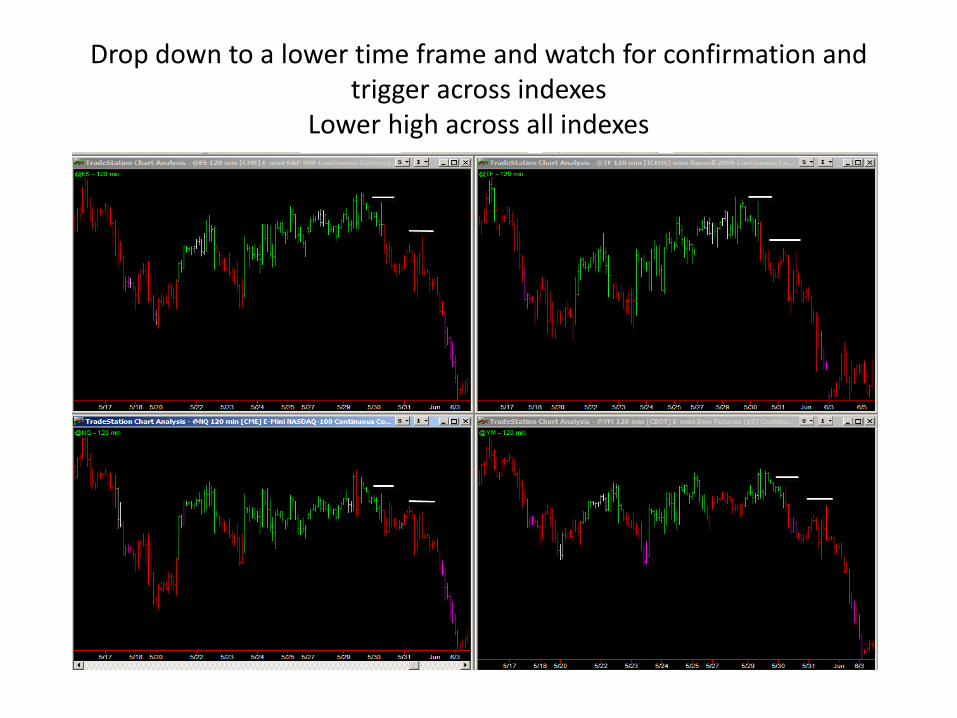
Drop down to a lower time frame and watch for confirmation and trigger across indexes
Lower high across all indexes
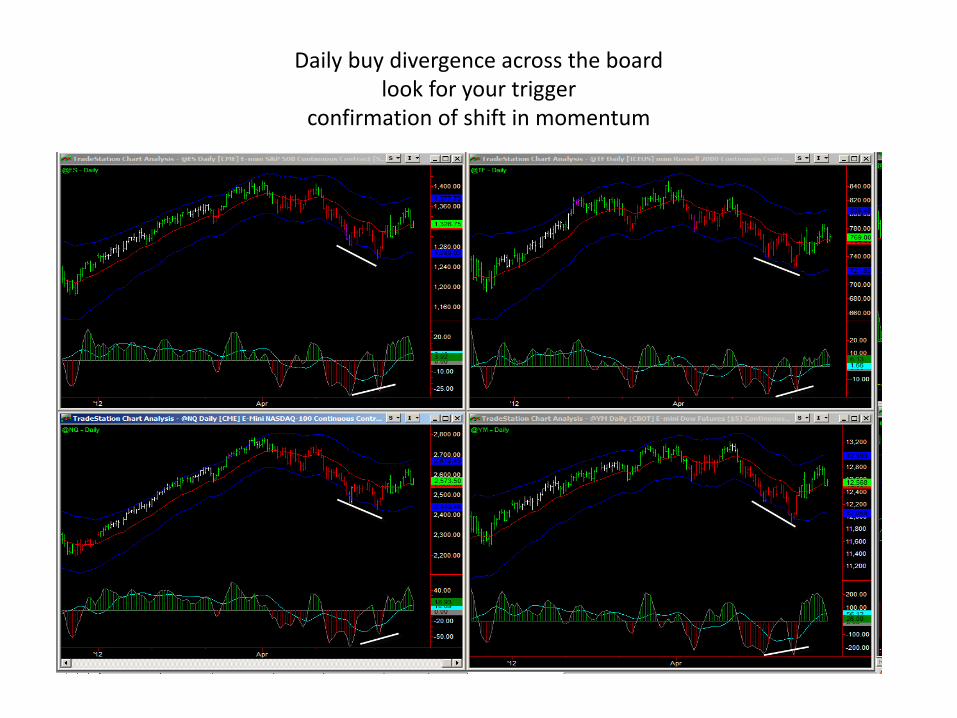
Daily buy divergence across the board look for your trigger
confirmation of shift in momentum
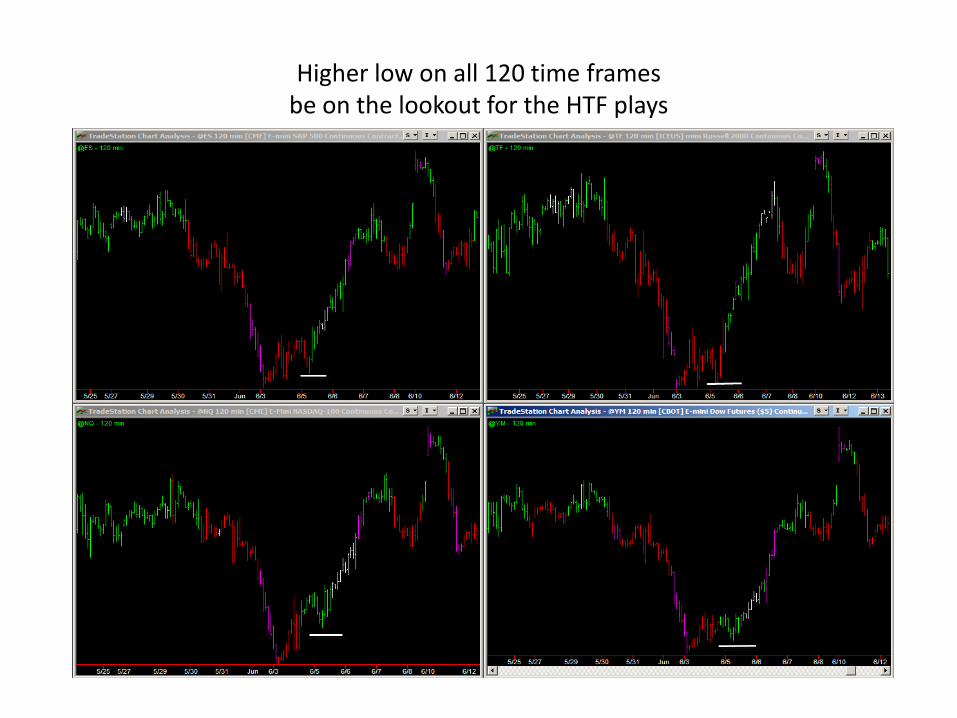
Higher low on all 120 time frames be on the lookout for the HTF plays
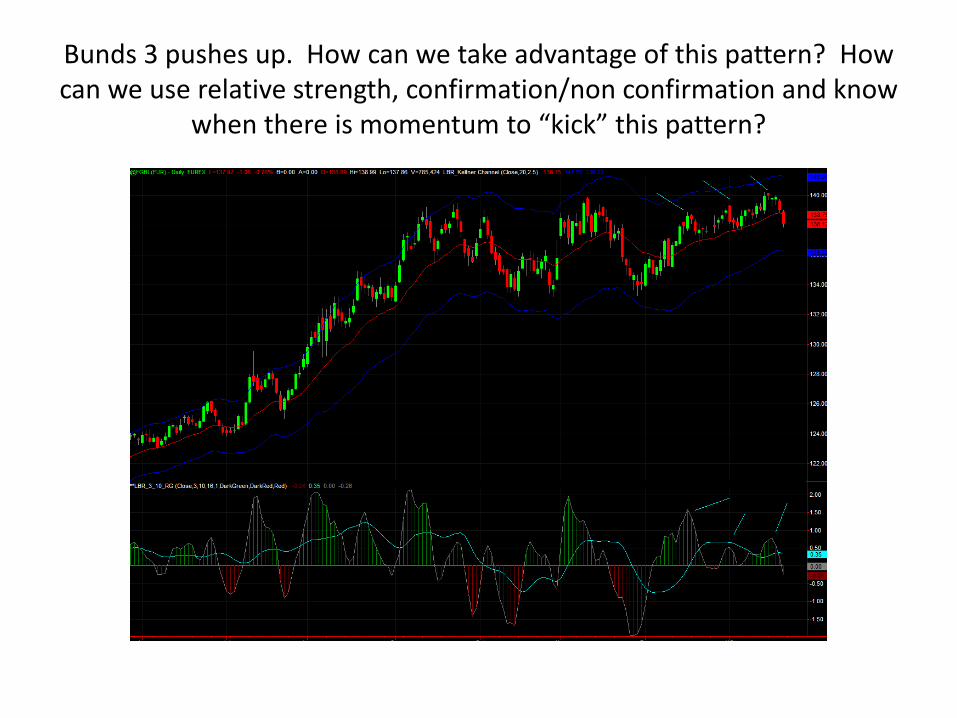
Bunds 3 pushes up. How can we take advantage of this pattern? How can we use relative strength, confirmation/non confirmation and know
when there is momentum to “kick” this pattern?
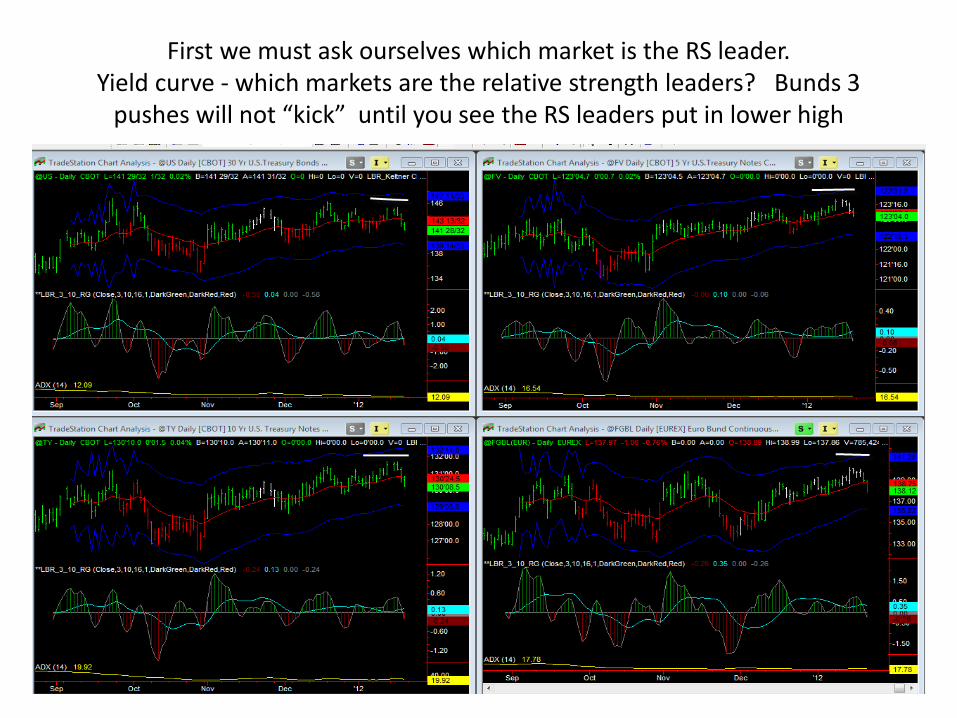
First we must ask ourselves which market is the RS leader. Yield curve - which markets are the relative strength leaders? Bunds 3
pushes will not “kick” until you see the RS leaders put in lower high
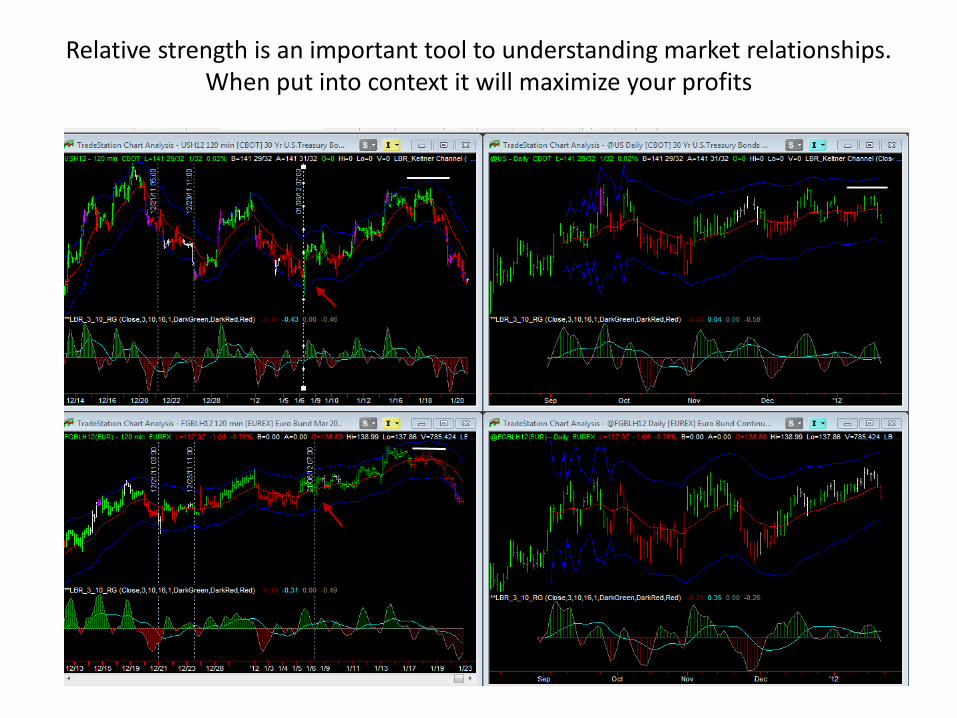
Relative strength is an important tool to understanding market relationships. When put into context it will maximize your profits
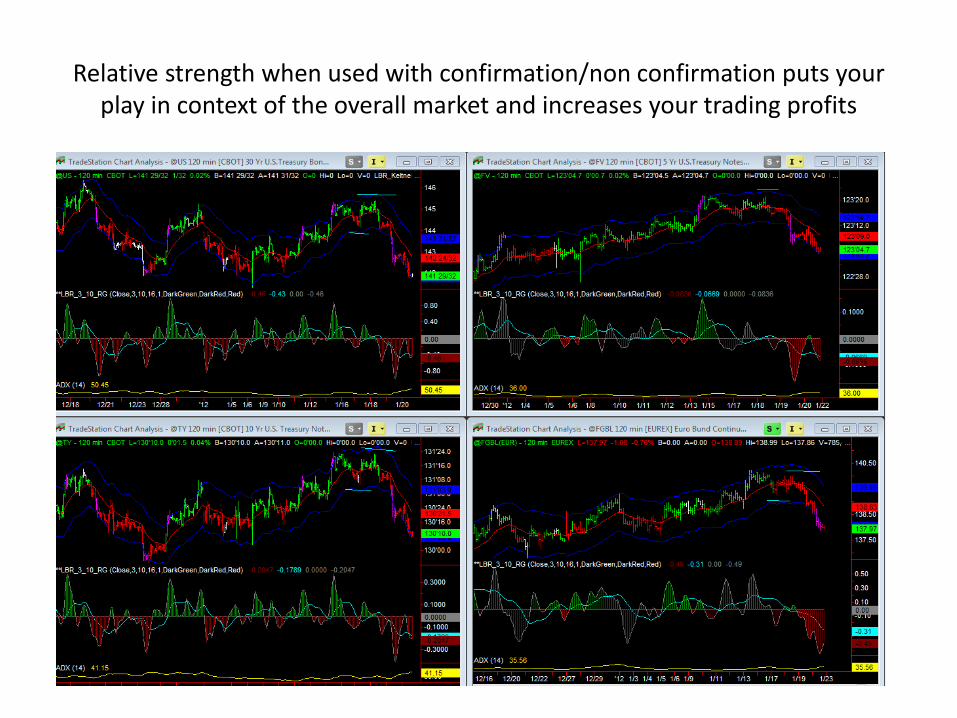
Relative strength when used with confirmation/non confirmation puts your play in context of the overall market and increases your trading profits
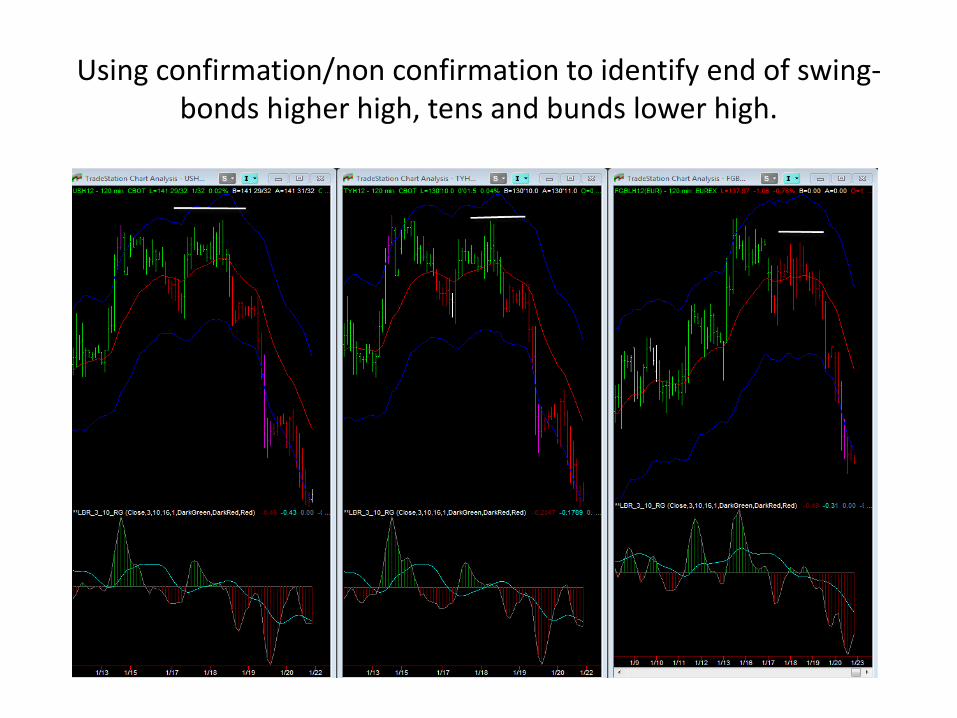
Using confirmation/non confirmation to identify end of swing- bonds higher high, tens and bunds lower high.
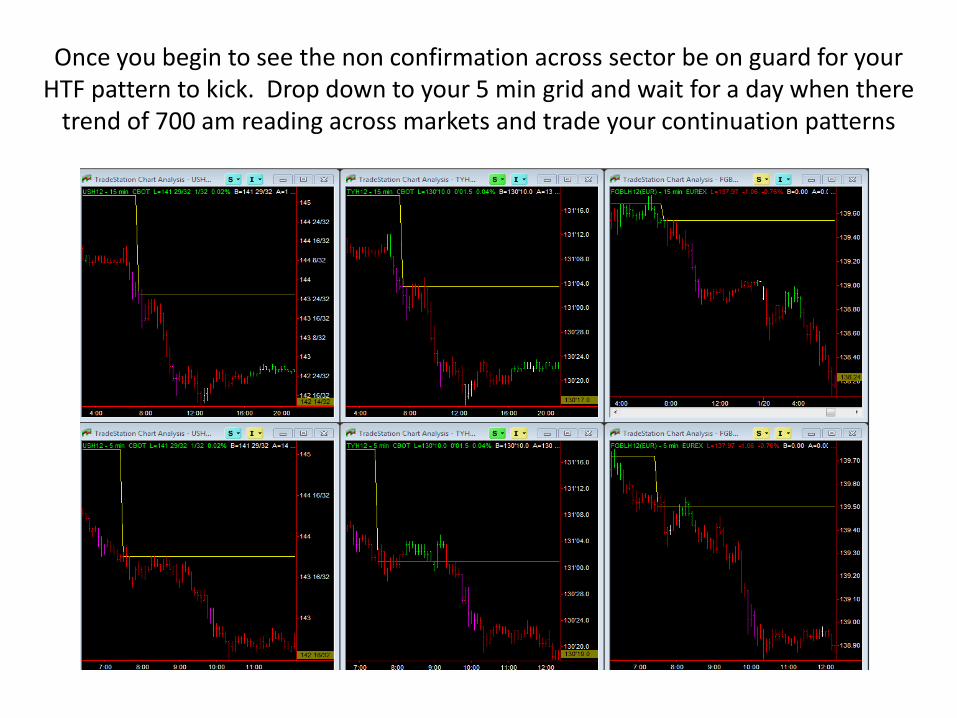
Once you begin to see the non confirmation across sector be on guard for your HTF pattern to kick. Drop down to your 5 min grid and wait for a day when there
trend of 700 am reading across markets and trade your continuation patterns
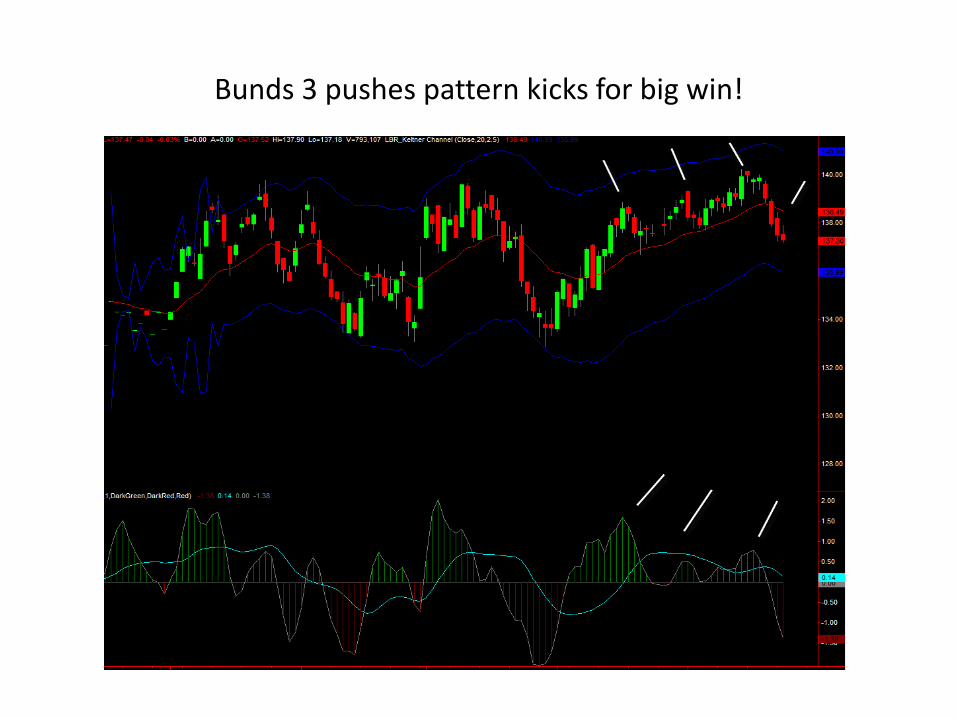
Bunds 3 pushes pattern kicks for big win!
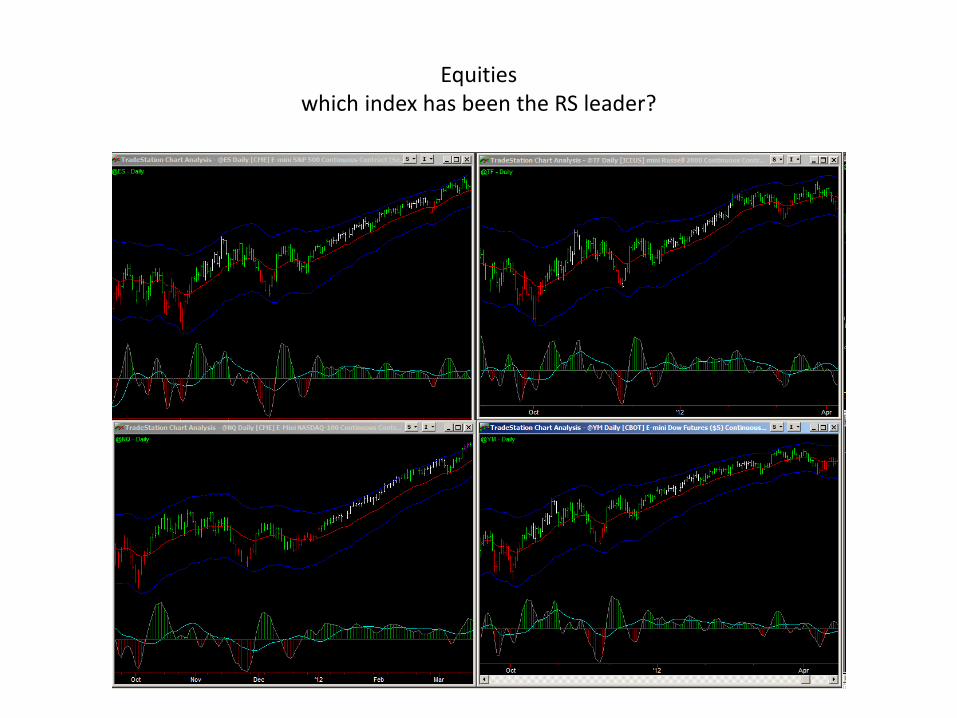
Equities which index has been the RS leader?
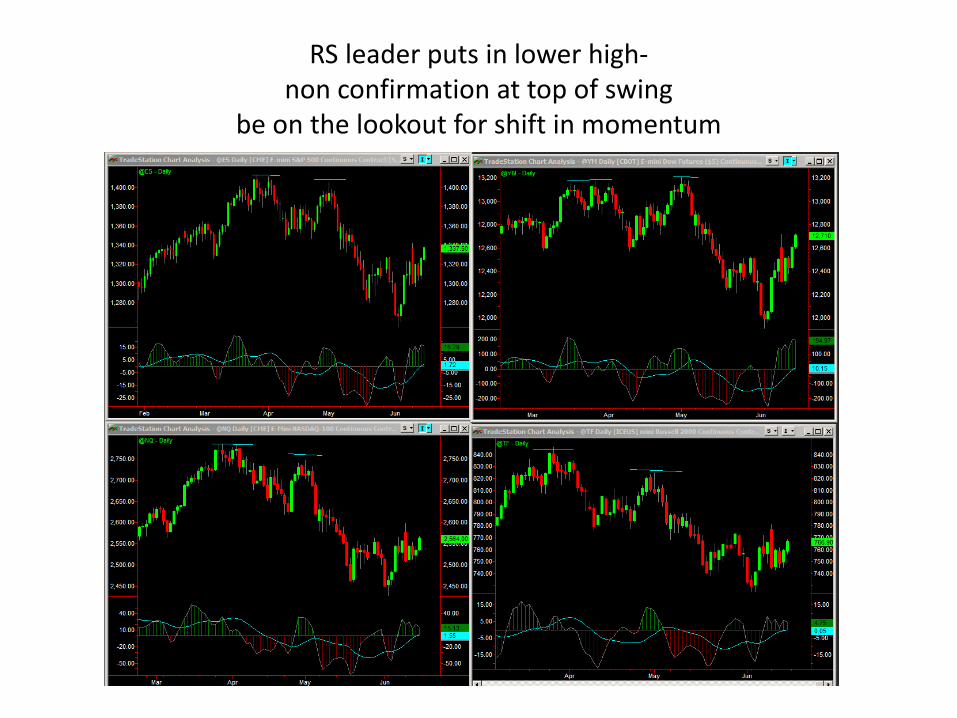
RS leader puts in lower high- non confirmation at top of swing
be on the lookout for shift in momentum
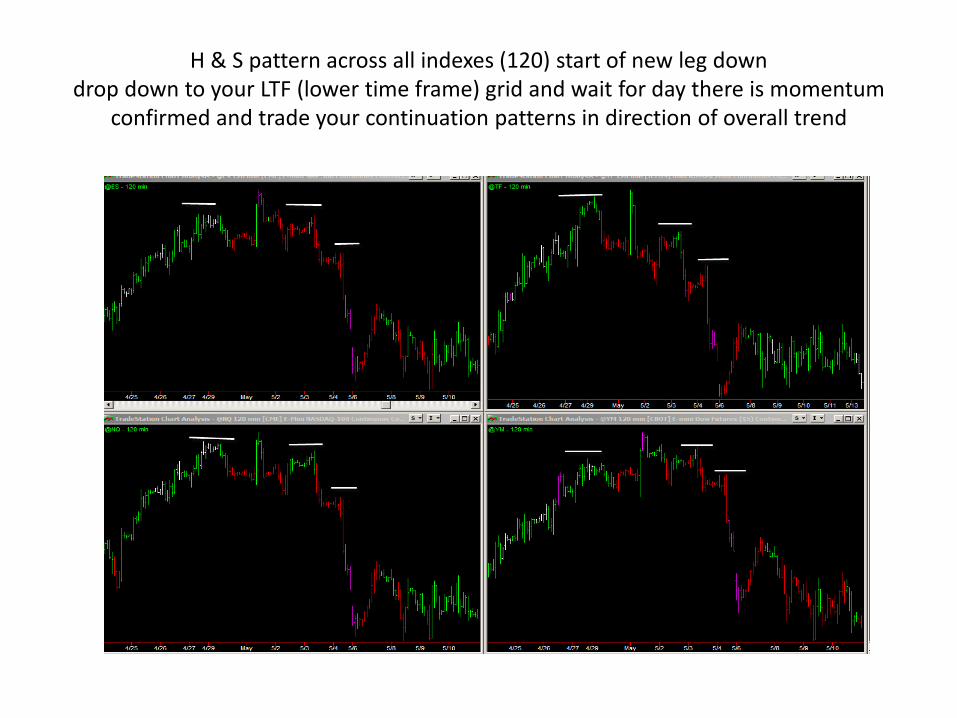
H & S pattern across all indexes (120) start of new leg down drop down to your LTF (lower time frame) grid and wait for day there is momentum
confirmed and trade your continuation patterns in direction of overall trend
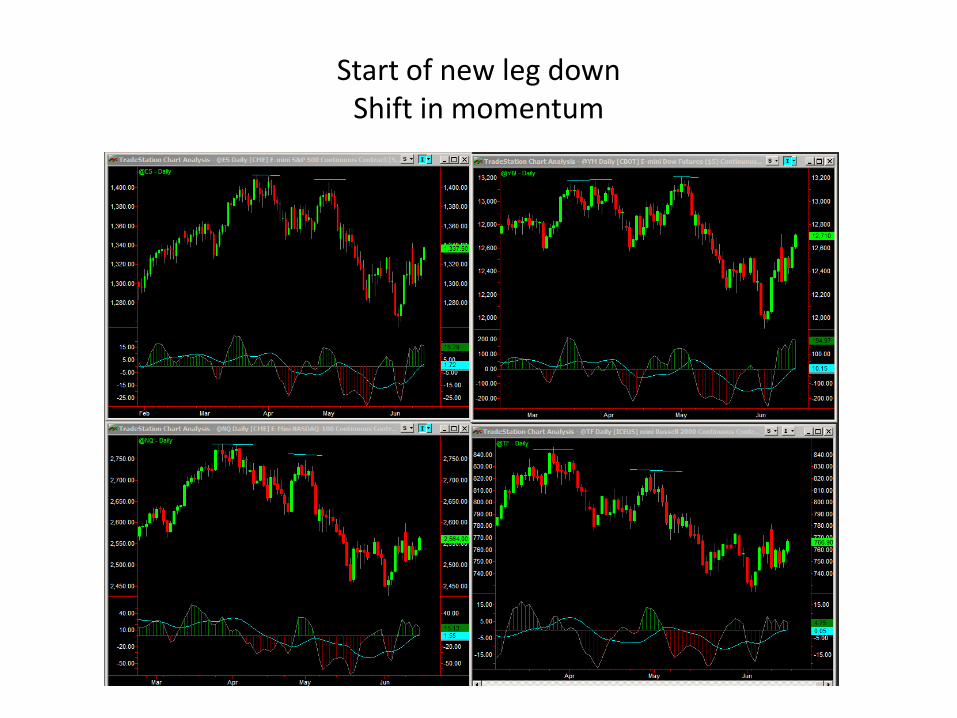
Start of new leg down Shift in momentum

ABC corrective wave in an overall uptrend. Do you notice anything particularly special about this power buy? Also note the momentum off the
daily buy divergence
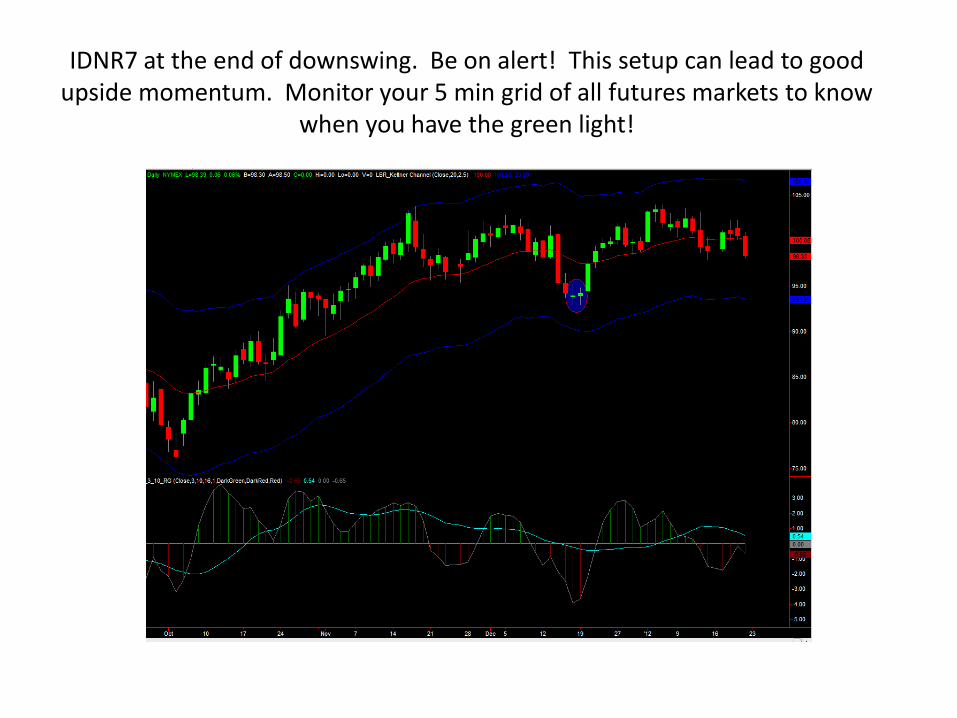
IDNR7 at the end of downswing. Be on alert! This setup can lead to good upside momentum. Monitor your 5 min grid of all futures markets to know
when you have the green light!
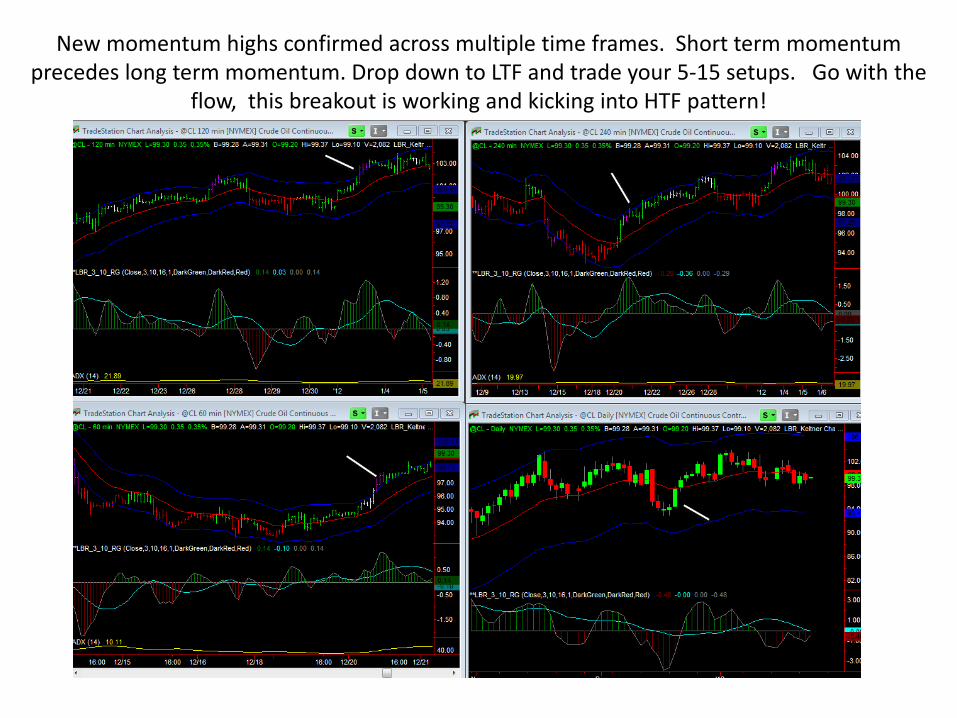
New momentum highs confirmed across multiple time frames. Short term momentum precedes long term momentum. Drop down to LTF and trade your 5-15 setups. Go with the
flow, this breakout is working and kicking into HTF pattern!
Putting momentum strategies in context to achieve high percentage winning trades
• Put your “play” in context of the overall market environment using multiple time frames and multiple markets for confirmation/non confirmation.
• Do your homework and understand the overall market structure. Is there is a strong momentum pattern setting up on the daily chart?
• Know the RS leaders and laggards • Look for confirmation/non confirmation • Monitor your 5 min grid to identify if it is high volume
momentum day or low volume consolidation day • Are you looking for a high to low day? Or a low to high day? • Wait for your spot and know when you have the tiger by
the tail! Press your bet for maximum profits!
How to put momentum strategies in context to achieve high percentage
winning trades
Thanks for attending!
Suzanne Bodlovic [email protected]