how to create interactive infographics
TRANSCRIPT

How to Create Interactive InfographicsMayuree Srikulwong, PhD

Web Services
You will need Applications
App to draw .svg
Editor to write codes

Frameworks
Codes

Text only appears when mouse movesDetail1 Text1

Steps
Draw an image
Write codes (use CSS)
Write codes (use JQuery)
Download JQuery library
Prepare an environment1
2
3
4
5
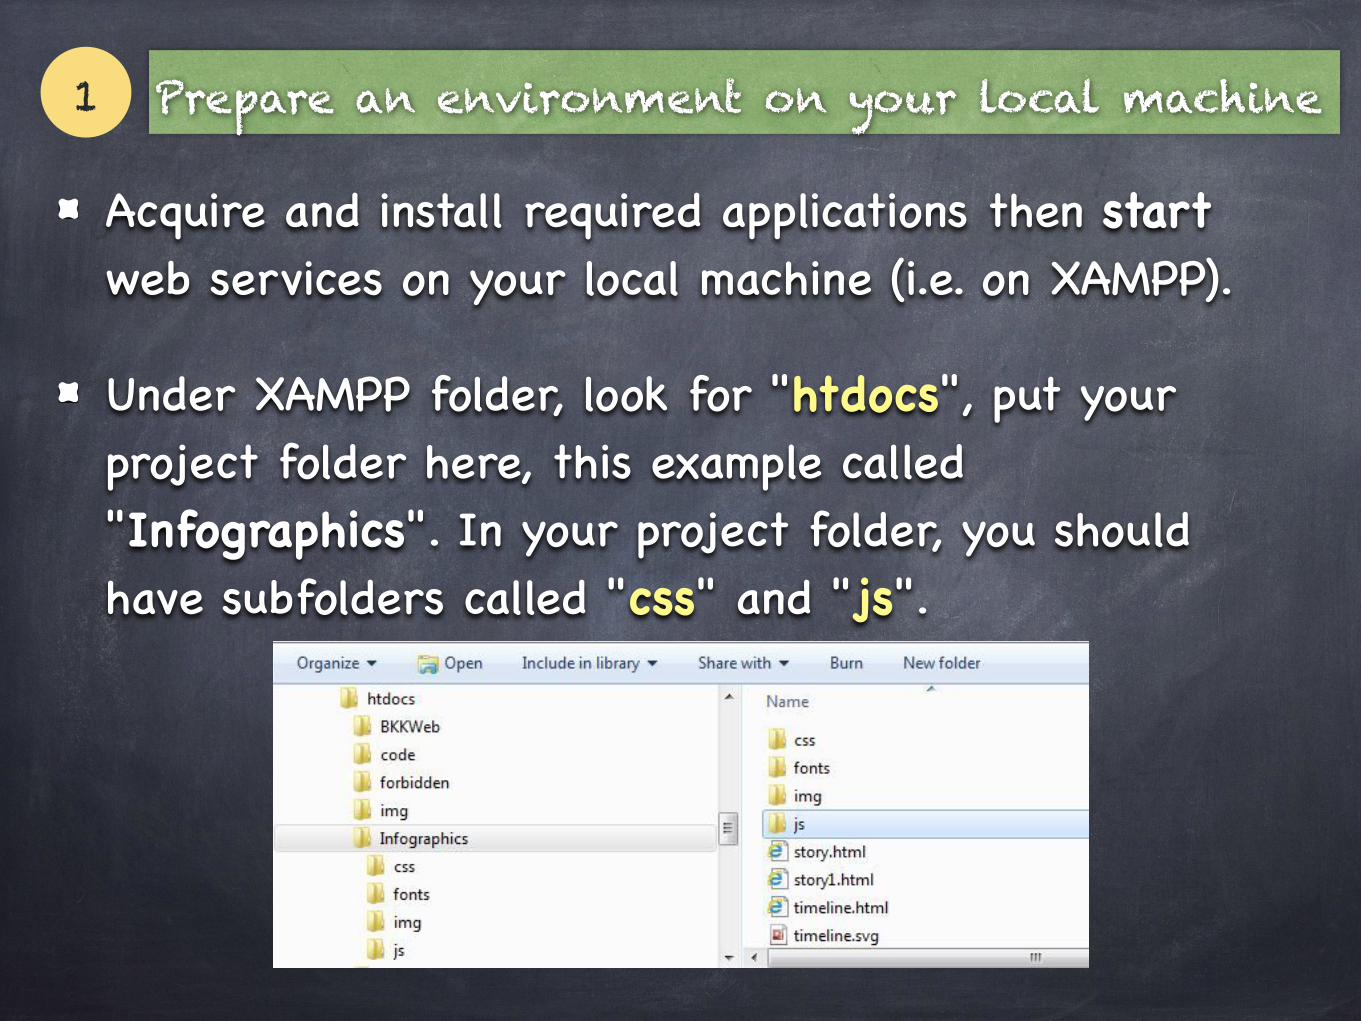
Prepare an environment on your local machine1
Acquire and install required applications then start web services on your local machine (i.e. on XAMPP).
Under XAMPP folder, look for "htdocs", put your project folder here, this example called "Infographics". In your project folder, you should have subfolders called "css" and "js".

2 Download JQuery library
Download JQuery library, e.g. jquery-1.11.0.min.js, from the Internet and put in the "js" subfolder.

3 Draw an image
Design all the interactions for your image, then go to draw it.
When drawing an image, for each interactive object makes it "a layer" with a specific name. Save it as an .svg file and put it in your project folder (in this example timeline.svg).
This file contains layers called detail1, detail2, detail3, detail4, text1, text2, text3, text4

4 Write codes (use JQuery)
Go to write an HTML code file, at the beginning of the file, you must declare JQuery library.
<head>
<script src="js/jquery-1.11.0.min.js"></script>
</head>

4 Write codes (use JQuery)
In your HTML file, for each layer in the image, define the interaction. Repeat for all layers. In this example, detail1 and text1.
<body><div>id="stage"></div>
<script> $("#stage").load('timeline.svg', function(data) {
$(document.body).append(data.documentElement);
$('#detail1').hover (
function mouseover() { $('#text1') .show(); },
function mouseleave() { $('#text1') .hide(); });
} ) ;
</script></body>

5 Write codes (use CSS)
Create a new file
Write CSS codes to add effect to each layer. Repeat for all layers.
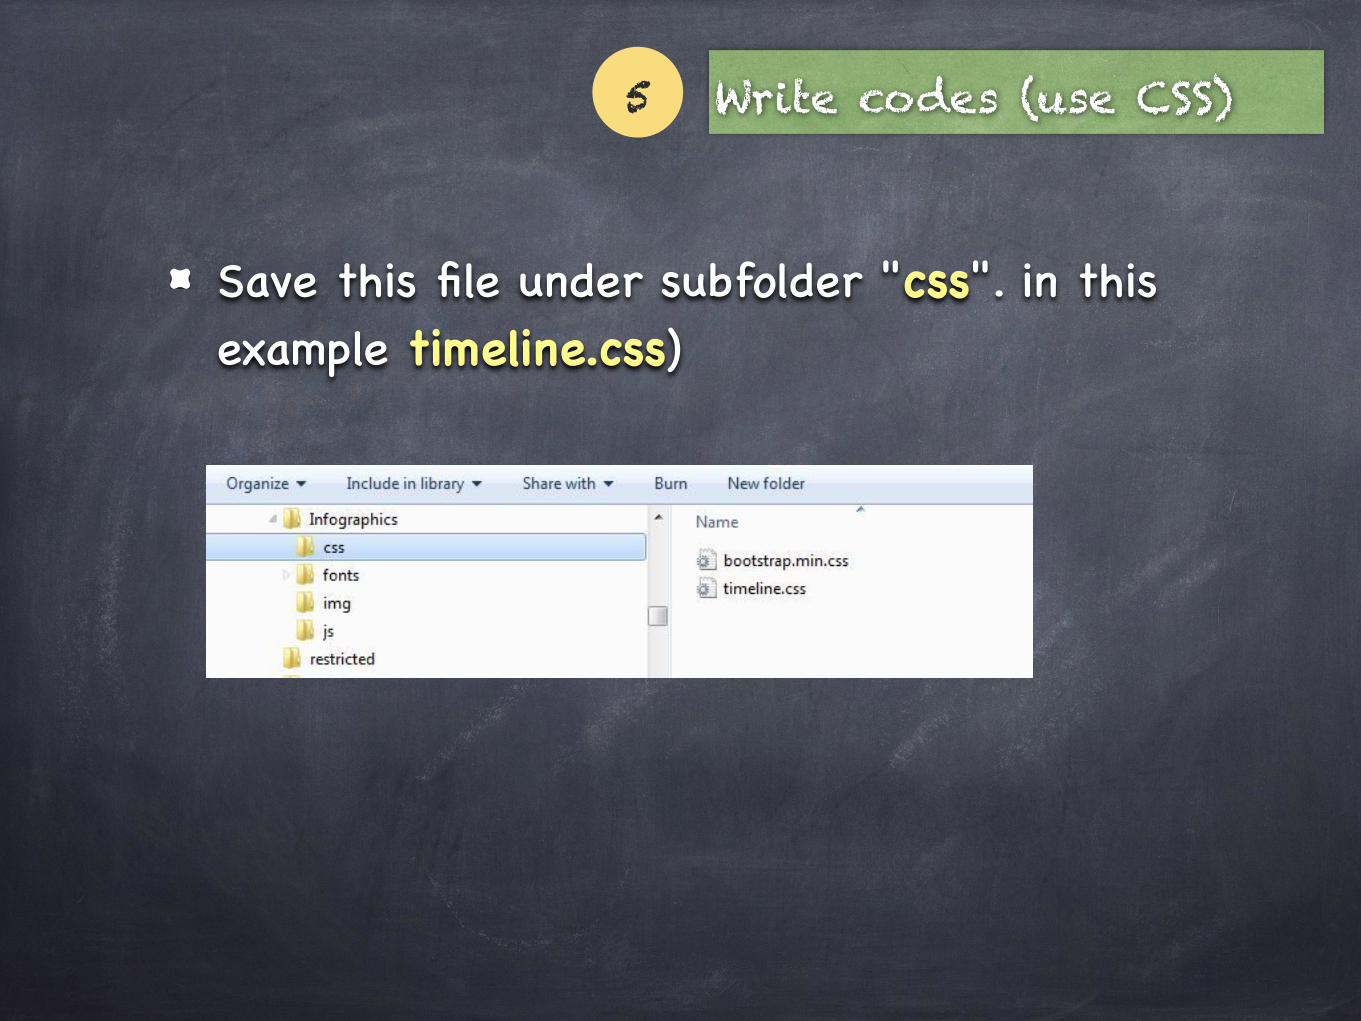
5 Write codes (use CSS)
Save this file under subfolder "css". in this example timeline.css)

5 Write codes (use CSS)
Go to your HTML file, at the beginning of the file, add the line pointing to your css file.
<head>
<script src="js/jquery-1.11.0.min.js"></script>
<link rel="stylesheet" type="text/css" href= "css/timeline.css" />
</head>

References and Resources
http://tympanus.net/codrops/2013/02/06/interactive-infographic-with-svg-and-css-animations/
http://designmodo.com/interactive-infographics/
http://d3js.org
http://www.chartjs.org
http://worrydream.com/Tangle/

Attribution - NonCommercial - No Derivatives
re.vu/MSrikulwong http://www.slideshare.net/mayureesrikulwong