how the design of presentation slides affects audience ... the design of presentation slides...
TRANSCRIPT

How the Design of Presentation Slides Affects Audience
Comprehension: A Case for the Assertion–Evidence
Approach*
JOANNA K. GARNERThe Center for Educational Partnerships, Old Dominion University, 4111 Monarch Way, Suite 3115, Norfolk, Virginia 23508 USA.
E-mail: [email protected]
MICHAEL P. ALLEYCollege of Engineering, Penn State University, 201 Hammond Building, University Park, Pennsylvania 16802, USA.
E-mail: [email protected]
Engineering educators often create slides for classroom presentations to instruct students. In turn, engineering students
often create slides for classroompresentations to demonstratewhat they have learned.Given howoften presentation slides
are projected and viewed by engineering educators and students, those slides should follow principles of multimedia
learning to foster high audience comprehension. Unfortunately, Microsoft PowerPoint, which is the dominant program
for creating slides, does not incorporate these principles into its defaults. As a result, most educators and students in
engineering create slides that violate these principles. To determine the effect of this violation, we compared learning
outcomes in 110 engineering students who viewed a technical presentation in which the slides either integrated or violated
six multimedia learning principles. The presentation slides that adhered to the six multimedia principles followed the
assertion-evidence approach, while the presentation slides that violated the six multimedia principles followed commonly
practiced defaults of PowerPoint. Essay responses from the 110 engineering students revealed superior comprehension and
fewer misconceptions for the assertion–evidence group as well as lower perceived cognitive load. In addition, stronger
recall occurred in this assertion–evidence group at delayed post-test. These findings support the use of the assertion–
evidence structure for presentations in engineering education.
Keywords: presentation slides; PowerPoint; assertion–evidence; multimedia learning
1. Introduction
In engineering classrooms, students frequently
engage in multimedia learning, defined as learning
through the processing of spoken or printed words
that are accompanied by images [1]. This learning
often occurs during presentations in which instruc-
tors or peers project slides that were created by
computer programs such as Microsoft PowerPoint.These slides typically contain words and graphics
and are accompanied by the presenter’s spoken
words. Slide-assisted instruction has become a pre-
sentation staple in lectures and professional devel-
opment settings [2–4]. This type of instruction,
which also is common in K-12 settings, is often
considered by teachers and students as the instruc-
tional technology tool of choice [3, 5].Outside of the fields of educational psychology
and instructional design, a gulf exists betweenmulti-
media learning research [6–10] and the slides typi-
cally created [11–13]. This may be in part because
despite the great body of rigorously controlled
experimental work, no slide structure has emerged
that steers presenters towards using multimedia
learning principles as they design their presentationslides. The result is that instructional slides fre-
quently violate principles of multimedia learning
theory and cognitive load theory [11].
In this paper, we draw heavily on multimedia
learning theory to articulate flaws in common
features of the slides typically used by presenters
in engineering. We then present an alternativestructure that provides clear direction on the inte-
gration of multiple principles of multimedia design.
To examine the learning outcomes associated with
viewing an instructional presentation using slides
built from either typical or alternative approaches,
we present the results of an experiment in which
students learned about a new topic using either
default-driven slides (Common Practice, CP) ormultimedia principle slides (Assertion–Evidence,
AE).
1.1 Critical principles necessary for effective
multimedia learning
Multimedia learning research has yielded specific
recommendations for the temporal and spatial con-figuration of text, auditory narration, graphics and
animations. Six multimedia learning principles are
of particular relevance to designing instructional
slides. Although they are listed sequentially here, we
* Accepted 2 June 2013.1564
International Journal of Engineering Education Vol. 29, No. 6, pp. 1564–1579, 2013 0949-149X/91 $3.00+0.00Printed in Great Britain # 2013 TEMPUS Publications.
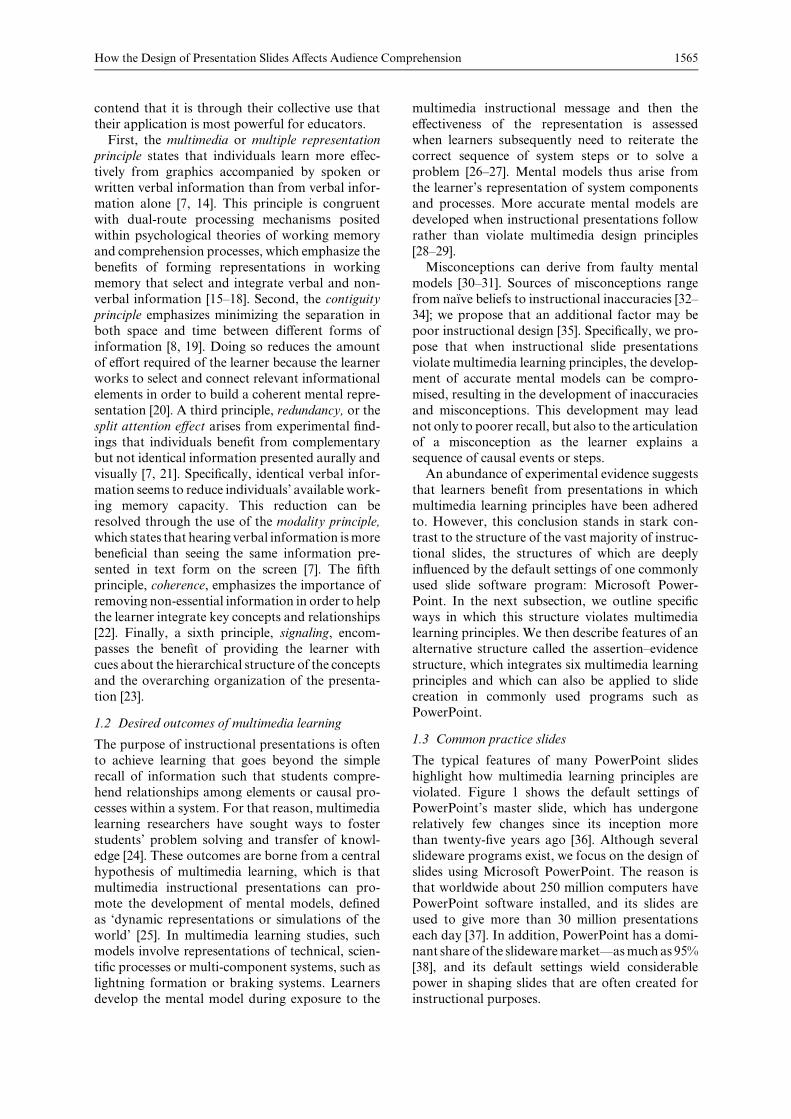
contend that it is through their collective use that
their application is most powerful for educators.
First, the multimedia or multiple representation
principle states that individuals learn more effec-
tively from graphics accompanied by spoken or
written verbal information than from verbal infor-mation alone [7, 14]. This principle is congruent
with dual-route processing mechanisms posited
within psychological theories of working memory
and comprehension processes, which emphasize the
benefits of forming representations in working
memory that select and integrate verbal and non-
verbal information [15–18]. Second, the contiguity
principle emphasizes minimizing the separation inboth space and time between different forms of
information [8, 19]. Doing so reduces the amount
of effort required of the learner because the learner
works to select and connect relevant informational
elements in order to build a coherent mental repre-
sentation [20]. A third principle, redundancy, or the
split attention effect arises from experimental find-
ings that individuals benefit from complementarybut not identical information presented aurally and
visually [7, 21]. Specifically, identical verbal infor-
mation seems to reduce individuals’ available work-
ing memory capacity. This reduction can be
resolved through the use of the modality principle,
which states that hearing verbal information ismore
beneficial than seeing the same information pre-
sented in text form on the screen [7]. The fifthprinciple, coherence, emphasizes the importance of
removing non-essential information in order to help
the learner integrate key concepts and relationships
[22]. Finally, a sixth principle, signaling, encom-
passes the benefit of providing the learner with
cues about the hierarchical structure of the concepts
and the overarching organization of the presenta-
tion [23].
1.2 Desired outcomes of multimedia learning
The purpose of instructional presentations is often
to achieve learning that goes beyond the simple
recall of information such that students compre-
hend relationships among elements or causal pro-
cesses within a system. For that reason, multimedialearning researchers have sought ways to foster
students’ problem solving and transfer of knowl-
edge [24]. These outcomes are borne from a central
hypothesis of multimedia learning, which is that
multimedia instructional presentations can pro-
mote the development of mental models, defined
as ‘dynamic representations or simulations of the
world’ [25]. In multimedia learning studies, suchmodels involve representations of technical, scien-
tific processes or multi-component systems, such as
lightning formation or braking systems. Learners
develop the mental model during exposure to the
multimedia instructional message and then the
effectiveness of the representation is assessed
when learners subsequently need to reiterate the
correct sequence of system steps or to solve a
problem [26–27]. Mental models thus arise from
the learner’s representation of system componentsand processes. More accurate mental models are
developed when instructional presentations follow
rather than violate multimedia design principles
[28–29].
Misconceptions can derive from faulty mental
models [30–31]. Sources of misconceptions range
from naı̈ve beliefs to instructional inaccuracies [32–
34]; we propose that an additional factor may bepoor instructional design [35]. Specifically, we pro-
pose that when instructional slide presentations
violate multimedia learning principles, the develop-
ment of accurate mental models can be compro-
mised, resulting in the development of inaccuracies
and misconceptions. This development may lead
not only to poorer recall, but also to the articulation
of a misconception as the learner explains asequence of causal events or steps.
An abundance of experimental evidence suggests
that learners benefit from presentations in which
multimedia learning principles have been adhered
to. However, this conclusion stands in stark con-
trast to the structure of the vast majority of instruc-
tional slides, the structures of which are deeply
influenced by the default settings of one commonlyused slide software program: Microsoft Power-
Point. In the next subsection, we outline specific
ways in which this structure violates multimedia
learning principles. We then describe features of an
alternative structure called the assertion–evidence
structure, which integrates six multimedia learning
principles and which can also be applied to slide
creation in commonly used programs such asPowerPoint.
1.3 Common practice slides
The typical features of many PowerPoint slides
highlight how multimedia learning principles are
violated. Figure 1 shows the default settings of
PowerPoint’s master slide, which has undergonerelatively few changes since its inception more
than twenty-five years ago [36]. Although several
slideware programs exist, we focus on the design of
slides using Microsoft PowerPoint. The reason is
that worldwide about 250 million computers have
PowerPoint software installed, and its slides are
used to give more than 30 million presentations
each day [37]. In addition, PowerPoint has a domi-nant share of the slidewaremarket—asmuch as 95%
[38], and its default settings wield considerable
power in shaping slides that are often created for
instructional purposes.
How the Design of Presentation Slides Affects Audience Comprehension 1565

Several aspects of the default slide encourage
violation of multimedia learning principles. A first
important group of features to note are those that
give rise to the slide’s topic–subtopic structure. The
slide is composed of a short, phrase headline and a
text box that calls for a bulleted text list. The phraseheadline specifies a general topic, and each bulleted
item listed below appears as a sub-topic that is given
equal importance through an outline form. Prior
descriptive research has assessed the prevalence of
this default structure with and without the addition
of an image alongside the bulleted list. Estimates of
slides following this topic–subtopic structure have
ranged from 65% of slides in a sample of presenta-tions designed for professional communication in
engineering and science [11], to 80% of slides
included with the instructor materials in a sample
of introductory psychology textbooks [39]. Because
of its high frequency of use, commonly presented
topic–subtopic slides that contain a phrase headline
and bulleted list, with or without additional images,
canbe referred to as common-practice slides (seeFig.2 for examples).
Although the common-practice structure has
been the subject of much criticism in the field of
technical communication [37, 40–41], our paper
focuses on the limitations of this structure from
the perspective of multimedia learning theory.
According to the principle of signaling, slide
headlines should make explicit the structure of theinformation contained on the slide. However, the
phrase headline violates the principle of signaling in
three main ways. First, the phrase at the top of the
slide indicates the general topic, but not the relation
of the topic to other topics, or the positioning of the
topic in the overall sequence of instruction. Second,
the bulleted list does not aid in signaling between
items and constrains the representation of relation-ships to one typeof relationship at a time [12]. Third,
the bullets conceal the connection between informa-
tional elements such that the learner must make the
appropriate connections, or listen and wait for the
speaker to explain them. For novices in the content
area, the additional work needed to knit together a
coherent understanding of the connections between
concepts and sub-concepts could increase extra-neous cognitive load [42].
The coherence and redundancy principles
Joanna K. Garner and Michael P. Alley1566
Fig. 1. The default options commonly used as a starting point for instructional slides.
Fig. 2. Examples of common-practice slides. The top slide uses aphrase headline and a bulleted list, and the bottom slide uses aphrase headline, bulleted list, and graphic.

emphasize the reduction of extraneous text on an
instructional slide, particularly if the slide is to be
accompanied by a narrative or commentary. As
such, following the default setting for a textbox inthe body of a topic–subtopic slide encourages the
slide creator to violate these two principles. In the
case of the coherence principle, including a great
deal of non-critical, detailed information in the
large default text box makes it more difficult for
learners to extract the key point of the slide. This
difficulty for learners is particularly likely if the
learners donot have a great deal of prior knowledge,which would otherwise allow the distinction of
central informational elements from peripheral,
non-essential ones [42–43]. In the case of the redun-
dancy principle, text in the text box that is also read
aloud by the instructor produces redundancy and
potentially increases extraneous cognitive load.
Because the default text box in the body of topic–
subtopic slides encourages text andoften shrinks thefont size automatically to allowmore and more text
to be added, the likelihood of that redundancy is
high.
The default setting of PowerPoint encourages the
use of text as the primary modality for presenting
information in the body of a slide. Images, graphics
and other visual media can be included, but are
offered as a secondary choice to the bulleted list.This default setting reduces the emphasis on the use
of pictorial information and stands in direct con-
trast to the modality principle, which states that
images and graphics are beneficial to learning [6].
Descriptive research in this area noted the presence
of images on only 40–60% of topic–subtopic slides
designed for professional communication in engi-
neering and science [11], and only 33% of topic–
subtopic slides from college-level textbook supple-
mentarymaterials [39].Moreover, not all images are
created equal; the most useful images are those thatexplain rather than simply decorate or even replicate
the information presented in the text of the slide [44–
45].When thismore rigorous purpose is applied as a
criterion, as little as 10% of instructional common-
practice slides in a sample of college-level psychol-
ogy textbooks meet the criterion for the inclusion of
explanatory images [39]. Instead, many images
simply add situational interest or visual entertain-ment, thus representing a harmful disconnection
between the graphic and instructional purpose of
the slide [46].
In summary, common-practice slides violate sev-
eral multimedia learning principles. The use of the
default settings and minor variants thereof is unli-
kely to contain statements or images that promote
the clear presentation of connections among con-cepts. The application of multimedia principles to
this structure reveals its inherently problematic
nature, if the goal of the instructional presentation
is to allow learners to build a coherent understand-
ing of a system, process, or sequence of events.
1.4 Assertion–evidence slides
The assertion–evidence (AE) slide structure was
initially developed for scientific, engineering, and
business communication purposes [47–48], but
recent research has focused on its applicability toinstructional settings [11, 39–40, 49–50]. The struc-
ture replaces the phrase headline with a succinct
sentence that contains themaindeclaration or asser-
tion of the slide. The body of the slide is then used to
How the Design of Presentation Slides Affects Audience Comprehension 1567
Fig. 3. Default settings for the assertion–evidence slide structure, which features asentenceassertionheadlineandexplanatory graphicswith spatially contiguous text.

visually depict evidence that supports, explains,
organizes or interprets the headline. Visual evidence
can include pictures, graphs, tables, diagrams and
words arranged visually [47]. The default template
for the assertion–evidence structure is shown in Fig.
3. Shown in Fig. 4 are examples of the assertion–evidence structure that present the same content as
the common-practice slides of Fig. 2.
The most striking departure from the common-
practice slide structure is the absence of a topic–
subtopic format. Instead of having a phrase head-
line, the assertion–evidence slide structure calls for a
sentence headline that makes explicit the main
message or assertion that the instructor wishes tomake. This thesis statement in the headline acts as
an anchor that the learner can use to interpret the
informational interactivity displayed in the body of
the text. While at first glance the sentence headline
might appear to violate the multimedia principle of
redundancy, this sentence is a single-sentence sum-
mary of the slide that reinforces, on average, ten
spoken sentences [47]. The result is the simultaneousapplication of the principles of signaling, coherence
and redundancy, because the headline acts to specify
relations among key concepts and encourages the
instructor to represent only critical concepts or
relations.
The second major structural difference between
the CP and AE slide structures is the absence of a
bulleted list. In the AE structure, explanatoryimages are encouraged to provide evidence to sup-
port the sentence heading assertion. Because the
headline specifies a key assertion, finding or propo-
sition, the slide creator is compelled to use explana-
tory andnot decorative or partially representational
images. In essence, this feature encourages congru-
ence with the modality principle. It also steers the
instructor from violating the redundancy principlebecause the instructor’s verbal presentation
explains rather than repeats the slide content.
1.5 Prior research on presentation slide elements
Multimedia learning research, suchas [51], has often
used slideware to present stimuli, but studies have
typically focused on the learning outcomes asso-ciated with specific manipulations of features that
represent individual principles. Less attention has
been paid to investigations of the value of integrat-
ing principles using a consistent slide template,
although findings from studies that varied slide
content and structure are relevant. For example, in
their study of college student learning ofNewtonian
mechanics, Wiebe and Annetta [46] examined theeffect of high and low text density and high and low
text–graphic integration. The study also incorpo-
rated a violation of the redundancy principle as
students either read silently or viewed a narrated
slide presentation for each condition. Although no
post-test differences in knowledge were found, eyetracking data revealed differences in visual attention
for learners in the narrated condition, which also
included dense text. In this case, learners spent
increased time viewing the content of the slide, but
reduced their visual attention to the slide text. This
finding suggests the learners’ use of a strategy
designed to minimize the otherwise detrimental
impact of redundancy. Similarly, other studies sup-port the use of explanatory images on instructional
slides. Tangen et al. [52] showed ninety college
students a 15-minute presentation accompanied by
184 slides. One third of the presentation incorpo-
rated text-relevant images, one third incorporated
text-irrelevant images, and one third contained text
only. Scores on an immediate post-test were lowest
for items pertaining to the text-incongruent imageslides. This finding suggests that incongruence cre-
ated additional workload for the learners as they
sought to comprehend the information.
Neither of the previous studies explicitly manipu-
lated slide structure in a manner that applied multi-
Joanna K. Garner and Michael P. Alley1568
Fig. 4. Examples of assertion–evidence slides. Note that theseslides present the same content as that found in the common-practice slides of Fig. 2. Also note that the bottom slide includes asequence of layers to highlight features of the scanner. Shownhere is the last layer, which emphasizes the RF transceiver.
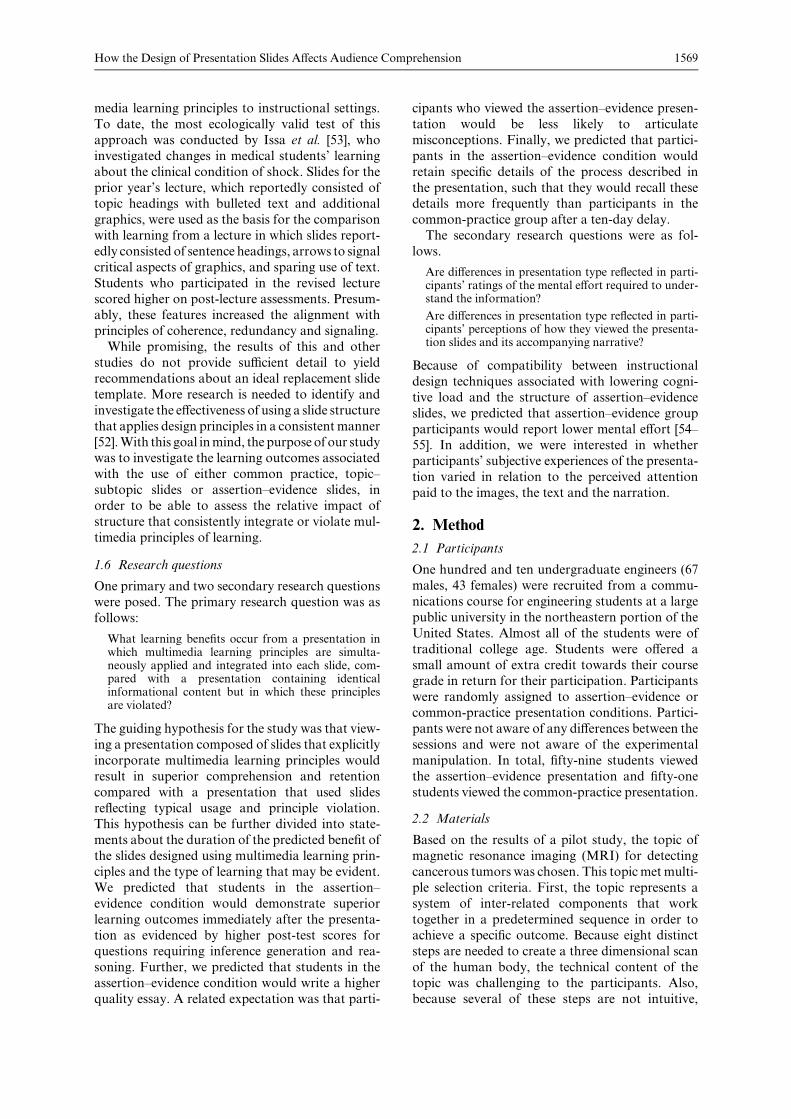
media learning principles to instructional settings.
To date, the most ecologically valid test of this
approach was conducted by Issa et al. [53], who
investigated changes in medical students’ learning
about the clinical condition of shock. Slides for the
prior year’s lecture, which reportedly consisted oftopic headings with bulleted text and additional
graphics, were used as the basis for the comparison
with learning from a lecture in which slides report-
edly consisted of sentence headings, arrows to signal
critical aspects of graphics, and sparing use of text.
Students who participated in the revised lecture
scored higher on post-lecture assessments. Presum-
ably, these features increased the alignment withprinciples of coherence, redundancy and signaling.
While promising, the results of this and other
studies do not provide sufficient detail to yield
recommendations about an ideal replacement slide
template. More research is needed to identify and
investigate the effectiveness of using a slide structure
that applies design principles in a consistent manner
[52].With this goal inmind, the purpose of our studywas to investigate the learning outcomes associated
with the use of either common practice, topic–
subtopic slides or assertion–evidence slides, in
order to be able to assess the relative impact of
structure that consistently integrate or violate mul-
timedia principles of learning.
1.6 Research questions
One primary and two secondary research questions
were posed. The primary research question was as
follows:
What learning benefits occur from a presentation inwhich multimedia learning principles are simulta-neously applied and integrated into each slide, com-pared with a presentation containing identicalinformational content but in which these principlesare violated?
The guiding hypothesis for the study was that view-
ing a presentation composed of slides that explicitly
incorporate multimedia learning principles would
result in superior comprehension and retention
compared with a presentation that used slides
reflecting typical usage and principle violation.This hypothesis can be further divided into state-
ments about the duration of the predicted benefit of
the slides designed using multimedia learning prin-
ciples and the type of learning that may be evident.
We predicted that students in the assertion–
evidence condition would demonstrate superior
learning outcomes immediately after the presenta-
tion as evidenced by higher post-test scores forquestions requiring inference generation and rea-
soning. Further, we predicted that students in the
assertion–evidence condition would write a higher
quality essay. A related expectation was that parti-
cipants who viewed the assertion–evidence presen-
tation would be less likely to articulate
misconceptions. Finally, we predicted that partici-
pants in the assertion–evidence condition would
retain specific details of the process described in
the presentation, such that they would recall thesedetails more frequently than participants in the
common-practice group after a ten-day delay.
The secondary research questions were as fol-
lows.
Are differences in presentation type reflected in parti-cipants’ ratings of the mental effort required to under-stand the information?
Are differences in presentation type reflected in parti-cipants’ perceptions of how they viewed the presenta-tion slides and its accompanying narrative?
Because of compatibility between instructional
design techniques associated with lowering cogni-
tive load and the structure of assertion–evidence
slides, we predicted that assertion–evidence group
participants would report lower mental effort [54–
55]. In addition, we were interested in whetherparticipants’ subjective experiences of the presenta-
tion varied in relation to the perceived attention
paid to the images, the text and the narration.
2. Method
2.1 Participants
One hundred and ten undergraduate engineers (67
males, 43 females) were recruited from a commu-
nications course for engineering students at a large
public university in the northeastern portion of the
United States. Almost all of the students were of
traditional college age. Students were offered a
small amount of extra credit towards their coursegrade in return for their participation. Participants
were randomly assigned to assertion–evidence or
common-practice presentation conditions. Partici-
pants were not aware of any differences between the
sessions and were not aware of the experimental
manipulation. In total, fifty-nine students viewed
the assertion–evidence presentation and fifty-one
students viewed the common-practice presentation.
2.2 Materials
Based on the results of a pilot study, the topic of
magnetic resonance imaging (MRI) for detecting
cancerous tumors was chosen. This topic metmulti-
ple selection criteria. First, the topic represents a
system of inter-related components that work
together in a predetermined sequence in order toachieve a specific outcome. Because eight distinct
steps are needed to create a three dimensional scan
of the human body, the technical content of the
topic was challenging to the participants. Also,
because several of these steps are not intuitive,
How the Design of Presentation Slides Affects Audience Comprehension 1569

participantswould have to understand the presenta-tion to correctly relate that process in an essay. The
systemic, structural content of the topic of MRI
scanning is therefore somewhat parallel to the brake
system or lightning formation sequence used in
much of Mayer’s work [1]. Accordingly, the pre-
sentation included a simplified description that pilot
testing revealed was appropriate for college stu-
dents majoring in science or engineering, but whowere otherwise unfamiliar with nuclear medicine
and imaging techniques. In addition, the technicalprocess of MRI is based on principles that are
included in first-year university physics, chemistry
and biology courses. For that reason, even though
the participants were unlikely to have specific prior
knowledge of how MRI works, the undergraduate
engineering students, who were the participants in
the study, were capable of understanding the topic.
Figure 5 shows the script and several of the slidesin each condition. The slides chosen present the
Joanna K. Garner and Michael P. Alley1570
Fig. 5.Comparison of selected common-practice slides (left) and assertion–evidence slides (middle) with the accompanying script (right).These slides present the process of magnetic resonance imaging.

technical process ofmagnetic resonance imaging. Indeveloping the eleven common-practice condition
slides, two frequently used sub-structures of slide
design were used. The first consisted of a topic-
phrase heading supported solely by a bulleted list.
As foundbyGarner et al. [11], this structure is found
in about 40% of slides from engineering and science
presentations. The second structure consisted of a
topic-phrase heading supported by a bulleted listand graphics. Garner et al. [11] found that this
second structure accounted for 26% of technicalinstruction slides in engineering and science. For
each sub-structure of common-practice slide, the
number of words per slide and the percentage of
slides with graphics were comparable to statistics
gathered previously [11]. In this case, the mean
number of words per slide for the common-practice
version was 41.5, with 64% of the slides containing
relevant graphics. Animation was not used in thiscondition.
How the Design of Presentation Slides Affects Audience Comprehension 1571
Fig. 5. (cont.)

In developing the eleven assertion–evidence
slides, we followed specific criteria outlined by
Alley [47]. These criteria included having no more
than two lines for the sentence assertion headlines,
supporting those headlines with relevant graphics,
andhaving as fewwords as possible for the bodies ofthe slides. The mean number of words per slide for
this condition was 21.2, and each slide in the
assertion–evidence condition contained a relevant
graphic image. On eight slides in the assertion–
evidence condition, portions of a graphic always
visible in the common-practice condition appeared
on cue when mentioned in the narrated script.
An identical 1000 word narrative script wasadded to both slide conditions and progressed at
the same rate for each condition. The narrative
introduced the topic of the presentation and out-
lined the content. It gave statistics about the pre-
valence of cancer in the American population and
provided information about the structure and func-
tion of the MRI scanner components. It then
described the sequence of events that allows thescanner’s operation to create three dimensional
images of the human body (refer back to Fig. 5).
The narration also detailed how radio-frequency
waves emitted and detected by the scanner differen-
tially affect hydrogen atoms in the body and how
these behave in the presence of amagnetic field. The
script included information on the relationship
between hydrogen atoms and the presence of differ-ent types of tissues in the human body, including
cancerous tissue. The narration was recorded by a
female, native-English speaker. The rate of presen-
tation of content was timed with the progression of
the slides. The mean number of words spoken per
minute of the narrative was 141. Regardless of
condition, the presentation lasted eight minutes.
2.3 Procedure
Each participant attended one experimental session
in a classroom equipped with computer projection
and audio capabilities. Following the informed
consent procedure, participants were told that
they were to view a presentation and pay careful
attention to its content. The presentation, consist-ing of the slides with the pre-recording accompany-
ing narration, was then shown. Immediately after
the conclusion of the presentation students were
given a prompt on a sheet of paper, instructing them
to write an essay describing the parts of an MRI
machine and their role in the detection of cancerous
tissue in the human body. Following the essay, for
which 30minuteswere permitted, participants spent10 minutes providing basic information about
themselves such as gender, course section, college
major and semester standing. Then participants
also completed seven Likert scale questions asking
them about their attentional focus and degree of
perceived mental effort during the presentation.
Finally, participants completed multiple choice
questions that were designed to assess recall of
details and facts and the ability to understand
MRI processes in a coherent sequence.One week after the experimental session, in the
regular classroom setting, students were given an
unexpected delayed post-test. The delayed post-test
consisted of 17 sentence completion questions. Of
these, five questions were designed to assess reten-
tion of detailed information and twelve questions
were designed to assess understanding of the
sequence and purpose of MRI processes. Examplequestions included recalling what percentage of
people in the United States would contract cancer
in their lifetime (simple factual recall) and what
occurs after the magnetic field causes alignment of
spins in the patient’s body (complex level).
2.4 Data scoring
All scoring was conducted in a blind manner. A
detailed rubric was developed for scoring the essays
and is included within the script (see Appendix).
Essays were scored by two authors with one author
continuing to score the remaining essays after inter-
rater agreement was established using the first 25
essays. Inter-rater agreement was calculated by
dividing the number of statements scored the sameway by the total number of statements that were
scored. Agreement at the 90% level was reached
between the first and second authors prior to the
remaining essays being coded by the second author.
To assess differences in the participants’ ability to
recall and explain specific segments of the MRI
process, separate sub-totals were generated per
segment of the presentation. These separated sub-totals were then summed to create a total score for
the essay. These five sub-totals reflected partici-
pants’ ability to correctly explain (1) the parts of
the MRI machine, (2) the role of the superconduct-
ing magnet and radio-frequency transceiver in the
MRI process, (3) the effects of radio-frequency
waves on atomic structures in the body, (4) the
role of tissue density in permitting canceroustissue to be detected and (5) themethod of computa-
tional analysis used to generate MRI images. As
such, each sub-total represented a discrete step that
the participant would need to be able to mentally
simulate in order to describe the process of MRI
scanning correctly. The sub-totals provide an
assessment of the structure of the participant’s
mental model representation of the process.A separate sub-total score was calculated to
represent the degree to which participants included
statements that captured the dynamic aspect of the
multi-step process of MRI image generation. These
Joanna K. Garner and Michael P. Alley1572

sub-totals may be interpreted as an assessment of
the ability of the participant to dynamically connect
each component of their mental model representa-
tion. For example, this score increased as partici-
pants made statements about the correct sequential
order of dynamic processes such as the transmissionand reception of radio-frequency waves, alignment
of atomswith themagnetic field,movement of atoms
to a higher and lower energy state depending on
radio-frequency absorption, and the later release of
energy by excited atoms in the form of a wave.
Essays were also scored for the presence of
misconceptions. Misconception scores were calcu-
lated separately from the participant’s total scorefor the essay, such that the presence of misconcep-
tions did not create a penalty other than would be
incurred naturally by not recalling the information
correctly. Misconceptions were defined as state-
ments that revealed a misunderstanding of the
processes involved inMRI scanning, such as stating
that the cancer cells rather than the hydrogen atoms
become aligned with the magnetic field, or that thesuperconductingmagnetic field is switched offwhen
the radio-frequency waves are emitted. Participants
with major misconceptions presented not only an
inaccurate but an alternative explanation for that
step in the overall MRI process. Minor misconcep-
tions were categorized as statements that repre-
sented an incomplete understanding, such as
writing that only hydrogen atoms would be affectedby the magnetic field.
Immediate post-test multiple choice questions
were scored dichotomously. Multiple choice ques-
tions were aggregated into three groups according
to whether they required the recall of factual and
statistical information (5 questions), process-
related information (4 questions), or the generation
of inferences and simulations of processes implicitlycontained in the presentation (2 questions). One
multiple choice question was dropped from the
aggregation process because of a ceiling effect.
To investigate differences between groups, we
conducted a delayed post-test. This delayed post-
test consisted of 10 fill-in-the-blank questions
designed to assess students’ recall and understand-
ing of the functions of the main components of theMRI scanner and the step-by-step processes used in
scanning the human body in order to create three
dimensional images. Questions paralleled the order
in which concepts were presented in the original
presentation. Delayed post-test sentence comple-
tion questions were scored according to a 0–2
point system. One point was given for a partially
correct response.
2.5 Data analysis
Parametric inferential statistical tests were used to
determine the nature of relationships between self-
ratings and learning outcomes, and differences
between conditions and learning outcomes. Corre-
lations, independent samples t-tests, andAnalysis of
Variance were conducted using SPSS 18.0 for Win-
dows. There was no effect of gender on any of theoutcome measures. Data were collapsed across
gender for each condition.
3. Results
The primary research question sought to determine
comprehension and learning differences between
participants who viewed the assertion–evidenceslide structure presentation and those who viewed
the common-practice one. Analyses of the essay and
multiple choice responses were used to inform the
hypothesis that as a group, participants who viewed
the assertion–evidence presentation would show
superior comprehension than those who viewed
the common-practice presentation.
3.1 Evidence of learning as demonstrated by essay
responses
3.1.1 Total scores
The essay prompt required students to write a
detailed description of how the MRI scanner func-
tions to create three dimensional images that can be
used to detect cancerous cells in the human body.
Total scores were used as the dependent variable inan independent samples t-test, which revealed sig-
nificant differences in favor of the group of students
who experienced the assertion–evidence presenta-
tion, t(93.43) = 3.67, p < 0.001, Cohen’s d = 0.81.
Descriptive statistics are presented in Table 1.
3.1.2 Recall of correct sequence of the MRI process
Essays were also scored in subsections that related
to specific parts of the presentation. These parts also
conformed to steps in the MRI process, although
the components of the MRI machine were also
grouped as a subsection. ANOVA analysis revealed
significant differences in favor of the assertion–evidence condition for four out of five subsections
(see Table 1). For the subsection where students
needed to describe the parts of the MRI machine
accurately, F(1,110) = 19.32, p < 0.000, Cohen’s d =
0.82. For recall of the roles of magnets and the
transceiver, F(1,110) = 6.07, p = 0.015, Cohen’s d =
0.39. For the effects of radio-frequency waves on
atomic structures in the body, F(1,110) = 6.45, p =0.013, Cohen’s d = 0.46. For the role of tissue
density in permitting cancerous tissue to be
detected, F(1,110) = 4.178, p = 0.043, Cohen’s d =
0.34.Groupdifferences in the participants’ ability to
describe the computational analysis used as the final
How the Design of Presentation Slides Affects Audience Comprehension 1573
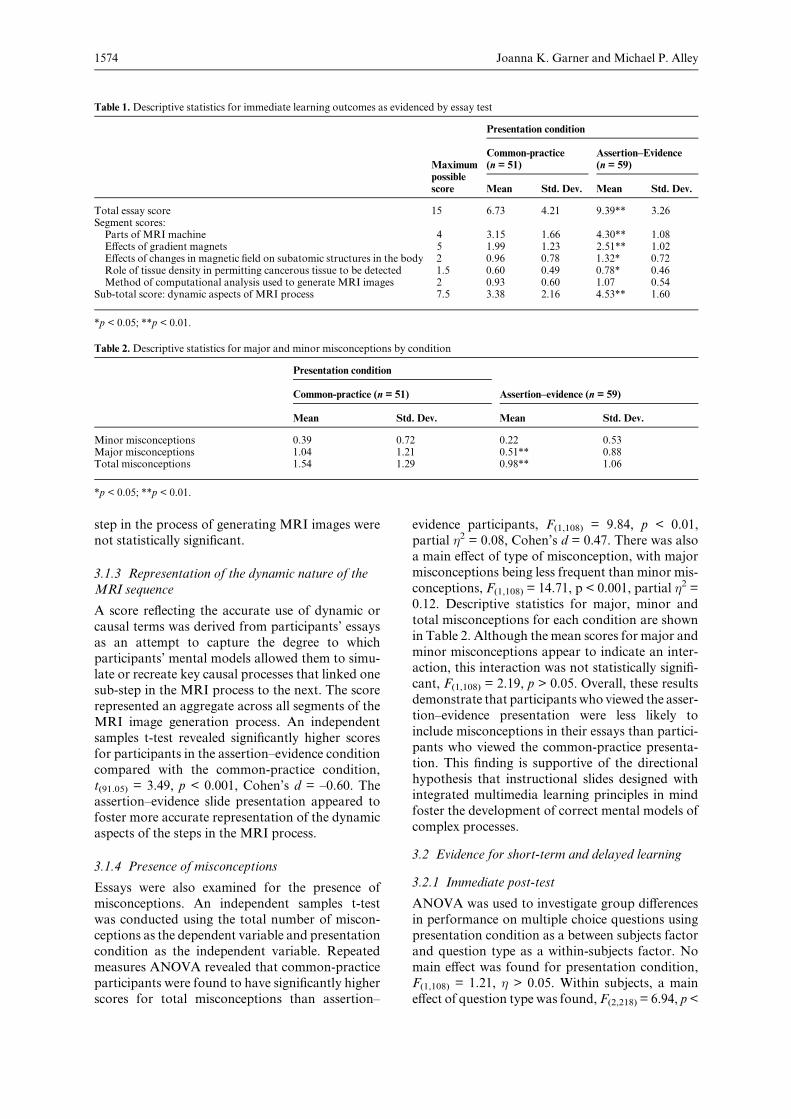
step in the process of generating MRI images werenot statistically significant.
3.1.3 Representation of the dynamic nature of the
MRI sequence
A score reflecting the accurate use of dynamic or
causal terms was derived from participants’ essays
as an attempt to capture the degree to which
participants’ mental models allowed them to simu-late or recreate key causal processes that linked one
sub-step in the MRI process to the next. The score
represented an aggregate across all segments of the
MRI image generation process. An independent
samples t-test revealed significantly higher scores
for participants in the assertion–evidence condition
compared with the common-practice condition,
t(91.05) = 3.49, p < 0.001, Cohen’s d = –0.60. Theassertion–evidence slide presentation appeared to
foster more accurate representation of the dynamic
aspects of the steps in the MRI process.
3.1.4 Presence of misconceptions
Essays were also examined for the presence of
misconceptions. An independent samples t-test
was conducted using the total number of miscon-ceptions as the dependent variable and presentation
condition as the independent variable. Repeated
measures ANOVA revealed that common-practice
participants were found to have significantly higher
scores for total misconceptions than assertion–
evidence participants, F(1,108) = 9.84, p < 0.01,partial �2 = 0.08, Cohen’s d = 0.47. There was also
a main effect of type of misconception, with major
misconceptions being less frequent than minor mis-
conceptions, F(1,108) = 14.71, p < 0.001, partial �2 =0.12. Descriptive statistics for major, minor and
total misconceptions for each condition are shown
in Table 2. Although the mean scores for major and
minor misconceptions appear to indicate an inter-action, this interaction was not statistically signifi-
cant, F(1,108) = 2.19, p > 0.05. Overall, these results
demonstrate that participants who viewed the asser-
tion–evidence presentation were less likely to
include misconceptions in their essays than partici-
pants who viewed the common-practice presenta-
tion. This finding is supportive of the directional
hypothesis that instructional slides designed withintegrated multimedia learning principles in mind
foster the development of correct mental models of
complex processes.
3.2 Evidence for short-term and delayed learning
3.2.1 Immediate post-test
ANOVA was used to investigate group differences
in performance on multiple choice questions usingpresentation condition as a between subjects factor
and question type as a within-subjects factor. No
main effect was found for presentation condition,
F(1,108) = 1.21, � > 0.05. Within subjects, a main
effect of question type was found, F(2,218) = 6.94, p<
Joanna K. Garner and Michael P. Alley1574
Table 1. Descriptive statistics for immediate learning outcomes as evidenced by essay test
Presentation condition
MaximumCommon-practice(n = 51)
Assertion–Evidence(n = 59)
possiblescore Mean Std. Dev. Mean Std. Dev.
Total essay score 15 6.73 4.21 9.39** 3.26Segment scores:Parts of MRI machineEffects of gradient magnets
45
3.151.99
1.661.23
4.30**2.51**
1.081.02
Effects of changes in magnetic field on subatomic structures in the body 2 0.96 0.78 1.32* 0.72Role of tissue density in permitting cancerous tissue to be detected 1.5 0.60 0.49 0.78* 0.46Method of computational analysis used to generate MRI images 2 0.93 0.60 1.07 0.54
Sub-total score: dynamic aspects of MRI process 7.5 3.38 2.16 4.53** 1.60
*p < 0.05; **p < 0.01.
Table 2. Descriptive statistics for major and minor misconceptions by condition
Presentation condition
Common-practice (n = 51) Assertion–evidence (n = 59)
Mean Std. Dev. Mean Std. Dev.
Minor misconceptions 0.39 0.72 0.22 0.53Major misconceptions 1.04 1.21 0.51** 0.88Total misconceptions 1.54 1.29 0.98** 1.06
*p < 0.05; **p < 0.01.

0.001, partial �2 = 0.01. Between subjects, an inter-
action was found between question type and condi-
tion, F(2,108) = 5.68, p < 0.01, partial �2 = 0.06; a
significant effect of presentation condition was
found for higher cognitive level questions requiring
inference and simulation, F(1,110) = 11.25, p < 0.01,partial �2 = 0.09. These results suggest that imme-
diately after viewing the presentation, students in
the assertion–evidence condition were no less likely
to recall factual, statistical or explicitly presented
process-related information than students in the
common-practice condition.
3.2.2 Delayed post-test
The delayed post-test items required sentence com-
pletion in a manner that paralleled the sequence ofsteps involved in the MRI process as detailed in the
narrated script that accompanied the slides ten days
earlier. From these completed sentences, a total
score was calculated. Total score was used as the
dependent variable in an independent samples t-
test, which revealed significant differences in favor
of the students in the assertion–evidence condition,
t(93) = 4.34, p < 0.001, Cohen’s d = 0.89. Descriptivestatistics associated with this finding are included in
Table 3. This finding is supportive of the hypothesis
that the relative benefit of experiencing assertion–
evidence slides persists over time.
3.3 Participants’ ratings of assertion–evidence and
common-practice slides
3.3.1 Perceived mental effort
Perceived mental effort required to comprehend the
information was used as an indicator of subjective
cognitive load. Slide presentation condition signifi-
cantly impacted students’ perceived mental effort.
On a 7-point scale where a 7 indicated very high
effort, the mean self-rating for students in the
common-practice condition was 3.61 (SD = 1.11)
and the mean self-rating for students in the asser-tion–evidence condition was 3.01 (SD = 1.17). An
independent samples t-test revealed that students in
the common-practice condition gave higher average
ratings for their perceived mental effort required to
learn the information than did students in the
assertion–evidence condition, t(109) = –2.71, p <
0.01, Cohen’s d = –0.50. Self-rating of mental
effort was also significantly and negatively corre-lated with learning outcomes as measured on the
essay test, even when controlling for self-rating of
prior knowledge, r = –0.23, p < 0.05. That is,
participants who reported high mental effort
tended to show poorer learning outcomes than
participants who reported low mental effort. This
case occurred regardless of the amount of prior
knowledge about the topic area that the participantreportedly had, suggesting that presentation condi-
tion impacted ratings regardless of prior knowledge
about the topic.
3.3.2 Self-rated prior knowledge
Self-ratings of content knowledge were included in
an attempt to address the issue that post-exposure
indicators of learning outcomemaybe influenced by
prior knowledge. On the 7-point scale, with 7
indicating that all of the information presentedwas already known, the mean response was 2.58
(SD = 1.24). Prior knowledge ratings did differ
significantly between conditions, t(108) = –2.71, p <
0.001, with participants in the assertion–evidence
condition rating themselves as having higher prior
knowledge of the topic. The mean rating was 2.87
(SD = 1.36) for participants in the assertion–evi-
dence condition. For participants in the common-practice condition, the mean rating of prior knowl-
edge was 2.24, (SD = 1.00). However, simple corre-
lation analyses revealed that self-rating of prior
knowledge was not correlated with post-test learn-
ing outcomes. Self-rating of prior knowledge was
correlated with perceived mental effort, r = –0.22,
p < 0.05. In both conditions, participants who gave
themselves lower prior knowledge scores were morelikely to report that higher mental effort was needed
to comprehend the presentation.
How the Design of Presentation Slides Affects Audience Comprehension 1575
Table 3. Descriptive statistics for immediate and delayed learning outcomes as evidenced by multiple choice and fill-in-the-blank tests
Presentation condition
Common-practice (n = 51) Assertion–evidence (n = 59)Maximumpossible score Mean Std. Dev. Mean Std. Dev.
Immediate multiple choice post-testItems assessing recall of facts and statistics 5 4.14 1.06 3.80 1.05Items assessing comprehension of processes 4 3.23 0.84 3.47 0.75Items assessing inferences and simulation 2 0.86 0.66 1.32** 0.75
Delayed fill-in-the-blank post-test itemsassessing comprehension of processes1 10 5.52 2.69 7.77** 2.35
*p < 0.05; **p < 0.01; 1 CP n = 42; AE n = 53.
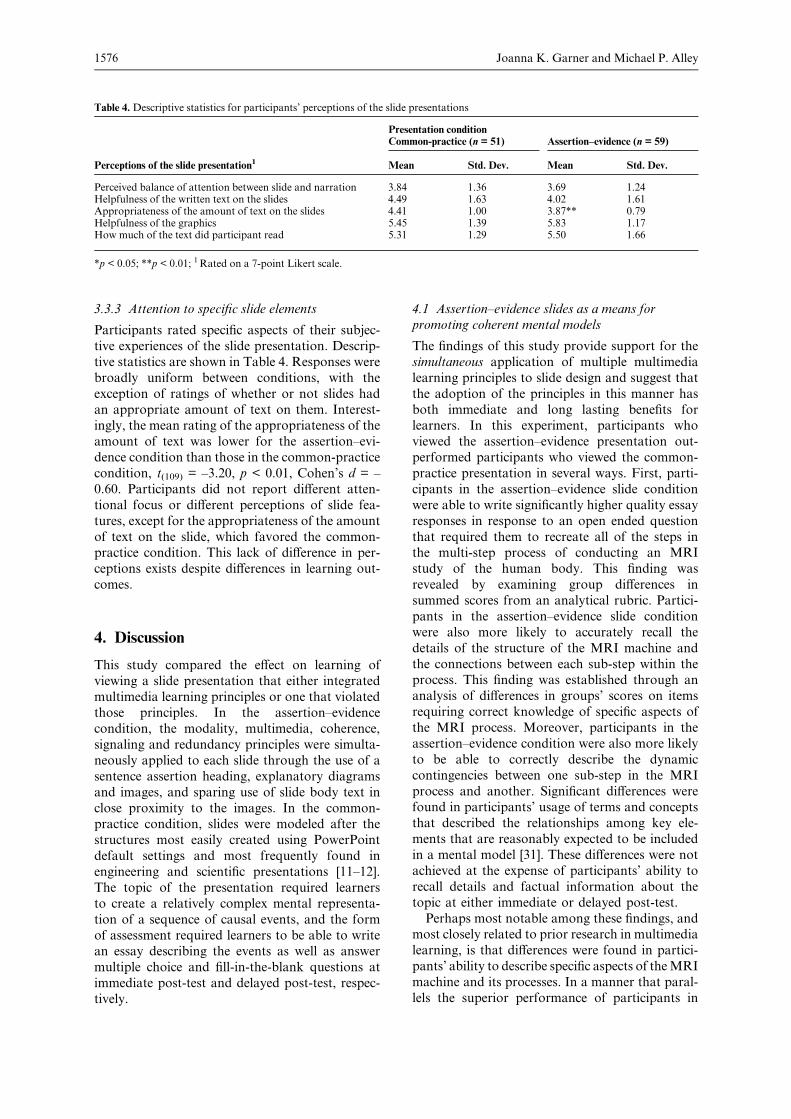
3.3.3 Attention to specific slide elements
Participants rated specific aspects of their subjec-
tive experiences of the slide presentation. Descrip-
tive statistics are shown in Table 4. Responses were
broadly uniform between conditions, with the
exception of ratings of whether or not slides had
an appropriate amount of text on them. Interest-ingly, the mean rating of the appropriateness of the
amount of text was lower for the assertion–evi-
dence condition than those in the common-practice
condition, t(109) = –3.20, p < 0.01, Cohen’s d = –
0.60. Participants did not report different atten-
tional focus or different perceptions of slide fea-
tures, except for the appropriateness of the amount
of text on the slide, which favored the common-practice condition. This lack of difference in per-
ceptions exists despite differences in learning out-
comes.
4. Discussion
This study compared the effect on learning of
viewing a slide presentation that either integratedmultimedia learning principles or one that violated
those principles. In the assertion–evidence
condition, the modality, multimedia, coherence,
signaling and redundancy principles were simulta-
neously applied to each slide through the use of a
sentence assertion heading, explanatory diagrams
and images, and sparing use of slide body text in
close proximity to the images. In the common-practice condition, slides were modeled after the
structures most easily created using PowerPoint
default settings and most frequently found in
engineering and scientific presentations [11–12].
The topic of the presentation required learners
to create a relatively complex mental representa-
tion of a sequence of causal events, and the form
of assessment required learners to be able to writean essay describing the events as well as answer
multiple choice and fill-in-the-blank questions at
immediate post-test and delayed post-test, respec-
tively.
4.1 Assertion–evidence slides as a means for
promoting coherent mental models
The findings of this study provide support for the
simultaneous application of multiple multimedia
learning principles to slide design and suggest that
the adoption of the principles in this manner has
both immediate and long lasting benefits forlearners. In this experiment, participants who
viewed the assertion–evidence presentation out-
performed participants who viewed the common-
practice presentation in several ways. First, parti-
cipants in the assertion–evidence slide condition
were able to write significantly higher quality essay
responses in response to an open ended question
that required them to recreate all of the steps inthe multi-step process of conducting an MRI
study of the human body. This finding was
revealed by examining group differences in
summed scores from an analytical rubric. Partici-
pants in the assertion–evidence slide condition
were also more likely to accurately recall the
details of the structure of the MRI machine and
the connections between each sub-step within theprocess. This finding was established through an
analysis of differences in groups’ scores on items
requiring correct knowledge of specific aspects of
the MRI process. Moreover, participants in the
assertion–evidence condition were also more likely
to be able to correctly describe the dynamic
contingencies between one sub-step in the MRI
process and another. Significant differences werefound in participants’ usage of terms and concepts
that described the relationships among key ele-
ments that are reasonably expected to be included
in a mental model [31]. These differences were not
achieved at the expense of participants’ ability to
recall details and factual information about the
topic at either immediate or delayed post-test.
Perhaps most notable among these findings, andmost closely related to prior research in multimedia
learning, is that differences were found in partici-
pants’ ability to describe specific aspects of theMRI
machine and its processes. In a manner that paral-
lels the superior performance of participants in
Joanna K. Garner and Michael P. Alley1576
Table 4. Descriptive statistics for participants’ perceptions of the slide presentations
Presentation conditionCommon-practice (n = 51) Assertion–evidence (n = 59)
Perceptions of the slide presentation1 Mean Std. Dev. Mean Std. Dev.
Perceived balance of attention between slide and narration 3.84 1.36 3.69 1.24Helpfulness of the written text on the slides 4.49 1.63 4.02 1.61Appropriateness of the amount of text on the slides 4.41 1.00 3.87** 0.79Helpfulness of the graphics 5.45 1.39 5.83 1.17How much of the text did participant read 5.31 1.29 5.50 1.66
*p < 0.05; **p < 0.01; 1Rated on a 7-point Likert scale.

other multimedia learning studies where a principle
is introduced and experimentally manipulated, the
current study also revealed differences in favor of
the principle-congruent condition. However, in this
case, the differences favored the assertion–evidence
condition in whichmultiple principles were applied.Viewing assertion–evidence slides appeared to pro-
vide an advantage when it came to being able to
accurately describe the structure of the MRI
machine and when the temporal and causal
sequence of events that occur during an MRI
study needed to be specified. Situating these findings
within the broader context of mental model con-
struction, we might say that the assertion–evidenceslides appear to promote learners’ ability to con-
struct a mental model that consists of appropriate
features as well as an accurate representation of the
relationships among those features. This finding is
very much congruent with definitions that posit
mental models as being coherent mental structures
of propositions into which the relations among
propositions are inherently represented [26–27]. Itis also worth noting that benefits to both proposi-
tional detail and relational elements of mental
models were present despite the fact that animation
features were not employed in either type of pre-
sentation. The MRI process was not shown in a
dynamic fashion; participants had to simulate the
sequence of processes that comprise MRI scans as
they wrote their essays. Members of the group thatviewed the assertion–evidence slides seem to have
been able to do this simulation more consistently.
This finding speaks to the potential utility of the
assertion–evidence slide structure for helping lear-
ners to create accurate mental models that can be
used to support reasoning, in much the same way as
prior multimedia learning studies, such as [56] have
done.A second contribution to our understanding of
multimedia learning through instructional slides
comes from our finding that assertion–evidence
slides seemed to have a protective effect when it
comes to developing misconceptions. In particular,
the assertion–evidence group was less likely to
misarticulate key causal relationships among
system components or process steps. One interpre-tation is that it is related to the quality of the mental
model that was generated during the learning epi-
sode. This interpretation is in agreement with prior
research that has attributed faulty mental models as
one source and manifestation of misconceptions
[30–31]. Because misconceptions that arise from
faulty mental models are more difficult to remediate
than simple false beliefs, it may be that assertion–evidence slides have particular merit during the
learning of science topics in which misconceptions
can arise. We propose that further research is
needed to assess the potential of the assertion–
evidence slide structure for such situations.
4.2 The effect of differences in slide structure on
perceived mental effort
Participants who viewed the assertion–evidence
condition rated their mental effort during the pre-
sentation as being lower than those in the common-
practice condition. Although this finding arises
from an indirect and global measure of cognitive
load, we interpret this finding as arising fromdifferences in extraneous cognitive load because
the information contained in both forms of the
presentation was identical. We believe that this
finding reflects a contribution towards understand-
ing how multimedia principles and cognitive load
are inter-related. Unlike other research such as [57],
themanipulation in the current experiment involved
the simultaneous application of multimedia designprinciples. We speculate that the elimination of
redundancy plays a significant role in reducing
cognitive load. Further research to uncover which
aspects of the assertion–evidence slide structure best
support the minimization of cognitive load may be
fruitful.
Interestingly, few significant differences occurred
in participants’ ratings of their experiences of theslide presentations. Assertion–evidence slides were
not judged to show more helpful text or more
helpful graphics. In the case of the graphics, this
finding may arise because of the very similar gra-
phics in both conditions. Where a difference did
occur was in the appropriateness of the amount of
text on the slides, which favored the common-
practice group. This result might conceivably reflectthe need formore focused attention on the presenta-
tion from the assertion–evidence group. However,
this explanation is unlikely, given that this group
reported lower perceived mental effort. The finding
may instead reflect participants’ expectations for
the abundant use of text, based on the cultural norm
of filling in the large text box of PowerPoint’s
default master with bulleted lists [11].
5. Conclusions
In this study, we examined immediate and delayed
learning outcomes associated with viewing a pre-
sentation that used either commonly arranged slides
or assertion–evidence slides. The presentations dif-
fered in adherence or violation of multimedia learn-
ing principles, but were otherwise identical innarration and informational content. Participants
who viewed the assertion–evidence slides demon-
strated superior comprehension and recall of infor-
mation, andwe propose that this finding is reflective
How the Design of Presentation Slides Affects Audience Comprehension 1577

of the way that assertion–evidence slides support
the development of accurate mental models.
What has been lacking until now is a clear
structure or template that can be used to support
multimedia learning during learning episodes that
take place using slide-assisted direct instruction.Wepropose that the assertion–evidence slide structure
fills that void and shows promise in improving
students’ learning from instructional slides.
Acknowledgments—We wish to extend sincere thanks to Dr.Richard Mayer for his helpful comments on an early draft ofthis paper.We wish to thankKeriWolfe and Lauren Sawarynskifor their contributions to the MRI script and help in running theexperiment. We also wish to thank the Leonhard Center for theEnhancement of Engineering Education for their financial sup-port of this work.
References
1. Richard E. Mayer, Multimedia Learning, 2nd edn, Cam-bridge University Press, New York, 2009.
2. A. Piolat, T.Olive andR. T.Kellogg, Cognitive effort duringnote taking,AppliedCognitivePsychology, 19, 2005, pp. 291–312.
3. G. Reedy, PowerPoint, interactive whiteboards, and thevisual culture of technology in schools, Technology, Peda-gogy and Education, 17, 2008, pp. 143–162.
4. A. Savoy, R. W. Proctor, and G. Salvendy, Informationretention from PowerPoint and traditional lectures, Compu-ters and Education, 52, 2008, pp. 858–867.
5. J. E. Susskind, PowerPoint’s power in the classroom:Enhan-cing students’ self-efficacy and attitudes, Computers andEducation, 45, 2005, pp. 203–215.
6. R. E. Mayer, Principles for reducing extraneous processingin multimedia learning: Coherence, signaling, redundancy,spatial contiguity, and temporal contiguity principles, in R.E. Mayer (ed.), The Cambridge Handbook of MultimediaLearning, Cambridge University Press, Cambridge, 2005,pp. 183–200.
7. R. E. Mayer and R. Moreno, Aids to computer basedmultimedia learning, Learning and Instruction 12, 2002,pp. 107–119.
8. P. Chandler and J. Sweller, Cognitive load theory and theformat of instruction, Cognition and Instruction 8, 1991,pp. 293–332.
9. W. Schnotz and M. Bannert, Construction and interferencein learning from multiple representation, Learning andInstruction, 13, 2003, pp. 141–156.
10. J. Sweller, Instructional Design in Technical Areas, ACERPress, Melbourne, 1999.
11. J. K. Garner, M. Alley, A. Gaudelli and S. Zappe, Commonuse of PowerPoint versus Assertion–Evidence Structure: ACognitive Psychology Perspective, Technical Communica-tion, 56, 2009, pp. 331–345.
12. E. Cooper, Overloading on slides: Cognitive load theory andMicrosoft’s slide program PowerPoint, Association for theAdvancement of Computing in Education Journal, 17, 2009,pp. 127–135.
13. G. N. Vik, Breaking bad habits: Teaching effective Power-Point use to working graduate students, Business Commu-nication Quarterly, 67, 2004, pp. 223–228.
14. R. E. Mayer and R. B. Anderson, Animations need narra-tions: An experimental test of a dual-coding hypothesis,Journal of Educational Psychology, 83, 1991, pp. 484–490.
15. A. Paivio,Mental Representations: ADual CodingApproach,Oxford University Press, New York, 1990.
16. A. Baddeley, Working memory: looking back and lookingforward,Nature ReviewsNeuroscience, 4, 2003, pp. 829–839.
17. R. Moreno and R. E. Mayer, Cognitive principles of multi-media learning: The role of modality and contiguity, Journalof Educational Psychology, 91, 1999, pp. 358–368.
18. P. Van Meter, M. Aleksic, A. Schwartz, and J. K. Garner,Learner-generated drawing as a strategy for learning fromcontent area text,Contemporary Educational Psychology, 31,2006, pp. 142–166.
19. R. E. Mayer and V. K. Sims, For whom is a picture worth athousand words? Extensions of a dual-coding theory ofmultimedia learning, Journal of Educational Psychology,86, 1994, pp. 389–401.
20. F. Paas, A. Renkel and J. Sweller, Cognitive load theory:Instructional implications of the interaction between infor-mation structures and cognitive architecture, InstructionalScience, 32, 2004, pp. 1–8.
21. J. Sweller, P. Chandler, P. Tierney, and M. Cooper, Cogni-tive load and selective attention as factors in the structuringof technical material, Journal of Experimental Psychology:General, 119, 1990, pp. 176–192.
22. S. F. Harp and R. E. Mayer, The role of interest in learningfrom scientific text and illustrations: On the distinctionbetween emotional and cognitive interest, Journal of Educa-tional Psychology, 89, 1997, pp. 92–102.
23. R. E. Mayer, Multimedia Learning, Cambridge UniversityPress, New York, 2003.
24. R. E. Mayer, Multimedia learning: Are we asking the rightquestions? Educational Psychologist, 32, 1997, pp. 1–19.
25. P. N. Johnson-Laird, Mental models, in M. I. Posner (ed.),Foundations of Cognitive Science, Cambridge, MA: MITPress, 1989, pp. 469–499.
26. D. Gentner and A. L. Stevens (eds.), Mental Models,Lawrence Erlbaum Associates, Hillsdale, NJ, 1983.
27. P. N. Johnson-Laird, Mental models in cognitive science.Cognitive Science, 4, 1980, pp. 71–115.
28. R. Moreno and R. E. Mayer, A coherence effect in multi-media learning: The case for minimizing irrelevant sounds inthe design of multimedia instructional messages, Journal ofEducational Psychology, 92, 2000, pp. 117–125.
29. R. E. Mayer and R. Moreno, A split attention effect inmultimedia learning: Evidence for dual processing systemsin working memory, Journal of Educational Psychology, 90,1998, pp. 312–320.
30. M. T. H. Chi, Three types of conceptual change: Beliefrevision, mental model transformation, and categoricalshift, in S. Vosniadou (ed.), Handbook of Research onConceptual Change, Erlbaum,Hillsdale,NJ, 2008, pp. 61–82.
31. S. Gadgil, T. J. Nokes-Malach and M. T. H. Chi, Effective-ness of holistic mental model confrontation in driving con-ceptual change,Learningand Instruction, 22, 2012, pp. 47–61.
32. M. K. Hare and K. C. Graber, Investigating knowledgeacquisition and developing misconceptions of high schoolstudents enrolled in an invasion games unit,TheHigh SchoolJournal, 90, 2007, pp. 1–14.
33. K. E. Stanovich, How to Think Straight about Psychology,Allyn & Bacon, Boston, 2007.
34. A. K. Taylor and P Kowalski, Naı̈ve psychological science:The prevalence, strength, and source of misconceptions, ThePsychological Record, 54, 2004, pp. 15–25.
35. E. Arntzen, J. Lokke, G. Lokke and D-E. Eilertsen, Onmisconceptions about behavior analysis among universitystudents and teachers, The Psychological Record, 60, 2010,pp. 325–336.
36. L.Gomes, PowerPoint turns 20, as its creators ponder a darkside to success,TheWall Street Journal, 20 June 2007, p. B–1.
37. J.Doumont,The cognitive style of PowerPoint:Not all slidesare evil, Technical Communication, 52, 2005, pp. 64–70.
38. I. Parker, Absolute PowerPoint, The New Yorker, 28 May2001.
39. J. K. Garner and M. Alley, Rethinking PowerPoint slidedesign in the psychology classroom: Learners’ needs shouldcome first, The Higher Education Academy’s Psychology ofLearning and Teaching Conference, Edinburgh, UK, 2010.
40. M. Alley and K. A. Neely, Rethinking the design of pre-sentation slides: A case for sentence headlines and visualevidence, Technical Communication, 52(4), 2009, pp. 417–426.
41. E. R. Tufte, The Cognitive Style of PowerPoint, GraphicsPress, Cheshire, CT, 2003.
42. J. J. G. van Merrienboer and J. Sweller, Cognitive load
Joanna K. Garner and Michael P. Alley1578
theory and complex learning: Recent developments andfuture directions, Educational Psychology Review, 17, 2005,pp. 147–177.
43. R. E. Mayer, K. Steinhoff, G. Bower and R. Mars, Agenerative theory of textbook design: Using annotated illus-trations to foster meaningful learning of science text, Educa-tional Technology Research and Development, 43, 1995,pp. 31–44.
44. J. R. Levin, G. J. Anglin and R. N. Carney, On empiricallyvalidating functionsof pictures in prose, inD.A.Willows andH.A. Houghton (eds.), The Psychology of Illustration, vol. 1,Springer-Verlag, 1987.
45. L. L. Pozzer and W. M. Roth, Prevalence, function andstructure of photographs in high school biology textbooks,Journal of Research in Science Teaching, 40, 2003, pp. 1089–1114.
46. E. Wiebe and L. Annetta, Influences on visual attentionaldistribution in multimedia instruction, Journal of Educa-tional Multimedia and Hypermedia, 17, 2008, pp. 259–277.
47. M. Alley, The Craft of Scientific Presentations, 2nd edn,Spring-Verlag, New York, 2013.
48. CliffAtkinson,BeyondBulletPoints:UsingMicrosoftPower-Point to Create Presentations That Inform, Motivate, andInspire, Microsoft Press, Redmond, WA, 2005.
49. M. Alley, M.M. Schreiber, K. Ramsdell and J. Muffo, Howthe design of headlines in presentation slides affects audienceretention, Technical Communication, 53 (2), 2006, pp. 225–234.
50. M. Alley, M. M. Schreiber, E. Diesel, K. Ramsdell and M.Borrego, Increased student learning and attendance inresources geology through the combination of sentence-
headline slides and active learning measures. Journal ofGeoscience Education, 55(1), 2007, pp. 83–89.
51. R. E.Mayer, E.Griffith, I. T.N. Jurkowitz andD.Rothman,Increased interestingness of extraneous details in a multi-media science presentation leads to decreased learning,Journal of Experimental Psychology: Applied, 14, 2008,pp. 329–339.
52. J. M. Tangen,M. D. Constable, E. Durrant, C. Teeter, B. R.Beston and J. A. Kim, The role of interest and images inslideware presentations, Computers and Education, 56, 2010,pp. 865–872.
53. N. Issa, M. Schuller, S. SantacaterinaM. Shapiro, E. Wang,R. E.Mayer andD. A. Darosa, Applying multimedia designprinciples enhances learning in medical education, MedicalEducation, 45(8), 2011, pp. 818–26.
54. P. Ayers, Using subjective measures to detect variations ofintrinsic cognitive load within problems, Learning andInstruction, 16, 2006, pp. 389–400.
55. K. DeLeeuw and R. E. Mayer, A comparison of threemeasures of cognitive load: Evidence for separable measuresof intrinsic, extraneous and germane cognitive load, Journalof Educational Psychology, 100, 2008, pp. 223–234.
56. R. E. Mayer, A. Mathias and K. Wetzell, Fostering under-standing of multimedia messages through pre-training: Evi-dence for a two-stage theory of mental model construction,Journal of Experimental Psychology: Applied, 8, 2002,pp. 147–154.
57. R. E.Mayer, R.Moreno,M. Boire, and S. Vagge,Maximiz-ing constructivist learning frommultimedia communicationsby minimizing cognitive load, Journal of Educational Psy-chology, 91, 1999, pp. 638–643.
Appendix
Essay scoring rubric
Steps of the MRI process are numbered and in italics. The maximum total score was 15 points.
Superconducting magnets produce a magnetic field in a particular x, y, z direction (2 points). Radio-frequency transceiver transmits rf waves to body receives or detects rf waves from body (3.5 points). After
magnets are turned on, the spins of atoms align with magnetic field (1 point). WhenRF transceiver emits energy,
some of the hydrogen atoms move to a higher energy state (2 points). The spins of these atoms fall out of
alignment with themagnetic field (0.5 points).Hydrogen is targeted because the body ismostly (55%)water and
each watermolecule has two hydrogen atoms (1.5 points).When the transceiver stops emitting radio waves, the
magnetic field realigns the spins of the unaligned hydrogen atoms and the atoms return to a lower energy state
(1.5 points). In returning to a lower energy, the atoms release energy in the form of a radio wave (0.5 points).
Different types of tissue emit different frequencies. These frequencies depend, in part, on the density ofhydrogen in the tissue (1.5 points). TheMRI machine takes these waves and uses a mathematical formulation
called a Fourier transform to create an image (1.0 points). Each scan produces a thin image or slice. The
scanning process is repeated to create additional slices, which are compiled into a 3-D imageormap (1.0 points).
Michael Alley is an associate professor of engineering communication at Pennsylvania State University. He is the author
ofThe Craft of Scientific Presentations (2nd edn, Springer, 2013). His professional presentation workshops have been held
around the world. Sites include the European Space Agency, Google, Harvard Medical School, MIT, Sandia National
Laboratories, Shanghai Jiao Tong University, and Simula Research Laboratory (Norway). Alley’s research focuses on
how engineers and scientists can communicate their work more effectively.
Joanna K. Garner is a research associate professor at The Center for Educational Partnerships, OldDominionUniversity.
Her research andoutreach activities focus onways inwhich theoretical principles in educational psychology canbe applied
to solve real-world problems in teaching and learning.
How the Design of Presentation Slides Affects Audience Comprehension 1579