how tax scams are robbing poor countries of life-saving
TRANSCRIPT

making a killingHow tax scams are robbing poor countries of life-saving healthcare
Save the Children works in more than 120 countries. We save children’s lives. We fight for their rights. We help them fulfil their potential.
Published bySave the Children 1 St John’s LaneLondon EC1M 4ARUK+44 (0)20 7012 6400savethechildren.org.uk
First published 2015
© The Save the Children Fund 2015
The Save the Children Fund is a charity registered in England and Wales (213890) and Scotland (SC039570). Registered Company No. 178159
This publication is copyright, but may be reproduced by any method without fee or prior permission for teaching purposes, but not for resale. For copying in any other circumstances, prior written permission must be obtained from the publisher, and a fee may be payable.
Typeset by Grasshopper Design Company
AcknowledgementsThis paper was written by Claire O’Meara and Luisa Hanna, with Dimitri Gugushvili (Save the Children UK). The authors would like to thank Jonathan Glennie, Faiza Shaheen and Simon Wright for contributions to the report. We are grateful for comments and inputs received from colleagues in Save the Children in particular Jose Manuel Roche, Alexis le Nestour, Lara Brearley, Alice Klein, Annabel Taylor, Catharina Bu, Bob Libert Muchabaiwa, Irene Dotterud, Ulrika Cilliers, Lene Steffen, Chantal Baumgarten, Zaddock Okeno, Jasminka Milovanovic and Judas Massingue. For support with production we would like to thank Lucia Cizmaziova, Ravi Wickremasinghe and Sue Macpherson and for graphics, Gareth Royle. Thanks also to our external reviewers for their invaluable advice and comments – Alex Cobham (Tax Justice Network), Tom Cardamone (Global Financial Integrity) and David McNair (ONE Campaign).
Front cover: Two year old Fadilatu has a fever; his mother Sale Camara has just brought him to a clinic in Pehala, Sierra Leone, where a rapid diagnostic test will determine that he has malaria. (Photo: William Daniels/Panos)

contents
The story in numbers: how tax scams cost lives 2
Executive summary 4
1 The context: sustainable health financing undermined by tax scams 6
2 The problem: how do tax scams work? And how much is being lost? 8
What is trade misinvoicing? 9 Trade misinvoicing: a story of tax evasion 10 Global tax losses on a massive scale 12
3 Spotlight on Africa: what could all this money pay for? 14
Kenya: $435 million a year 15 Mozambique: $187 million a year 16
4 The solution: matching words with action 17
1. Make progress measurable 17 2. Make information public 17 3. Make decisions inclusive 19 4. Make local action possible 19
5 Making 2015 a year to remember: summary of recommendations 21
For the international community 21 For national governments 21
Appendix: Methodology 22
Endnotes 26

2
tHe story in numbers: How tax scams cost lives
$86A minimum of $86 per person is required to deliver essential health services.
Only 16 out of 75 countries with worst maternal and newborn health outcomes spend this much.
$435 billion$435 billion is lost due to ‘trade misinvoicing’ across the 75 countries where most of the world’s child and maternal mortality occurs.
We estimate that this results in tax losses to these
countries of $78 billion.
$15 billion$15 billion is lost in tax revenue in sub-Saharan Africa from trade misinvoicing.
That’s equivalent to the cost of 1.8 million health workers.
THE GLOBAL PICTURE
FOCUS ON AFRICA
3
TH
E STO
Ry IN
NU
MB
ERS: H
OW
TAx
SCA
MS C
OST
LIvES
KENyA
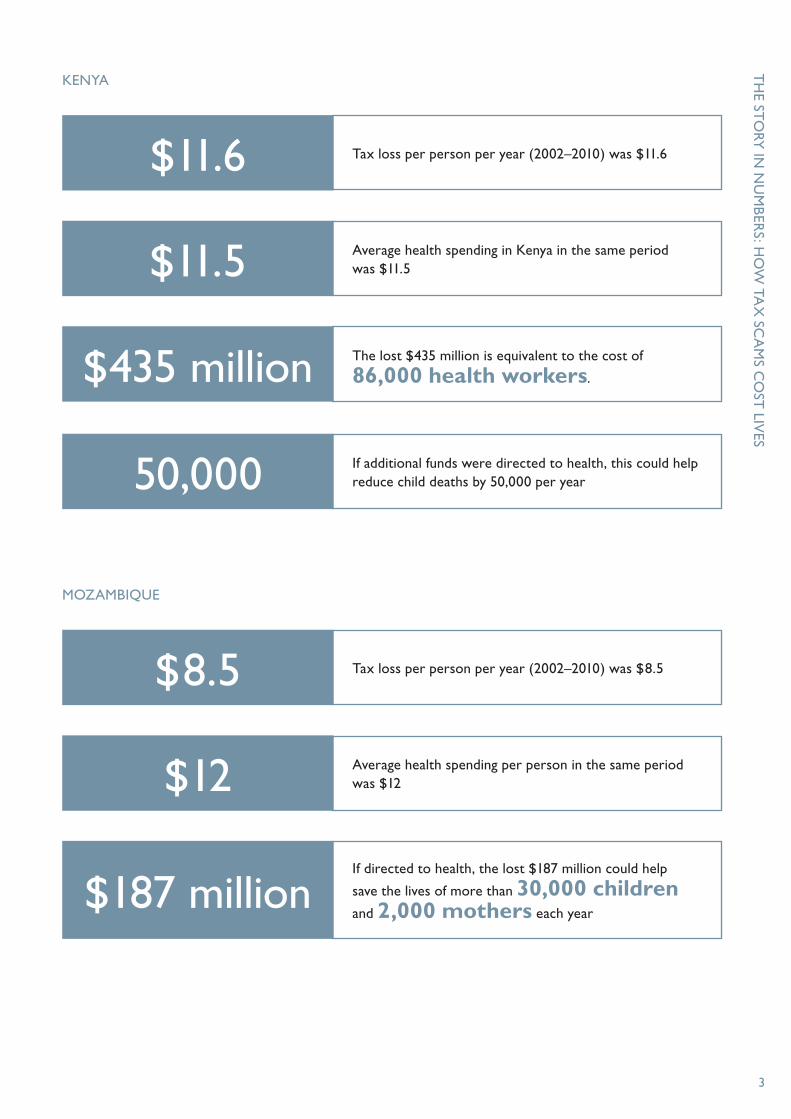
$11.6 Tax loss per person per year (2002–2010) was $11.6
$11.5 Average health spending in Kenya in the same period was $11.5
$435 million The lost $435 million is equivalent to the cost of
86,000 health workers.
50,000 If additional funds were directed to health, this could help reduce child deaths by 50,000 per year
MOZAMBIqUE
$8.5 Tax loss per person per year (2002–2010) was $8.5
$12 Average health spending per person in the same period was $12
$187 millionIf directed to health, the lost $187 million could help
save the lives of more than 30,000 children
and 2,000 mothers each year

4
2015 presents a once-in-a-generation opportunity for global development. We have the chance to create a world where every child has the chance to survive and to fulfil their potential.
This September world leaders will come together in New york to acclaim the new Sustainable Development Goals (SDGs) and their historic ambition to ‘finish the job’ of the Millenium Development Goals in providing healthcare and education to all children.
But without dramatic increases in funding for public services, those goals will be nothing but an empty promise. The stakes could hardly be higher. In 2013, 6.3 million children died before their fifth birthday, most from preventable causes. A total of 58 million children are out of school.
Failure to make the most of the opportunity of 2015 would threaten the survival and hopes of millions of children for years to come.
Where then should the money for the new development goals come from?
Most of the money will have to be found by developing countries themselves. Low-income countries will need to substantially expand the public funds available to spend on essential services, supported in some cases by aid from donor countries. Taxes are an essential part of the development finance equation, with corporate tax being a critical element for developing countries.
But some of the world’s poorest countries are losing millions of potential tax revenue each year as a result of illicit financial flows (IFFs) and the tax dodging schemes associated with them. A web of complex and shadowy tax dealings is robbing developing countries of revenue they need to spend on essential public services.
In this report we analyse one part of the web of illicit financial flows, the ‘misinvoicing’ of international
trade – a way of hiding the true value of imports and exports, shifting profits and dodging taxes. The figures are staggering. Save the Children estimates that in the 75 ‘Countdown to 2015 countries’ where most of the world’s child and maternal mortality occurs, lost tax due to trade misinvoicing amounts to roughly $78 billion a year. In very poor countries, the sums being lost are comparable to the amounts being spent on health budgets – lost money that could boost total budgets and pay for desperately needed doctors, nurses, clinics, hospitals and medicines, providing the basic minimum of decent healthcare to mothers and children.
In sub-Saharan Africa, the amount being lost is estimated to be $15 billion, equivalent to the cost of 1.8 million health-workers. The country studies in this report show the human cost of these lost tax revenues. In Kenya, $435 million of tax lost annually is enough to cover the shortage of 86,000 health workers identified in the country’s national health plan and bring child mortality down, resulting in more than 50,000 lives saved each year
In Mozambique, $187 million of potential tax lost annually is equivalent to 10% of government revenue. This money could fill the financial gap in its national health plan, enabling major improvements to maternal and newborn health services that could save the lives of more than 30,000 children and 2,000 mothers each year.
These countries, and many others, need to respond to this substantial loss of public funds by prioritising the problem of IFFs and building capacity in relevant institutions. Clamping down on IFFs could raise significant additional resources for national public spending.
But national governments cannot address the complex problem of illicit financial flows on their own. International coordination is required to address the failings of the global tax system which encourage these schemes to proliferate. That’s why Save the Children is calling on all countries
executive summary
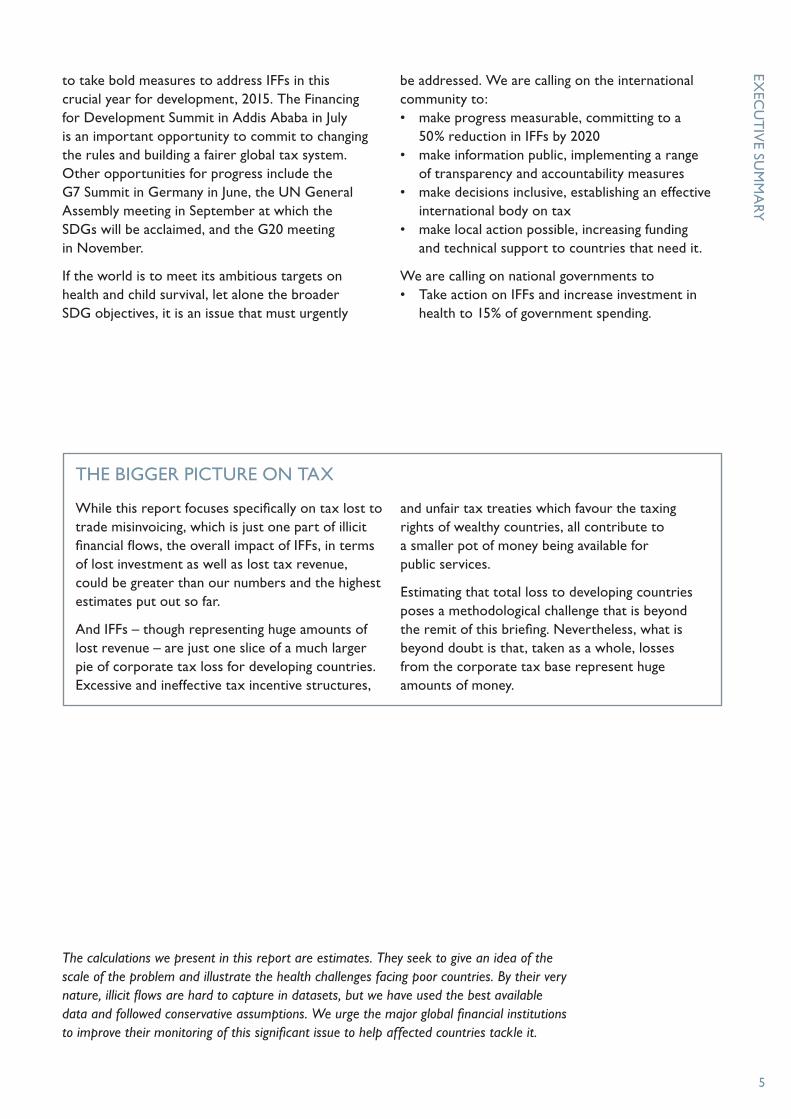
to take bold measures to address IFFs in this crucial year for development, 2015. The Financing for Development Summit in Addis Ababa in July is an important opportunity to commit to changing the rules and building a fairer global tax system. Other opportunities for progress include the G7 Summit in Germany in June, the UN General Assembly meeting in September at which the SDGs will be acclaimed, and the G20 meeting in November.
If the world is to meet its ambitious targets on health and child survival, let alone the broader SDG objectives, it is an issue that must urgently
be addressed. We are calling on the international community to: • makeprogressmeasurable,committingtoa
50% reduction in IFFs by 2020• makeinformationpublic,implementingarange
of transparency and accountability measures • makedecisionsinclusive,establishinganeffective
international body on tax • makelocalactionpossible,increasingfunding
and technical support to countries that need it.
We are calling on national governments to• TakeactiononIFFsandincreaseinvestmentin
health to 15% of government spending.
THE BIGGER PICTURE ON TAx
While this report focuses specifically on tax lost to trade misinvoicing, which is just one part of illicit financial flows, the overall impact of IFFs, in terms of lost investment as well as lost tax revenue, could be greater than our numbers and the highest estimates put out so far.
And IFFs – though representing huge amounts of lost revenue – are just one slice of a much larger pie of corporate tax loss for developing countries. Excessive and ineffective tax incentive structures,
and unfair tax treaties which favour the taxing rights of wealthy countries, all contribute to a smaller pot of money being available for public services.
Estimating that total loss to developing countries poses a methodological challenge that is beyond the remit of this briefing. Nevertheless, what is beyond doubt is that, taken as a whole, losses from the corporate tax base represent huge amounts of money.
5
The calculations we present in this report are estimates. They seek to give an idea of the scale of the problem and illustrate the health challenges facing poor countries. By their very nature, illicit flows are hard to capture in datasets, but we have used the best available data and followed conservative assumptions. We urge the major global financial institutions to improve their monitoring of this significant issue to help affected countries tackle it.
ExEC
UT
IvE SU
MM
ARy

6
2015 could be a momentous year for global development. When world leaders come together in September in New york, they have the opportunity to set the world on course to end extreme poverty and protect the future of the planet as they acclaim the new Sustainable Development Goals (SDGs). These new global goals will seek to finish the job started by the Millennium Development Goals (MDGs), ensuring that no one is left behind by global progress and that all children, wherever they live, have access to basic healthcare and education.
Despite important progress in many countries in the last 15 years, far too many children are still dying before their fifth birthday from perfectly preventable causes. As Save the Children showed in our report A Wake Up Call earlier this year, in far too many countries effective health services are only available to those with the cash to buy them. The poor are forced to rely on under-resourced public health services, spend desperately needed savings or simply go without.
yet health is a human right. And in the new SDG era, countries are expected to commit to universal health coverage, meaning that governments accept the obligation to make sure their people can realise this right. There is now a growing consensus that health spending needs to be publicly funded1 to ensure fair access to quality services for all, without causing financial hardship.2
It is estimated that low-income countries should spend a minimum of $86 per person on health to deliver an essential package of services.3 But in 2013 (the latest year for which internationally comparable data is available4) only 16 of the 75 so-called ‘Countdown to 2015’ countries – the
countries where more than 95% of all maternal and child deaths occur – met this target.5
Not only is investing in healthcare crucial to deliver a fundamental human right, it also makes economic sense. For every dollar invested in health in low-income countries, there is estimated to be a 20-fold return in benefits to the economy, as healthy children study better and healthy adults are more productive.6
Given this clear moral mandate and economic evidence to back it up, the challenge now is to deepen the evolution of global health financing. While previous eras have focused on the importance of international aid, we now need to emphasise national government expenditure as the most important and most accountable source of funding for basic healthcare. For some countries, this will be supplemented by crucial foreign aid – targeted at the poorest countries and poorest people – but that should not take pressure off the need to expand domestic tax and revenue opportunities.
Money generated through tax collection is the most sustainable and reliable source of funding for services such as health.7 Recent research into the effects of tax on health spending found that tax revenue is positively associated with progress towards universal health coverage.8 The often-observed association of GDP with health spending is largely mediated by greater tax revenues, increasing public, but not necessarily private, health spending. A strong tax system also bolsters good governance and increases accountability of governments to their citizens, helping to build stronger institutions to deliver these services in the long term.9 To see benefits of social spending, particularly on health, tax-based funding needs to be combined with the political will to spend it equitably.
1 The conTexT: SuSTainable healTh financing undermined by Tax ScamS
7
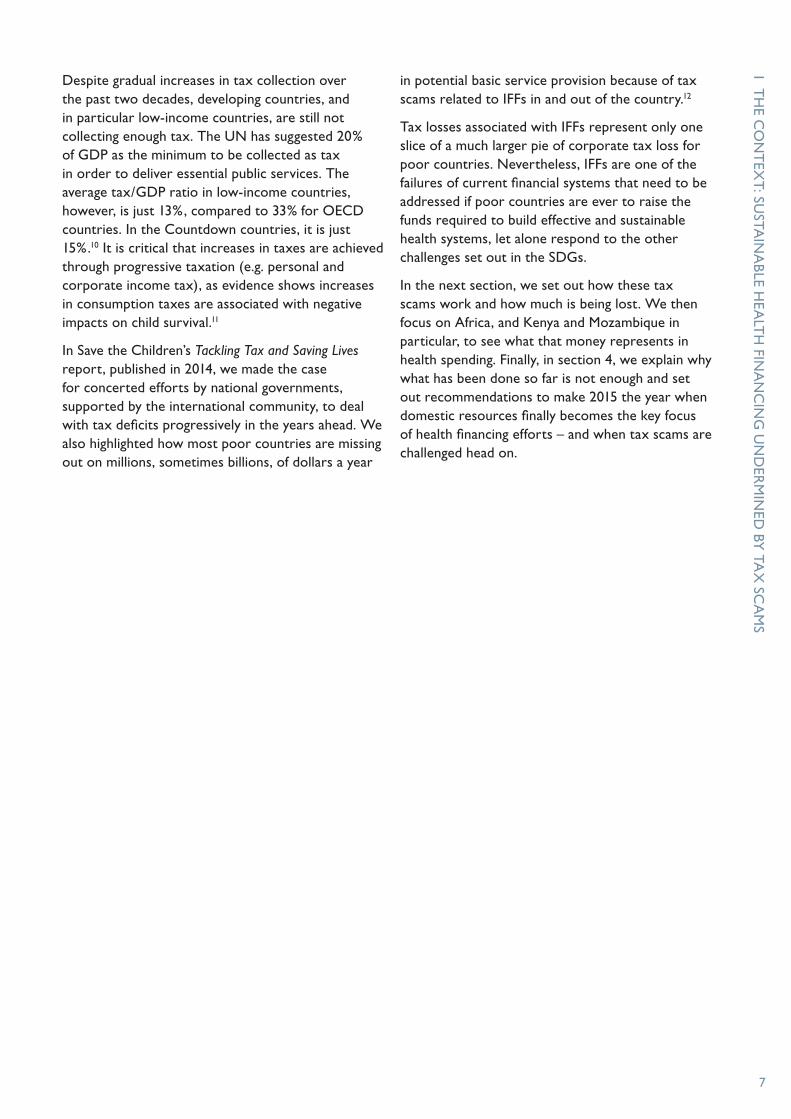
Despite gradual increases in tax collection over the past two decades, developing countries, and in particular low-income countries, are still not collecting enough tax. The UN has suggested 20% of GDP as the minimum to be collected as tax in order to deliver essential public services. The average tax/GDP ratio in low-income countries, however, is just 13%, compared to 33% for OECD countries. In the Countdown countries, it is just 15%.10 It is critical that increases in taxes are achieved through progressive taxation (e.g. personal and corporate income tax), as evidence shows increases in consumption taxes are associated with negative impacts on child survival.11
In Save the Children’s Tackling Tax and Saving Lives report, published in 2014, we made the case for concerted efforts by national governments, supported by the international community, to deal with tax deficits progressively in the years ahead. We also highlighted how most poor countries are missing out on millions, sometimes billions, of dollars a year
in potential basic service provision because of tax scams related to IFFs in and out of the country.12
Tax losses associated with IFFs represent only one slice of a much larger pie of corporate tax loss for poor countries. Nevertheless, IFFs are one of the failures of current financial systems that need to be addressed if poor countries are ever to raise the funds required to build effective and sustainable health systems, let alone respond to the other challenges set out in the SDGs.
In the next section, we set out how these tax scams work and how much is being lost. We then focus on Africa, and Kenya and Mozambique in particular, to see what that money represents in health spending. Finally, in section 4, we explain why what has been done so far is not enough and set out recommendations to make 2015 the year when domestic resources finally becomes the key focus of health financing efforts – and when tax scams are challenged head on.
1 TH
E CO
NT
ExT
: SUSTA
INA
BLE H
EALT
H FIN
AN
CIN
G U
ND
ERM
INED
By TA
x SC
AM
S

8
Developing countries are more reliant on taxes raised through corporate activity than wealthier countries, where personal income tax fills a much more substantial part of the tax base.13 And corporate tax remains vulnerable to large-scale tax scams.
There are a range of ways that countries lose out on corporate tax revenue, including widespread application of ineffective and excessive tax incentives, aggressive tax avoidance and profit shifting by multinational enterprises (MNEs), and tax treaties weighted in favour of wealthy countries that encourage ‘treaty shopping’ by MNEs.14 Attempts to estimate the revenue lost across these different areas have met with varying success, due to methodological complexity and lack of data, but have the potential to be enormous. In this report, we focus on a specific problem that has become a growing area of concern over the last decade and has the most extensively compiled data – ‘illicit financial flows’ (IFFs).
IFFs are “illegal movements of money or capital from one country to another”.15 These flows are considered to be illicit when the funds are illegally earned, transferred, and/or used. IFFs can be broadly generated in three ways:• Commercial practices – manipulation of trade
transactions for the purposes of disguising wealth and profits, evading taxes, customs duties and levies. This covers ‘trade misinvoicing’ (see below).
• Criminal activity – stemming from the drugs trade, human trafficking, illegal arms dealing and smuggling of contraband.
• Corruption – the proceeds of bribery and theft by government officials.16
Global Financial Integrity (GFI), estimates that nearly $1 trillion ($991 billion) was lost by developing countries to IFFs in 2012.17 There are significant challenges in producing precise figures for IFFs but despite a decade of widespread agreement that IFFs pose a significant problem within global financial systems, necessary action by institutions such as the IMF or World Bank to develop more accurate ways to capture and monitor them has yet to emerge. These numbers are acknowledged in this report as being ballpark figures that help to establish the scale of the problem, necessary to compel global leaders into action.
This illicit flight of money across borders has a range of negative effects on economies. Other research into the issue has suggested that IFFs represent huge sums of lost money that could otherwise be invested or spent locally, generating profits and strengthening the economy, significantly contributing to poverty reduction.18
IFFs also undermine governance and the rule of law by fuelling corrupt behaviour and providing funds for other illegal activities.19 For instance in the Philippines it has been found that secret and illicit inflows not only cheat the government out of customs duties, their proceeds are used to fund underground activities rather than entering the main economy, leading to a further deterioration in governance.20
One of the most direct impact of IFFs on national tax revenue is that that when money flows across borders secretly it cannot be taxed. If properly declared, such monies would be taxable through income taxes, customs duties or trade tariffs, thus building national coffers for public service provision. That is why clamping down on illicit flows is so important for tax revenue.
2 The problem: how do Tax ScamS work? and how much iS being loST?

2 TH
E PRO
BLEM
: HO
W D
O TA
x SC
AM
S WO
RK
? AN
D H
OW
MU
CH
IS BEIN
G LO
ST?
9
Clearly not all IFFs, if caught, would be taxable. The second and third components – criminal activity (such as drug trafficking and money laundering) and corruption – need to be stopped, not taxed. But the commercial element, is considered to be by far the largest, and if detected or deterred would be taxable.21 This paper focuses on trade misinvoicing, the largest component of IFFs.
WHAT IS TRADE MISINvOICING?
Trade misinvoicing is the practice of manipulating invoices for the export or import of goods or services to either over or understate their value (see Table 1). This is done in order to hide the value of products, enabling the secret shifting of profits in and out of countries and the dodging of associated taxes.22 For tangible goods such as wood or food, this can be achieved by falsely stating the quality, quantity or price of the goods in question. An example of trade misinvoicing presented to the High Level Panel report on IFFs for the African Union revealed that in Mozambique shrimp is regularly declared as being lower quality than it actually is, thus reducing its
declared value and enabling producers to shift the profit elsewhere.23
A range of factors create fertile conditions for trade misinvoicing, and IFFs more widely. A lack of effective legislation and institutions at a national level that are capable of deterring, detecting and responding to illicit practices allows them to continue unabated. Corruption of officials at all levels facilitates these illicit transactions and can contribute to apathy or resistance to addressing the problem at the source.24
While there is much that could be done to clamp down on these practices on a country-by-country basis, flaws and irregularities in the international financial system also have a critical role to play, which, if addressed systematically, could far exceed individual efforts of affected countries acting alone.25 Secrecy jurisdictions and off-shore hubs (or tax havens), an integral component of the international financial system, are central to facilitating and hiding illicit activities by hosting thousands of shell companies, which cover the tracks of money trails and disguise those ultimately benefiting from illicit flows, while also offering tax rates that make profit shifting, profitable.26
TABLE 1 THE TAx INCENTIvES FOR UNDER- AND OvER-INvOICING OF ExPORTS AND IMPORTS27
Under-invoicing (under-valuing products by falsely declaring reduced quantity, quality or unit cost of items)
Over-invoicing (over-valuing products by falsely declaring increased quantity, quality or unit cost of items)
Exports Under-invoicing exports makes it possible to shift profits out of a country, most likely to a low-tax jurisdiction. Doing this helps reduce declarable profit in the country and evade associated income taxes on these profits. It can also reduce the cost of local tariffs due on items being exported.
Over-invoicing on exports is not used to evade payment of tax, but to falsely qualify for or increase receipt of export subsidies or export-related tax credits.
Imports Under-invoicing imports is used to evade full payment of customs duties and value added taxes (vAT) on imported goods.
Over invoicing imports can be used to lower declarable profit on products by artificially inflating input costs. It can also be used to secretly shift profits into another country – possibly repatriating profits – when they would otherwise be subject to tax.

MA
KiN
G A
KiL
LiN
G
10
Whi�y Fish, however, is looking to evade paying export taxes and also wants to reduce its income tax by reducing recorded profits.
It therefore produces an invoice that records the shrimps as being of lower quality and value.
Customs in country A receives the dodgy invoice, but doesn’t have the time or resources to check the details properly, and the dodgy invoice passes unnoticed.
The dodgy invoice is sent to a third company, Shady Shell, which is based in a tax haven (country C) and secretly owned by Whi�y Fish.
This tax haven has a very low tax rate and lots of secrecy regulations that protect Shady Shell from revealing who really owns it and its accounting practices.
We Love Shrimp receives the shrimp and sends the full amount of money owed back to Shady Shell.
Shady Shell receives this amount, sends $30,000 to Whi�y Fish and puts the other $20,000 in an o�shore account belonging to Whi�y Fish, where it is protected from paying tax.
Whi�y Fish receives and records $30,000 in their accounts and pays their much reduced taxes.
The owners can then access their untaxed $20,000 profit, hidden in the o�shore account, any time they want.
WE SHRIMP
CUSTOMS
Shady Shell receives the invoice from Whi�y Fish, and then produces and sends a new invoice for the full value agreed to by We Love Shrimp.
$30,000goes to Wi�y Fish
$20,000goes to Wi�y Fish’s
o�shore account
False invoice
Invoice forthe full amount
1
3
2
4
5 6
7
8
Note: This is just one way that trade misinvoicing can work.The amounts used are purely illustrative.
The Whi�y Fish company in country A has a boatful of top-quality fresh shrimps to sell.
Import company We Love Shrimp, based in country B, agrees to purchase these shrimps for $50,000.
TRADE MISINVOICING: A STORY OF TAX EVASION
BANK
$30,000
1
INVOICE
$50,000
2
INVOICE
TRADE MISINvOICING: A STORy OF TAx EvASION

2 TH
E PRO
BLEM
: HO
W D
O TA
x SC
AM
S WO
RK
? AN
D H
OW
MU
CH
IS BEIN
G LO
ST?
11
Whi�y Fish, however, is looking to evade paying export taxes and also wants to reduce its income tax by reducing recorded profits.
It therefore produces an invoice that records the shrimps as being of lower quality and value.
Customs in country A receives the dodgy invoice, but doesn’t have the time or resources to check the details properly, and the dodgy invoice passes unnoticed.
The dodgy invoice is sent to a third company, Shady Shell, which is based in a tax haven (country C) and secretly owned by Whi�y Fish.
This tax haven has a very low tax rate and lots of secrecy regulations that protect Shady Shell from revealing who really owns it and its accounting practices.
We Love Shrimp receives the shrimp and sends the full amount of money owed back to Shady Shell.
Shady Shell receives this amount, sends $30,000 to Whi�y Fish and puts the other $20,000 in an o�shore account belonging to Whi�y Fish, where it is protected from paying tax.
Whi�y Fish receives and records $30,000 in their accounts and pays their much reduced taxes.
The owners can then access their untaxed $20,000 profit, hidden in the o�shore account, any time they want.
WE SHRIMP
CUSTOMS
Shady Shell receives the invoice from Whi�y Fish, and then produces and sends a new invoice for the full value agreed to by We Love Shrimp.
$30,000goes to Wi�y Fish
$20,000goes to Wi�y Fish’s
o�shore account
False invoice
Invoice forthe full amount
1
3
2
4
5 6
7
8
Note: This is just one way that trade misinvoicing can work.The amounts used are purely illustrative.
The Whi�y Fish company in country A has a boatful of top-quality fresh shrimps to sell.
Import company We Love Shrimp, based in country B, agrees to purchase these shrimps for $50,000.
TRADE MISINVOICING: A STORY OF TAX EVASION
BANK
$30,000
1
INVOICE
$50,000
2
INVOICE

MA
KiN
G A
KiL
LiN
G
12
GLOBAL TAx LOSSES ON A MASSIvE SCALE
By its very nature, it is hard to put a firm number on tax being lost as a result of trade misinvoicing. To generate our figures, we analysed data on trade misinvoicing for 147 developing countries from 2002–1228 and estimated the potential tax loss based on country-specific tax rates. We have erred on the side of caution and consider our figures to be conservative estimates. (See Appendix for data sources, methodology and assumptions.)
We estimate that in 2012, across the 75 Countdown countries with the highest burden of child and maternal mortality, the potential tax lost as a result of trade misinvoicing is around $78 billion. This potential tax loss represents roughly 1% of these countries’ combined GDP.
While this group of Countdown countries includes rapidly developing economies, such as China, which make up a large proportion of where trade misinvoicing takes place, it may be an even bigger problem in relative terms for sub-Saharan African countries, considered in more detail in the next
section. While trade misinvoicing is estimated to constitute roughly 73% of total IFFs from all developing countries, it represents up to 86% of IFFs lost from sub-Saharan Africa (see Table 2). Tax losses associated with trade misinvoicing are estimated at about 1% of GDP for all developing countries, but 1.25% of sub-Saharan Africa’s GDP – a huge loss from the world’s poorest region.
The figures we present here, albeit conservative estimates, are hugely concerning. According to GFI, the figures are unlikely to capture mispricing practices by MNEs. These companies are also known to engage widely in practices – known as ‘abusive transfer pricing’ – intended to dodge the taxes they owe by wrongly pricing goods, services, and intangible assets traded between parts of the same company located in different countries (see Box 1). According to OECD research, the high profile role of MNEs and the well-known nature of these abusive practices in the economies of many developing countries can have the further negative effect of undermining the legitimacy of local institutions and discouraging voluntary compliance of tax rules by other taxpayers.29
TABLE 2 POTENTIAL TAx LOSS FROM TRADE MISINvOICING, ANNUAL AvERAGE 2002–10
Country group Illicit financial flows30 Potential tax loss31
IFF loss per year ($)
Trade misinvoicing
Potential tax losses associated ($)
% of GDP
All developing countries $991 bn $724 bn (73%) $113 bn 1%
Countdown countries $573 bn $435 bn (76%) $78 bn 1%
Sub-Saharan Africa $69 bn $59 bn (86%) $15 bn 1.25%

2 TH
E PRO
BLEM
: HO
W D
O TA
x SC
AM
S WO
RK
? AN
D H
OW
MU
CH
IS BEIN
G LO
ST?
13
BOx 1 – WHAT IS ABUSIvE TRANSFER PRICING?
Abusive transfer pricing, a practice specific to MNEs, shares many similarities with trade misinvoicing between companies as it involves manipulations of prices in order to shift profits and avoid taxes. Unlike trade between separate companies, internal trading is not subject to external market forces. Prices are supposed to be set based on the ‘arm’s length principle’, a system designed to determine fair market value when pricing goods exchanged between different parts of the same company.32 This system is extremely open to abuse, particularly where services and intangibles are involved for which there is little to benchmark values against, and in countries which lack easily accessible up-to-date data on values of goods.33
This problem is not limited to poor countries, with many developed economies responding to the problem by putting additional anti-avoidance measures in place that aim to deter, detect and respond to such abuses. However, the reliance of the system on the capacity of governments to audit
effectively and challenge prices set by companies poses a significantly greater problem for developing countries. In India, a country actively trying to address the problem of abusive transfer pricing, it was estimated that $12.6bn was lost in tax revenue in 2011–12 as a result of these practices with more than 3,500 cases brought against MNEs currently in litigation.34 According to the recent High Level Panel Report on IFFs in Africa, only three countries there have a transfer pricing unit within their internal revenue services, leaving many African countries particularly vulnerable to abuse.35 The report also highlights that natural resources, key to many African countries’ economies, are considered to be at particularly high risk of being mispriced. This is in large part due to the lack of capacity of national governments to independently verify what is being extracted compared to what is being exported, leaving them forced to rely instead on company reporting, and less able to spot irregularities where they arise.36

The High Level Panel report revealed the worsening trend of IFFs in sub-Saharan Africa. It concluded that “IFFs from Africa are large and increasing” and that the problem is significant enough to require “urgent and coordinated action to curb these illicit outflows”.37
According to the latest data, $69bn was lost in illicit outflows in 2012, equivalent to 6.5% of the region’s GDP, of which $59bn was due to trade misinvoicing.38 This reflects a potential tax loss of $15bn per annum, representing about 1.25% of GDP. While this potential tax revenue would not automatically be spent on health, it is clear that clamping down on IFFs, and particularly trade misinvoicing, could translate into significant funding being available for African countries.
It has been estimated that countries should spend at least 5% of GDP to see significant improvements in
health,39 but in sub-Saharan Africa health spending represented on average 2.5% of GDP in 2013.40 Among many other priorities, sub-Saharan Africa faces severe shortages of health workers. As an illustration, based on data on health worker salaries (doctors, nurses, midwives) from a selection of countries, $15 billion could pay the salaries of almost 1.8 million additional health workers on the continent.41
Looking in more detail at the situation in five African countries (see table 3), the serious shortages in public funding for health could be substantially addressed by tackling tax losses associated with trade misinvoicing.42 In four of the five countries studied, tax loss due to trade misinvoicing as a share of government revenue over a ten-year period (2002–11) was roughly equivalent to the whole health budget (about 10% of the overall budget). In other words, if this lost tax could be recouped and spent as a ‘windfall’ for health, health budgets would be doubled.
3 SpoTlighT on africa: whaT could all ThiS money pay for?
14
TABLE 3 COMPARING POTENTIAL TAx LOSS DUE TO TRADE MISINvOICING AND HEALTH SPENDING
Country Total IFFs – 2002–2011 (million $)
Average annual IFFs 2002–2011 (million $)
Cumulative tax loss during 2002–2011 (million $)
Average tax loss due to trade misinvoicing 2002–2011 (million $)
Tax loss as a percentage of government revenue (average 2002–2011)
Government health spending as a percentage of government expenditure (average 2002–2011)
Annual tax loss per person (average 2002–2011, $ per capita)
Government spending on health (average 2002–2011, $ per capita)
Ghana 14,393 1,439 3,860 386 11.0% 13.3% 17.3 31.3
Kenya 13,576 1,508 3,920 435 8.3% 7.1% 11.6 11.5
Mozambique 5,266 585 1,683 187 10.4% 12.8% 8.5 12.0
Tanzania 18,725 1,873 2,480 248 7.4% 16.4% 6.1 12.8
Uganda 8,844 884 2,430 243 12.5% 12.6% 8.0 11.5
Kenya and Mozambique data only available for nine years (2002–2010). All others for a ten year period
IFF and tax revenue loss data – Global Financial Integrities May 2014
Population data, average for comparable period, World Bank Development Indicators accessed 22 April 2015
Health expenditure data, average for comparable period, WHO Global Health Expenditure Database accessed 7 May 2015
3 SPOT
LIGH
T O
N A
FRIC
A: W
HA
T C
OU
LD A
LL TH
IS MO
NEy
PAy
FOR
?
15
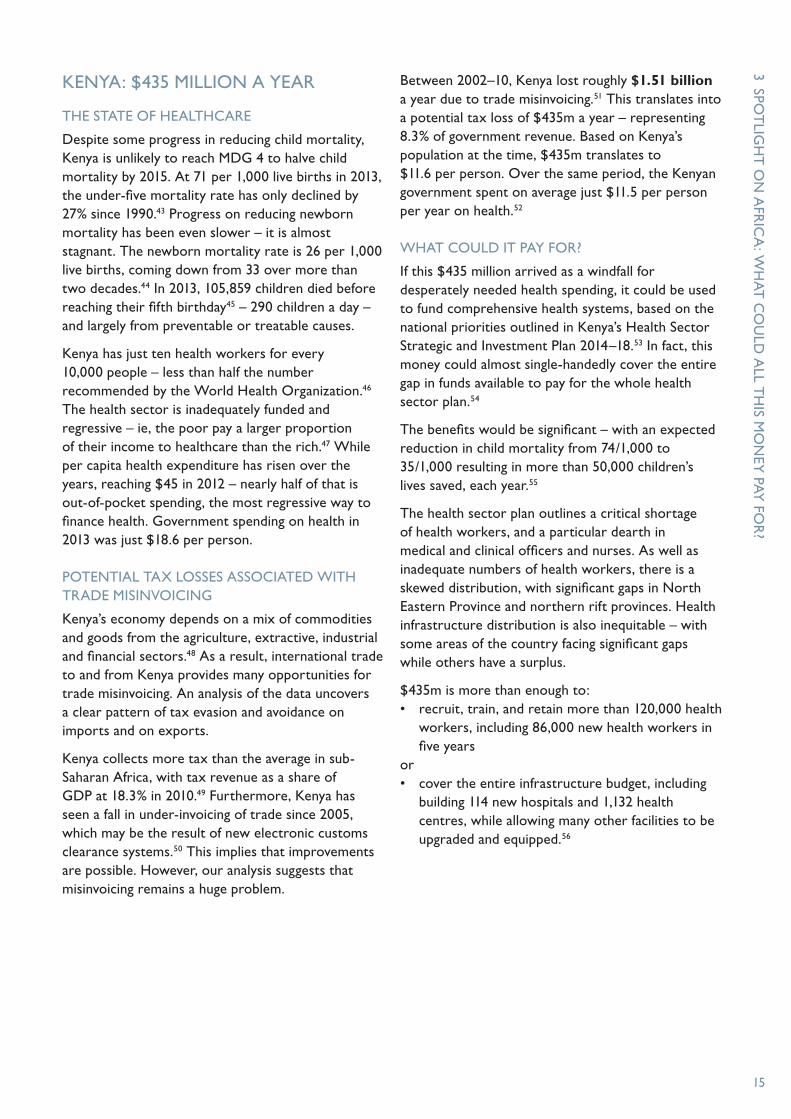
KENyA: $435 MILLION A yEAR
THE STATE OF HEALTHCARE
Despite some progress in reducing child mortality, Kenya is unlikely to reach MDG 4 to halve child mortality by 2015. At 71 per 1,000 live births in 2013, the under-five mortality rate has only declined by 27% since 1990.43 Progress on reducing newborn mortality has been even slower – it is almost stagnant. The newborn mortality rate is 26 per 1,000 live births, coming down from 33 over more than two decades.44 In 2013, 105,859 children died before reaching their fifth birthday45 – 290 children a day – and largely from preventable or treatable causes.
Kenya has just ten health workers for every 10,000 people – less than half the number recommended by the World Health Organization.46 The health sector is inadequately funded and regressive – ie, the poor pay a larger proportion of their income to healthcare than the rich.47 While per capita health expenditure has risen over the years, reaching $45 in 2012 – nearly half of that is out-of-pocket spending, the most regressive way to finance health. Government spending on health in 2013 was just $18.6 per person.
POTENTIAL TAx LOSSES ASSOCIATED WITH TRADE MISINvOICING
Kenya’s economy depends on a mix of commodities and goods from the agriculture, extractive, industrial and financial sectors.48 As a result, international trade to and from Kenya provides many opportunities for trade misinvoicing. An analysis of the data uncovers a clear pattern of tax evasion and avoidance on imports and on exports.
Kenya collects more tax than the average in sub-Saharan Africa, with tax revenue as a share of GDP at 18.3% in 2010.49 Furthermore, Kenya has seen a fall in under-invoicing of trade since 2005, which may be the result of new electronic customs clearance systems.50 This implies that improvements are possible. However, our analysis suggests that misinvoicing remains a huge problem.
Between 2002–10, Kenya lost roughly $1.51 billion a year due to trade misinvoicing.51 This translates into a potential tax loss of $435m a year – representing 8.3% of government revenue. Based on Kenya’s population at the time, $435m translates to $11.6 per person. Over the same period, the Kenyan government spent on average just $11.5 per person per year on health.52
WHAT COULD IT PAy FOR?
If this $435 million arrived as a windfall for desperately needed health spending, it could be used to fund comprehensive health systems, based on the national priorities outlined in Kenya’s Health Sector Strategic and Investment Plan 2014–18.53 In fact, this money could almost single-handedly cover the entire gap in funds available to pay for the whole health sector plan.54
The benefits would be significant – with an expected reduction in child mortality from 74/1,000 to 35/1,000 resulting in more than 50,000 children’s lives saved, each year.55
The health sector plan outlines a critical shortage of health workers, and a particular dearth in medical and clinical officers and nurses. As well as inadequate numbers of health workers, there is a skewed distribution, with significant gaps in North Eastern Province and northern rift provinces. Health infrastructure distribution is also inequitable – with some areas of the country facing significant gaps while others have a surplus.
$435m is more than enough to:• recruit,train,andretainmorethan120,000health
workers, including 86,000 new health workers in five years
or• covertheentireinfrastructurebudget,including
building 114 new hospitals and 1,132 health centres, while allowing many other facilities to be upgraded and equipped.56

MA
KiN
G A
KiL
LiN
G
16
MOZAMBIqUE: $187 MILLION A yEAR
THE STATE OF HEALTHCARE
Mozambique has made impressive progress in reducing child mortality in recent years, with rates cut by over half since 1990 to 109 under-five deaths per 1,000 live births in 2011. But this is still extremely high, meaning that 82,891 children are still dying each year of preventable causes, including 29,053 in their first month of life. Mozambique is off-track to achieve MDGs 4 and 5 – to cut child and maternal mortality – with efforts to reduce mortality hampered by the HIv/AIDS epidemic. Improvements have been made since the HIv infection rate has stabilised, as coverage of essential health services has increased.57 Malaria remains a leading cause of death of children under five.
Less than half of mothers (45%) living in rural areas have skilled health workers present at birth.58 The current five-year Health Sector Strategic Plan (2014–19) prioritises improving primary healthcare, equity and quality.59
Mozambique’s economy is heavily reliant on services and agriculture, with very variable trade flows (although these drivers of IFFs are shifting as the country becomes more reliant on exports from extractive industries, such as coal and natural gas).60 The economy is growing rapidly – at 7% a year.61 Mozambique has increased its tax revenue significantly in recent years, from just over 12% of GDP in 2005 to 18% in 2010.62 But illicit financial flows are undermining the potency of this fiscal revolution.
Between 2002 and 2010, illicit financial flows in and out of Mozambique due to trade misinvoicing amounted to $5.27 billion over ten years, about $585 million a year, representing an astonishing 9% of GDP (see table 3).63
The potential loss in import tax, vAT and corporate tax revenue to the country are estimated at $187 million a year – less in absolute terms than Kenya, but more significant as a share of the government revenue – at 10.4%, an average of $8.5 per person.64
WHAT COULD IT PAy FOR?
While Mozambique potentially lost an average of $8.5 per person per year from tax lost to trade misinvoicing, health spending over the same period was on average just under $12 per person per year, just 14% of the recommended annual per capita spend. The entire public health programme (maternal and child health services, nutrition, tackling TB, HIv and malaria, school health, and mental health among other areas) is expected to cost $198 million in 2014 – roughly similar to the expected loss from IFFs.65
The impact of delivering Mozambique’s plan would be transformational. It could save the lives of 2,000 mothers each year and reduce under-five mortality by 37% by 2019, saving more than 30,000 children’s lives.• Skilledbirthattendanceisjust45%in
Mozambique’s rural areas (55% nationally). But just $33 million per year is needed to deliver maternal, reproductive, and child health services – increasing birth attendance to 75% in five years.
• Theimmunisationprogramme,at$25millionper year, aims to achieve 90 percent coverage of routine childhood vaccination by 2019, from current levels of 64%.
• Malariaremainsaleadingcauseofdeathforchildren under age five, with weak coverage, quality, and efficiency of malaria control programmes. $55 million per year is needed to provide essential malaria drugs and commodities, reaching 10 million people with malaria treatment, and providing 5 million nets to pregnant women.

17
The figures set out in this report are staggering. The sums being lost in untaxed cross-border flows because of trade misinvoicing are comparable to the amounts currently missing from the health budgets of very poor countries, money needed to provide the basic minimum of decent healthcare to mothers and children and save lives.
While we have focused on tax lost to trade misinvoicing, the overall impact of illicit financial flows, in terms of lost investment as well as lost tax revenue, could be greater than even the highest estimates put out so far. Abusive transfer pricing by multinationals, excessive and ineffective tax incentive structures, and imbalanced tax treaties, which favour the wealthy countries where company headquarters are based, all contribute to a smaller pot of money being available for public services.
These problems are not new to development finance discussions. various practical solutions have been proposed and agreed on at national and international levels, but the gap between rhetoric and action means that too little is being done considering the scale of the problem and the potential rewards for effective action.
Our calls to action below address trade misinvoicing. They also address other critical issues for corporate tax loss by focusing on increasing transparency – making it more difficult to hide illicit transactions and aggressive tax avoidance schemes from public scrutiny.
1. MAKE PROGRESS MEASURABLE
The role of the international community is critical in all aspects of addressing IFFs. The first step to taking this issue as seriously as it merits is to set a clear target for their reduction. In this report we join calls for a reduction of IFFs by 50% worldwide by 2020. This is an ambitious target, but not impossible, and one that is necessary if we are to galvanise the energy required to respond to this problem.
The simple fact that NGOs such as Save the Children have to carry out our own estimates of IFFs and associated tax losses is an indictment on those big financial institutions (such as the World Bank and the International Monetary Fund), which should long since have been collecting data, and establishing baselines for action.
Recommendation: Set a time-bound target for the reduction of overall IFFs. We recommend a 50% reduction of IFFs by 2020. Such a target will not only focus minds and efforts, but also fast-track the issue of better data collection on IFFs by international bodies.
2. MAKE INFORMATION PUBLIC
In order to deter tax scams from occurring it needs to be possible to both detect and respond to them. Three critical measures support this: • public country-by-country reporting – to
help flag discrepancies between economic activity and the tax being paid by companies
• public registers of beneficial ownership – to reveal who is ultimately benefiting and therefore accountable for the practices taking place
• multilateral automatic exchange of information for tax purposes – to enable governments to act by making necessary tax information from other countries available.
See box 2 for further explanation.
4 The SoluTion: maTching wordS wiTh acTion

MA
KiN
G A
KiL
LiN
G
18
There has been some progress in all three of these areas. The OECD’s Base Erosion and Profit Shifting (BEPS) project has established standards for these and other measures, with implementation timetables agreed for some actions.72
However, despite these positive signs, progress is slow and uneven. The transformational potential of transparency measures is being limited by efforts by a number of countries and businesses to keep information on accounts and ownership private, available only to tax authorities, rather than available for public scrutiny.73 This considerably reduces the effectiveness of these actions. Tax authorities alone do not have the capacity to sift through and act on this information. It also lessens the deterrent
potential of such actions, which comes from the threat of public scrutiny.
What is required in 2015 are international commitments to making country-by-country reporting mandatory and publicly available,74 to establish registries of beneficial ownership that are publicly accessible, and to implement a multilateral agreement on automatic exchange of information.75
Recommendation: Ensure that critical information generated from transparency measures such as country-by-country reporting and beneficial ownership registries fully support increased accountability by being available for public scrutiny.
BOx 2: THREE WAyS TO IMPROvE ACCOUNTABILITy AND TRANSPARENCy
COUNTRy-By-COUNTRy REPORTING
Mandatory country-by-country reporting would mean that all multinational companies, across sectors, would be required to provide details of their profits, tax paid, turnover and employment on a country-by-country basis. According to Transparency International, this would give governments greater ability to spot irregular activity for further investigation, including, for example, cases of corruption and bribery.66 Despite resistance from businesses, the investment community also has a strong interest in country-by-country reporting because it would arm it with information to make sure a company isn’t distorting its bottom line or taking excessive risks.67
PUBLIC REGISTRIES OF BENEFICIAL OWNERSHIP
The collation and publication of beneficial ownership information would help to eliminate the potential for anonymous ownership of companies, trusts and foundations,68 currently an essential feature of tax scams, which depend on secrecy.69
Making these registries public, as opposed to accessible only to tax and law enforcement
agencies, makes them more effective by reducing the burden of expensive and time-consuming legal processes to gain access, and would support wider accountability by enabling citizens, journalists and civil society to hold companies to account.70
AUTOMATIC ExCHANGE OF INFORMATION FOR TAx PURPOSES
Making exchanges of information for tax purposes automatic and standardised significantly reduces the burden on tax authorities to request specific tax information, while ensuring that the information received is of the quality necessary to make best use of it. Having a multilateral agreement for these exchanges is essential to ensure that developing countries, which potentially have most to gain,71 actually obtain access to this information. Where information exchange depends on bilateral agreements being in place there is less chance of poorer, less powerful countries succeeding in negotiating agreements on equitable exchanges of information. Even with a multilateral agreement, there is a risk that developing countries will be left behind if they fail to achieve the standard that is set for participation.
4 TH
E SOLU
TIO
N: M
AT
CH
ING
WO
RD
S WIT
H A
CT
ION
19
3. MAKE DECISIONS INCLUSIvE
Fundamental imbalances in the international system continue to make it difficult for all countries to benefit equally from progress being made on tax dodging. For instance, ambition for multilateral agreements on information exchange is being diluted by bilateral agreements between wealthy countries, creating further power disparities between the richest and poorest countries in tackling these issues.
Tax treaties used between two countries to avoid the situation of double taxation typically award taxing rights to rich countries where MNEs are resident, disadvantaging developing countries, most often ‘source’ countries where profits are generated.76 Treaty shopping, where companies set up in jurisdictions to obtain tax benefits, while having little commercial substance in these locations, is one outcome of such tax treaties. Changes to the tax treaty model proposed under BEPS will go some way to help address these issues but the proposals don’t go far enough and are being sold as more transformative than they actually are.
The existing structures for addressing tax reform, which are under the auspices of the OECD and G20, do not support equal participation and decision-making power by smaller and poorer countries. The G20 holds responsibility for the BEPS project and the priorities of the project naturally most closely reflect the interests of G20 member states (as evidenced by recent consultations with developing countries).77 So, for instance, the appropriate allocation of taxing rights between source and residence countries has not been discussed as part of the BEPS project.78
Regional working groups have been set up to help support wider participation but decision-making still rests with the wealthiest countries and doesn’t provide an equal seat at the table for countries severely affected by tax evasion and avoidance. The BEPS process is due to finish at the end of 2015 and a follow-up process is yet to be agreed.
That is why Save the Children is supporting the call for an inter-governmental body on tax under the auspices of the UN, where all countries have equal decision-making rights, to set international standards. This body needs to be properly resourced and fully mandated to make decisions.
Recommendation: Establish an effective international body on tax by the end of 2015 that gives equal decision-making rights to all countries, and ensures that the needs and priorities of the poorest countries are adequately addressed by global standards and actions.
4. MAKE LOCAL ACTION POSSIBLE
National governments are responsible for putting in place effective tax legislation and establishing or modernising institutions, such as tax authorities and customs divisions, to make them strong enough to enforce the law. But given that even the world’s most advanced countries struggle to deal with tax evasion and aggressive tax avoidance, it is hardly surprising that most African countries lack the capacity to do this effectively, leaving them unable to contain the problem at its source and an easy target for abuse.
One of the most important areas for international support, then, is in capacity building for tax collection. Several developing countries have seen significant success in increasing tax revenue after ODA funds and technical advice were provided. For example, according to the OECD, revenue collection in Kenya increased by $30m in one year (2012–13), from $52m to $85m, following international support to tackle transfer pricing.79 The Tax Inspectors Without Borders initiative also shows promise in terms of helping get technical support to countries where needed.80
However, donor funding remains ad hoc. Only around 0.1% of ODA ($118.4m in 2012) is spent on initiatives to build tax capacity.81 Moreover, qualified national staff are routinely and deliberately poached by corporations to maintain the status quo.82
Now, in 2015, we need a commitment from donor countries and all providers of development cooperation to deliver greater support for tax system capacity-building through increased funding and provision of technical support. Holistic policy support will be required, not just institutional strengthening. The international community should also support national civil society in holding their governments to account on tax matters and generating pressure for reform.

MA
KiN
G A
KiL
LiN
G
20
Recommendation: Increase funding and provision of technical support to strengthen capacity on tax across a range of areas (including legislation, collection, auditing and law enforcement), working with developing countries to improve their revenue potential, particularly countries whose tax-to-GDP ratio is low.
THE ROLE OF NATIONAL GOvERNMENTS
Finally, a major part of solving the tax conundrum lies with national governments themselves. Increasing domestic revenue mobilisation through progressive and effective taxation is critical for the sustainable funding of essential services and universal access to public services such as health.
Many poor countries are struggling to increase their tax revenues, especially in a way that does not affect the most vulnerable in their societies (not, for example, raising vAT). Clamping down on trade misinvoicing could greatly increase the resources available to the governments of countries such as Kenya and Mozambique.
But it is imperative that they also increase their spending on health, and do so equitably. For example,
in 2013, Kenya spent just 5.9% of its budget on health, far below the Abuja target of 15%, and even this low proportion has been declining in recent years.83
Governments must also ensure that whatever funding is available is spent equitably and efficiently – ensuring that while there is more money for health, there is also, ‘more health for the money’.84
Recommendations for national governments:1. Prioritise IFFs: build capacity in relevant
institutions, such as customs and tax revenue authorities, which make it possible to identify trade misinvoicing and act as an effective deterrent against tax dodging.
2. Increase investment in health to 15% of government spending – ensuring it is raised and spent equitably, and in support of comprehensive health services to ensure universal coverage, starting with primary care, prioritising maternal, newborn and child health.

21
2015 is the year when tax dodging and the broader focus on domestic resources for sustainable development must become overriding concerns for the international community. As we approach the Financing for Development conference in Addis Ababa and the various other crucial international meetings this year (including the G7 and the G20), all countries should consider how to use these opportunities to set out a new era of transparent and sustainable financing for health and development.
FOR THE INTERNATIONAL COMMUNITy
1. Make progress measurable: Set a time-bound target for the reduction of overall IFFs. We recommend a 50% reduction of IFFs by 2020. Such a target will not only focus minds and efforts, but also fast-track the issue of better data collection on IFFs by international bodies.
2. Make information public: Ensure that critical information generated from transparency measures, such as country-by-country reporting and beneficial ownership registries, fully support increased accountability by being available for public scrutiny.
3. Make decisions inclusive: Establish an effective international body on tax by the end of 2015 that gives equal decision-making rights to all countries and ensures that the needs and priorities of the poorest countries are adequately addressed by global standards and actions.
4. Make local action possible: Increase funding and provision of technical support to strengthen capacity on tax, across a range of areas (including legislation, collection, auditing and law enforcement), working with developing countries to improve their revenue potential, particularly countries whose tax-to-GDP ratio is low.
FOR NATIONAL GOvERNMENTS
1. Prioritise IFFs: build capacity in relevant institutions such as customs and tax revenue authorities, which make it possible to identify trade misinvoicing and act as an effective deterrent against tax dodging.
2. Increase investment in health to 15% of government spending – ensuring this is raised and spent equitably, and in support of comprehensive health services starting with primary care, prioritising maternal, newborn and child health.
5 making 2015 a year To remember: Summary of recommendaTionS
22
The purpose of this paper is to demonstrate that reducing illicit financial flows is a critical dimension of strengthening domestic resource mobilisation necessary for essential social services such as health. We aim to demonstrate the scale of the issue by comparing the potential tax loss in the 75 countries with the highest levels of maternal and child mortality, and in particular in sub-Saharan Africa, to health spending. The paper acknowledges that IFFs are not the only route for governments to address lost corporate tax revenues and may not even be the biggest contributor to the overall picture, but provide an insight into what could be achieved with greater ambition across all fronts.
By comparing potential tax loss in recent years to levels of health spending, we provide an illustration of the scale of the issue, and an idea of additional resource that could be available should trade misinvoicing be eliminated, and all trades taxed. In reality, we recognise that the elimination of IFFs will take time, and is dependent on developing countries having the administrative systems in place to achieve this. We also recognise not all additional tax would, or should, be spent on health.
Regarding estimates of tax loss, it is acknowledged that the data available is suitable for identifying the broad scale of the problem, but insufficient for detailed, context-specific policy analysis on tax. It is also recognised that trade could decrease if misinvoicing were clamped down on, where current tariffs or taxes are too high to make the trade profitable, in turn reducing the amount of tax collectable. However, this scenario is beyond the scope of this paper to address. Given a number of factors, described below, it is likely that the estimates of total tax loss presented are conservative and still relevant to the discourse.
The results presented in this work are based on a number of assumptions, and rely on trade and tax data that is ‘untransparent’ and not routinely collected. We list our sources, assumptions and limitations for these below.
CALCULATING THE POTENTIAL TAx LOSS AS A RESULT OF TRADE MISINvOICING
SOURCES
• Fordataonillicitfinancialflowswedrawonthework of Global Financial Integrity (2014) ‘Illicit Financial Flows from Developing Countries: 2003–2012’.85 We use their estimates of trade related misinvoicing (GER method – Gross Excluding Reversals). This allows us to look only at commercial IFFs: ‘Proceeds arising from import and export transactions conducted so as to manipulate customs duties, vAT taxes, income taxes, excise taxes, or other sources of government revenues’, rather than IFFs arising from proceeds of corruption or criminal activity. Trade misinvoicing makes up a different proportion of the total IFFs in each country but as an average is approximately 80% of IFFs.
• AccordingtoGFI,thetotalestimatesprovidedfortrade misinvoicing are likely to be conservative for a number of reasons: i) IFFs that are carried out using cash are not
captured in the statistics. ii) Only trade in goods is included; trade in
services and intangibles (accounting for approximately 20% of global trade) are not captured.
iii) Same invoice faking, where the importer colludes with the exporter to present the same misvalue on the invoice, cannot be seen in these numbers.
• Thisfinalpointisonereasonwhytrademisinvoicing by MNEs is unlikely to be included in these estimates. Where the two parts of the trade are within a company, invoices will be the same at both ends of the transaction so any mispricing would be invisible in the figures. MNEs are also more likely to track transactions using internal accounting procedures as opposed to invoices.
appendix: meThodology

23
COUNTDOWN TO 2015
Countdown to 2015 is a global movement of academics, governments, international agencies, healthcare professional associations, donors, and non-governmental organisations, with The Lancet as a key partner. Countdown uses country-specific data to stimulate and support country progress towards achieving the health-related Millennium Development Goals. Countdown tracks progress in the 75 countries where more than 95% of all maternal and child deaths occur, including the 49 lowest-income countries.
COUNTDOWN TO 2015 COUNTRIES
Afghanistan, Angola, Azerbaijan, Bangladesh, Benin, Bolivia, Botswana, Brazil, Burkina Faso, Burundi, Cambodia, Cameroon, Central African Republic,
Chad, China, Comoros, Democratic Republic of Congo, Republic of Congo, Côte d’Ivoire, Djibouti, Egypt, Equatorial Guinea, Eritrea, Ethiopia, Gabon, Gambia, Ghana, Guatemala, Guinea, Guinea-Bissau, Haiti, India, Indonesia, Iraq, Kenya, Kyrgyzstan, Laos, Lesotho, Liberia, Madagascar, Malawi, Mali, Mauritania, Mexico, Morocco, Mozambique, Myanmar, Nepal, Niger, Nigeria, Pakistan, Papua New Guinea, Peru, Philippines, Rwanda, São Tomé and Principe, Senegal, Sierra Leone, Solomon Islands, South Africa, South Sudan, Sudan, Swaziland, Tajikistan, Tanzania, Togo, Turkmenistan, Uganda, Uzbekistan, vietnam, yemen, Zambia (The three other Countdown countries are North Korea, Somalia and Zimbabwe, for which there was no data available for this study)
APPEN
DIx
: MET
HO
DO
LOG
y
• ThereisnodataonGERoutflowsforninecountries: Uzbekistan, Turkmenistan, Tajikistan, Somalia, Pakistan, Mauritania, Krygzstan, Ghana and Eritrea.
For data on tax we draw on two sources: 1. The recently created Government Revenue Dataset
(GRD), developed by the International Centre for Tax and Development (ICTD).86 The dataset combines data from several major international databases, as well as drawing on data compiled from all available IMF Article Iv reports. It represents significant improvement in data coverage, and accuracy. We use ICTD for country estimates of tax as share of GDP, and include social contributions in our calculations. Tax/GDP data is missing for six countries: Somalia, Eritrea, Mauritania, Turkmenistan, Uzbekistan and Malawi. For just one of these – Malawi – IFF data is available, for which we filled tax data with the low-income country average so we could keep in the dataset.
2. The PWC ‘Profit Tax Total Tax Rate’, which provides a figure for average corporate tax paid on a country-by-country basis, as opposed to the headline tax rate, which was invariably higher, often significantly so. Again this helped to make our figures more conservative.87
METHODOLOGy AND ASSUMPTIONS
• Wecalculatedthepotentialtaxlossin147developing countries, applying country specific tax rates to the GFI GER (trade misinvoicing) estimates for that country, for the latest available year (usually 2012). We grouped the results by Countdown to 2015 countries (see box below), low income countries and Sub-Saharan Africa. We also calculated this as a share of GDP.
• Weassumethat100%ofthetrademisinvoicingcapital is taxable profit. Misinvoincing is used to optimise taxes paid between jurisdictions, by reporting no profit or a small profit in the high tax jurisdiction. Reporting a loss in the high tax jurisdiction would not be an efficient way to maximise gains from the illicit transaction.
• Inidentifyingasuitabletaxratetoapply,the following challenge was identified: trade misinvoicing outflows are made up of under-invoicing of exports and over-invoicing of imports, meaning that a range of income taxes, duties and tariffs could apply to them. Trade-related tariffs vary from product to product, year to year and country to country and are not easily available. In order to manage this we calculate the potential tax loss using two methods to arrive at our results: corporate tax rates and tax/GDP. The corporate tax rate is chosen as a reasonable rate to apply as the majority of tax collected in low-income countries is corporate

MA
KiN
G A
KiL
LiN
G
24
and as we are studying trade. As noted above, PWC’s ‘Profit Tax Total Tax Rate’ is used rather than the headline corporate tax rate, as headline rates are often considerably higher than what is actually paid. Tax/GDP then provides a relevant contrasting figure reflecting the current picture of tax collection in the economy – leading to an assertion along the lines of, ‘in general, in this country, economic activity results in x % of tax’.
CALCULATING THE TAx LOSS, HEALTH NEEDS AND POTENTIAL HEALTH GAINS IN CASE STUDy COUNTRIES
SOURCES
• ForIFFs and tax loss we draw on an in-depth country level analysis by GFI – ‘Hiding in Plain Sight: Trade misinvoicing and the impact of revenue loss in Ghana, Kenya, Mozambique, Tanzania and Uganda’. This analyses bilateral trade flows from the UN’s Comtrade data for five countries, as opposed to just outflows as captured in GFI’s annual IFF update which uses the IMF DOTS database. UN Comtrade data is only available for a limited number of countries so cannot be used for global estimates.
• Forhealth expenditure statistics we used the WHO Global Health Expenditure Database in 2012 dollar exchange rate terms.
• Forpopulation data we use the World Bank, and take the midpoint for the 2002–10 period/average for our historic calculations to compare with health spending at that time.
• Forthesub Saharan Africa health worker costings we used salary data, based on published data in The Lancet for Ghana, Burkina Faso, Zambia and Nigeria updated to 2012 prices,88 and unpublished data from Ministries in Mali, DRC, Kenya and South Africa. All data in 2012 prices.
• ForKenya we draw on the national health plan and the human resources for health plan.89 It was fully costed and its impact assessed, using the WHO’s One Health Tool & Lives Saved Tool.
• ForMozambique we drew on published costing of the national health plan.90 It was fully costed and its impact assessed using the WHO’s One Health Tool & Lives Saved Tool.
METHODOLOGy AND ASSUMPTIONS
We assume in this study that all gains from recouping potential tax loss would be available as a windfall for health. This is for illustrative purposes and we do not suggest that this is how all additional revenue should be spent. We argue here and elsewhere that countries do need to invest more in health – for example, meeting the Abuja target of 15% of the budget to health. In reality, tax revenue from IFFs would be just one part of a series of tax measures required (including improving tax revenue collection systems, addressing excessive and ineffective tax incentive structures, clamping down on tax evasion by individuals, and renegotiating unfavourable tax treaties with other countries). So revenue generated from clamping down on IFFs provides one part of a wider pot of funding that each country would need to allocate based on its spending priorities.
• Ourcalculationofthehealthworkercostsinsub-Saharan Africa is a rough estimate and purely illustrative. There is no such thing as a single ‘health worker salary’. Salaries vary according to the country, cadre of health worker, pay grade within each category, and consist of base salaries, allowances, bonuses, overtime, etc. We have calculated a weighted average cost for doctors, nurses and midwives across eight countries with a range of income levels for which we could access data – roughly US$8,000 in 2012.
• Wecomparedtheannualaveragepotentialtaxloss in Kenya and Mozambique, published by GFI for 2002–10, to health costs listed in national health plans. We illustrate that the health costs are equivalent to various areas within each plan: the current funding gaps, or individual line items (human resources costs, infrastructure costs).
• InKenya,thehumanresourcesforhealthplanoutlines a shortage of 86,466 workers, while the investment plan suggests a shortage of 141,843 workers, which would be 80% filled by 2018 (106,382 additional workers). We err on the conservative side. In calculating the lives saved, the Kenya plan, if fully implemented, expects to see a reduction in the under-five mortality rate from 74/1,000 to 35/1,000. We applied this to the latest UNICEF data on under-five deaths in 2013, resulting in 50,068 child lives saved each year. (http://data.unicef.org/child-survival/under-five).

APPEN
DIx
: MET
HO
DO
LOG
y
25
• InMozambique,asinKenya,wedrawonspecificbudgeted areas to compare the scale of potential tax loss to the future needs of the health sector. Mozambique’s plan, if implemented, is expected to save the lives of 2,000 mothers each year, and achieve a 37% reduction in under-five mortality by 2019. Applying this to UNICEF 2013 data on the total number of under-five deaths results in 30,667 children’s lives saved each year.

26
1 THE CONTExT: SUSTAINABLE HEALTH FINANCING UNDERMINED By TAx SCAMS1 See, for example: Jamison, D T et al 2013. Global health 2035: a world converging within a generation. The Lancet; 382(9908):1898–1955; yates, R. 2009. Universal health care and the removal of user fees. The Lancet: 373:2078–2081; Savedoff, WD. 2012. Transitions in Health Financing and Policies for Universal Health Coverage. Results for Development Institute. Washington D.C.; Moreno-Serra, R, and Smith, P. 2012. Does progress towards universal health coverage improve population health? The Lancet 380(9845): 917–923.
2 The World Health Organisation defines universal health coverage as ensuring that “all people can use the promotive, preventive, curative, rehabilitative and palliative health services they need, of sufficient quality to be effective, while also ensuring that the use of these services does not expose the user to financial hardship” http://www.who.int/features/qa/universal_health_coverage/en/
3 McIntyre D. and Meheus F 2014 Fiscal Space for Domestic Funding of Health and Other Social Services, Chatham House, Working Group on Financing, Paper 5, 2014. http://www.chathamhouse.org/sites/files/chathamhouse/home/chatham/public_html/sites/default/files/20140300DomesticFundingHealthMcIntyreMeheus.pdf
4 All health expenditure data in 2013 US$, taken from World Health Organization, Global health expenditure database. Geneva: World Health Organization; 2014. Available at: http://apps.who.int/nha/ database
5 Brearley, L. & Hanna, L., 2015. Within our Means: Why countries can afford universal health coverage, Save the Children. http://www.savethechildren.org.uk/sites/default/files/images/Within_Our_Means.pdf
6 Jamison, D T et al 2013 Global health 2035: a world converging within a generation. The Lancet; 382(9908):1898–1955
7 Reeves, A., Gourtsyannis, y., Basu, S., McCoy, D., McKee. M. and D. Stuckler, 2015 Financing universal health coverage – effects of alternative tax structures on public health systems: cross-national modelling in 89 low-income and middle-income countries The Lancet, http://dx.doi.org/10.1016/S0140-6736(15)60574-8
8 ibid
9 Ben Dickinson 2011, Tax and good governance, OECD Journal: general papers, vol. 2010/1. DOI: http://dx.doi.org/10.1787/gen_papers-2010-5kgc6cl2zv0q
10 Save the Children analysis based on the ICTD Government Revenue Dataset, release September 2014, reference year 2011 http://www.ictd.ac/en/about-ictd-government-revenue-dataset
11 Reeves, A., Gourtsyannis, y., Basu, S., McCoy, D., McKee. M. and D. Stuckler, 2015 Financing universal health coverage – effects of alternative tax structures on public health systems: cross-national modelling in 89 low-income and middle-income countries The Lancet, http://dx.doi.org/10.1016/S0140-6736(15)60574-8
12 McNair, D., Espey, J., Holder, A., and L. Crosby 2014 Tackling Tax and Saving Lives: Children, tax and financing for development, Save the Children
2 THE PROBLEM: HOW DO TAx SCAMS WORK? AND HOW MUCH IS BEING LOST?13 UNCTAD, 2015. FDI, Tax and Development The fiscal role of multinational enterprises: towards guidelines for Coherent International Tax and Investment Policies, Available at: http://investmentpolicyhub.unctad.org/Upload/Documents/FDI, Tax and Development.pdf
14 OECD, 2013, Addressing Base Erosion and Profit Shifting, www.oecd.org/tax/beps.htm; See also Kumar, C., 2014. Africa Rising: Inequalities and the essential role of fair taxation, Christian Aid. and IMF (2014) Spillovers in International Corporation Tax IMF Policy Paper http://www.imf.org/external/np/pp/eng/2014/050914.pdf
15 There is no single, agreed definition of IFFs. In this report we follow GFI’s definition of IFFs which explicitly states IFFs as being illegal in nature. However there are compelling arguments for taking a broader definition, which recognises that illicit refers not only to activities which are expressly illegal, but also those which break cultural rules and norms. This avoids getting caught up in complex legal technicalities between different countries’ legislative frameworks and allows for abusive transfer pricing to be considered as an IFF. See Cobham, A 2014 Illicit Financial Flows: Benefits and Costs of the IFF Targets for Post-2015 Development Agenda Copenhagen Consensus Center
16 African Union 2014. Illicit Financial Flow: Report of the High Level Panel on Illicit Financial Flows from Africa, Available at: http://www.uneca.org/sites/default/files/publications/iff_main_report_english.pdf
17 According to GFI’s figures more than 80% of IFFs are in just twelve countries, including the world’s largest economies – China, Russia, Brazil – and large lower-middle-income countries with high numbers of poor people – India, Indonesia and Nigeria. These countries are home to many millions of people living in extreme poverty where stemming the flows of IFF could make a significant difference. See Kar, D. & Spanjers, J. 2014 Illicit Financial Flows from Developing Countries: 2003–2012, Global Financial Integrity
18 Boyce JK and Ndikumana L. 2012 Capital flight from Sub-Saharan African countries: updated estimates, 1970–2010. Amherst, MA: Political Economy Research Institute, 2012; Epstein G. 1. Introduction. In: Epstein G. Capital Flight and Capital Controls in Developing Countries: an Introduction. Cheltenham, UK: Edward Elgar, 2005, pp.3–14.
19 Baker, R., Clough, C., Kar, D., LeBlanc, D., and J. Simmons 2014 Hiding in Plain Sight: Trade Misinvoicing and the Impact of Revenue Loss in Ghana, Kenya, Mozambique, Tanzania, and Uganda: 2002–2011, Global Financial Integrity http://www.gfintegrity.org/report/report-trade-misinvoicing-in-ghana-kenya-mozambique-tanzania-and-uganda/
20 Kar, D and LeBlanc, B 2014, Illicit Financial Flows to and from the Philippines: A Study in Dynamic Simulation, 1960–2011, Global Financial Integrity http://www.gfintegrity.org/report/country-case-study-philippines/
21 Kar, D. & Spanjers, J. 2014. Illicit Financial Flows from Developing Countries: 2003–2012, Global Financial Integrity http://www.gfintegrity.org/report/2014-global-report-illicit-financial-flows-from-developing-countries-2003-2012/
22 Baker, R., Clough, C., Kar, D., LeBlanc, D., and J. Simmons (2014) “Hiding in Plain Sight: Trade Misinvoicing and the Impact of Revenue Loss in Ghana, Kenya, Mozambique, Tanzania, and Uganda: 2002–2011”, Global Financial Integrity
endnotes
END
No
TES
27
23 African Union 2014. Illicit Financial Flow: Report of the High Level Panel on Illicit Financial Flows from Africa, Available at: http://www.uneca.org/sites/default/files/publications/iff_main_report_english.pdf
24 African Union 2014. Illicit Financial Flow: Report of the High Level Panel on Illicit Financial Flows from Africa, Available at: http://www.uneca.org/sites/default/files/publications/iff_main_report_english.pdf
25 Cobham, A 2014. Illicit Financial Flows: Benefits and Costs of the IFF Targets for the Post-2015 Development Agenda http://www.copenhagenconsensus.com/sites/default/files/iff_assessment_-_cobham_0.pdf
26 van der Does de Willebois, E., Halter, E., Harrison. R., Park, J., Sharman, J. 2011 The Puppet Masters: How the Corrupt Use Legal Structures to Hide Stolen Assets and What to Do About It, World Bank and UNODC Stolen Asset Recovery Initiative. https://star.worldbank.org/star/sites/star/files/puppetmastersv1.pdf
27 Based on table in Baker, R., Clough, C., Kar, D., LeBlanc, D., and J. Simmons (2014) “Hiding in Plain Sight: Trade Misinvoicing and the Impact of Revenue Loss in Ghana, Kenya, Mozambique, Tanzania, and Uganda: 2002–2011”, Global Financial Integrity
28 Kar, D. & Spanjers, J. 2014. Illicit Financial Flows from Developing Countries: 2003–2012, GFI
29 IMF, OECD, UN and WB, 2011, Supporting the Development of More Effective Tax Systems: A Report to the G-20 Development Working Group http://www.oecd.org/ctp/48993634.pdf
30 Kar, D. & Spanjers, J. 2014. Illicit Financial Flows from Developing Countries: 2003–2012, Global Financial Integrity
31 Save the Children calculations (see Methodology). Potential tax loss from trade misinvoicing: all 147 developing countries $113 bn (range $111.5–$113.9bn); Countdown countries in 2012 $78 bn (range $73.6–$82.3bn), Sub Saharan Africa $15 bn (range $14.4–$15.2 bn); tax loss in low income countries $2.3bn (range $1.6–$2.9bn)
32 For an explanation of the ‘Arms Length Principle’ see McNair, D., Dottey, R. and A. Cobham 2010 Transfer Pricing, and the taxing rights of developing countries, Christian Aid, See also See also OECD, 2013, Addressing Base Erosion and Profit Shifting, www.oecd.org/tax/beps.htm
33 ibid. See also Loretz, S. and Cobham, A. 2014 International Distribution of the Corporate Tax Base: Implications of Different Apportionment Factors under Unitary Taxation, Working Paper 27, ICTD. http://ictd.ac/en/publications/international-distribution-corporate-tax-base-implications-different-apportionment
34 Jansky, P. and A. Prats 2013 Multinational Corporations and the Profit-Shifting Lure of Tax Havens: How Tax Avoidance and Evasion Hinder Development Christian Aid http://www.christianaid.org.uk/Images/CA-OP-9-multinational-corporations-tax-havens-March-2013.pdf
35 African Union 2014. Illicit Financial Flow: Report of the High Level Panel on Illicit Financial Flows from Africa,
36 Ibid.
3 SPOTLIGHT ON AFRICA: WHAT COULD ALL THIS MONEy PAy FOR?37 ibid
38 Kar, D. & Spanjers, J. 2014. Illicit Financial Flows from Developing Countries: 2003–2012, Global Financial Integrity
39 McIntyre, D. and Meheus, F. 2013 Fiscal Space for Health Spending. Chatham House Working Group on Financing: Paper 4. And Jamison D., Summers L., Allenyne G., et al. (2013) ‘Global health 2035: a world converging within a generation’. Lancet 382: 1898–955
40 World Health Organization, Global health expenditure database. [Internet]. Geneva: WHO; 2014. Available at: http://apps.who.int/nha
41 Save the Children calculation, see methodology, Annex 2
42 All country case-study numbers based on GFI’s 5-country study, Baker, R., Clough, C., Kar, D., LeBlanc, D., and J. Simmons 2014 Hiding in Plain Sight: Trade Misinvoicing and the Impact of Revenue Loss in Ghana, Kenya, Mozambique, Tanzania, and Uganda: 2002–2011, Global Financial Integrity, which draws on UNComtrade Database. Please note that these numbers are based on the UNComtrade Database, as opposed to IMF DOTS dataset, which the global figures are based on. See methodology for detail.
43 Kenya’s under-five mortality rate was 98 per 1,000 live births in 1990 and their MDG target by 2015 is 32. Source: UNICEF http://data.unicef.org/child-survival/under-five accessed 06 05 2015
44 Ibid.
45 Ibid.
46 WHO, 2013. A universal truth: No health without a workforce. Geneva: WHO.
47 Chuma, J. and Okungu, v., 2011. Viewing the Kenyan health system through an equity lens: implications for universal coverage. International Journal for Equity in Health, 10(22).
48 Ibid.
49 The ICTD Government Revenue Dataset, available at http://www.ictd.ac/en/about-ictd-government-revenue-dataset
50 Baker, R., Clough, C., Kar, D., LeBlanc, D., and J. Simmons 2014 Hiding in Plain Sight: Trade Misinvoicing and the Impact of Revenue Loss in Ghana, Kenya, Mozambique, Tanzania, and Uganda: 2002–2011, Global Financial Integrity
51 Ibid.
52 Kenya now spends $18.6 per person on health (US$ 2013) WHO Global Health Expenditure Database. Available at: http://apps.who.int/nha/ database
53 Kenya Health Sector Strategic And Investment Plan (KHSSP) July 2014 – June 2018
54 $436 million a year is the amount missing from the overall annual cost of the KHSSP implementation, averaging $3bn per year.
55 See Methodology for details of lives saved assumptions.
56 Infrastructure costs are between $4–500m each year over the course of the KHSSP
57 Rodríguez Pose R, Engel J, Poncin A and Manuel S 2014 Against the Odds: Mozambique’s gains in primary health care Overseas Development Institute http://www.odi.org/sites/odi.org.uk/files/odi-assets/publications-opinion-files/8981.pdf
58 http://www.countdown2015mnch.org/documents/2014Report/Mozambique_Country_Profile_2014.pdf
59 World Health Organization 2014, Mozambique Country Cooperation Strategy. Available at http://www.who.int/countryfocus/cooperation_strategy/ccsbrief_moz_en.pdf?ua=1
60 Baker, R., Clough, C., Kar, D., LeBlanc, D., and J. Simmons (2014) “Hiding in Plain Sight: Trade Misinvoicing and the Impact of Revenue Loss in Ghana, Kenya, Mozambique, Tanzania, and Uganda: 2002–2011”, Global Financial Integrity
61 World Bank, 2015, Global Economic Prospects, http://www.worldbank.org/en/publication/global-economic-prospects/data?region=SST
62 The ICTD Government Revenue Dataset, available at http://www.ictd.ac/en/about-ictd-government-revenue-dataset
63 Baker, R., Clough, C., Kar, D., LeBlanc, D., and J. Simmons (2014) “Hiding in Plain Sight: Trade Misinvoicing and the Impact of Revenue Loss in Ghana, Kenya, Mozambique, Tanzania, and Uganda: 2002–2011”, Global Financial Integrity
64 Ibid.
65 Dutta, A., N. Perales, R. Silva, and L. Crivillé. 2014. Estimated Resource Needs and Impact of Mozambique’s Plano Estratégico do Sector Saúde, 2014–2019. Washington, DC: Futures Group, Health Policy Project
MA
KiN
G A
KiL
LiN
G
28
4 THE SOLUTION: MATCHING WORDS WITH ACTION66 Transparency International Coalition Country by Country Reporting: Transparency is smart for people and for business. It’s time for companies to open their books http://financialtransparency.org/issues/country-by-country-reporting/ (accessed 22/05/2015)
67 ibid
68 The legal title to companies is not always the same as the name of the people who actually control it (the ‘beneficial owners’). Companies can be listed under the name of ‘Nominee’ shareholders, or be held in the name of another company (or trust or foundation), or anonymous ‘bearer shares’ may be used, making it impossible to trace relationships. See: Cobham, A 2014 Illicit Financial Flows: Benefits and Costs of the IFF Targets for the Post-2015 Development Agenda http://www.copenhagenconsensus.com/sites/default/files/iff_assessment_-_cobham_0.pdf
69 van der Does de Willebois, E., Halter, E., Harrison. R., Park, J., Sharman, J. 2011 The Puppet Masters: How the Corrupt Use Legal Structures to Hide Stolen Assets and What to Do About It, World Bank and UNODC Stolen Asset Recovery Initiative. https://star.worldbank.org/star/sites/star/files/puppetmastersv1.pdf
70 Cobham, A 2014 Illicit Financial Flows: Benefits and Costs of the IFF Targets for the Post-2015 Development Agenda http://www.copenhagenconsensus.com/sites/default/files/iff_assessment_-_cobham_0.pdf
71 OECD 2014 Strengthening Tax Systems to Mobilise Domestic Resources in the Post-2015 Development Agenda http://www.oecd.org/dac/Post%202015%20Domestic%20Resource%20Mobilisation.pdf
72 Base Erosion and Profit shifting, OECD, http://www.oecd.org/ctp/beps.htm
73 For objections and counter-arguments see Murphy, R. 2012 Country by Country Reporting: Accounting for Globalisation Locally, Tax Justice Network, http://www.taxresearch.org.uk/Documents/CBC2012.pdf
74 At a minimum countries need to agree to make data available to an international body at aggregate level so that annual reports can be produced to track overall changes in discrepancies between economic activity and profits declared. This will help monitor the overall success or otherwise of attempts to reduce profit shifting.
75 The UK has agreed to create a publicly accessible register of beneficial ownership expected in 2016. Off-shore hubs strongly opposed to public nature of registries
76 The UN model for tax treaties gives greater taxing rights to source countries but the OECD model is more widely used, which typically grants rights to countries where the company is ‘resident’. Michael Lennard from the UN Tax Committee describes the key differences here: http://ow.ly/BImps For more information on tax treaties see “Tax Treaties” http://www.taxjustice.net/topics/corporate-tax/tax-treaties/
77 OECD, 2014 Part 1 of a report to G20 Development Working Groups on the Impact of BEPS in Low Income Countries and Part 2 of a report to G20 Development Working Groups on the Impact of BEPS in Low Income Countries
78 Ryding, Tove, 2014 OECD BEPS process: Minor Victories in the battle against tax dodging, but we risk losing the war, Eurodad, http://www.eurodad.org/Entries/view/1546260/2014/09/22/OECD-BEPS-process-Minor-victories-in-the-battle-against-tax-dodging-but-we-risk-losing-the-war
79 OECD 2014 Strengthening Tax Systems to Mobilise Domestic Resources in the Post-2015 Development Agenda http://www.oecd.org/dac/Post%202015%20Domestic%20Resource%20Mobilisation.pdf
80 TIWB facilitates targeted, tax audit assistance programmes, using tax audit experts who work directly with local officials in developing country tax administrations with a specific focus on audit and audit-related issues concerning international tax matters. This new type of direct assistance applies a real-time, “learning by doing” approach to solve current audit issues and transfer knowledge and skills. (OECD, 2014c; and see http://www.oecd.org/ctp/tax-global/tax-inspectors.htm).
81 OECD 2014 Strengthening Tax Systems to Mobilise Domestic Resources in the Post-2015 Development Agenda http://www.oecd.org/dac/Post%202015%20Domestic%20Resource%20Mobilisation.pdf
82 African Union 2014. Illicit Financial Flow: Report of the High Level Panel on Illicit Financial Flows from Africa, Available at: http://www.uneca.org/sites/default/files/publications/iff_main_report_english.pdf
83 All health expenditure data in 2013 USD, taken from World Health Organization, Global health expenditure database. [Internet]. Geneva: World Health Organization; 2014. Available at: http://apps.who.int/nha/ database
84 WHO 2010 World Health Report Health systems financing: the path to universal coverage
APPENDIx: METHODOLOGy85 Kar, D. & Spanjers, J. 2014. Illicit Financial Flows from Developing Countries: 2003–2012, Global Financial Integrity
86 The ICTD Government Revenue Dataset, available at http://www.ictd.ac/en/about-ictd-government-revenue-dataset
87 PWC 2014 Paying Taxes 2014: The global picture: A comparison of tax systems in 189 economies worldwide. Available at http://www.pwc.com/gx/en/paying-taxes/assets/pwc-paying-taxes-2014.pdf
88 McCoy, David et al. (2008) “Salaries and incomes of health workers in sub-Saharan Africa” The Lancet, volume 371, Issue 9613, 675–681
89 Kenya Ministry of Health Transforming health: accelerating attainment of universal health coverage: Kenya Health Sector Strategic and Investment Plan (KHSSP) July 2014 – June 2018. Kenya Ministry of Health, Kenya Human Resources for Health Country Profile 2014
90 Dutta, A., N. Perales, R. Silva, and L. Crivillé. 2014. Estimated Resource Needs and Impact of Mozambique’s Plano Estratégico do Sector Saúde, 2014–2019. Washington, DC: Futures Group, Health Policy Project.

Co
VER
Pho
To
: WiLLiA
M D
AN
iELS/PAN
oS
making a killinghow tax scams are robbing poor countries of life-saving healthcare
savethechildren.org.uk
The world’s poorest countries are losing billions of potential tax revenue each year as a result of illicit financial flows and the tax dodging schemes associated with them. These complex and shadowy tax dealings are robbing developing countries of revenue they need to spend on essential public services.
Making a Killing analyses one part of the web of illicit financial flows, the ‘misinvoicing’ of international trade – a way of hiding the true value of imports and exports, shifting profits and evading taxes.
The figures are staggering. The sums being lost are comparable to the amounts currently missing from the health budgets of very poor countries – lost money that could boost total budgets and pay for desperately needed doctors, nurses, clinics, hospitals and medicines, and provide the basic minimum of decent healthcare to mothers and children.
If the world is to meet its ambitious targets on health and child survival, let alone the broader objectives of the Sustainable Development Goals, illicit financial flows must be urgently addressed. This reports sets out recommendations for action by the international community.