how stable are eating disorder diagnoses
TRANSCRIPT
1
How Stable are Eating Disorder Diagnoses?
David B. Herzog, M.D.Massachusetts General Hospital and Harvard Medical School
Research Team
Kamryn T. Eddy, M.A.
Debra Franko, Ph.D.
Kavita Tahilani, B.S.
Heather Thompson-Brenner, Ph.D.
David J. Dorer, Ph.D.
Pamela K. Keel, Ph.D.
Elizabeth Ong, B.A.
2
How can longitudinal data contribute to the validation of ED diagnoses?
• Do AN and BN differ in recovery and relapse?
• Do ANR and ANBP differ in recovery and relapse?
• Are the current EDs diagnoses stable?
– What types of diagnostic migration occur?
3
MGH Longitudinal Study of AN and BN
• 246 treatment seeking women with AN or BN followed for a median of 9 years
• Interviewed semi–annually using the LIFE-EAT II
• Prospective study with naturalistic design.
4
Psychiatric Status Rating Scale(PSR)
1: Complete recovery
2: Residual
3: Partial remission
4: Marked
5: Definite criteria
6: Definite criteria (severe)

5
• Full Recovery: PSR 1 or 2 for 8 weeks
• Partial Recovery: PSR 3 or 4 for 8 weeks
Recovery

6
0 100 200 300 400 500
0.0
0.2
0.4
0.6
0.8
1.0
Partial RemissionF
ract
ion
stil
l ill
Weeks f rom Entry
Bulimia
An-BP
An-R
Partial Recovery

7
0 100 200 300 400 500
0.0
0.2
0.4
0.6
0.8
1.0
Full RemissionF
ract
ion
stil
l ill
Weeks f rom Entry
Bulimia
An-BP
An-R
Full Recovery
8
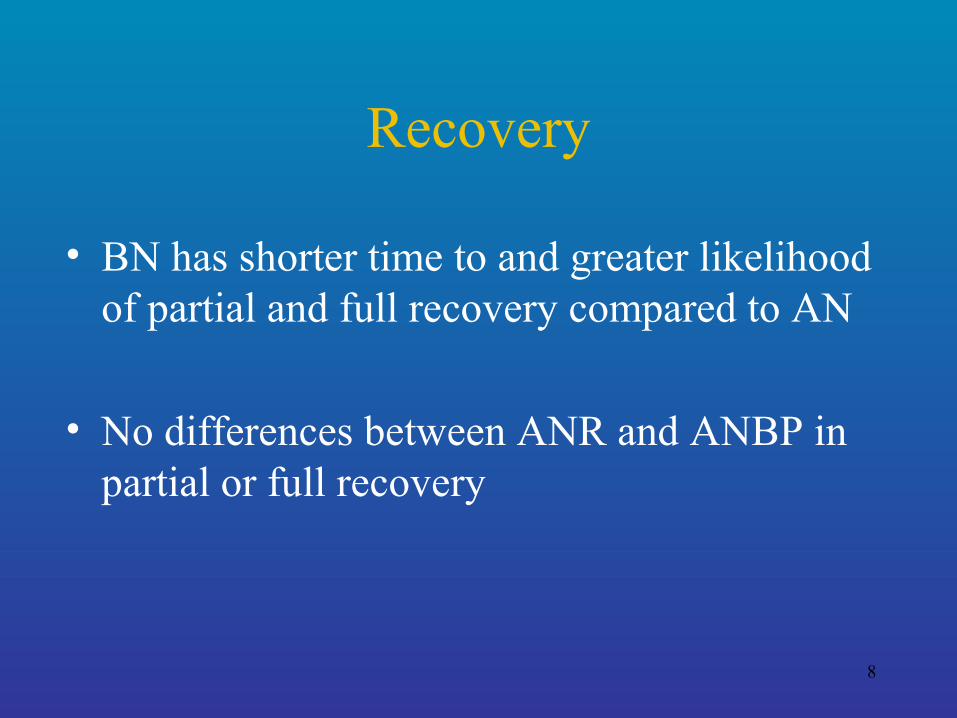
Recovery
• BN has shorter time to and greater likelihood of partial and full recovery compared to AN
• No differences between ANR and ANBP in partial or full recovery

9
Diagnostic Stability
10
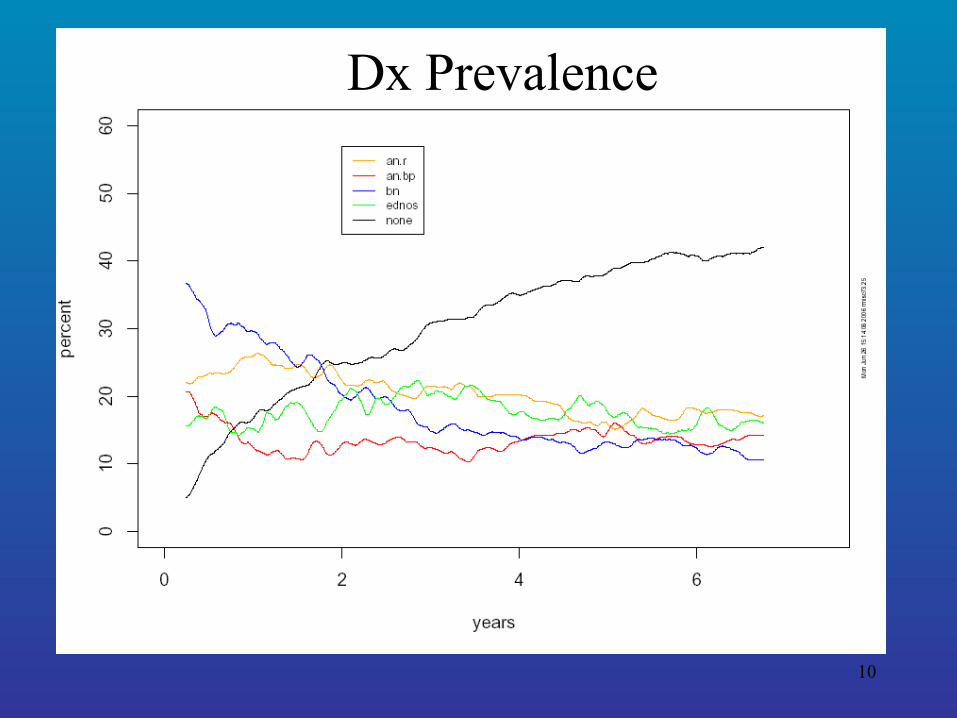
MGH Longitudinal Study of AN & BN
Dx Prevalence

11
MGH Longitudinal Study of AN & BNDx Persistence
12
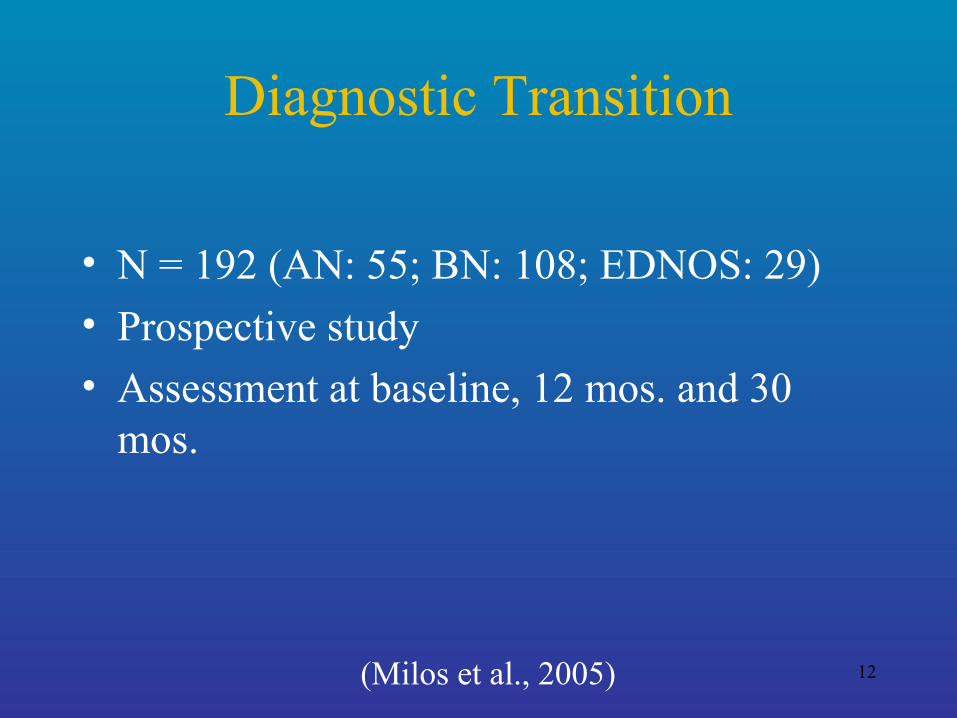
Diagnostic Transition
• N = 192 (AN: 55; BN: 108; EDNOS: 29)
• Prospective study
• Assessment at baseline, 12 mos. and 30 mos.
(Milos et al., 2005)

13
Diagnostic Transition
Dx at 12 mos (%) Dx at 30 mos (%)
AN BN EDNOS No ED AN BN EDNOS No ED
AN 56.4 16.4 18.2 9.1 49.1 9.1 20.0 21.8
BN 6.5 50.9 18.5 24.1 5.6 37.0 26.9 30.6
EDNOS 17.2 24.1 27.6 31.0 13.8 3.4 31.0 51.7
(Milos et al., 2005)
14
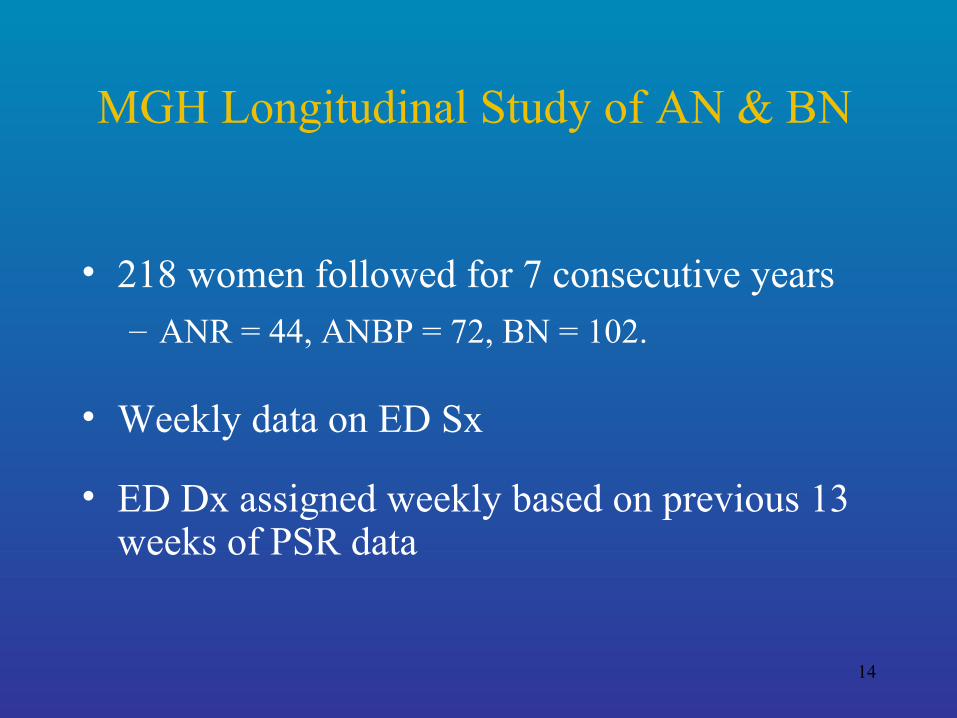
• 218 women followed for 7 consecutive years– ANR = 44, ANBP = 72, BN = 102.
• Weekly data on ED Sx
• ED Dx assigned weekly based on previous 13 weeks of PSR data
MGH Longitudinal Study of AN & BN
15
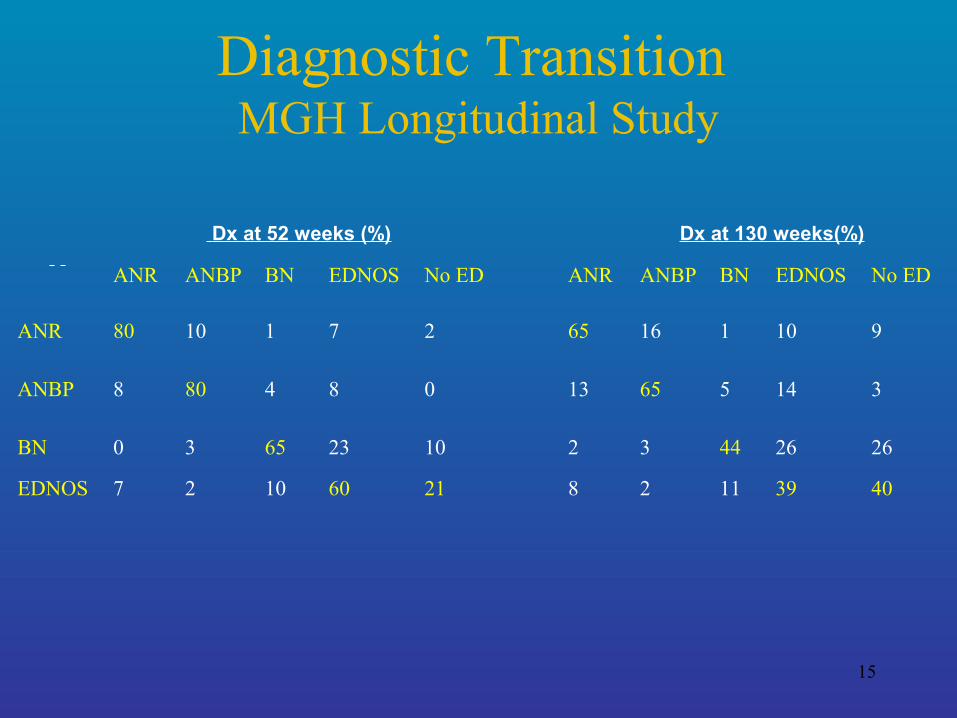
Diagnostic Transition MGH Longitudinal Study
Dx at 52 weeks (%) Dx at 130 weeks(%)
ANR ANBP BN EDNOS No ED ANR ANBP BN EDNOS No ED
ANR 80 10 1 7 2 65 16 1 10 9
ANBP 8 80 4 8 0 13 65 5 14 3
BN 0 3 65 23 10 2 3 44 26 26
EDNOS 7 2 10 60 21 8 2 11 39 40

16
Diagnostic Transition
(Tozzi et al., 2005)

17
Crossover
• >50% of AN-R crossover
– Largely migrates to AN BP, sometimes BN
• Crossover uncommon for BN
– when it does occur, transition is mostly to ANBP
18
Crossover
• one-third of BNs have a history of AN
• BN with AN history were less likely to experience full recovery
19
Crossover
• Longitudinal differences in likelihood of dx crossover support the validity of AN and BN as unique dxs
20
Diagnostic Transitionstudy conclusions
– Change in dx is common
– AN most stable
– EDNOS and BN least stable
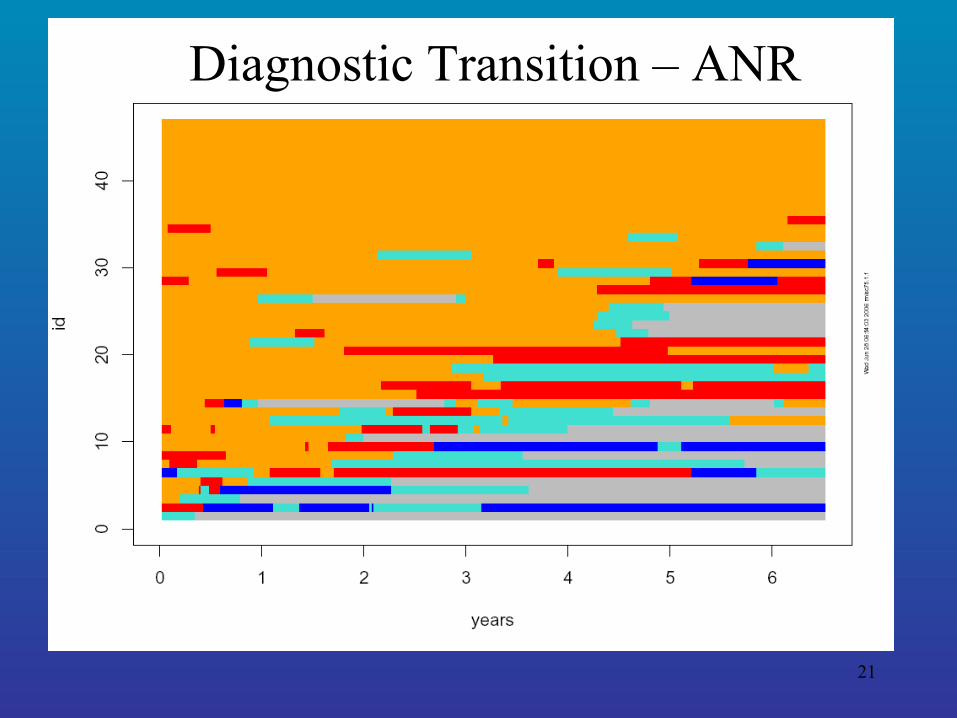
21
Diagnostic Transition – ANR
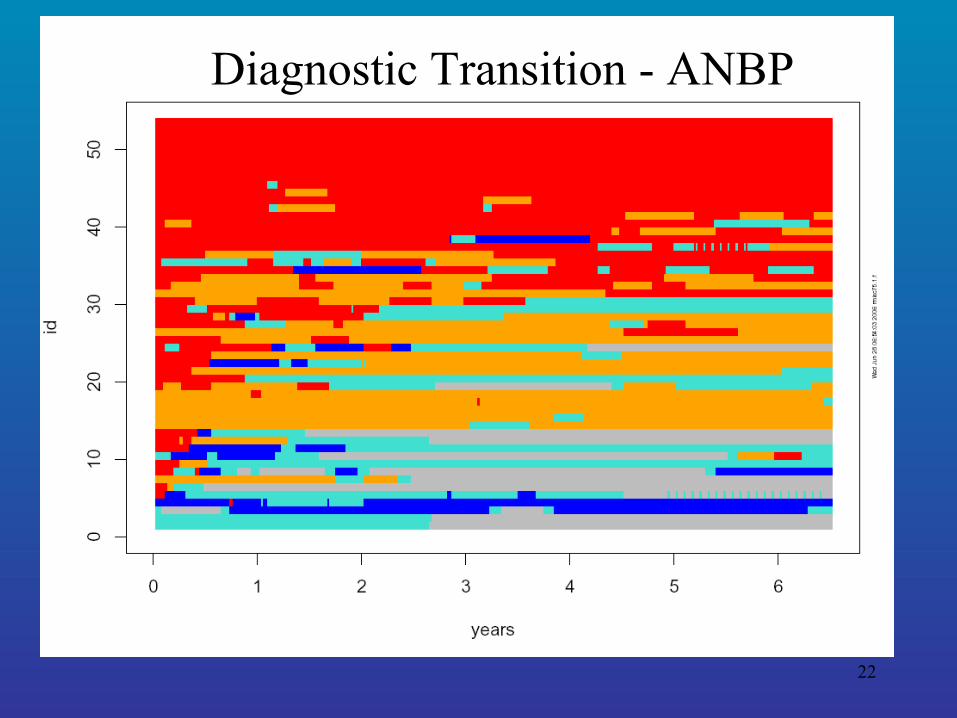
22
Diagnostic Transition - ANBP
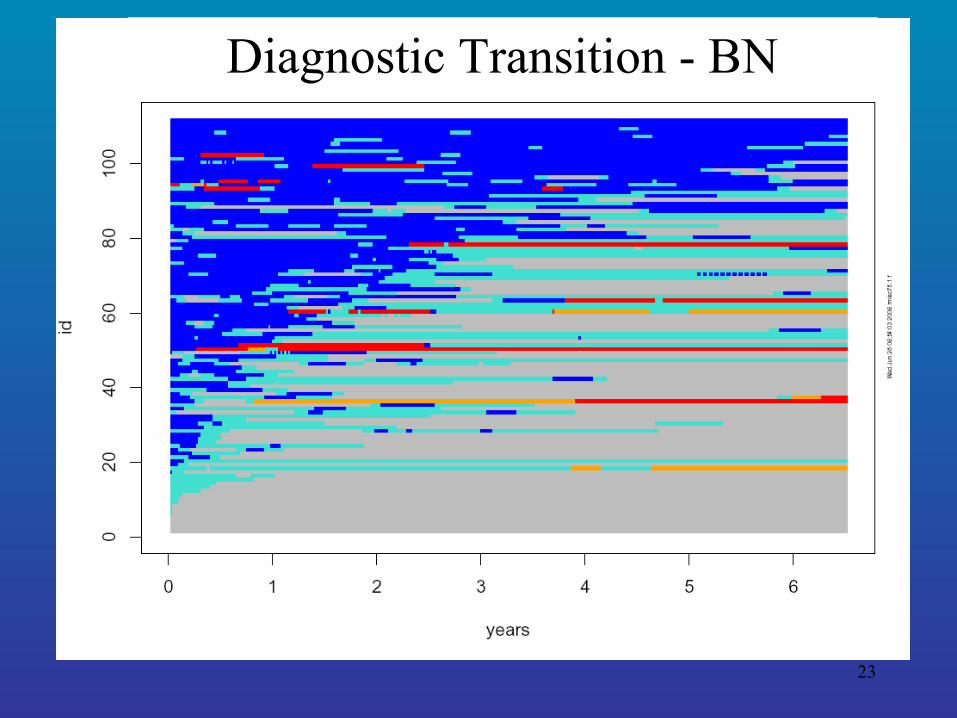
23
Diagnostic Transition - BN
24
EDNOS w/ history of AN or BN
• Often transitions to recovered
• Some transition to AN and/or BN (i.e., relapse)

25
• MGH Longitudinal Study of a treatment seeking sample:
– Supports validation of AN and BN
– Does not support EDNOS w/ history of AN or BN or current ANR/ANBP subtyping
Summary

26
Suggested changes for the DSM-V
• ANR should not be diagnosed if previous history of ANBP or BN
• AN should – No longer include amenorrhea – Include suggested weight criterion < 90% IBW
• BN criteria should be modified to include minimum binge and purge frequency of 1-2x/month
• EDNOS should not be dxed if previous history of AN or BN