how soil characteristics and water quality influence the … · biogeochemistry (2007)...
TRANSCRIPT
ORIGINAL PAPER
How soil characteristics and water quality influence thebiogeochemical response to flooding in riverine wetlands
Roos Loeb Æ Erika van Daalen Æ Leon P. M. Lamers ÆJan G. M. Roelofs
Received: 29 September 2006 / Accepted: 18 May 2007 / Published online: 27 July 2007
� Springer Science+Business Media B.V. 2007
Abstract Although phosphate concentrations have
been reduced, the rivers Meuse and Rhine are still
polluted with sulphate, which most probably affects
vegetation development in newly created riverine
wetlands. The influence of flooding with river water
rich in sulphate was tested on three soil types from
floodplains of the river Meuse using flow-through and
batch experiments. Soils were selected for contrasting
concentrations of iron and organic matter and orig-
inated from a floating fen (iron-poor, organic), an
alder carr (iron-rich, organic) and a clay pit (iron-
rich, low in organic matter). Flooding induced
mobilisation of phosphate. Sulphate only enhanced
this effect in the alder carr soil, where sulphide and
phosphate competed for binding to iron. Only in the
floating fen soil did the addition of sulphate result in
the formation of free sulphide, which reduced the
growth of Glyceria maxima, serving as a phytometer.
In addition, the floating soil started to sink, due to
falling methane concentrations. In the different soil
types methane production was hampered by the
presence of more favourable electron acceptors such
as sulphate in the water and Fe(III) in the soil. It was
concluded that the effects of inundation with sul-
phate-polluted water strongly depend on the soil type:
under iron-poor circumstances, free sulphide may
accumulate, leading to phytotoxicity, while in soils
rich in iron, sulphide toxicity is prevented, but
phosphate availability may be increased. In addition,
shortage of easily degradable organic matter can limit
the formation of potential toxicants such as ammo-
nium, iron and sulphide. Results are discussed in
terms of their implications for nature management.
Keywords Buoyancy � Eutrophication � Flooding �Floodplain � Methane � Sulphate � Water storage
Introduction
Although great efforts have been made since the
1970s to improve water quality in the rivers Meuse
and Rhine, concentrations of many major ions are
still elevated compared to their natural background
values. Measures such as the introduction of waste-
water treatment plants have effectively reduced the
concentrations of ammonium and phosphorus in the
river water, and decreased discharge from the indus-
try and decreased atmospheric sulphur deposition
have contributed to a decrease in concentrations of
sodium, chloride and sulphate, respectively. How-
ever, today’s average sulphate concentrations in the
river Meuse still lie around 600 mmol l�1 (Waterstat
2006), whereas measured historical concentrations
R. Loeb (&) � E. van Daalen � L. P. M. Lamers �J. G. M. Roelofs
Department of Aquatic Ecology and Environmental
Biology, Institute for Water and Wetland Research,
Radboud University Nijmegen, Toernooiveld 1 6525 ED,
The Netherlands
e-mail: [email protected]
123
Biogeochemistry (2007) 85:289–302
DOI 10.1007/s10533-007-9135-x
(before 1900) and calculated background concentra-
tions for the Meuse and Rhine in the Netherlands are
approximately 300 mmol l�1. Concentrations of
nitrate (around 50 mmol l�1) are also still elevated
compared to their background values (5 mmol l�1)
(Van der Weijden and Middelburg 1989; Van den
Brink et al. 1991; Van den Brink 1994). This article
focuses on the effects of the elevated sulphate
concentrations.
It is known that sulphate pollution can play an
important role in the deterioration of freshwater
wetlands, especially in peatlands (Roelofs 1991;
Smolders et al. 1996, 2003; Lamers et al. 1998,
1999, 2001, 2002a, b; Lucassen et al. 2004). Under
anaerobic circumstances, for instance during flood-
ing, sulphate is reduced to sulphide in the absence of
more favourable electron acceptors such as oxygen or
nitrate. Free sulphide can be very toxic to wetland
plant species, as has for instance been shown for
Stratiotes aloides (Smolders and Roelofs 1996) and
Caltha palustris (Van der Welle et al. 2007).
However, sulphide has a high affinity for binding to
iron, which decreases the availability of free sulphide
and hence its toxicity (Van der Welle et al. 2006). As
the affinity to iron is higher for sulphide than for
phosphate, the latter can be released during this
process, causing eutrophication (Caraco et al. 1989;
Roden and Edmonds 1997; Lamers et al. 1998). This
mobilisation of phosphate is added to the release of
phosphate that takes place upon reduction of iron
after the flooding of semi-terrestrial wetlands, such as
floodplains. After inundation and the depletion of
oxygen from the pore water, iron can be used as an
electron acceptor for the oxidation of organic matter.
This causes a partial release of the phosphate that was
bound to iron(hydr)oxides under aerobic circum-
stances (Patrick and Khalid 1974). It is, however,
unclear if sulphate has similar detrimental effects on
floodplain biogeochemistry.
Besides the phytotoxic and eutrophying effects of
sulphate after reduction, sulphate is also known to
inhibit bacterial methane production (Cappenberg
1974; Abram and Nedwell 1978; Lovley and Klug
1983; Westermann and Ahring 1987; Prieme 1994;
Scholten and Stams 1995). It has been demonstrated
that as a result of this, floating Sphagnum bog rafts,
which depend on methane for floatation, sink under
the influence of increased sulphate concentrations
(Lamers et al. 1999; Smolders et al. 2002). As
floating fen mats present in riverine systems also
depend on methane for buoyancy (Hogg and Wein
1988a; Swarzenski et al. 1991; Sasser et al. 1996), a
similar effect of elevated sulphate concentrations can
be assumed to exist, although this has never been
reported. Floating mats form an important phase in
terrestrialisation and hence in vegetation succession
of peatlands (Tallis 1973; Beltman et al. 1996). They
can be found in river deltas across the world, such as
in the rivers Mississippi, Danube, Nile and Amazon
(Hogg and Wein 1988b; Sasser et al. 1996).
During the last decade, many new wetlands have
been created in the floodplains of large rivers,
including the rivers Rhine and Meuse, either for the
purpose of ecological restoration, or for flood risk
reduction, or for a combination of both objectives.
Plans for riverine wetland creation often ignore river
water quality and soil quality, although it may be
hypothesised that the effects of sulphate pollution
that have been found in peatlands may also play an
important role in riverine floodplains. Since concen-
trations of iron and of easily degradable organic
matter are expected to act as key factors differenti-
ating the effects of sulphate pollution, we chose to
examine three different floodplain soils from the river
Meuse, differing in iron and organic matter contents.
Materials and methods
Site description
Three different floodplain areas along the river Meuse
in the Netherlands were selected for their soil
characteristics. Figure 1 depicts the locations of the
sites. The first soil (F) was taken from a floating fen at
the bank of an old oxbow lake (the ‘Oude Maas’)
anchored to the river dike (N 47858043.0400 E
3818056.38@). This lake discharges its water into the
Meuse and only comes into direct contact with the
river water during floods. The soil consists mostly of
roots and plant litter. The vegetation type it supports,
which is dominated by the fern Thelypteris palustris,
has become very rare in Dutch floodplains.
A vegetation releve from 1954 shows that at that
time, the oxbow lake was partly vegetated by
Stratiotes aloides (Van Donselaar 1961). The second
soil (C) was taken from the shores of a recently dug
clay pit (N 47858041.42@ E 3818058.26@) in the
290 Biogeochemistry (2007) 85:289–302
123

Romeinenweerd nature reserve. In this area, several
small lakes have been excavated for the purpose of
nature restoration and flood risk reduction. The
excavated clay was used for the construction of flood
protection systems in neighbouring towns. The lake
from which we collected the soil, is a stagnant water
body, which suffered severe eutrophication in the hot
summer of 2003, when a bloom of cyanobacteria led
to high mortality of fish and waterfowl (Pollux and
Pollux 2004). No vegetation was present at the spot
from which we took the soil. The third soil (A) was
taken from a black alder carr (N 47858042.27@ E
3818057.98@), called Heuloerbroek, within the winter
bed of the river Meuse. The site receives discharge of
iron-rich groundwater from higher situated areas. The
top soil consists of litter, mainly from Alnus
glutinosa.
Soil characteristics are summarised in Table 1.
The clay soil was poor in organic matter (about 5%),
while the other two soils were mostly organic. Both
the alder carr and clay soils had a high concentration
of iron, but the oxalate-extractable pool, which is
regarded as the amorphous iron that is available for
bacterial reduction, was much lower in the clay soil,
both in absolute and in relative terms. The iron
concentration of the floating fen soil was very low.
Both total P and Olsen-extractable P were high in the
alder carr soil.
Experimental set-up
Aquarium experiment
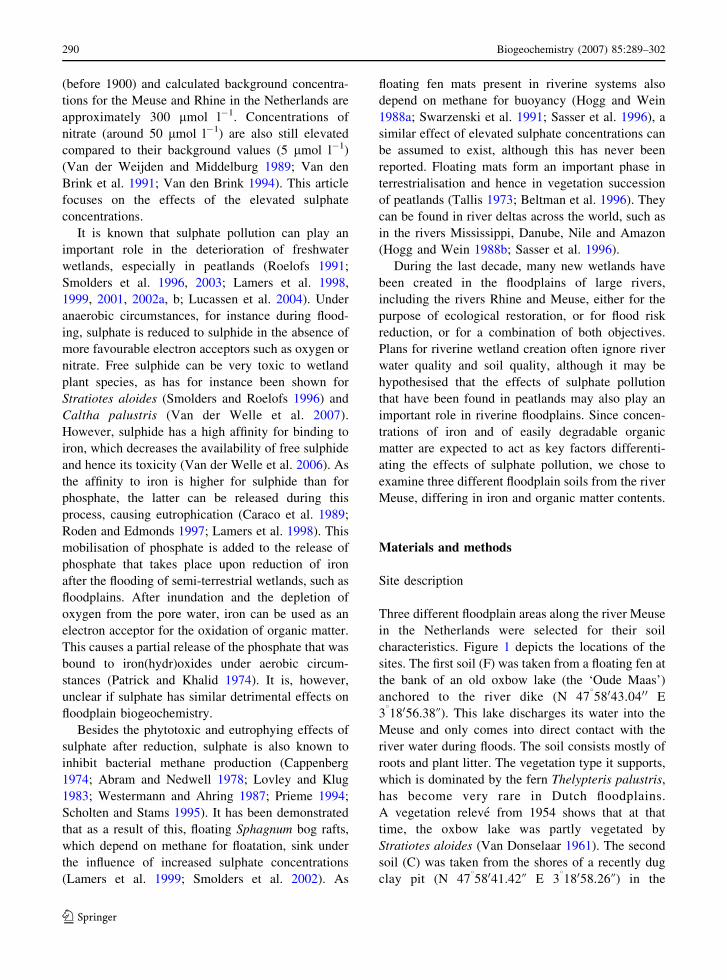
Twenty-four 9-l aquaria were filled with a 10-cm
layer (1/3 of the aquarium) of carefully mixed soil
(four replicates) (Fig. 2) and kept in a water basin at a
temperature of 208C in a climate chamber at a light
intensity of 200 mmol m�2 s�1 (Hortilux Schreder
HPS 400 W) for 12 h a day. Two 10-cm pore water
samplers (Rhizon SMS -10 cm; Eijkelkamp Agri-
search Equipment, The Netherlands) were placed
diagonally in the soil of each aquarium. A 5-10 cm
layer of surface water collected in the field was added
on top of the soil. After 1 week, the soils were further
inundated with artificial river water containing either
1 mmol l�1 SO4 (as Na2SO4) or no SO4 (Table 2),
from 10 l stocks, each connected to their own
aquarium. The medium was pumped through the
aquaria at a speed of 10 l per week. Three shoots of
Glyceria maxima and 0.25 g of Lemna minor,
collected in the field, were added to each aquarium
as phytometers. Other plant species than G. maxima,
L. minor or algae were carefully removed from the
aquaria. Pore water samples were taken by connect-
ing 100-ml vacuum bottles to the rhizon samplers.
Samples of both pore water samplers were pooled per
aquarium to diminish the effects of heterogeneity.
Surface water samples were filtered (Whatman GF/
C). After 12 weeks, the aboveground biomass of G.
maxima and the floating L. minor and algae biomass
were harvested. In the aquaria with the alder carr soil,
algae were harvested more often, to prevent die-off of
G. maxima from light limitation.
Decomposition experiment
Fifty g portions of fresh soil were transferred to 350-
ml glass bottles. The bottles were filled up to 170 ml
with the same medium as used in the aquarium
experiment and preflushed with N2 to remove O2
from the water. The headspace of the bottles was also
flushed with N2 before they were sealed with airtight
F
AC
Fig. 1 Location of the sampling sites within the Netherlands.
A = alder carr, C = clay pit, F = floating fen
Biogeochemistry (2007) 85:289–302 291
123
rubber stoppers. We will refer to this soil and water
suspension as slurry. Analyses were done in quadru-
plicate. Initial concentrations in the slurry water were
determined by filling smaller bottles with 25 g of
fresh soil and filling them up to 85 ml with medium.
These bottles were shaken overnight. Slurry water
samples were taken by pore water samplers (Rhizon
SMS-5 cm; Eijkelkamp Agrisearch Equipment, The
Netherlands). Decomposition bottles were shaken in
the dark at 208C. Samples from the headspace were
taken twice a week with 1-ml syringes and were
analysed instantly for CH4 and CO2. After 42 days,
slurry water samples were taken and the experiment
was ended. Potential production rates were calculated
by linear regression of the net production in the linear
phase of the production rate of CH4 or CO2. Potential
decomposition rates were calculated in the same way,
expressed as the C production rates in the linear
phase of the concentration build-up of the sum of
CH4 and CO2. This does not equal the sum of the
potential CH4 and CO2 production rates, because of
the difference in lag phase. Potential net release rates
were calculated from the difference between the pore
water concentrations at the start and the end of the
experiment, divided by the time elapsed.
Chemical analyses
Immediately after collection of the pore water, the
concentration of free sulphide was determined in a
10 ml subsample, fixed with S2� antioxidant buffer
containing NaOH, NaEDTA and ascorbic acid (Van
Gemerden 1984). S2� was detected using an S2� ion-
specific Ag electrode and a double junction calomel
reference electrode (Thermo Orion) (Van Gemerden
1984). pH was measured with a radiometer Copen-
hagen type PHM 82 standard pH meter. Alkalinity
was determined by titrating 10 ml of sample with
0.01 mmol l�1 HCl down to pH 4.2. For the ICP
analyses, 1.7% of concentrated nitric acid was added
to the samples to keep the oxidised iron in solution.
Samples were stored in polypropylene tubes at 48C.
For the other analyses, 0.12 g citric acid/l was added
to the samples. They were stored in iodated polyeth-
ylene bottles at �248C until further analysis. Total
concentrations of Ca, Mg, P, Fe and S were analysed
by ICP-MS (X series, Thermo Electron Corporation
Table 1 Soil
characteristicsSoil Organic matter
content (%)
Oxalate-extractable
Fe (mmol g�1 dw)
Total Fe
(mmol g�1 dw)
P-Olsen
(mmol g�1 dw)
Total P
(mmol g�1 dw)
Floating
fen
83 50 100 3 30
Clay pit 5 104 610 1 24
Alder
carr
52 950 1011 5 104
sediment
water
overflow
rhizon samplers
inflow
Fig. 2 Experimental set-up. Picture: Lidwien van der Horst
Table 2 Concentrations of macro-ions in the artificial river
water treatments, with and without sulphate
Medium �SO4
(mmol l�1)
Medium + SO4
(mmol l�1)
Na 2,000 4,000
Ca 1,300 1,300
Mg 250 250
Cl 3,100 3,100
HCO3 2,000 2,000
SO4 0 1,000
292 Biogeochemistry (2007) 85:289–302
123
and ICP-OES (IRIS Intrepid II XDL, Thermo Electron
Corporation). Total Fe measured in the pore water was
assumed to be Fe(II), since this is the dominant
soluble species at the pH values we measured. Total S
was assumed to be SO4 (if no sulphide was present),
as, at the concentrations occurring in our soils, only a
very small part will be in organic form. This was
confirmed by parallel SO4 analysis of part of the
samples with methylthymol blue and BaCl2
(Bran + Luebbe, AutoAnalyser 3, Digital Colorime-
ter). o-PO4 (Technicon AutoAnalyser II), NH4+, NO3
�
(+NO2�) and Cl� (Bran + Luebbe AutoAnalyser 3)
were analysed colorimetrically using ammonium
molybdate, salicylate, hydrazine sulphate and fer-
riammonium sulphate, respectively. CO2 and CH4
were measured by infrared analysis (ABB Advance
Optima Infrared Gas Analyser).
In order to determine the total concentrations of
elements in plant and soil materials, 200 mg of
homogenised and dried sample was digested for
17 min with 4 ml concentrated HNO3 and 1 ml 30%
H2O2 (Milestone microwave MLS 1200 Mega). C
and N concentrations in the plant material (20 mg)
were determined with a CNS analyser (Carbo Erla
Instruments NA 1500).
Organic matter content of the soils was determined
by loss-on-ignition (4 h, 5508C). Soil extractions
were performed on fresh soils and corrected for
moisture content afterwards, after drying (24 h,
1058C). The concentration of amorphous Fe, which
is supposed to represent the fraction available for
microbial Fe reduction, was determined by oxalate
extraction (2.5 g of soil shaken for 2 h with 30 ml of a
solution containing 16.2 g of (COONH4)2�H2O and
10.9 g of (COOH2)�2H2O per l) (Schwertmann 1964)
and plant-available P by bicarbonate extraction (5 g
of soil shaken with 100 ml of 0.5 M NaHCO3) (Olsen
et al. 1954).
Statistics
All concentrations were log (+1) transformed to
improve their fit to a normal distribution, except for
floatation measurements. All statistics were calculated
with SPSS 13.0 (SPSS Inc., 2004). Effects of time
series were tested with GLM repeated measures, using
Greenhouse-Geisser corrections if terms of sphericity
were not met in Mauchly’s sphericity test. Effects of
sulphate addition on the specific soil types were
assessed with an independent samples T-test using
data of the last measurement, unless stated otherwise.
Effects of sulphate on concentrations and production
rates of methane and on iron release were tested with 1-
tailed tests, because the direction of the effect was
already known. Differences between soil types were
assessed by univariate ANOVA. Decomposition rates
were calculated over the linear range of CO2 or CH4
production by linear regression. Significance was
accepted at a confidence level of P � 0.05.
Results
Aquarium experiment
Pore water and surface water
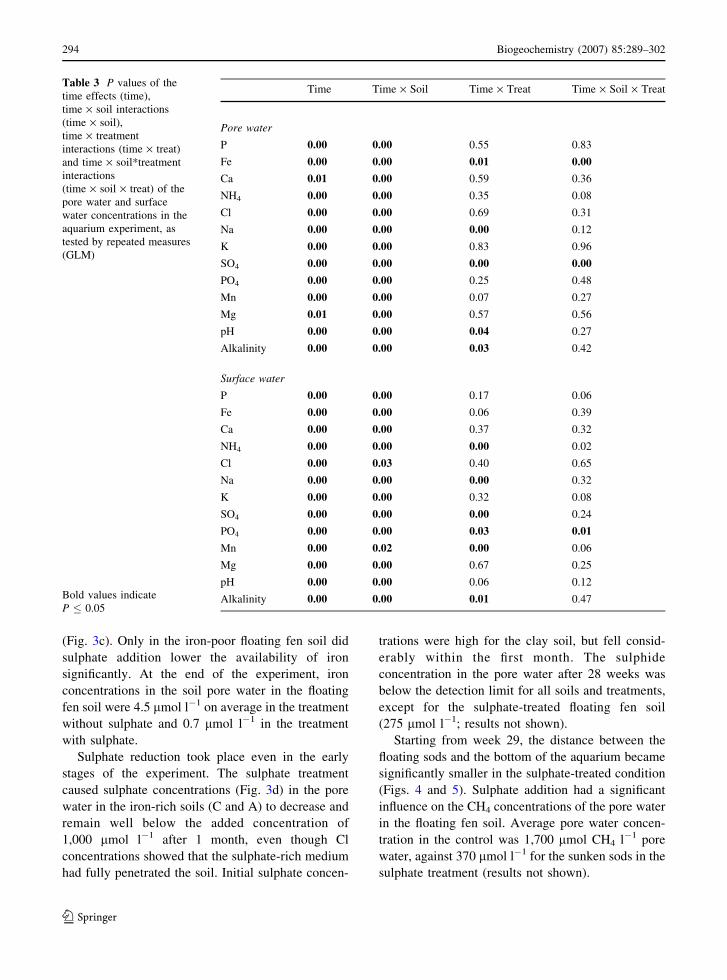
Table 3 summarises the results of the repeated
measures analyses of the concentrations of elements
and compounds in the pore water and surface water.
From this table it can be seen that concentrations
changed over time for all elements we measured
(time effect). These changes were different for the
different soil types, as indicated by the significant
time · soil interactions. Major changes in concentra-
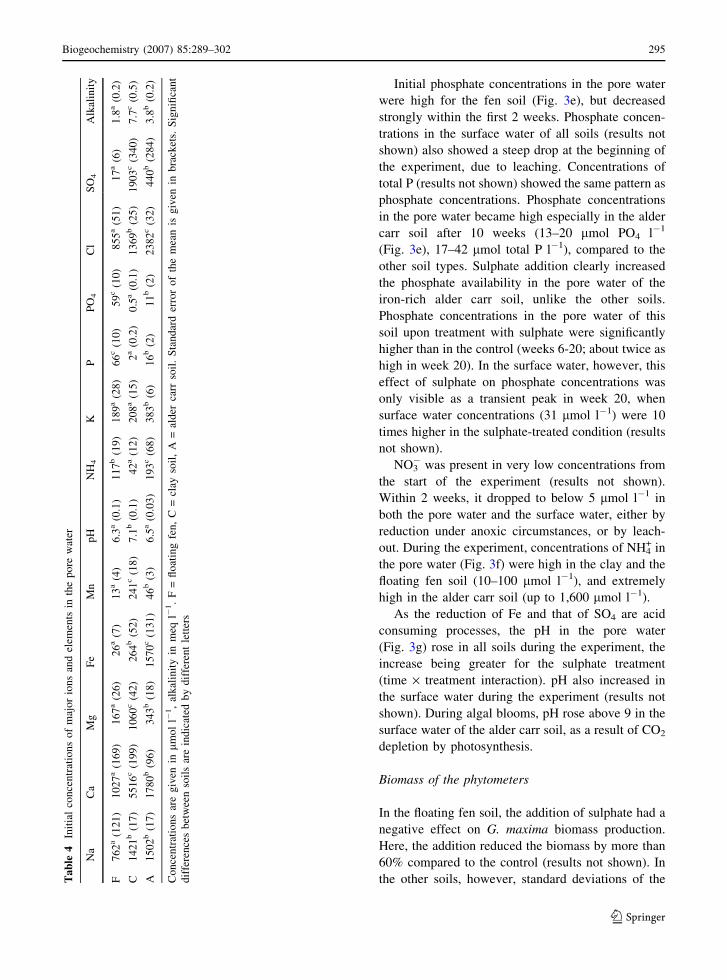
tions are discussed below. Initial concentrations of all
measured elements and ions are given in Table 4.
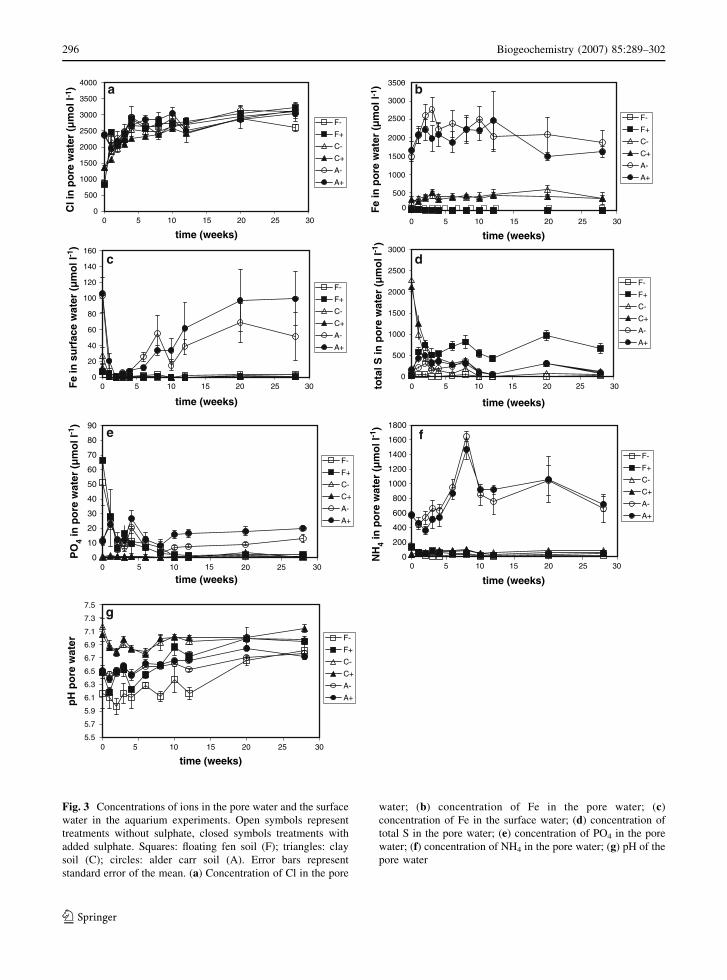
The artificial river water replaced the original
surface water in the aquarium within 2 weeks, as was
indicated by the Cl� concentration (results not
shown), which can be used as an inert tracer. Within
1 month, the river water had penetrated all soil types,
even the poorly permeable heavy clay soil, as can be
seen from the Cl� concentrations in the pore water
(Fig. 3a).
The presence of high concentrations of soluble Fe
in the pore water of the alder carr and clay soils right
from the start of the experiment (Fig. 3b) showed that
conditions were anoxic from the beginning. Concen-
trations of Fe in the pore water correlated with those
of amorphous iron in the soil determined by oxalate
extraction. In the floating fen soil, hardly any iron
was present in the pore water. In the clay soil, the Fe
concentration in the pore water stabilised at
400 mmol l�1. In the alder carr soil, concentrations
were extremely high, varying between 1,500 and
2,500 mmol l�1. Concentrations of Fe in the surface
water remained low, except for the alder carr soil
Biogeochemistry (2007) 85:289–302 293
123
(Fig. 3c). Only in the iron-poor floating fen soil did
sulphate addition lower the availability of iron
significantly. At the end of the experiment, iron
concentrations in the soil pore water in the floating
fen soil were 4.5 mmol l�1 on average in the treatment
without sulphate and 0.7 mmol l�1 in the treatment
with sulphate.
Sulphate reduction took place even in the early
stages of the experiment. The sulphate treatment
caused sulphate concentrations (Fig. 3d) in the pore
water in the iron-rich soils (C and A) to decrease and
remain well below the added concentration of
1,000 mmol l�1 after 1 month, even though Cl
concentrations showed that the sulphate-rich medium
had fully penetrated the soil. Initial sulphate concen-
trations were high for the clay soil, but fell consid-
erably within the first month. The sulphide
concentration in the pore water after 28 weeks was
below the detection limit for all soils and treatments,
except for the sulphate-treated floating fen soil
(275 mmol l�1; results not shown).
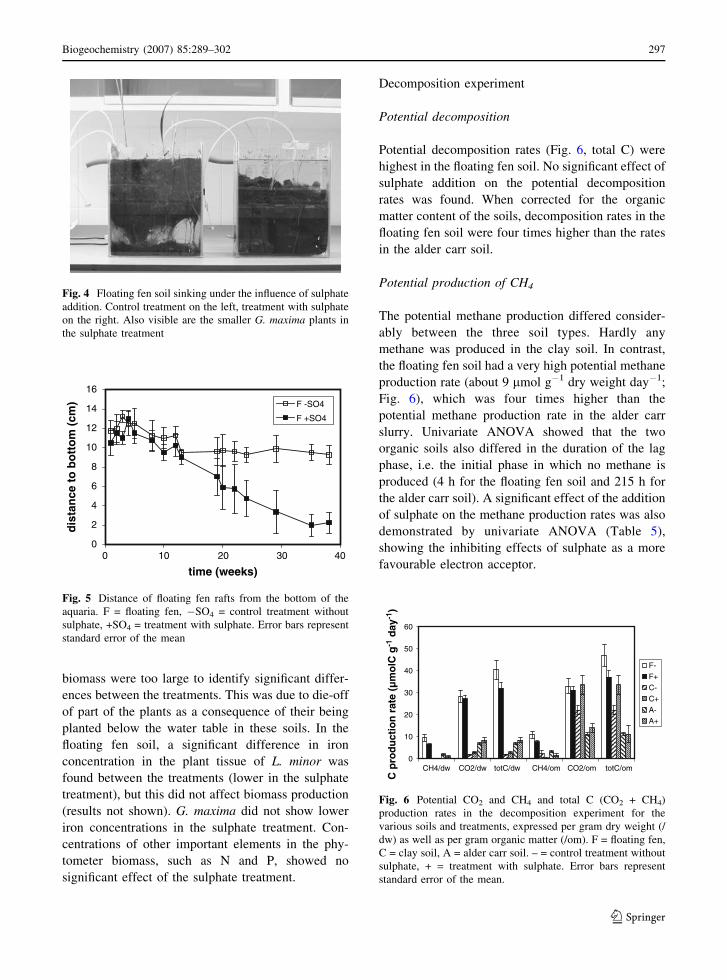
Starting from week 29, the distance between the
floating sods and the bottom of the aquarium became
significantly smaller in the sulphate-treated condition
(Figs. 4 and 5). Sulphate addition had a significant
influence on the CH4 concentrations of the pore water
in the floating fen soil. Average pore water concen-
tration in the control was 1,700 mmol CH4 l�1 pore
water, against 370 mmol l�1 for the sunken sods in the
sulphate treatment (results not shown).
Table 3 P values of the
time effects (time),
time · soil interactions
(time · soil),
time · treatment
interactions (time · treat)
and time · soil*treatment
interactions
(time · soil · treat) of the
pore water and surface
water concentrations in the
aquarium experiment, as
tested by repeated measures
(GLM)
Bold values indicate
P � 0.05
Time Time · Soil Time · Treat Time · Soil · Treat
Pore water
P 0.00 0.00 0.55 0.83
Fe 0.00 0.00 0.01 0.00
Ca 0.01 0.00 0.59 0.36
NH4 0.00 0.00 0.35 0.08
Cl 0.00 0.00 0.69 0.31
Na 0.00 0.00 0.00 0.12
K 0.00 0.00 0.83 0.96
SO4 0.00 0.00 0.00 0.00
PO4 0.00 0.00 0.25 0.48
Mn 0.00 0.00 0.07 0.27
Mg 0.01 0.00 0.57 0.56
pH 0.00 0.00 0.04 0.27
Alkalinity 0.00 0.00 0.03 0.42
Surface water
P 0.00 0.00 0.17 0.06
Fe 0.00 0.00 0.06 0.39
Ca 0.00 0.00 0.37 0.32
NH4 0.00 0.00 0.00 0.02
Cl 0.00 0.03 0.40 0.65
Na 0.00 0.00 0.00 0.32
K 0.00 0.00 0.32 0.08
SO4 0.00 0.00 0.00 0.24
PO4 0.00 0.00 0.03 0.01
Mn 0.00 0.02 0.00 0.06
Mg 0.00 0.00 0.67 0.25
pH 0.00 0.00 0.06 0.12
Alkalinity 0.00 0.00 0.01 0.47
294 Biogeochemistry (2007) 85:289–302
123
Initial phosphate concentrations in the pore water
were high for the fen soil (Fig. 3e), but decreased
strongly within the first 2 weeks. Phosphate concen-
trations in the surface water of all soils (results not
shown) also showed a steep drop at the beginning of
the experiment, due to leaching. Concentrations of
total P (results not shown) showed the same pattern as
phosphate concentrations. Phosphate concentrations
in the pore water became high especially in the alder
carr soil after 10 weeks (13–20 mmol PO4 l�1
(Fig. 3e), 17–42 mmol total P l�1), compared to the
other soil types. Sulphate addition clearly increased
the phosphate availability in the pore water of the
iron-rich alder carr soil, unlike the other soils.
Phosphate concentrations in the pore water of this
soil upon treatment with sulphate were significantly
higher than in the control (weeks 6-20; about twice as
high in week 20). In the surface water, however, this
effect of sulphate on phosphate concentrations was
only visible as a transient peak in week 20, when
surface water concentrations (31 mmol l�1) were 10
times higher in the sulphate-treated condition (results
not shown).
NO3� was present in very low concentrations from
the start of the experiment (results not shown).
Within 2 weeks, it dropped to below 5 mmol l�1 in
both the pore water and the surface water, either by
reduction under anoxic circumstances, or by leach-
out. During the experiment, concentrations of NH4+ in
the pore water (Fig. 3f) were high in the clay and the
floating fen soil (10–100 mmol l�1), and extremely
high in the alder carr soil (up to 1,600 mmol l�1).
As the reduction of Fe and that of SO4 are acid
consuming processes, the pH in the pore water
(Fig. 3g) rose in all soils during the experiment, the
increase being greater for the sulphate treatment
(time · treatment interaction). pH also increased in
the surface water during the experiment (results not
shown). During algal blooms, pH rose above 9 in the
surface water of the alder carr soil, as a result of CO2
depletion by photosynthesis.
Biomass of the phytometers
In the floating fen soil, the addition of sulphate had a
negative effect on G. maxima biomass production.
Here, the addition reduced the biomass by more than
60% compared to the control (results not shown). In
the other soils, however, standard deviations of theTa
ble
4In
itia
lco
nce
ntr
atio
ns
of
maj
or
ion
san
del
emen
tsin
the
po
rew
ater
Na
Ca
Mg
Fe
Mn
pH
NH
4K
PP
O4
Cl
SO
4A
lkal
init
y
F7
62
a(1
21
)1
02
7a
(16
9)
16
7a
(26
)2
6a
(7)
13
a(4
)6
.3a
(0.1
)1
17
b(1
9)
18
9a
(28
)6
6c
(10
)5
9c
(10
)8
55
a(5
1)
17
a(6
)1
.8a
(0.2
)
C1
42
1b
(17
)5
51
6c
(19
9)
10
60
c(4
2)
26
4b
(52
)2
41
c(1
8)
7.1
b(0
.1)
42
a(1
2)
20
8a
(15
)2
a(0
.2)
0.5
a(0
.1)
13
69
b(2
5)
19
03
c(3
40
)7
.7c
(0.5
)
A1
50
2b
(17
)1
78
0b
(96
)3
43
b(1
8)
15
70
c(1
31
)4
6b
(3)
6.5
a(0
.03
)1
93
c(6
8)
38
3b
(6)
16
b(2
)1
1b
(2)
23
82
c(3
2)
44
0b
(28
4)
3.8
b(0
.2)
Co
nce
ntr
atio
ns
are
giv
enin
mmo
ll�
1,
alk
alin
ity
inm
eql�
1.
F=
flo
atin
gfe
n,
C=
clay
soil
,A
=al
der
carr
soil
.S
tan
dar
der
ror
of
the
mea
nis
giv
enin
bra
cket
s.S
ign
ifica
nt
dif
fere
nce
sb
etw
een
soil
sar
ein
dic
ated
by
dif
fere
nt
lett
ers
Biogeochemistry (2007) 85:289–302 295
123
0
500
1000
1500
2000
2500
3000
3500
4000
0 5 10 15 20 25 30
time (weeks)
0
500
1000
1500
2000
2500
3000
3500
0 5 10 15 20 25 30
time (weeks)
time (weeks) time (weeks)
time (weeks) time (weeks)
Cl i
n p
ore
wat
er (
µm
ol l
-1)
F-
F+
C-
C+
A-
A+
F-
F+
C-
C+
A-
A+
F-
F+
C-
C+
A-
A+
F-
F+
C-
C+
A-
A+
F-
F+
C-
C+
A-
A+
F-
F+
C-
C+
A-
A+
F-
F+
C-
C+
A-
A+
Fe
in p
ore
wat
er (
µm
ol l
-1)
0
20
40
60
80
100
120
140
160
0 5 10 15 20 25 30 0 5 10 15 20 25 30
0 5 10 15 20 25 30 0 5 10 15 20 25 30
Fe
in s
urf
ace
wat
er (
µm
ol l
-1)
0
500
1000
1500
2000
2500
3000
tota
l S in
po
re w
ater
(µ
mo
l l-1
)
0
10
20
30
40
50
60
70
80
90
PO
4 in
po
re w
ater
(µ
mo
l l-1
)
0
200
400
600
800
1000
1200
1400
1600
1800
NH
4 in
po
re w
ater
(µ
mo
l l-1
)
7.5
7.3
7.1
6.9
6.7
6.5
6.3
6.1
5.9
5.7
5.50 5 10 15 20 25 30
time (weeks)
pH
po
re w
ater
a b
dc
e
g
f
Fig. 3 Concentrations of ions in the pore water and the surface
water in the aquarium experiments. Open symbols represent
treatments without sulphate, closed symbols treatments with
added sulphate. Squares: floating fen soil (F); triangles: clay
soil (C); circles: alder carr soil (A). Error bars represent
standard error of the mean. (a) Concentration of Cl in the pore
water; (b) concentration of Fe in the pore water; (c)
concentration of Fe in the surface water; (d) concentration of
total S in the pore water; (e) concentration of PO4 in the pore
water; (f) concentration of NH4 in the pore water; (g) pH of the
pore water
296 Biogeochemistry (2007) 85:289–302
123
biomass were too large to identify significant differ-
ences between the treatments. This was due to die-off
of part of the plants as a consequence of their being
planted below the water table in these soils. In the
floating fen soil, a significant difference in iron
concentration in the plant tissue of L. minor was
found between the treatments (lower in the sulphate
treatment), but this did not affect biomass production
(results not shown). G. maxima did not show lower
iron concentrations in the sulphate treatment. Con-
centrations of other important elements in the phy-
tometer biomass, such as N and P, showed no
significant effect of the sulphate treatment.
Decomposition experiment
Potential decomposition
Potential decomposition rates (Fig. 6, total C) were
highest in the floating fen soil. No significant effect of
sulphate addition on the potential decomposition
rates was found. When corrected for the organic
matter content of the soils, decomposition rates in the
floating fen soil were four times higher than the rates
in the alder carr soil.
Potential production of CH4
The potential methane production differed consider-
ably between the three soil types. Hardly any
methane was produced in the clay soil. In contrast,
the floating fen soil had a very high potential methane
production rate (about 9 mmol g�1 dry weight day�1;
Fig. 6), which was four times higher than the
potential methane production rate in the alder carr
slurry. Univariate ANOVA showed that the two
organic soils also differed in the duration of the lag
phase, i.e. the initial phase in which no methane is
produced (4 h for the floating fen soil and 215 h for
the alder carr soil). A significant effect of the addition
of sulphate on the methane production rates was also
demonstrated by univariate ANOVA (Table 5),
showing the inhibiting effects of sulphate as a more
favourable electron acceptor.
0
10
20
30
40
50
60
CH4/dw CO2/dw totC/dw CH4/om CO2/om totC/om
C p
rod
uct
ion
rat
e (µ
mo
lC g
-1 d
ay-1
)
F-F+C-C+A-A+
Fig. 6 Potential CO2 and CH4 and total C (CO2 + CH4)
production rates in the decomposition experiment for the
various soils and treatments, expressed per gram dry weight (/
dw) as well as per gram organic matter (/om). F = floating fen,
C = clay soil, A = alder carr soil. – = control treatment without
sulphate, + = treatment with sulphate. Error bars represent
standard error of the mean.
Fig. 4 Floating fen soil sinking under the influence of sulphate
addition. Control treatment on the left, treatment with sulphate
on the right. Also visible are the smaller G. maxima plants in
the sulphate treatment
0
2
4
6
8
10
12
14
16
0 10 20 30 40
time (weeks)
dis
tan
ce t
o b
ott
om
(cm
) F -SO4
F +SO4
Fig. 5 Distance of floating fen rafts from the bottom of the
aquaria. F = floating fen, �SO4 = control treatment without
sulphate, +SO4 = treatment with sulphate. Error bars represent
standard error of the mean
Biogeochemistry (2007) 85:289–302 297
123
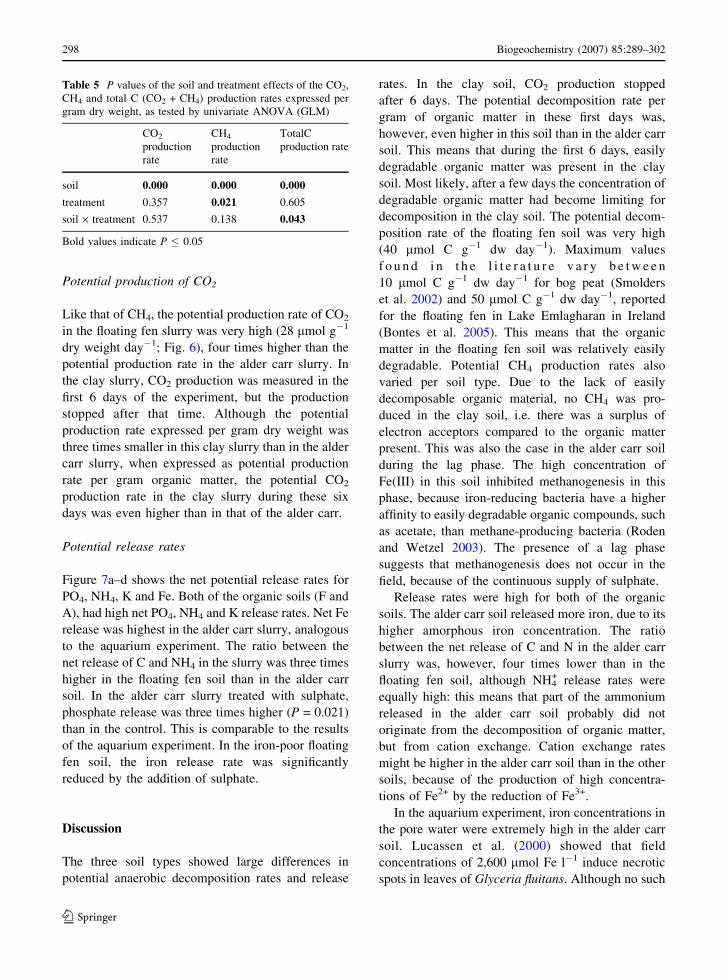
Potential production of CO2
Like that of CH4, the potential production rate of CO2
in the floating fen slurry was very high (28 mmol g�1
dry weight day�1; Fig. 6), four times higher than the
potential production rate in the alder carr slurry. In
the clay slurry, CO2 production was measured in the
first 6 days of the experiment, but the production
stopped after that time. Although the potential
production rate expressed per gram dry weight was
three times smaller in this clay slurry than in the alder
carr slurry, when expressed as potential production
rate per gram organic matter, the potential CO2
production rate in the clay slurry during these six
days was even higher than in that of the alder carr.
Potential release rates
Figure 7a–d shows the net potential release rates for
PO4, NH4, K and Fe. Both of the organic soils (F and
A), had high net PO4, NH4 and K release rates. Net Fe
release was highest in the alder carr slurry, analogous
to the aquarium experiment. The ratio between the
net release of C and NH4 in the slurry was three times
higher in the floating fen soil than in the alder carr
soil. In the alder carr slurry treated with sulphate,
phosphate release was three times higher (P = 0.021)
than in the control. This is comparable to the results
of the aquarium experiment. In the iron-poor floating
fen soil, the iron release rate was significantly
reduced by the addition of sulphate.
Discussion
The three soil types showed large differences in
potential anaerobic decomposition rates and release
rates. In the clay soil, CO2 production stopped
after 6 days. The potential decomposition rate per
gram of organic matter in these first days was,
however, even higher in this soil than in the alder carr
soil. This means that during the first 6 days, easily
degradable organic matter was present in the clay
soil. Most likely, after a few days the concentration of
degradable organic matter had become limiting for
decomposition in the clay soil. The potential decom-
position rate of the floating fen soil was very high
(40 mmol C g�1 dw day�1). Maximum values
f o u n d i n t h e l i t e r a t u r e v a r y b e t w e e n
10 mmol C g�1 dw day�1 for bog peat (Smolders
et al. 2002) and 50 mmol C g�1 dw day�1, reported
for the floating fen in Lake Emlagharan in Ireland
(Bontes et al. 2005). This means that the organic
matter in the floating fen soil was relatively easily
degradable. Potential CH4 production rates also
varied per soil type. Due to the lack of easily
decomposable organic material, no CH4 was pro-
duced in the clay soil, i.e. there was a surplus of
electron acceptors compared to the organic matter
present. This was also the case in the alder carr soil
during the lag phase. The high concentration of
Fe(III) in this soil inhibited methanogenesis in this
phase, because iron-reducing bacteria have a higher
affinity to easily degradable organic compounds, such
as acetate, than methane-producing bacteria (Roden
and Wetzel 2003). The presence of a lag phase
suggests that methanogenesis does not occur in the
field, because of the continuous supply of sulphate.
Release rates were high for both of the organic
soils. The alder carr soil released more iron, due to its
higher amorphous iron concentration. The ratio
between the net release of C and N in the alder carr
slurry was, however, four times lower than in the
floating fen soil, although NH4+ release rates were
equally high: this means that part of the ammonium
released in the alder carr soil probably did not
originate from the decomposition of organic matter,
but from cation exchange. Cation exchange rates
might be higher in the alder carr soil than in the other
soils, because of the production of high concentra-
tions of Fe2+ by the reduction of Fe3+.
In the aquarium experiment, iron concentrations in
the pore water were extremely high in the alder carr
soil. Lucassen et al. (2000) showed that field
concentrations of 2,600 mmol Fe l�1 induce necrotic
spots in leaves of Glyceria fluitans. Although no such
Table 5 P values of the soil and treatment effects of the CO2,
CH4 and total C (CO2 + CH4) production rates expressed per
gram dry weight, as tested by univariate ANOVA (GLM)
CO2
production
rate
CH4
production
rate
TotalC
production rate
soil 0.000 0.000 0.000
treatment 0.357 0.021 0.605
soil · treatment 0.537 0.138 0.043
Bold values indicate P � 0.05
298 Biogeochemistry (2007) 85:289–302
123

spots were found on Glyceria maxima in our exper-
iment, concentrations found in our experiment (up to
2,500 mmol Fe l�1) might still be toxic to sensitive
plant species in the field. It is known that reduced iron
from the soil pore water that diffuses towards the
surface water is oxidised and precipitates on the soil-
surface water interface due to the higher redox
potential of the water column (Cornwell and Kipphut
1992; Gunnars and Blomqvist 1997; Moore et al.
1998). This explains the low iron concentrations in
the surface water over the clay soil. In the alder carr
soil, pore water concentrations were so high that
exchange of Fe between the pore water and the
surface water took place. Since the surface water was
directly connected to the outflow of the aquarium,
concentrations in the surface water can be regarded as
outflow concentrations. The stability of the pore
water iron concentrations and the high weekly iron
outflow from the alder carr soil show that iron
reduction was still taking place at the end of the
experiment. Sulphate reduction rates were also high,
indicating simultaneous activity of Fe� and SO4�reducing micro-organisms (Sørensen 1982).
Iron reduction played a major role in the mobil-
isation of phosphate in this experiment. In the alder
carr soil, which was rich in iron as well as in total and
Olsen-extractable P, continuous iron reduction led to
high concentrations of P in the pore water. In this P-
rich soil, Fe(III) precipitations at the soil-water
interface did not trap all P, and increasing P
concentrations were also found in the surface water.
In the iron-poor floating fen soil, on the other hand,
most of the phosphate release might be attributed to
decomposition of organic material. The decomposi-
tion experiment showed a high decomposition rate in
this soil, as well as high concentrations of phosphate
in the slurry at the end of the experiment. There was,
however, a striking difference between the high
phosphate release in the slurry of the floating fen in
the incubation experiment and the low phosphate
concentrations in the pore water of the aquarium
experiment, whereas the P concentrations in the alder
0.14
0.12
0.10
0.08
0.06
0.04
0.02
0.00F- F+ C- C+ A- A+
*
* **
po
ten
tial
net
rel
ease
rat
e
po
ten
tial
net
rel
ease
rat
e p
ote
nti
al n
et r
elea
se r
ate
(µm
ol P
O4
g D
W-1
day
-1)
0.0
0.1
0.2
0.3
0.4
0.5
0.6
0.7
0.8
F- F+ C- C+ A- A+
(µm
ol N
H4
g D
W-1
day
-1)
0.8
0.7
0.6
0.5
0.4
0.3
0.2
0.1
0F- F+ C- C+ A- A+
po
ten
tial
net
rel
ease
rat
e (µ
mo
l Fe 4
g D
W-1
day
-1)
0
0.02
0.04
0.06
0.08
0.1
0.12
0.14
0.16
F- F+ C- C+ A- A+
(µm
ol K
g D
W-1
day
-1)
(c) (d)
(a) (b)
Fig. 7 Potential net release rates in the decomposition
experiment. F = floating fen, C = clay soil, A = alder carr
soil. – = control treatment without sulphate, + = treatment with
sulphate. Error bars represent standard error of the mean. (a)
Potential net release rate PO4; (b) potential net release rate
NH4; (c) potential net release rate K; (d) potential net release
rate Fe. Asterisks mark significant differents between treat-
ments within a soil
Biogeochemistry (2007) 85:289–302 299
123
carr were high in both experiments. One of the
explanations for this apparent discrepancy might be
the difference in phosphate leach-out between these
soils. Pore water phosphate concentrations in the
floating fen soil were high at the beginning of the
aquarium experiment, but decreased very fast after
the start of the experiment. Smolders et al. (2001)
showed that the release of phosphate from the pore
water of underwater soils to the water layer strongly
depends on the Fe:PO4 ratio in the pore water; below
a value of 1 (mol mol�1), they measured a strong
release of PO4 to the surface water. Fe:PO4 ratios in
our experiment were 0.3 (with sulphate) to 5 (without
sulphate) for the floating fen soil and 82 (with
sulphate) to 176 (without sulphate) for the alder carr
soil. This may have caused a higher phosphate release
to the water layer from the floating fen soil, and
hence a larger leach-out.
Due to the anaerobic conditions, NH4+ resulting
from the decomposition of organic matter could not
be nitrified, and accumulated in the pore water,
particularly in the alder carr soil. Another possible
source of the high NH4+ concentrations in the pore
water could be cation exchange of adsorbed NH4+ by
cations added with the artificial river water (Lucassen
et al. 2006), and in the alder carr soil also by the
mobilised Fe2+ originating from the reduction of
Fe(III)oxides. In the alder carr soil, ammonium
concentrations rose to 1,600 mmol l�1. Lucassen
et al. (2006) showed that the presence of target
vegetation in alder carrs is correlated with low
concentrations of ammonium (<200 mmol l�1).
Hence, the concentrations measured in this experi-
ment, if present in the field, could seriously hamper
the intended vegetation development.
The response of the different soils used in this
study to inundation with sulphate-rich river water in
the aquarium experiment varied substantially, reflect-
ing their soil characteristics. Sulphide, produced by
reduction of the added sulphate, was present in excess
relative to iron in the floating fen soil. Hence, the
binding of sulphide to iron reduced the availability of
soluble iron in this soil, both in the aquarium and in
the incubation experiment. As iron concentrations
were low, phosphate release as a result of the binding
of iron to sulphide was equally low. Part of the
sulphide produced could not be bound to iron and was
freely available in the pore water in toxic concentra-
tions, hampering the growth of the planted Glyceria
maxima. The sulphide concentrations we measured in
the pore water have been shown to be toxic to several
wetland plants (Smolders and Roelofs 1996; Van der
Welle et al. 2006, 2007). Moreover, the addition of
sulphate decreased the methane concentration in the
floating fen soil in the aquarium experiment and the
potential methane production rate in the incubation
experiment. Methane concentrations determined the
buoyancy of the floating fen, just as had been
demonstrated earlier for other floating fens and peat
bog rafts (Hogg and Wein 1988a; Swarzenski et al.
1991; Sasser et al. 1996; Lamers et al. 1999;
Smolders et al. 2002). The floating fen soil sank
under the influence of sulphate as a result of
methanogenic bacteria being outcompeted by sul-
phate-reducing bacteria (Cappenberg 1974; Abram
and Nedwell 1978; Lovley and Klug 1983; Wester-
mann and Ahring 1987; Prieme 1994; Scholten and
Stams 1995), in the same way as this is known to
happen in floating peat bogs (Lamers et al. 1999;
Smolders et al. 2002). In the other soils, sulphide
formed by the reduction of sulphate was bound to the
excess iron. In both the aquarium experiment and the
incubation experiment, this led to an additional
release of phosphate in the alder carr soil. Sulphate
addition did not increase the decomposition rates, as
had been found earlier in bog peat (Lamers et al.
1999; Smolders et al. 2002; Tomassen et al. 2003). In
soils where sulphate increases decomposition, this
seems to be an effect of the increased alkalinity
produced by the reduction of sulphate (Lamers et al.
1999; Smolders et al. 2002; Tomassen et al. 2003). In
our experiment, alkalinity of the artificial river water
was already high (2,000 mmol HCO3� l�1, similar to
concentrations in the water of the river Meuse). Since
no effect of sulphate on the decomposition rate was
found, it is likely that the additional release of
phosphate in the sulphate treatment of the alder carr
soil in the incubation experiment did not originate
from decomposition of organic matter, but can be
attributed to the competition between sulphide and
phosphate for binding to iron.
Our findings show the importance of both soil type
and water quality in the biogeochemical response to
flooding. Inundation has the smallest impact on soils
without organic matter, in terms of phosphate release
by reduction of Fe (III) and the formation of potentially
phytotoxic reduced compounds such as ammonium, Fe
(II) and sulphide (‘internal toxification’). Flooding of
300 Biogeochemistry (2007) 85:289–302
123
soils containing organic matter, in contrast, leads to
accumulation of ammonium and release of Fe-bound
phosphate. This internal eutrophication could cause
algal blooms in the water layer above such soils.
Additionally, river water polluted with sulphate may
cause sulphide phytotoxicity if the iron content is low,
as was shown here for the floating fen soil. If the soil is
richer in iron, sulphide will be bound to iron and may
release phosphate that was bound to the iron, as took
place in the alder carr soil. It should be noted that these
two processes, sulphide toxicity and enhanced phos-
phate mobilisation, can also take place in the same soil,
as was found for instance by Lamers et al. (1998) for a
mesotrophic fen.
The presence of sulphate reduces methanogenesis,
which is a very important process in ecosystems
depending on methane for floating, such as floating fen
mats and bog peat rafts. Floating fen mats form the first
stage in the terrestrialisation process in fen systems.
Our results show that inundation of these floating fens
with sulphate-rich river water at levels occurring in the
rivers Meuse and Rhine may thus destroy the floating
fens and their rare vegetation as well as block the
subsequent terrestrialisation process and the accom-
panying vegetation succession. Analogously, we
expect the elevated nitrate concentrations in the river
water to have a similar inhibiting effect on methano-
genesis (Westermann and Ahring 1987; Scholten and
Stams 1995) and on the buoyancy of floating fens.
The results presented in this article have important
implications for the rehabilitation and creation of
wetlands, and for the selection of locations for the
creation of flood water storage areas. Completely
mineral soils, such as those in clay and sand
sedimentation areas where the topsoil has been
removed, are not likely to be at great risk of
eutrophication in the short term. However, wetland
locations containing organic matter—and most soils
do so—should be chosen with greater care. Here,
other soil characteristics such as iron and phosphate
concentrations, and water quality parameters such as
sulphate concentrations, should be taken into account.
Acknowledgements We would like to thank Martin Versteeg
for his help in collecting the soils, Roy Peters and Germa
Verheggen for their technical support, and Jelle Eygensteyn for
his help with the analyses. We thank Jan Klerkx for improving
the English of the text. This study was financially supported by
the Netherlands Organisation for Scientific Research (NWO) as
a part of the TRIAS programme (project 835.80.010).
References
Abram JW, Nedwell DB (1978) Inhibition of methanogenesis
by sulfate reducing bacteria competing for transferred
hydrogen. Arch Microbiol 117:89–92
Beltman B, Van den Broek T, Van Maanen K, Vaneveld K
(1996) Measures to develop a rich-fen wetland landscape
with a full range of successional stages. Ecol Eng 7:299–
313
Bontes B, Pijnappel H, Geurts J, Schouwenaars J, Klinge M,
Verberk W, Lamers L (2005) Onderzoek ten behoeve van
het herstel en beheer van Nederlandse laagveenwateren -
tussentijdse OBN-rapportage (in Dutch). Report Ministry
of Agriculture, Nature and Food Quality, The Netherlands
Cappenberg TE (1974) Interrelations between sulfate-reducing
and methane-producing bacteria in bottom deposits of a
freshwater lake. 1. Field Observations. Antonie Van
Leeuwenhoek J Microbiol 40:285–295
Caraco NF,Cole JJ, Likens GE (1989) Evidence for sulphate-
controlled phosphorus release from sediments of aquatic
systems. Nature 341:316–318
Cornwell JC, Kipphut GW (1992) Biogeochemistry of man-
ganese-rich and iron-rich sediments in Toolik Lake,
Alaska. Hydrobiologia 240:45–59
Gunnars A, Blomqvist S (1997) Phosphate exchange across the
sediment-water interface when shifting from anoxic to
oxic conditions – an experimental comparison of fresh-
water and brackish-marine systems. Biogeochemistry
37:203–226
Hogg EH, Wein RW (1988a) Seasonal change in gas content
and buoyancy of floating typha mats. J Ecol 76:1055–
1068
Hogg EH, Wein RW (1988b) The contribution of Typhacomponents to floating mat buoyancy. Ecology
69(4):1025–1031
Lamers LPM, Tomassen HBM, Roelofs JGM (1998) Sulfate-
induced eutrophication and phytotoxicity in freshwater
wetlands. Environ Sci Technol 32:199–205
Lamers LPM, Farhoush C, van Groenendael JM, Roelofs JGM
(1999) Calcareous groundwater raises bogs; the concept
of ombrotrophy revisited. J Ecol 87:639–648
Lamers LPM, Ten Dolle GE, Van den Berg STG, Van Delft
SPJ, Roelofs JGM (2001) Differential responses of
freshwater wetland soils to sulphate pollution. Biogeo-
chemistry 55:87–102
Lamers LPM, Falla SJ, Samborska EM, Van Dulken LAR, Van
Hengstum G, Roelofs JGM (2002a) Factors controlling
the extent of eutrophication and toxicity in sulfate-pol-
luted freshwater wetlands. Limnol Oceanogr 47:585–593
Lamers LPM, Smolders AJP, Roelofs JGM (2002b) The res-
toration of fens in the Netherlands. Hydrobiologia
478:107–130
Lovley DR, Klug MJ (1983) Sulfate reducers can out-compete
methanogens at fresh-water sulfate concentrations. Appl
Environ Microbiol 45:187–192
Lucassen ECHET, Smolders AJP, Roelofs JGM (2000) In-
creased groundwater levels cause iron toxicity in Glyceriafluitans (L.). Aquat Bot 66:321–327
Lucassen ECHET, Smolders AJP, Van de Crommenacker J,
Roelofs JGM (2004) Effects of stagnating sulphate-rich
Biogeochemistry (2007) 85:289–302 301
123
groundwater on the mobility of phosphate in freshwater
wetlands: a field experiment. Arch Hydrobiol 160:117–
131
Lucassen ECHET, Smolders AJP, Boedeltje G, van den
Munckhof PJJ, Roelofs JGM (2006) Groundwater input
affecting plant distribution by controlling ammonium and
iron availability. J Veget Sci 17:425–434
Moore PA, Reddy KR, Fisher MM (1998) Phosphorus flux
between sediment and overlying water in Lake Oke-
echobee, Florida: Spatial and temporal variations. J
Environ Qual 27:1428–1439
Olsen SR, Cole CV, Watanabe FS, Dean LA (1954) Estimation
of available phosphorus in soils by extraction with sodium
bicarbonate. U.S. Dep. of Agric. Circ. 939
Patrick WH, Khalid RA (1974) Phosphate release and sorption
by soils and sediments – effect of aerobic and anaerobic
conditions. Science 186:53–55
Pollux BJA, Pollux PMJ (2004) Fish and waterfowl mortality
at Romeinenweerd due to cyanobacterial bloom (in Dutch
with summary in English), Natuurhistorisch Maandblad
93:207–209
Prieme A (1994) Production and emission of methane in a
brackish and a fresh-water wetland. Soil Biol Biochem
26:7–18
Roden EE, Edmonds JW (1997) Phosphate mobilization in
iron-rich anaerobic sediments: microbial Fe(III) oxide
reduction versus iron-sulfide formation. Arch Hydrobiol
139:347–378
Roden EE, Wetzel RG (2003) Competition between Fe(III)-
reducing and methanogenic bacteria for acetate in iron-
rich freshwater sediments. Microb Ecol 45:252–258
Roelofs JGM (1991) Inlet of alkaline river water into peaty
lowlands – effects on water-quality and Stratiotes aloidesL. stands. Aquat Bot 39:267–293
Sasser CE, Gosselink JG, Swenson EM, Swarzenski CM,
Leibowitz NC (1996) Vegetation, substrate and hydrology
in floating marshes in the Mississippi river delta plain
wetlands, USA. Vegetatio 122:129–142
Scholten JCM, Stams AJM (1995) The effect of sulfate and
nitrate on methane formation in a freshwater sediment.
Antonie Van Leeuwenhoek Int J Gen Mol Microbiol
68:309–315
Schwertmann U (1964) Differenzierung der Eisenoxide des
Bodens durch photochemische Extraction mit saurer
Ammoniumoxalat-Loesung. Zeitschrift fur
Pflanzenernahrung, Dungung und Bodenkunde 105:194–
202
Smolders AJP, Roelofs JGM (1996) The roles of internal iron
hydroxide precipitation, sulphide toxicity and oxidizing
ability in the survival of Stratiotes aloides roots at dif-
ferent iron concentrations in sediment pore water. New
Phytol 133:253–260
Smolders AJP, Roelofs JGM, Den Hartog C (1996) Possible
causes for the decline of the water soldier (Stratiotesaloides L.) in the Netherlands. Arch Hydrobiol 136:327–
342
Smolders AJP, Lamers LPM, Moonen M, Zwaga K, Roelofs
JGM (2001) Controlling phosphate release from phos-
phate-enriched sediments by adding various iron com-
pounds. Biogeochemistry 54:219–228
Smolders AJP, Tomassen HBM, Lamers LPM, Lomans BP,
Roelofs JGM (2002) Peat bog restoration by floating raft
formation: the effects of groundwater and peat quality. J
Appl Ecol 39:391–401
Smolders AJP, Lamers LPM, Den Hartog C, Roelofs JGM
(2003) Mechanisms involved in the decline of Stratiotesaloides L. in The Netherlands: sulphate as a key variable.
Hydrobiologia 506:603–610
Sørensen J (1982) Reduction of ferric iron in anaerobic, marine
sediment and interaction with reduction of nitrate and
sulfate. Appl Environ Microbiol 43:319–324
Swarzenski CM, Swenson EM, Sasser CE, Gosselink JG
(1991) Marsh mat flotation in the Louisiana Delta Plain. J
Ecol 79:999–1011
Tallis JH (1973) The terrestrialization of lake basins in North
Cheshire, with special reference to the development of a
‘Schwingmoor’ structure. J Ecol 61(2):537–567
Tomassen HBM, AJP Smolders JM van Herk LPM Lamers
JGM Roelofs (2003) Restoration of cut-over bogs by
floating raft formation: An experimental feasibility study.
Appl Veget Sci 6:141–152
Van den Brink FWB (1994) Impact of hydrology on floodplain
lake ecosystems along the lower Rhine and Meuse. Dis-
sertation, University of Nijmegen, the Netherlands
Van den Brink FWB, Van der Velde G, Bijdevaate A (1991)
The (semi)aquatic vegetation of still waters within the
floodplains of the rivers Rhine and Meuse in The Neth-
erlands: historical changes and the role of inundation.
Verh Int Verein Limnol 24:2693–2699
Van der Welle MEW, Cuppens MLC, Lamers LPM, Roelofs
JGM (2006) Detoxifying toxicants: interactions between
sulphide and iron toxicity. Environ Toxicol Chem
25(6):1592–1597
Van der Welle MEW, Niggebrugge K, Lamers LPM, Roelofs
JGM (2007) Differential responses of the freshwater
wetland species Juncus effusus L. and Caltha palustris L.
to iron supply in sulphidic environments. Environ Pollut
147(1):222–230
Van der Weijden CH, Middelburg JJ (1989) Hydrogeochem-istry of the river Rhine – Long-term and seasonal vari-
ability, elemental budgets, base levels and pollution.
Water Res 23:1247–1266
Van Donselaar J (1961) On the vegetation of former River
Beds in the Netherlands. Wentia 5:1–85
Van Gemerden H (1984) The sulfide affinity of phototrophic
bacteria in relation to the location of elemental sulfur.
Arch Microbiol 139:289–294
Waterstat (2006) Dutch Ministry of Transport, Public Works
and Water Management, www.waterstat.nl. Cited 8 May
2006
Westermann P, Ahring BK (1987) Dynamics of methane pro-
duction, sulfate reduction, and denitrification in a per-
manently waterlogged alder swamp. Appl Environ
Microbiol 53:2554–2559
302 Biogeochemistry (2007) 85:289–302
123