how ready are our young people? community … ready are our young... · community conversations...
TRANSCRIPT
How Ready Are Our Young People? Community Conversations & the Gallup Student Poll Northern Kentucky Dr. Kathy Burkhardt, Erlanger-Elsmere School District Polly Lusk Page, Northern Kentucky Education Council Dr. Shelli Wilson, Campbell County Schools Atlanta Jilo Tisdale, United Way of Metro Atlanta Dr. N. Jean Walker, United Way of Metro Atlanta April 18, 2012
#readyby21
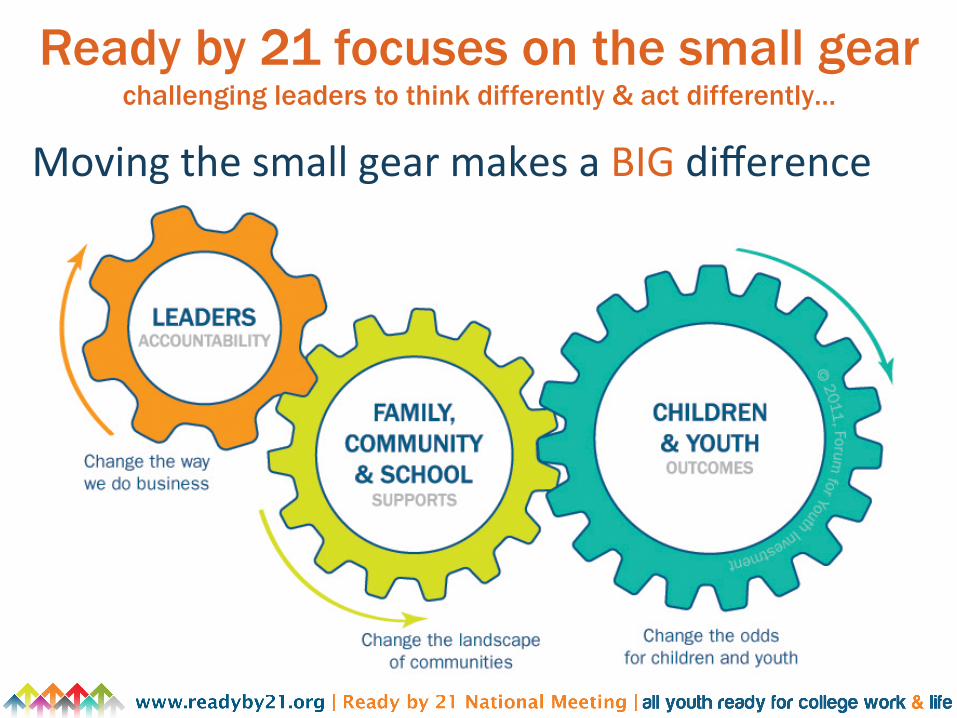
Ready by 21 focuses on the small gear challenging leaders to think differently & act differently…
MovingthesmallgearmakesaBIGdifference
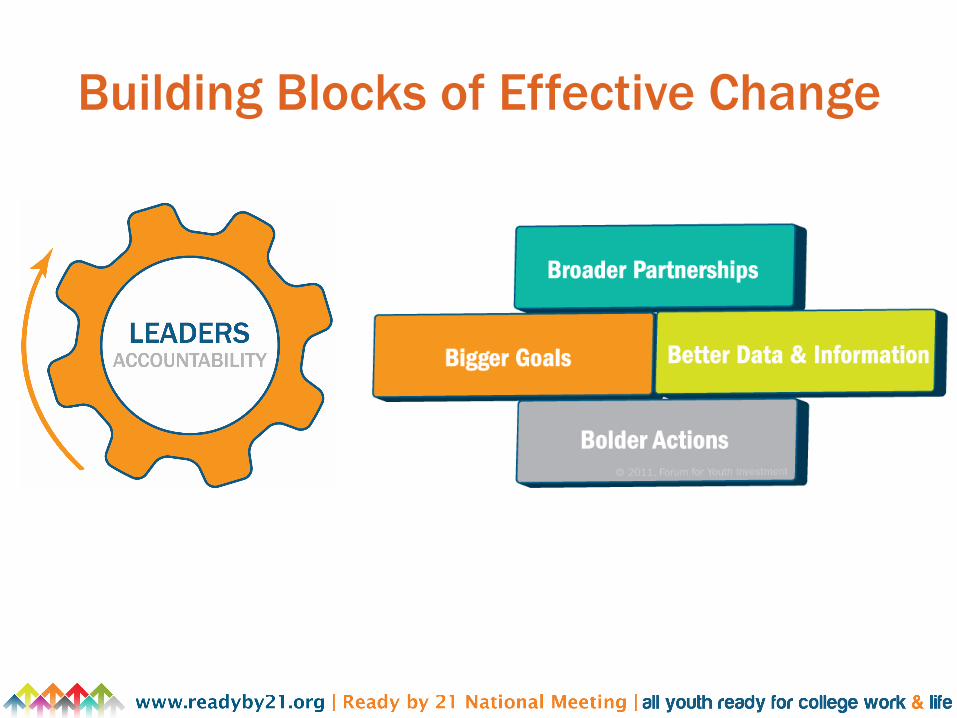
Building Blocks of Effective Change
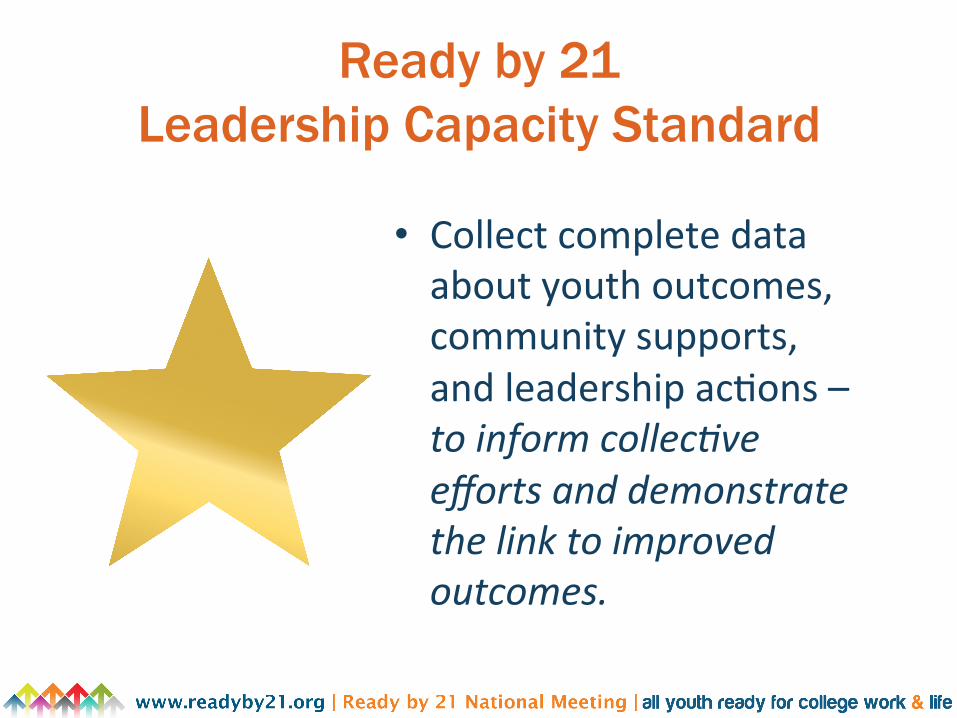
Ready by 21 Leadership Capacity Standard
• Collectcompletedataaboutyouthoutcomes,communitysupports,andleadershipac=ons–toinformcollec,veeffortsanddemonstratethelinktoimprovedoutcomes.
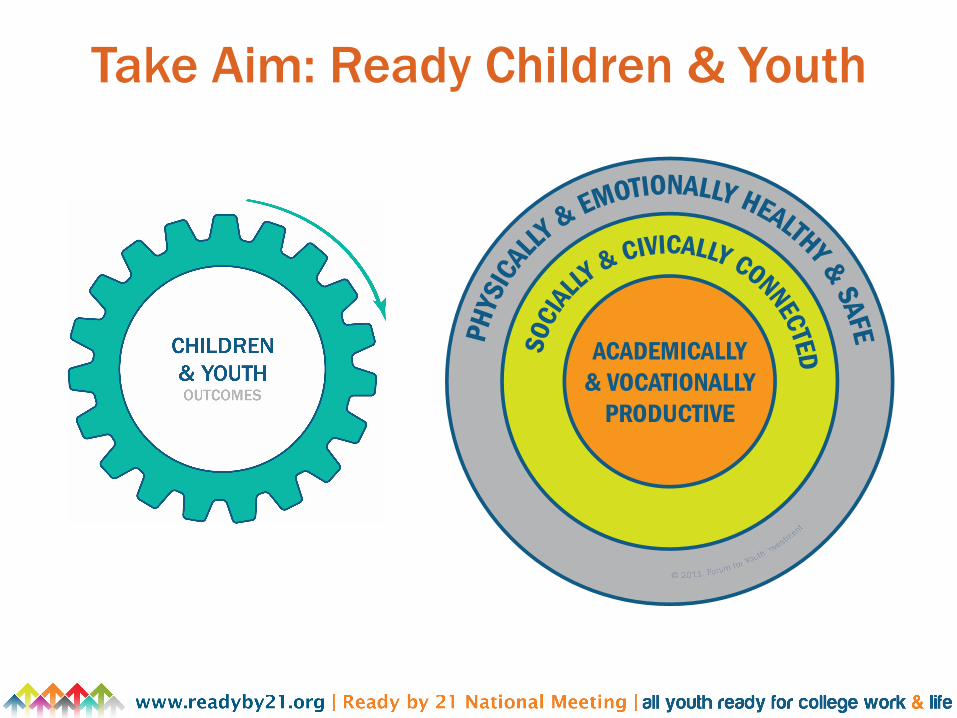
Take Aim: Ready Children & Youth
ACADEMICALLY
& VOCATIONALLY PRODUCT
IVE
SOCI
AL
LY & CIVICALLY CONNECTEDPH
YSIC
AL
LY & EMOTIONALLY HEALTHY & SAFE
SOCI
AL
LY & CIVICALLY CONNECTEDPH
YSIC
AL
LY & EMOTIONALLY HEALTHY & SAFE
ACADEMICALLY & VOCATIONALLY
PRODUCTIVE
The Readiness Target
© 2011, Forum for Youth Investment
© 2011, FoFF rum for YoYY uth Invest
ment
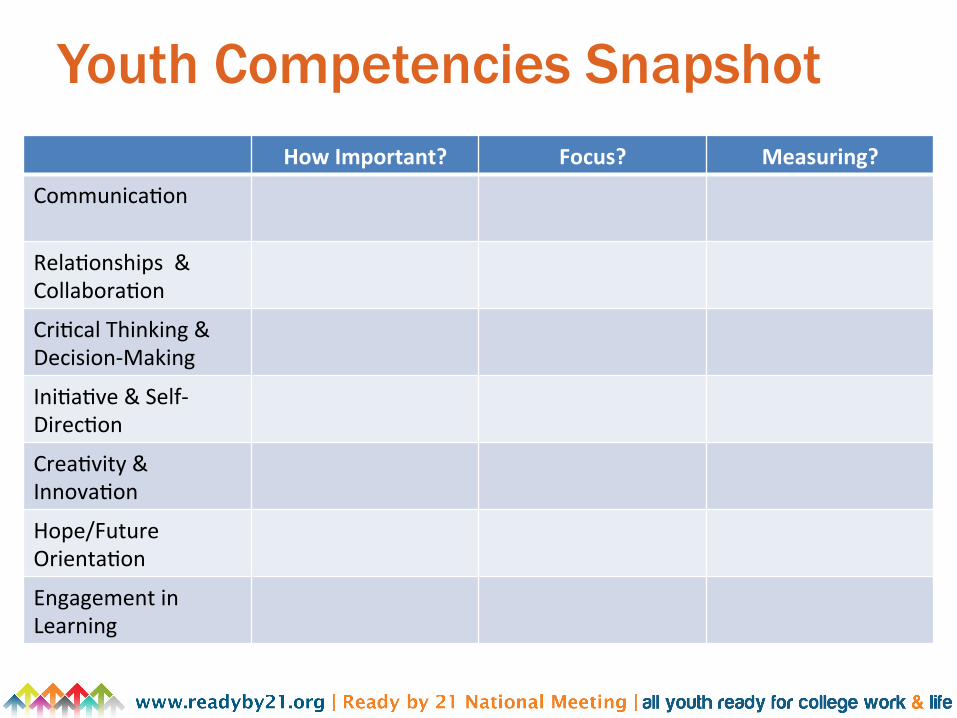
Youth Competencies Snapshot HowImportant? Focus? Measuring?
Communica=on
Rela=onships&Collabora=on
Cri=calThinking&Decision‐Making
Ini=a=ve&Self‐Direc=on
Crea=vity&Innova=on
Hope/FutureOrienta=on
EngagementinLearning
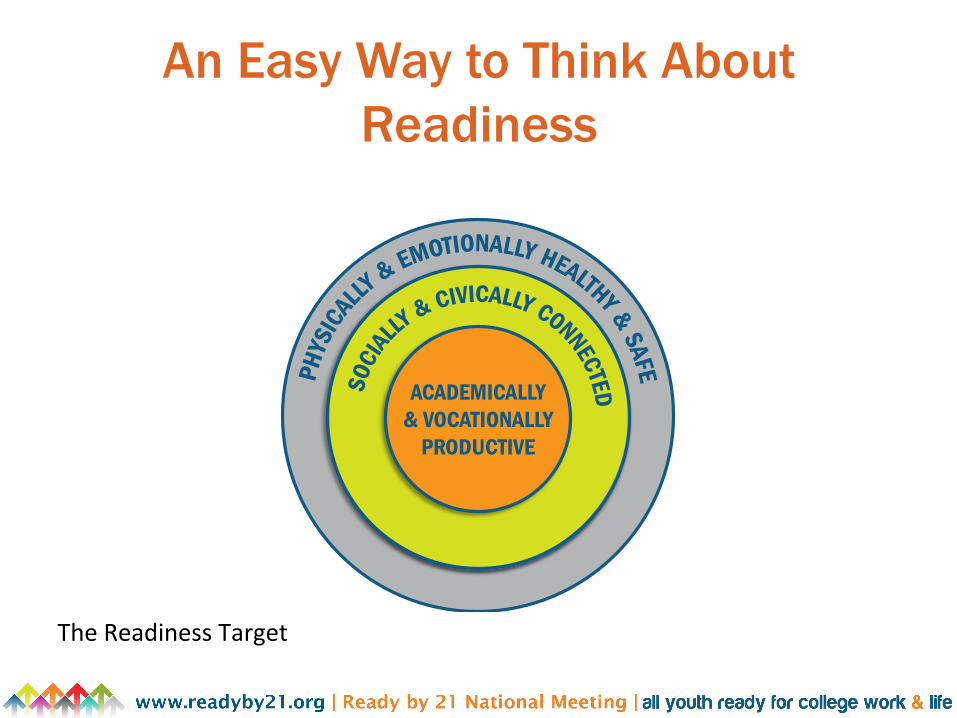
An Easy Way to Think About Readiness
SOCI
AL
LY & CIVICALLY CONNECTED PH
YSIC
AL
LY & EMOTIONALLY HEALTHY & SAFE
ACADEMICALLY & VOCATIONALLY
PRODUCTIVE
SOCI
AL
LY & CIVICALLY CONNECTED PH
YSIC
AL
LY & EMOTIONALLY HEALTHY & SAFE
ACADEMICALLY & VOCATIONALLY
PRODUCTIVE
SOCI
AL
LY & CIVICALLY CONNECTED PH
YSIC
AL
LY & EMOTIONALLY HEALTHY & SAFE
ACADEMICALLY & VOCATIONALLY
PRODUCTIVE
SOCI
AL
LY & CIVICALLY CONNECTED PH
YSIC
AL
LY & EMOTIONALLY HEALTHY & SAFE
ACADEMICALLY & VOCATIONALLY
PRODUCTIVE
TheReadinessTarget
Copyright Standards Thisdocumentcontainsproprietaryresearch,copyrightedmaterials,andliterarypropertyofGallup,Inc.Itisfortheguidanceofyourcompanyonlyandisnottobecopied,quoted,published,ordivulgedtoothersoutsideofyourorganiza=on.Gallup®andGallupConsul=ng®aretrademarksofGallup,Inc.Allothertrademarksarethepropertyoftheirrespec=veowners.
Thisdocumentisofgreatvaluetobothyourorganiza=onandGallup,Inc.Accordingly,interna=onalanddomes=clawsandpenal=esguaranteeingpatent,copyright,trademark,andtradesecretprotec=onprotecttheideas,concepts,andrecommenda=onsrelatedwithinthisdocument.
NochangesmaybemadetothisdocumentwithouttheexpresswriTenpermissionofGallup,Inc.
Copyright © 2010 Gallup, Inc. All rights reserved. 9
Gallup Student Poll Overview The Gallup Student Poll is a 20-item measure of hope, engagement, and wellbeing. Gallup researchers targeted these three variables because they met the following criteria:
- They can be reliably measured - They have a meaningful relationship with or impact on educational outcomes - They are malleable and can be enhanced through deliberate action - They are not measured directly by another large-scale survey - They are not associated with a student’s FARL status or parent’s
household income. Hope | ideas and energy we have for the future | Double Hope Engagement | involvement in/enthusiasm for school | Build Engaged Schools Wellbeing | how we think about and experience our lives | Boost Wellbeing
10
Copyright © 2010 Gallup, Inc. All rights reserved.
Gallup Student Poll Overview (continued)
• Hope — the ideas and energy we have for the future. – Hope drives attendance, credits earned, and GPA of high
school students. Hope predicts GPA and retention in college, and hope scores are more robust predictors of college success than are high school GPA, SAT, and ACT scores.
• Engagement — the involvement in and enthusiasm for school. – Engagement distinguishes between high performing and low-
performing schools. • Wellbeing — how we think about and experience our lives.
– Wellbeing tells us how our students are doing today and predicts their success in the future. High school freshmen with high wellbeing earn more credits with a higher GPA than peers with low wellbeing. The typical student who is thriving earns 10% more credits and a 2.9 GPA (out of 4.0), whereas a student with low wellbeing, completing fewer credits, earns a 2.4 GPA.
11
Copyright © 2010 Gallup, Inc. All rights reserved.

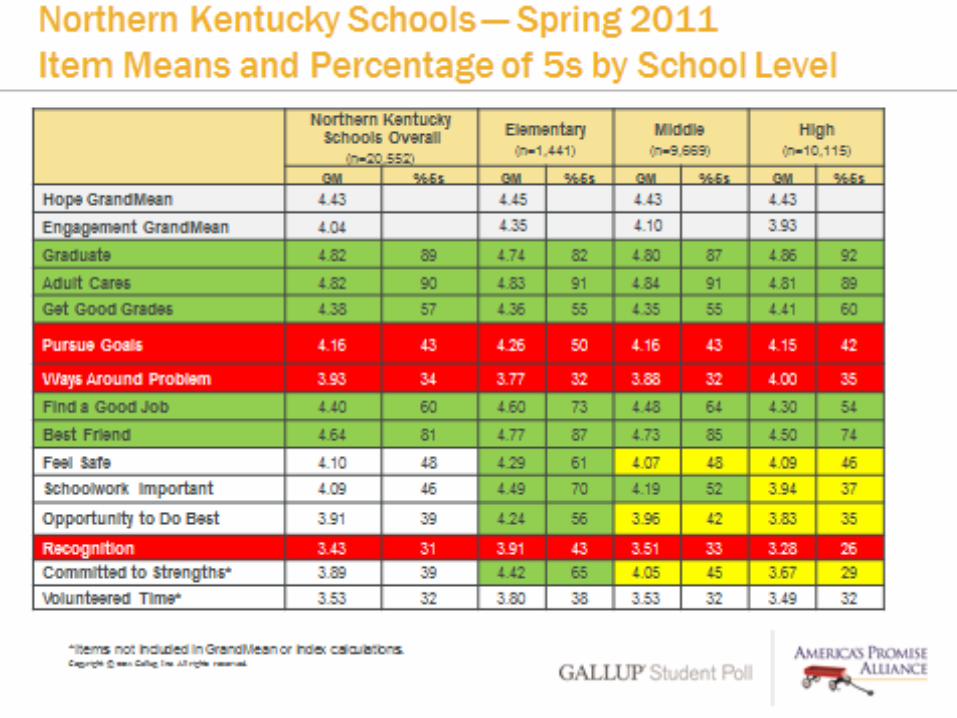
The 20 Elements of Hopeful, Engaged, & Thriving Students
Q01. On which step of the ladder would you say you personally feel you stand at this time? On which step do you think you will stand about five years from now?* Q02. I know I will graduate from high school. Q03. There is an adult in my life who cares about my future. Q04. I can think of many ways to get good grades. Q05. I energetically pursue my goals. Q06. I can find lots of ways around any problem. Q07. I know I will find a good job after I graduate. Q08. I have a best friend at school. Q09. I feel safe in this school. Q10. My teachers make me feel my schoolwork is important.
*ThisisanabbreviatedtextoftheCantrilSelf‐AnchoringStrivingScale.Forfulltext,seeslide63.
12 Copyright © 2010 Gallup, Inc. All rights reserved.
The 20 Elements of Hopeful, Engaged, & Thriving Students (continued)
Q11. At this school, I have the opportunity to do what I do best every day. Q12. In the last seven days, I have received recognition or praise for doing good schoolwork. Q13. My school is committed to building the strengths of each student. Q14. In the last month, I volunteered my time to help others. Q15. Were you treated with respect all day yesterday? Q16. Did you smile or laugh a lot yesterday? Q17. Did you learn or do something interesting yesterday? Q18. Did you have enough energy to get things done yesterday? Q19. Do you have health problems that keep you from doing any of the things other people your age normally can do? Q20. If you are in trouble, do you have family or friends you can count on to help whenever you need them?
13 Copyright © 2010 Gallup, Inc. All rights reserved
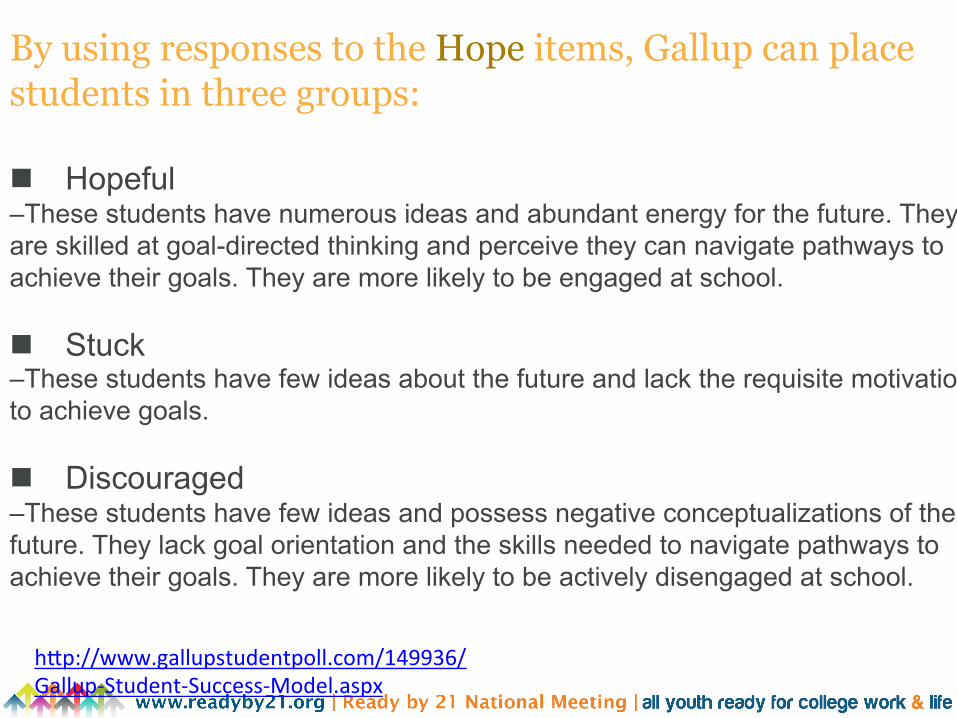
By using responses to the Hope items, Gallup can place students in three groups: Hopeful –These students have numerous ideas and abundant energy for the future. They are skilled at goal-directed thinking and perceive they can navigate pathways to achieve their goals. They are more likely to be engaged at school. Stuck –These students have few ideas about the future and lack the requisite motivation to achieve goals. Discouraged –These students have few ideas and possess negative conceptualizations of the future. They lack goal orientation and the skills needed to navigate pathways to achieve their goals. They are more likely to be actively disengaged at school.
hTp://www.gallupstudentpoll.com/149936/Gallup‐Student‐Success‐Model.aspx
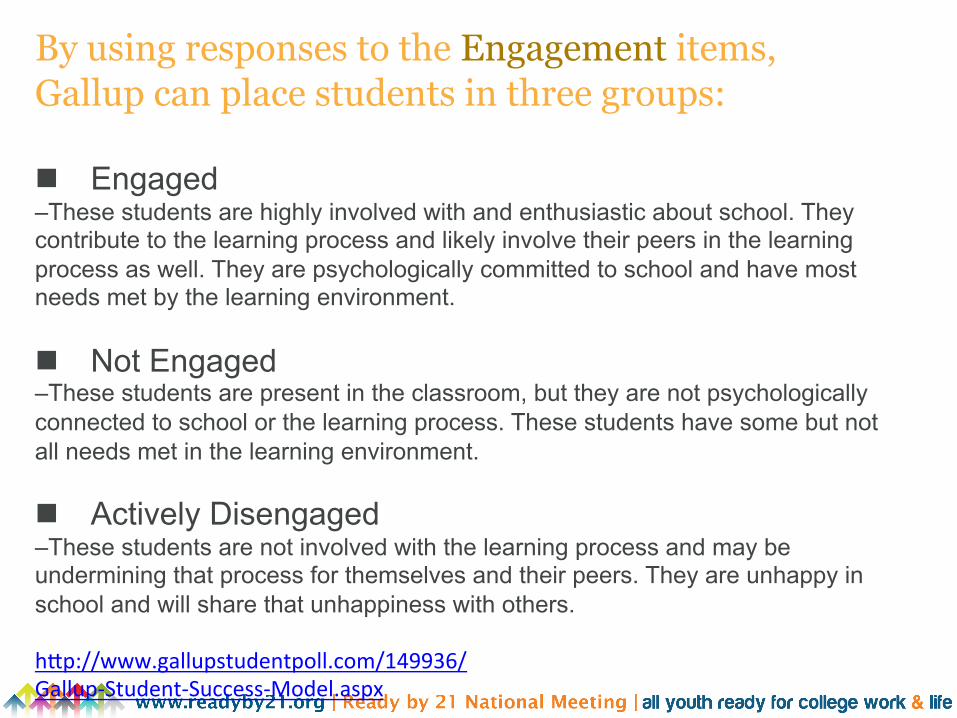
By using responses to the Engagement items, Gallup can place students in three groups: Engaged –These students are highly involved with and enthusiastic about school. They contribute to the learning process and likely involve their peers in the learning process as well. They are psychologically committed to school and have most needs met by the learning environment.
Not Engaged –These students are present in the classroom, but they are not psychologically connected to school or the learning process. These students have some but not all needs met in the learning environment.
Actively Disengaged –These students are not involved with the learning process and may be undermining that process for themselves and their peers. They are unhappy in school and will share that unhappiness with others. hTp://www.gallupstudentpoll.com/149936/Gallup‐Student‐Success‐Model.aspx
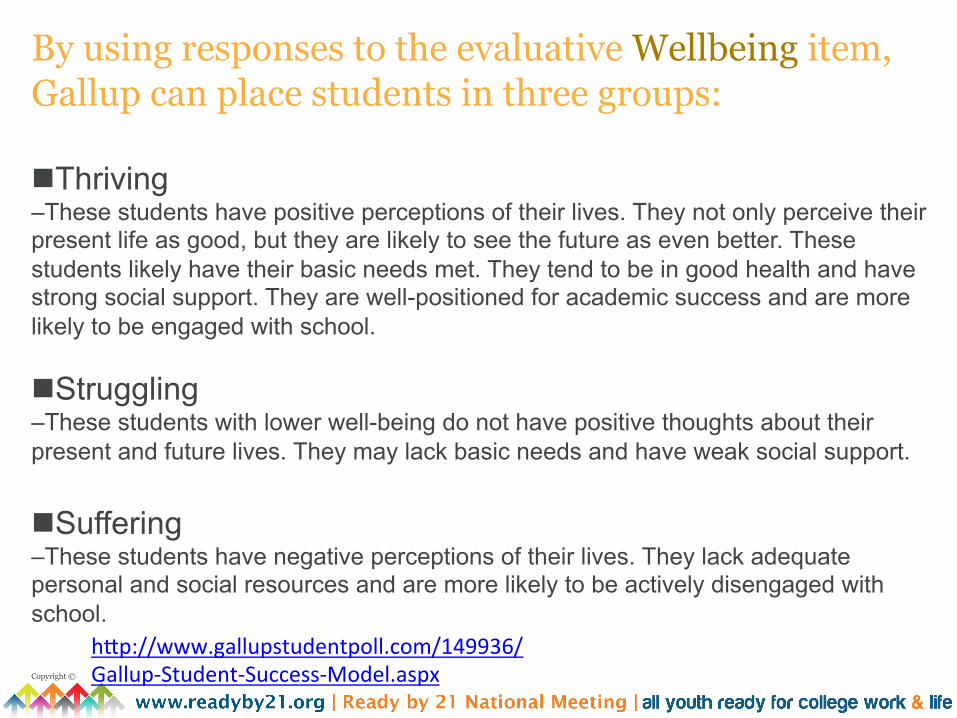
By using responses to the evaluative Wellbeing item, Gallup can place students in three groups: Thriving –These students have positive perceptions of their lives. They not only perceive their present life as good, but they are likely to see the future as even better. These students likely have their basic needs met. They tend to be in good health and have strong social support. They are well-positioned for academic success and are more likely to be engaged with school.
Struggling –These students with lower well-being do not have positive thoughts about their present and future lives. They may lack basic needs and have weak social support.
Suffering –These students have negative perceptions of their lives. They lack adequate personal and social resources and are more likely to be actively disengaged with school. Copyright ©
hTp://www.gallupstudentpoll.com/149936/Gallup‐Student‐Success‐Model.aspx

Copyright © 2010 Gallup, Inc. All rights reserved.
Gallup Student Poll Gallup Student Poll (basic)
- free for all public schools and districts for grades 5-12 Enhancements available Copyright ©
Polly Lusk Page
Dr. Kathlyn Burkhardt Dr. Shelli Wilson
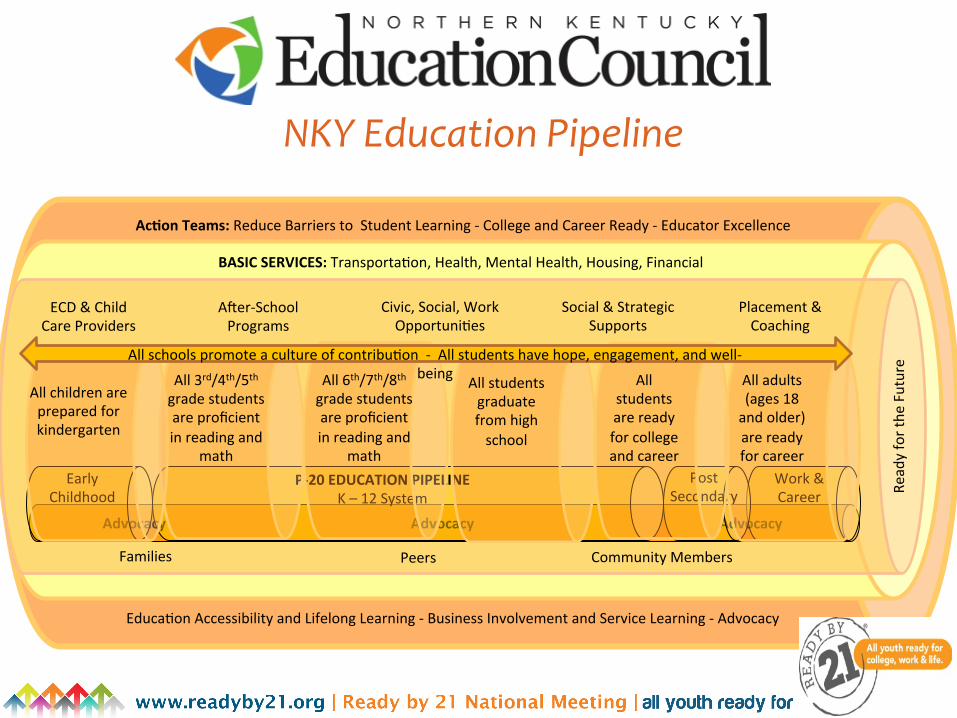
Advocacy Advocacy Advocacy
EarlyChildhood
PostSecondary
Work&Career
P‐20EDUCATIONPIPELINEK–12System
BASICSERVICES:Transporta=on,Health,MentalHealth,Housing,Financial
AcJonTeams:ReduceBarrierstoStudentLearning‐CollegeandCareerReady‐EducatorExcellence
NKYEducationPipeline
ECD&ChildCareProviders
A`er‐SchoolPrograms
Civic,Social,WorkOpportuni=es
Social&StrategicSupports
Placement&Coaching
Families Peers CommunityMembers
Educa=onAccessibilityandLifelongLearning‐BusinessInvolvementandServiceLearning‐Advocacy
All6th/7th/8thgradestudentsareproficientinreadingand
math
Allstudentsgraduatefromhighschool
Allstudentsarereadyforcollegeandcareer
Alladults(ages18andolder)arereadyforcareer
Allchildrenarepreparedforkindergarten
All3rd/4th/5thgradestudentsareproficientinreadingand
math
Allschoolspromoteacultureofcontribu=on‐Allstudentshavehope,engagement,andwell‐being
Readyforthe
Future
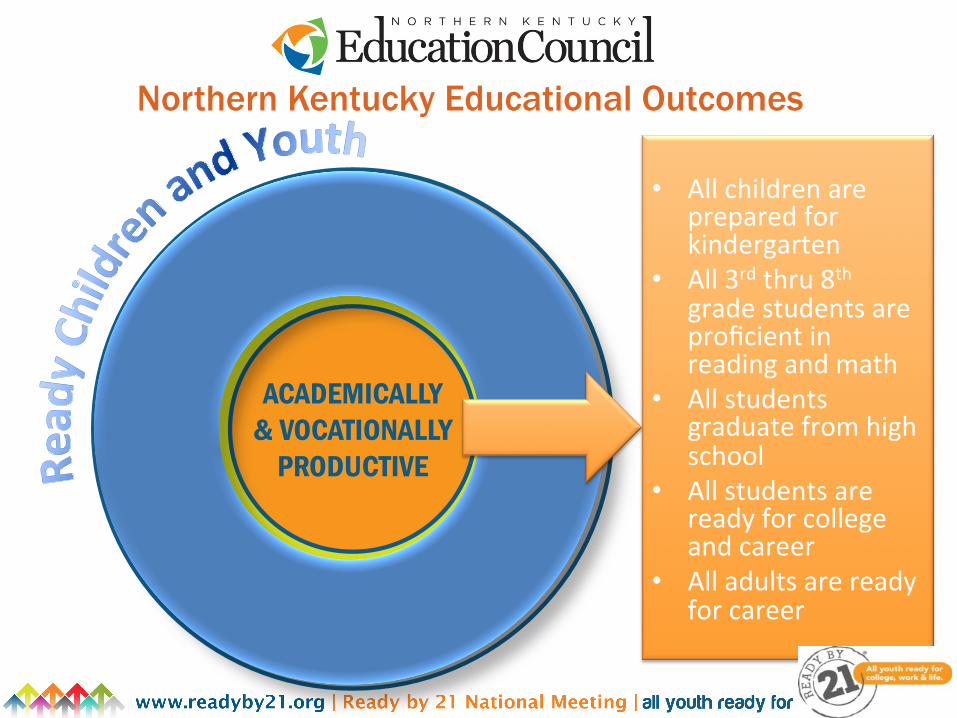
Northern Kentucky Educational Outcomes
• Allchildrenarepreparedforkindergarten
• All3rdthru8thgradestudentsareproficientinreadingandmath
• Allstudentsgraduatefromhighschool
• Allstudentsarereadyforcollegeandcareer
• Alladultsarereadyforcareer
ACADEMICALLY
& VOCATIONALLY PRODUCT
IVE
SOCI
AL
LY & CIVICALLY CONNECTEDPH
YSIC
AL
LY & EMOTIONALLY HEALTHY & SAFE
SOCI
AL
LY & CIVICALLY CONNECTEDPH
YSIC
AL
LY & EMOTIONALLY HEALTHY & SAFE
ACADEMICALLY & VOCATIONALLY
PRODUCTIVE
The Readiness Target
© 2011, Forum for Youth Investment
© 2011, FoFF rum for YoYY uth Invest
ment
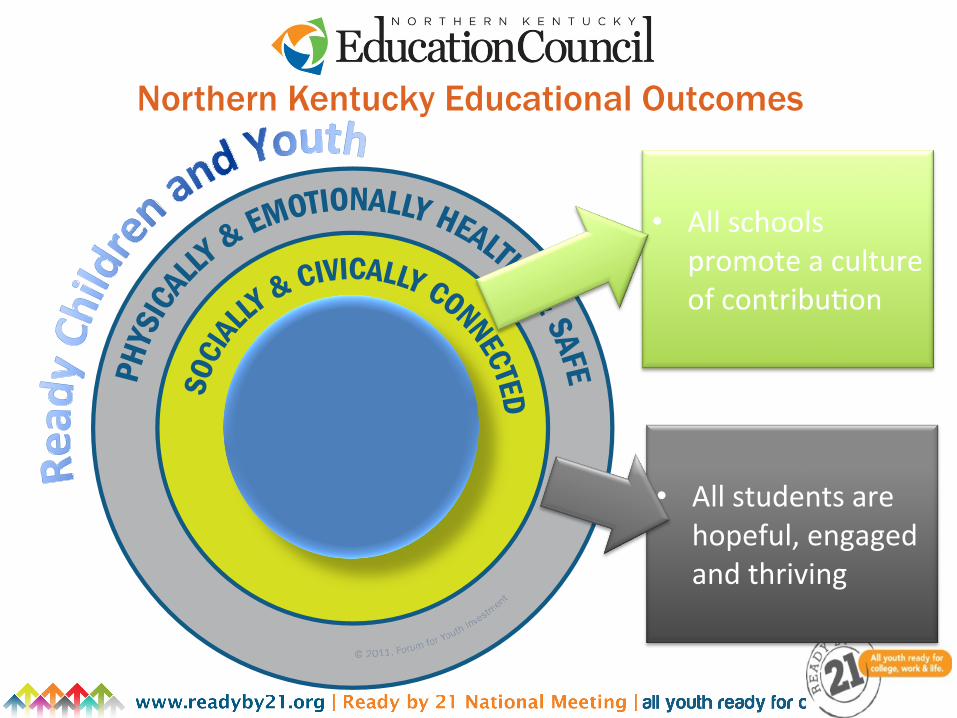
Northern Kentucky Educational Outcomes
• Allschoolspromoteacultureofcontribu=on
ACADEMICALLY
& VOCATIONALLY PRODUCT
IVE
SOCI
AL
LY & CIVICALLY CONNECTEDPH
YSIC
AL
LY & EMOTIONALLY HEALTHY & SAFE
SOCI
AL
LY & CIVICALLY CONNECTEDPH
YSIC
AL
LY & EMOTIONALLY HEALTHY & SAFE
ACADEMICALLY & VOCATIONALLY
PRODUCTIVE
The Readiness Target
© 2011, Forum for Youth Investment
© 2011, FoFF rum for YoYY uth Invest
ment
• Allstudentsarehopeful,engagedandthriving
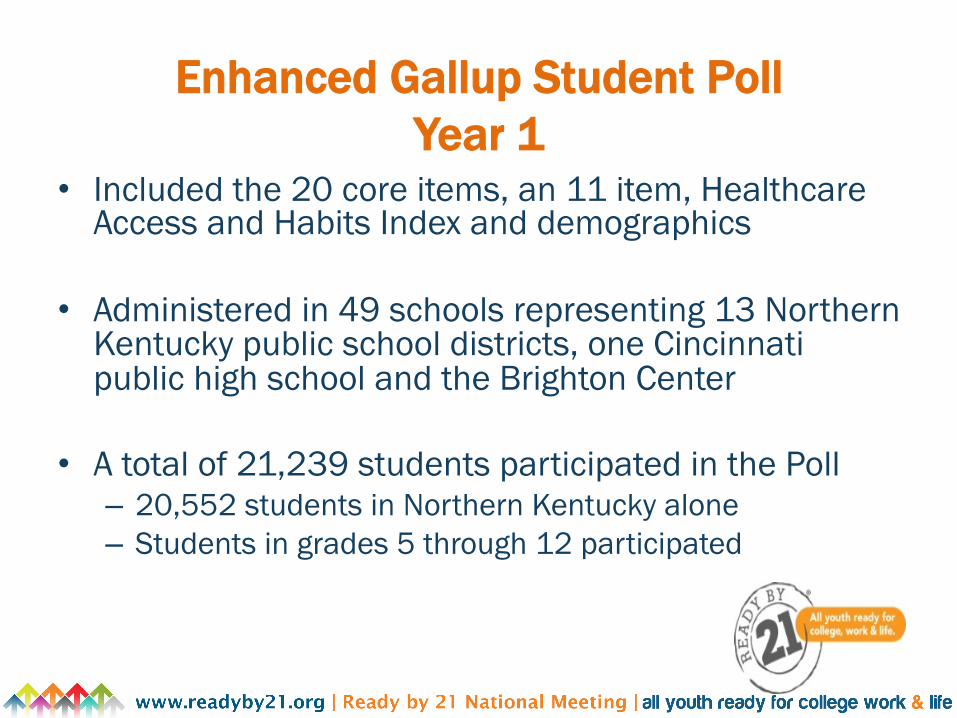
Enhanced Gallup Student Poll Year 1
• Included the 20 core items, an 11 item, Healthcare Access and Habits Index and demographics
• Administered in 49 schools representing 13 Northern
Kentucky public school districts, one Cincinnati public high school and the Brighton Center
• A total of 21,239 students participated in the Poll – 20,552 students in Northern Kentucky alone – Students in grades 5 through 12 participated
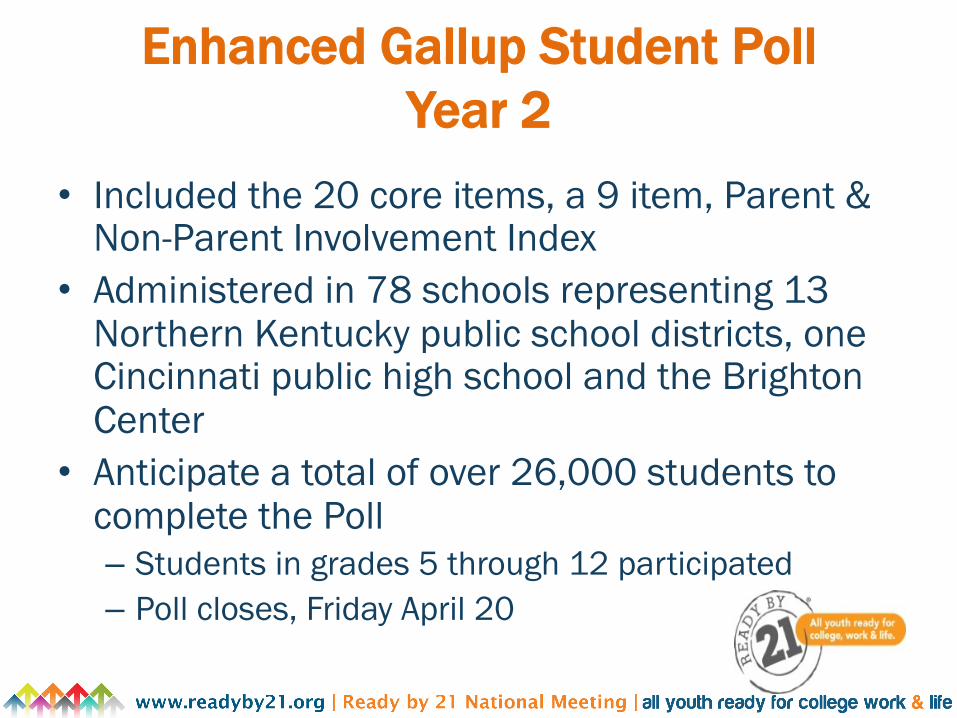
Enhanced Gallup Student Poll
Year 2 • Included the 20 core items, a 9 item, Parent &
Non-Parent Involvement Index • Administered in 78 schools representing 13
Northern Kentucky public school districts, one Cincinnati public high school and the Brighton Center
• Anticipate a total of over 26,000 students to complete the Poll – Students in grades 5 through 12 participated – Poll closes, Friday April 20
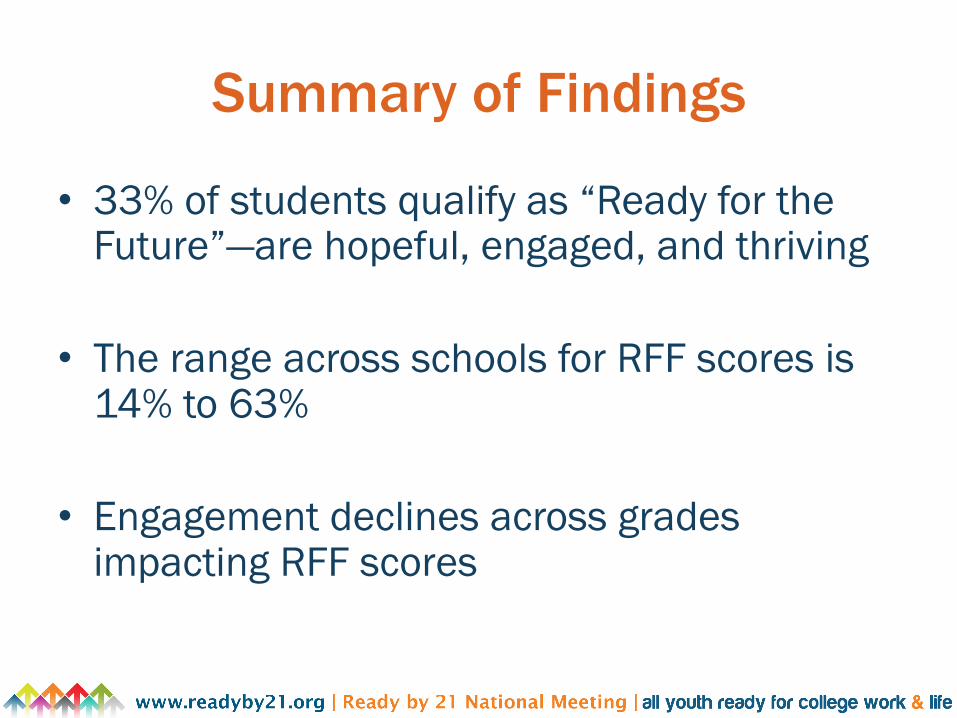
Summary of Findings
• 33% of students qualify as “Ready for the Future”—are hopeful, engaged, and thriving
• The range across schools for RFF scores is
14% to 63% • Engagement declines across grades
impacting RFF scores

It is the mission of the Erlanger-Elsmere Schools to embrace and attend to the individual needs of
our students, regardless of the obstacles.


Addressing Individual Student Needs
• Needs assessments at the school and district level
• Individual Student Goal Setting • Mentoring • Counseling • Comprehensive Guidance Curriculum • Increasing Service Learning • Triangulation of cognitive and noncognitive data
for Response to Intervention (RTI)
Triangulation of Data
• Persistence to Graduation Tool • Gallup Poll Student Surveys • Developmental Asset Student Surveys • KIP Student Surveys • TELL Teacher Surveys • PBIS Teacher Surveys • Academic Achievement Data & Progress
Monitoring
Regional Supports
• Shared analysis tools • Leadership Professional Learning Communities • Counselor Professional Learning Communities • Technology Professional Learning Communities • Northern Kentucky Youth Advisory Board • Postsecondary Education involvement • Operationalize school and community supports
Our children are worth every ounce of our efforts. The greater the obstacle, the more glory in overcoming it! [email protected] [email protected]

How Ready Are Our Young People? Community Conversations & the Gallup Student Poll Atlanta Jilo Tisdale, United Way of Metro Atlanta Dr. N. Jean Walker, United Way of Metro Atlanta
#readyby21
Ready Youth: A Community Conversation Catalyst
Ques=onsandDiscussion

THANKYOU!
Readyby21.orgForumfyi.org