how premium brands can master a recession · 1 how premium brands can master a recession four...
TRANSCRIPT

1
How Premium Brands Can Master A Recession
Four Actions National Brand Manufacturers Should Pursue Now

2
Contents
Overview Of Report 3
Executive Summary 4
Part I: Premiumization Risk Assessment Framework 9
Part II: Impact Of Recessions On Premiumization 26
Part III: Accelerating Out Of The Recession 47

3
Overview Of Report
The global economic recession has had a significant negative impact across many consumer product categories
Premium and Super-Premium segments of many categories have been hit hard as consumers reduce or delay purchase, trade-down quality, or exit a category altogether
Many companies now wonder if this recession will fundamentally change the structure of their industries
This document presents a perspective on how to assess the risks and opportunities for brands positioned at higher value and price points

4
Executive Summary (1)
Not all industries are created equal when it comes to the success potential for high value added products
In some industries, premium products as a group have taken a majority share of the market. Here, companies which pursued “Premiumization” strategies have fared well
In other industries the opposite is true – “Economization” rules the market. Premium brands are on the defensive
Recessions in the past generally have not altered the structure of an industry. Will this recession be different? Should premium brands pursue specific strategies?
A successful strategy for the current recession should begin with assessing the structure in your industry
5
Executive Summary (2)
Two powerful and opposing forces shape the market structure in every consumer goods category
– Economization Force: fueled by consumers’ search for value and supported by increasing power of retailers
– Premiumization Force: fueled by human desire to strive upward to higher levels of self-actualization and peer recognition and supported by rising personal income
Our analysis suggests that the opportunity to create brand value determines which of the two forces will gain dominance within a category. The size of this opportunity depends on the ability to create large, consumer perceived benefits along two dimensions: Rational Benefits and Emotional Benefits

6
Executive Summary (3) Opportunity To Create Brand Value Shapes Market Structures
Hig
h
High
Low
Low
Emo
tio
nal
B
en
efit
s
Rational Benefits
Consumer Perceived Benefit
Pri
ce P
er
Un
it
Economization: Price / Benefit Relationship
Premiumization: Price / Benefit Relationship
Consumer Perceived Benefit
Pri
ce P
er
Un
it
Opportunity to Create Brand Value
Economy
Premium
Super Premium
Luxury
Economy
Premium
Super Premium
Examples Include: • Butter • Cheese • Cooking Oil • Salad Dressing
Examples Include: • Yogurt • Diapers • Mayonnaise • Dog Food

7
Executive Summary (4)
Based on an analysis of over 100 consumer goods industries, we have identified Four Dimensions of Market Structure
An industry structure will shift if significant changes occur in one or several of these dimensions. Severe recessions can initiate or facilitate such disruption. Effective strategists monitor and harness opportunities to the benefit of their company
High Brand Value Creation
Real Customer Need
Favorable Price / Value Proposition
Constructive Competition And Trade Relations
2.
1.
3.
4.

8
I. Premiumization Risk Assessment Framework

9
Two Powerful Opposing Forces Drive Market Structure
Two powerful and opposing forces have shaped the market structure of consumer products industries in the past decades – the force of Economization and the force of Premiumization
How these two forces play out in a given industry and how their relative impact may change can be examined and predicted with a systematic framework
Economization
“Good Is Enough”
Premiumization
“Better Is Better”

10
Two Powerful Opposing Forces Drive Market Structure Economization Force
Economization is driven by consumers who do not have enough income to satisfy all their desires and strive for getting the best value
A second force is the power of discount retailers who seek greater value at a lower price, often benefiting from lower cost manufacturing capabilities in China and other countries
Economization
“Good Is Enough”

11
Economization Driven Industries
Example of Industries Driven by Economization
In these industries the Economy Group of products (Private Labels and price / value oriented brands) has gained share at the expense of the Premium Group
The average price of the Economy Group has been stable or declining. The price premium of the Premium Group declined
Economization
“Good Is Enough”
12
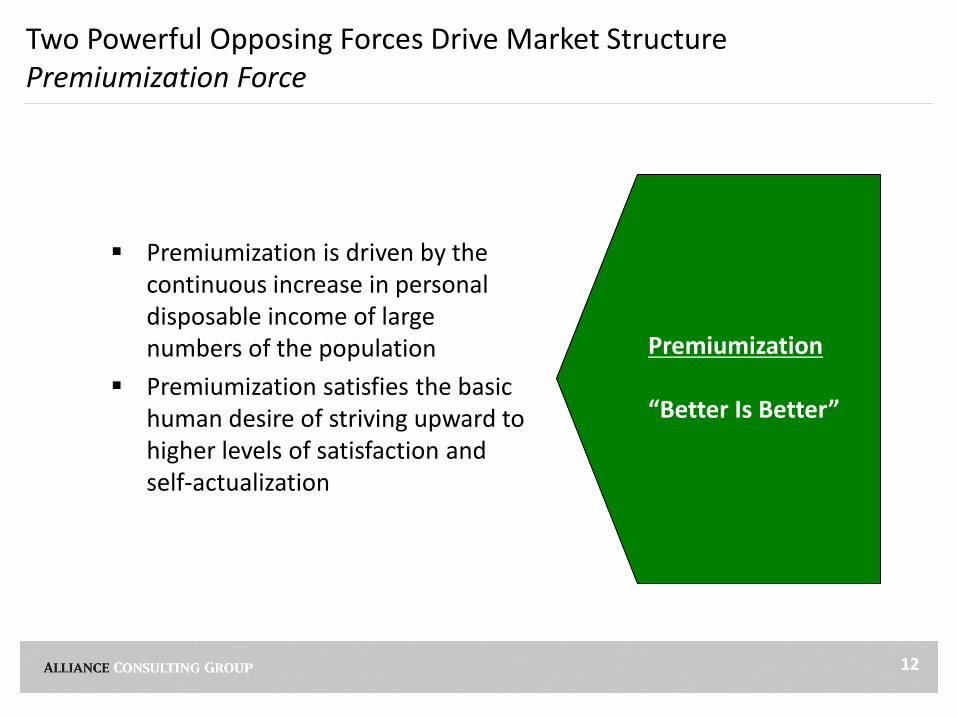
Two Powerful Opposing Forces Drive Market Structure Premiumization Force
Premiumization is driven by the continuous increase in personal disposable income of large numbers of the population
Premiumization satisfies the basic human desire of striving upward to higher levels of satisfaction and self-actualization
Premiumization “Better Is Better”

13
Premiumization Driven Industries
In these industries the Premium Group of products (brands priced 30% or higher than economy products) has gained share from the Economy Group
The average price of the Premium Group has increased due to a shift towards higher priced segments (Super-Premium, Ultra, Luxury) within the group
Example of Industries Driven by Premiumization
Premiumization “Better Is Better”

14
Premium Value Can Be Created With Two Consumer Benefits
High
High
Low
Low
Emotional Benefits:
How the product makes me feel about myself
How the product makes me look to others
Rational Benefits:
What “job” does the product perform
How does the product perform

15
Opportunity To Create Brand Value Shapes Market Structures (1)
Hig
h
High
Low
Low
Emo
tio
nal
B
en
efit
s
Rational Benefits
Consumer Perceived Benefit
Pri
ce P
er
Un
it
Economization: Price / Benefit Relationship
Premiumization: Price / Benefit Relationship
Consumer Perceived Benefit
Pri
ce P
er
Un
it
Opportunity to Create Brand Value
Economy
Premium
Super Premium
Luxury
Economy
Premium
Super Premium
Examples Include: • Butter • Cheese • Cooking Oil • Salad Dressing
Examples Include: • Yogurt • Diapers • Mayonnaise • Dog Food

16
Opportunity To Create Brand Value Shapes Market Structures (2)
High
High
Low
Low
80%
60%
40%
20%
100%
0%
2009 2005 2000
80%
60%
0%
2009
40%
20%
100%
2001 1985 1993
Emo
tio
nal
B
en
efit
s
Rational Benefits Economization:
Bottled Water
Economy
Premium
Premiumization: Carbonated Soft Drinks
Source: Beverage Digest Fact Book 2009

17
Premiumization-Driven Categories: Motorcycles
Source: National Bureau of Economic Research, Industry Data
Motorcycles Sold by Segment, 1980-2009 by Segment
0%
20%
40%
60%
80%
100%
2009 2007 2005 2003 2001 1999 1997 1995 1993 1991 1989 1987 1985 1983 1981
Segm
ent
Vo
lum
e [%
]
Premium Economy
Premium
Economy

18
Premiumization-Driven Categories: Premium Jeans
Source: National Bureau of Economic Research, NPD Group
0%
20%
40%
60%
80%
100%
2004 2008 2007 2006 2005 2009
Women’s Jeans Market by Segment, 2004-2009
Premium (Women’s Jeans $100+) Economy
Economy
Premium
Segm
ent
Vo
lum
e [%
]

19
Premiumization-Driven Categories: Charcoal
0%
20%
40%
60%
80%
100%
2009 2007 2005 2003 2001 1999 1997 1995 1993
Segm
en
t V
olu
me
[%
]
Charcoal Market by Segment, 1993-2009
Premium / Super Premium Economy
Source: National Bureau of Economic Research, Hearth, Patio and Barbeque Association (HPBA)
Super Premium
Premium
Economy

20
Bra
nd
ed P
rod
uct
Vo
lum
e Sh
are
20
09
Branded Share Point Change 2009 vs. 2006
0%
Avg 75%
100%
-13 +13 0
Top 100 CPG Categories All Outlet 2009 Branded Product Share & Point Change 2009 vs. 2006
Economization Dominant
33% of Categories
Premiumization Dominant
22% of Categories
Economization Gaining
41% of Categories
Source: IRI Consumer Network™; 52 weeks ending 7/19/2009 and same period prior years, Alliance Analysis
Opposing Forces In Consumer Product Categories
Premiumization Regaining
4% of Categories
• Yogurt • Diapers • Mayonnaise
• Butter • Cheese • Cooking Oil • Dog Food
• Toothbrushes • Salad Dressing

21
Dimensions of Premiumization Success
Alliance Consulting Group has examined over 100 consumer goods industries and has concluded that the tension between the Premiumization Force and the Economization Force plays out in predicable and measurable patterns
We have identified Four Dimensions of Market Structure in which distinct battles occur between the two forces
Within each dimension there are observable factors that favor either one of the two forces and allow it become the leading influence on the industry structure
An industry changes its structure as key dimensions shift to favor one of the two forces

22
Four Dimensions Of Market Structure
High Brand Value Creation
Real Customer Need
Favorable Price / Value Proposition
Constructive Competition And Trade Relations
2.
1.
3.
4.

23
Premiumization Risk Assessment Framework
Favors Economization Favors Premiumization
Differentiation vague, Sub-optimal outcome, Does not enhance image, Limited emotional connection
Differentiation apparent, Desired outcome, Enhances self image, Emotional connection
Functional, Within budget Luxurious, Distinct value
proposition, Costly
Small ticket items, Equal or worse than substitutes, Price based on tangible benefits
Big ticket items, Better than substitutes, Intangible benefits
Cost or price reduction, Frequent discounted offerings, Volatile pricing, Involvement in PL segment
Innovation and upscaling, Avoids “cheapening”, Rational pricing, Branded portfolios
High Brand Value Creation
Real Customer Need
Favorable Price / Value Proposition
Constructive Competition And Trade Relations
2.
1.
3.
4.

24
Premiumization Risk Assessment Scorecard
Four Dimensions Of Market Structure Impact Favoring
Economization Neutral Premiumization
1. High Brand Value Creation
• Product Differentiation
• Product Performance
• External Projection
• Self-actualization
2. Real Customer Need
• Fulfills Core Human Desire
• Awareness And Availability
• Affordability
3. Favorable Price / Value Proposition
• Absolute Price
• Price Relative To Alternative Categories
• Balance Of Tangible And Intangible Benefits
4. Constructive Competition And Trade Relations
• Up scaling, Innovation
• Limited Downward Brand Re-positioning
• “Healthy” Price Competition
• Lack Of Trade Sponsored Private Label Brands

25
II. Impact Of Recessions On Premiumization

26
Impact Of Recessionary Periods
In severe recessions, consumers, competitors, and trade partners reevaluate their relationship to products, their purchasing behavior, and their strategies often leading to a reduction in sales of the Premium Group of products
Key Questions
1. Is Premiumization a “cyclical” phenomenon driven by boom periods in the economy or is it a market structure that persists through recessions?
2. How has the current recession affected categories with strong Premiumization?
3. How could a severe recession fundamentally alter a Premiumization market structure? What lessons can be learned?

27
1. Premiumization and Recessions
Premiumization has been a long-term driver of growth across many consumer product categories
Premiumization-driven categories have demonstrated growth through economic cycles. Examples include:
– Jewelry
– Boats
– Televisions
– Watches
These and other examples suggest that Premiumization is not a cyclical phenomenon but rather a form of fundamental market structure
1.

28
Premiumization Drives Growth Across Many Categories

29
Premiumization Strategies Payoff Example: Sara Lee
Sara Lee Premiumization Strategy – 2009 Results
N.A. Retail Sales [$M]
Source: Sara Lee Presentation 2/16/10, IRI 52 wk ending 1/10/10
$808
14%
$663
16%
$370
21% 3-Yr Sales Growth

30
Premiumization-Driven Categories Have Demonstrated Growth Through Economic Cycles (1)
Jewelry
Watches
Boats
Televisions

31
US G
DP
[$B
]
$10
$5
$0
$15
$10
$5
$0
2009 2000 1990 1980 1970
$15
$15
$10
$5
$0
$30
$20
$10
$0
2009 2000 1990 1980 1970
$10
$5
$15
$0
$8
$6
$4
$2
$0
2009 2000 1990 1980 1970
$15
1970
$5
2009 1978
$0
$40
$60
$20
$10
$0
1994 1986 2002
Premiumization-Driven Categories Have Demonstrated Growth Through Economic Cycles (2)
Jewelry
Watches
Boats
Televisions
Personal Consumption Expenditure For Product GDP
US
GD
P [$
B]
US
Exp
en
diture
[$
B]
Recessionary Period
US G
DP
[$B
]
US
GD
P [$
B]
Source: National Bureau of Economic Research, Bureau of Economic Analysis; Note: US Expenditures and GDP are in current dollars
US
Exp
end
itu
re [
$B
]
US
Exp
end
itu
re [
$B
]
US
Exp
end
itu
re [
$B
]

32
Recession Impact On Categories With Strong Premiumization
Current indicators show that Premiumization market structure persists in most categories and premium products are regaining growth
Within some Premiumization categories we observe a shift from Super Premium segments to Premium segments
2.

33
Current Indicators Show That Premiumization Trend Is Resuming For Many Categories
Latest Department of Commerce report shows growth across most sectors 2010 YTD vs. 2009
Affluent customers report increased spending across multiple luxury categories
Stock prices for luxury and premium continue to rise reflecting market expectations for future performance
Leaders of luxury and premium companies are expression optimism for future growth outlook
Retail Sales Report
Stock Market Performance
Forward-Looking Statements
Consumer Luxury Tracking Study

34
0
20
40
60
80
100
120
Luxu
ry C
on
sum
er S
enti
men
t In
dex
*
Unity Marketing’s Luxury Consumer Index (LCI), 2003-2009
Source: Unity Marketing 2010 Consumer Survey; Note: Unity Marketing's exclusive Luxury Tracking Study indicate consumer sentiment among affluent consumers, defined as
those at the top 20% of household income
Luxury Consumer Sentiment Index
2003 2004 2005 2006 2007 2008 2009
Current Indicators: Luxury Tracking Study Luxury Consumption Index Shows Strong Growth

35
Current Indicators: Stock Market Performance Luxury Index Rebounding With Market
$0.00
$0.50
$1.00
$1.50
$2.00
Sto
ck P
erfo
rman
ce
Luxury Goods Index vs. S&P 500 Index, 2006 – 2010YTD
Source: Yahoo Financ; Note: Stock performance indexed to $1 as of 01/01/06; Examples of companies in the DJ Luxury Index include: LVMH Moet Hennessy
Louis Vuitton, Coach Inc., BMW AG, Hermes International S.C.A., Nordstrom Inc., Tiffany & Co., Christian Dior S.A.
DJ Luxury Goods Index S&P500 Historical Price
Q1
‘06
Q2
‘06
Q3
‘06
Q4
‘06
Q1
‘07
Q2
‘07
Q3
‘07
Q4
‘07
Q1
‘08
Q2
‘08
Q3
‘08
Q4
‘08
Q1
‘09
Q2
‘09
Q3
‘09
Q4
‘09
Q1
‘10

36
Current Indicators: Luxury And Premium Companies

37
$0.00
$0.50
$1.00
$1.50
$2.00
Estee Lauder S&P
Current Indicators: Luxury And Premium Companies Stock Performance Have Strong Upward Trajectory
Stock Performance vs. S&P 500, 2006 – 2010YTD
Sto
ck P
erfo
rman
ce
$0.00
$0.50
$1.00
$1.50
Tiffany’s S&P
Source: Yahoo Finance; Note: Stock performance indexed to $1 as of 10/01/07
Sto
ck P
erfo
rman
ce
Sto
ck P
erfo
rman
ce
Sto
ck P
erfo
rman
ce
$0.00
$0.50
$1.00
$1.50
Nike S&P
$0.00
$0.50
$1.00
$1.50
Carnival S&P
Q4 ‘07
Q4 ‘09
Q4 ‘08
Q2 ‘09
Q2 ‘08
Q1 ‘08
Q1 ‘10
Q1 ‘09
Q3 ‘09
Q3 ‘08
Q4 ‘07
Q4 ‘09
Q4 ‘08
Q2 ‘09
Q2 ‘08
Q1 ‘08
Q1 ‘09
Q3 ‘09
Q3 ‘08
Q1 ‘10
Q4 ‘07
Q4 ‘09
Q4 ‘08
Q2 ‘09
Q2 ‘08
Q1 ‘08
Q1 ‘09
Q3 ‘09
Q3 ‘08
Q1 ‘10
Q4 ‘07
Q4 ‘09
Q4 ‘08
Q2 ‘09
Q2 ‘08
Q1 ‘08
Q1 ‘09
Q3 ‘09
Q3 ‘08
Q1 ‘10

38
Current Indicators: Forward-Looking Statements
Source: Global Round-Up, Company Reports, Wall Street Journal, TIME Magazine
“NIKE is able to manage up and through the recession to expand separation for our brands, while some companies are still trying to decide what to do.” Mark Parker, CEO and President, Nike (February 2010)
“Predictions of the demise of luxury and full-priced spending were exaggerated.” Michael J. Kowalski, Chairman and CEO, Tiffany & Co. (Mar 2010)
"Business came back. It gave us the ability to change our mentality this year." Gerry Cahill, CEO, Carnival Corp.
“We’re surprised at the strength of pricing.” Howard Frank, COO, Carnival Corp. (Mar. 2010)
“For the lady who was buying in Bloomingdale's to go and buy in Wal-Mart, she needs to have big troubles in her personal life.” Fabrizio Fredo, CEO, Estee Lauder (Feb. 2010)

39
Recession Impact On Market Structure
Recessions can alter the market structure of an industry if they cause lasting change to key drivers that support Premiumization. Examples:
High Brand Value Creation
Real Customer Need
Favorable Price / Value Proposition
Constructive Competition And Trade Relations
2.
1.
3.
4.
Reduction in size of key consumer segments Shift in important usage occasions
Shift in need for emotional benefits
Emergence of new Premium or Economy products with “disruptive” price / value offering
Downwards repositioning of prominent premium brand or “Premium imitation” by strong retailer brand
Key Drivers Of Market Structure Possible Impact of Recession
3.

40
Change In Market Structure Example: Premium Coffee (1)
The opportunity to create high brand value can be reduced when a recession fuels a competitive battle
McDonald’s attacked Starbucks and the premium segment by rolling out McCafé with the following strategy
– Deliver high rational benefits (taste)
– Use new brewing machine technology to enable disruptive price / value offering
– Promote new emotional benefits (“smarter, cheaper way to get premium experience”)
– Aggressively mock the emotional benefits offered by Starbucks
$0.00
$0.50
$1.00
$1.50
$2.00
$2.50
Price Vs. Quality of Away-From-Home Coffee Products
Economy
Coffee Shops
Consumer Perceived Benefit
Pri
ce P
er
8 o
z. C
up

41
Change In Market Structure Example: Premium Coffee (2)
Starbucks countered the attack by McDonald’s with the following moves: – Introduction of Pike Place Roast,
a 25% lower-priced premium brewed coffee
– Introduction of VIA, an innovative, high-quality instant offered at less than 40% of the average brewed cup
These moves effectively lowered the price / value relationship among key premium brands leading to a reduction in overall price realization
$0.00
$0.50
$1.00
$1.50
$2.00
$2.50
Price Vs. Quality of Away-From-Home Coffee Products
Consumer Perceived Benefits
Pri
ce P
er
8 o
z. C
up
Economy Coffee Shops

42
A recession can alter the price / value proposition and affordability for key customer segments
Growth in premium motorcycles was strongly supported by multiple purchases and frequent trade-ins
These purchasers benefited from access to easy credit and high trade-in values of their used bikes
The recession has cut-off easy financing and drastically reduced the trade-in value of used bikes, thus altering affordability for sizable user segments
Change In Market Structure Example: Premium Motorcycles
Ave
rage
Pri
ce [
$k]
2000 2002 2004 2006 2008 2010
$0k
$4k
$8k
$12k
$16k
$20k New Premium Motorcycle
Used Trade-In Motorcycle
Motorcycle Prices, 2000 – 2010

43
Change In Market Structure Example: Premium Jeans
Strong economy or retailer brands can use successful “premium imitation” to alter the market structure
GAP has invested in new improved denim, better techniques for stonewash, and aggressive advertising to launch jeans with characteristics imitating premium denim
– 1969 premium branded jeans designed to offer comparable fit and styling as $200+ jeans at price points starting at $55
– Successfully launched in August 2009 and credited with helping to drive YOY sales increase of 5+%
Premium imitation can draw significant volume from the Premium segment into the Economy segment

44
Change In Market Structure Example: Hard Candy Nail Polish
$0.00
$3.00
$6.00
$9.00
$12.00
$15.00
Price vs. Quality Of Nail Polish, 1997
Consumer Perceived Benefit
Pri
ce P
er
Un
it
A successful premium brand can fall on hard times and reemerge as an Economy brand
Hard Candy, a fashionable premium brand in the 1990’s known for its extravagant colors, sold only in department stores
In 1999, the company faltered, was acquired by LVMH and sold again to NuWorld Beauty
The new owner dramatically downward positioned this brand and created an exclusive relationships with Wal-Mart
Wal-Mart now has a “Premium” brand for an economy line
Source: Factiva search, LA Times, InStyle Magazine
Wal-Mart Hard Candy Display, 2010

45
Impact Of Recessions On Premiumization Section Summary
Two powerful and opposing forces – Premiumization vs. Economization – shape the market structure in every consumer goods category. Which forces will gain dominance primarily depends on the opportunity to create brand value
Premiumization is a long term trend that has driven the growth of many categories through recessionary periods. This trend will continue through the current recession
Recessions can alter the market structure of a category
Market leaders must remain vigilant for any fundamental changes and protect key drivers of Premiumization market structure. This is particularly important for categories that rely on high emotional value creation to drive the consumer price / value proposition.

46
III. Accelerating Out Of The Recession

47
Accelerating Out Of The Recession
Recessions can alter market structures and make it very challenging for companies to accelerate the return of Premiumization
– Premium / Super-Premium segments of many categories have been hit particularly hard as consumers reduce or delay purchase, trade-down quality, or exit a category altogether
– Long-held internal management beliefs and paradigms are no longer working
– New realities may have changed how consumers and customers perceive and value product and service offerings
– Loss of share, lower than expected profitability, and lack of a common view of the problem create stress
Alliance Consulting Group has developed a strategy process for how to examine the Four Dimensions of Market Structure

48
The strategy process addresses the Four Dimensions of Market Structure:
A. Reassess Rational Benefit Landscape
B. Reassess Emotional Benefit Landscape
C. Determine Value Line Evolution
High Brand Value Creation 1.
A. Redraw Customer Need Map
C. Evaluate Perceived Product Performance By Segment
B. Develop Actionable Customer Strategic Segmentation
Real Customer Need 2.
A. Examine Price/Value Proposition Of Key Competitors
B. Understand Success Drivers Of Different Price/Value Propositions
C. Evaluate Scenarios For Competitive Value Repositioning
Favorable Price / Value Proposition 3.
A. Analyze “Health” Of Competitive Dynamics
B. Assess Level Of Strategic Alignment With Key Trade Partners
C. Examine Outlook For Industry “Disruptions”
Constructive Competition And Trade Relations
4.
Strategy Development Approach

49
Key Activities
Understand the “job” that the product performs for the customer
Identify tangible dimensions of performance (e.g., taste, efficacy, speed)
Evaluate how well competitive products perform desired “job”
Understand desired “personal” benefit profile (i.e., how the product makes the customer feel about him/herself)
Understand desired “social” benefit profile (i.e., how the product makes the customer look to others)
Evaluate interaction of personal and social benefit profiles for relevant competitors
Map value position of all major competitive offerings on benefit grid (i.e., rational benefits vs. emotional benefits)
Compare pre-recession value mapping to current state
Determine implications of value line shift in terms of market share gain/loss; relative value creation; etc.
A. Reassess Rational Benefit Landscape
B. Reassess Emotional Benefit Landscape
C. Determine Value Line Evolution
High Brand Value Creation 1.
1. High Brand Value Creation

50
A. Redraw Customer Need Map
C. Evaluate Perceived Product Performance By Segment
B. Develop Actionable Customer Strategic Segmentation
Real Customer Need 2. Key Activities
Identify current “need states” of customers and determine how they have been impacted by the recession
Examine the extent to which need state changes are long-lasting or if/when they will revert to earlier recognized patterns
Understand implications for future category outlook
Determine the most important drivers of purchase/usage behavior and how they vary by need state
Based on need state assessment, perform strategic customer segmentation analysis
Ensure “actionability” of strategic segmentation over 3-5 year time horizon
Evaluate perceived product performance of key products by strategic customer segment
Understand what type of products are gaining share or losing share and why
Identify potential new “white spaces” that may have emerged as a result of the recession
2. Real Customer Need

51
Key Activities
Gather price/value data for all major competitors and substitute products
Determine appropriate comparison parameters (e.g., per unit price, per usage occasion, volume-based)
Document all relevant price/value propositions in the marketplace – understand dynamics pre-recession vs. current state
Identify drivers of price/value relationships (e.g., cost curves, economies of scale/scope, consumer perceptions)
Determine which drivers are the most relevant and meaningful to different strategic customer segments
Determine ability of various competitors to change current price/value proposition
Evaluate different scenarios to potentially evolve current price/value proposition
Model likely impact on market (i.e., market share gain/loss; impact on growth and profitability)
Prioritize most attractive scenarios to potentially pursue
A. Examine Price/Value Proposition Of Key Competitors
B. Understand Success Drivers Of Different Price/Value Propositions
C. Evaluate Scenarios For Competitive Value Repositioning
Favorable Price / Value Proposition 3.
3. Favorable Price / Value Proposition

52
A. Analyze “Health” Of Competitive Dynamics
B. Assess Level Of Strategic Alignment With Key Trade Partners
C. Examine Outlook For Industry “Disruptions”
Constructive Competition And Trade Relations
4. Key Activities
Examine how competitive dynamics have evolved as a result of the recession (e.g., extreme discounting; introduction of value brands)
Analyze strengths and weaknesses of key competitors and their respective abilities to influence competitive dynamics (either positively or negatively)
Determine “ideal” market state to maximize value creation for company and category (may or may not be aligned)
Understand strategic goals of key trade partners (e.g., retailers, distributors, suppliers)
Assess how goals have evolved as a result of the recession and what the likely future outlook will be
Evaluate level of strategic alignment across trade partners in current environment and how sustainable it is
Holistically search for other potential industry disruptions (e.g., technology, business models, consumer behaviors, financing mechanisms, etc.) beyond the economy
Identify those potential disruptions which can be acted against and those that can only be planned for
Make strategic decisions to act, invest or prepare as appropriate
4. Constructive Competition And Trade Relations