how much energy really gets lost from partial shading?
TRANSCRIPT

1
John Berdner, SolarEdge
General Manager for North America
Field Results of Energy Maximizing
Distributed DC Topology –
Residential & Commercial Installations
8. September, 2010
2
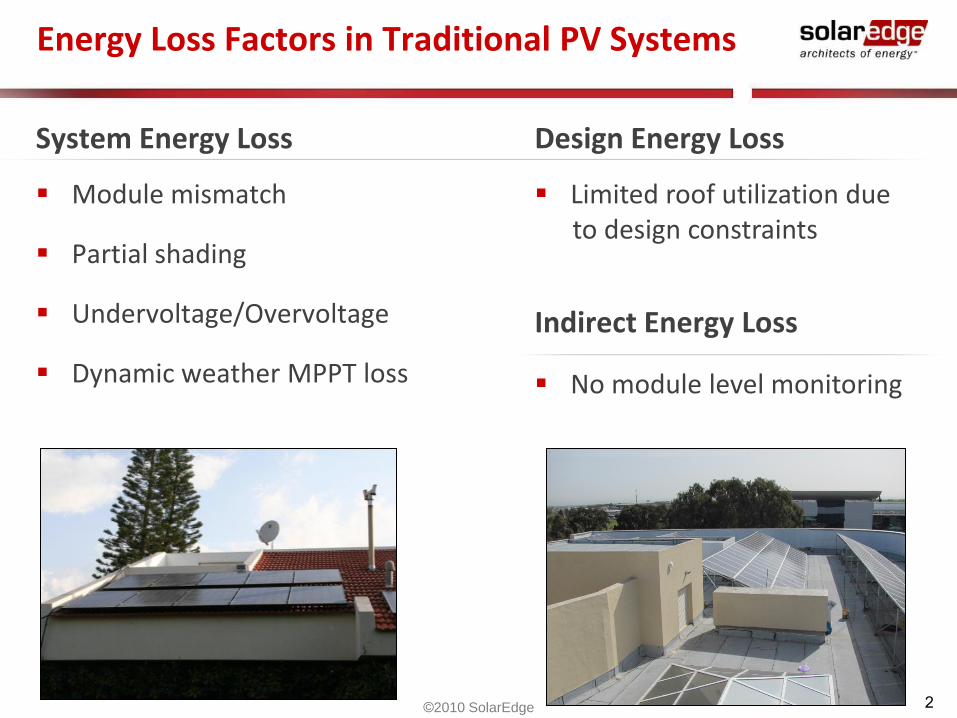
System Energy Loss
Module mismatch
Partial shading
Undervoltage/Overvoltage
Dynamic weather MPPT loss
Energy Loss Factors in Traditional PV Systems
Design Energy Loss
Limited roof utilization due
Indirect Energy Loss
No module level monitoring
©2010 SolarEdge
to design constraints

3
Power Optimizer
SolarEdge System Overview
Inverter
Monitoring Portal
Module level optimization
Fixed voltage - ideal installation
Module level monitoring
Enhanced safety solution
InternetMonitoring Server©2011 SolarEdge

4
SolarEdge Distributed Technology
©2010 SolarEdge
ASIC-based Power Optimizers achieve:
Per-module Maximum Power Point Tracking (MPPT)
Efficiency: 98.8% EU weighted (99.5% peak)
Conversion modes: buck, boost and buck/boost
Wide module compatibility: 5v-125v, up to 400w
Power Line Communication transceiver
Module shut-down unless connected to an operating inverter
250/300/400W
Module Add-on
250/350W Module
Embedded
350W Thin Film
Module Add-on

5
String voltage is always fixed, regardless of temperature and string length
Flexible design for increased roof utilization:
⁻ Parallel strings of unequal lengths
⁻ Modules on multiple roof facets
⁻ Modules with different power ratings
⁻ Modules of different technologies
Longer strings lead to savings on wiring and BoS components
String voltage is always optimal for DC/AC conversion
High inversion efficiency: VDC ≝ VAC·√2+ε
Prevention of under/over voltage situations
Inverter cost reduction
Fixed String Voltage - Enabler
©2010 SolarEdge

6
Field Trials and Results
©2010 SolarEdge

7
25 Suntech 280W modules 34 Suntech 210W modules 4 Suntech 185W modules One power optimzier per
module 3 SolarEdge SE5000 inverters 1 string per inverter:
20, 20, 23 modules
©2010 SolarEdge
Roof Utilization Case Study – Israel
Optimal roof space utilization enabled a 15kW residential installation Four facets covered Unmatched modules in each string were necessary:
Different module sizes (and rating) Different tilt and azimuth

8
280w
East
210w
East
280w
West
210w
West
280w
West
210w
West
280w
East
210w
East
Module-level monitoring reveals: No mismatch losses (module-level MPPT) No string mismatch losses (length agnostic fixed string voltage)
Attractive 5.1 kWh/kWp per day during August (compared to 5.5 for South-only sites)
©2010 SolarEdge
Roof Utilization Case Study – Results

9
Side by side energy comparisons under similar conditions:
Standard inverter compared to distributed system
Both systems subjected to:
Identical total DC capacity (otherwise comparing kWh/kWp)
Identical module tilt and orientation
Identical irradiance and temperature conditions
Identical shading scenarios
Comparative Energy Case Study Methodology
Traditional system Distributed system©2010 SolarEdge
Power
Optimizer
Power
OptimizerPower
Optimizer
Power
Optimizer

10
Comparative Case Study 1 - Italy
©2010 SolarEdge
Power optimizers + SE5000 compared to four traditional inverters of various brands (5kW, 5kW, 3kW, 6kW)
Comparison without shading, and with simulated shading. Experiments done by Albatech, a MetaSystem Group company, an Italian
MW-scale turn-key integrator, and a technology oriented PV distributor.

11
Under unshaded conditions distributed system produced 2.3% - 6.4% more energy than the traditional inverters
0.00
10.00
20.00
30.00
40.00
50.00
60.00
kW
h
Energy Production 06-15 July 2010
©2010 SolarEdge
Comparative Case Study 1 – Unshaded
Po
we
r O
pti
miz
ers
+ S
E5000
12
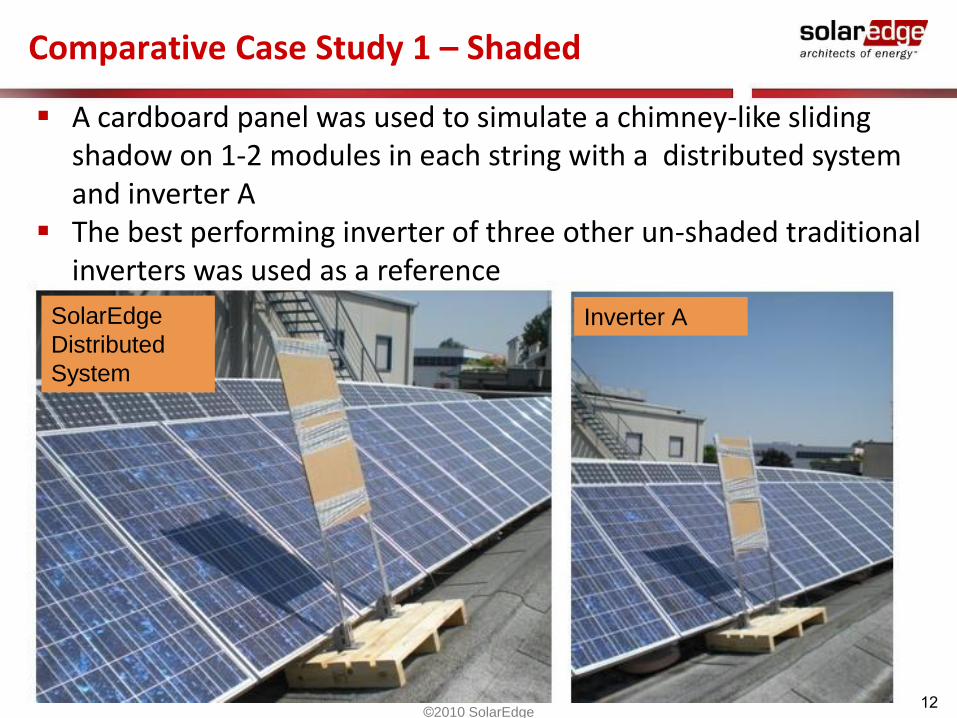
SolarEdge
Distributed
System
A cardboard panel was used to simulate a chimney-like sliding shadow on 1-2 modules in each string with a distributed system and inverter A
The best performing inverter of three other un-shaded traditional inverters was used as a reference
©2010 SolarEdge
Comparative Case Study 1 – Shaded
Inverter A
13
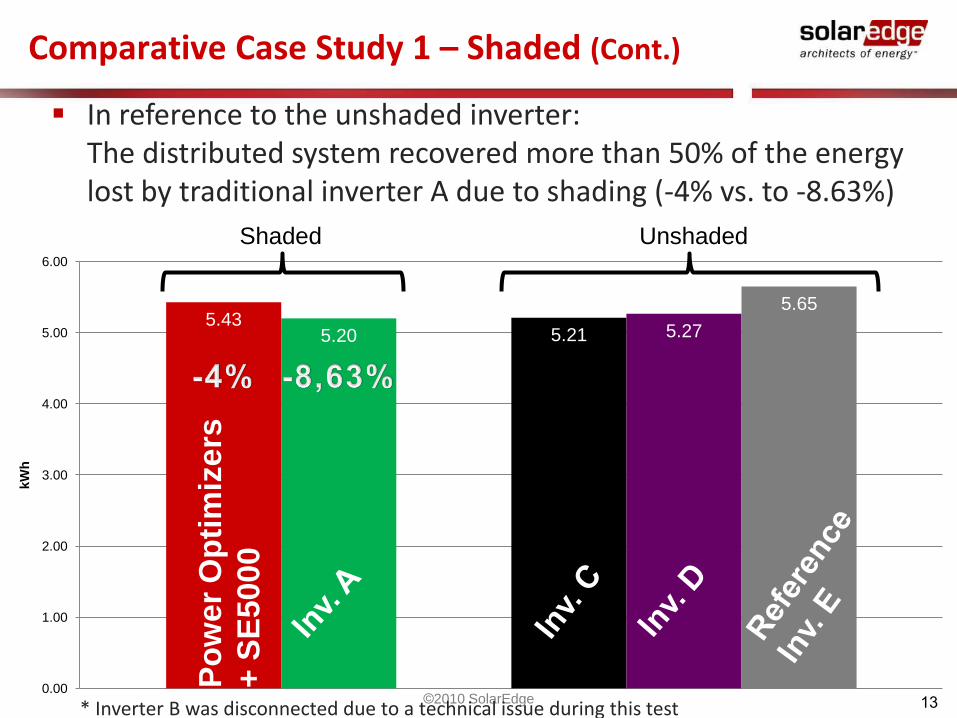
In reference to the unshaded inverter: The distributed system recovered more than 50% of the energy lost by traditional inverter A due to shading (-4% vs. to -8.63%)
©2010 SolarEdge
Comparative Case Study 1 – Shaded (Cont.)
5.435.20 5.21 5.27
5.65
0.00
1.00
2.00
3.00
4.00
5.00
6.00
kW
h
Shaded UnshadedP
ow
er
Op
tim
izers
+ S
E5000
* Inverter B was disconnected due to a technical issue during this test

14
Comparative Case Study 2 – Czech Republic
©2010 SolarEdge
Power optimizers + SE5000 compared to 5kW inverter of a leading brand Each inverter connected to 2 strings x 12 AWS modules x 185w = 4.4kWp Three partly shaded modules in each string of each system A third system remains unshaded for reference Test performed by American Way Solar, one of CZ largest PV distributors
Unshaded reference
Shaded SE5000
Shadedtraditional

15
63.1258.96
45.25
0
10
20
30
40
50
60
70
1 2 3
0
2
4
6
8
10
12
14
Power Optimizers + SE5000Traditional Inverter
Dai
ly e
ner
gy, k
Wh
Tota
l en
erg
y, k
Wh
©2010 SolarEdge
Comparative Case Study 2 – Results
The distributed system produced 30.3% more energy than the traditional inverter (58.96 kWh vs. 45.25 kWh)
In reference to the unshaded inverter, the distributed system recovered 77% of the energy lost by the traditional inverter due to shading (6.5% loss vs. 28.3% loss)
ShadedUnshadedShaded

16
Power optimizers + SE5000 compared to traditional 5kW inverter with multiple MPP trackers
2 string x 12 and 13 Solon P210 modules x 210w = 5.25kWp A section inside a large scale PV field No shading
©2010 SolarEdge
Comparative Case Study 3 - Germany

17
The distributed system produced 1.65% more energy than the traditionalinverter
On days with dynamic weather conditions, distributed module-level MPPTrecovers energy otherwise lost due to delayed MPPT process
Power Optimizers + SE5000
Traditional Inverter
Module-level MPPT energy gain on that day: +2.9%
Power
©2010 SolarEdge
Comparative Case Study 3 - Results

18
As shown in comparative case study 3, moving clouds induce rapidfluctuations in irradiance level
Centralized inverters are
more limited in their ability
to track changes in Imp
as fast as they occur,
compared to module-level
MPP trackers
©2010 SolarEdge
The Impact of Dynamic Weather Conditions
±3kW fluctuations exhibited
for a 5kW inverter in the
span of minutes
10:00 – 11:00
Sep 2nd 2010
19©2010 SolarEdge
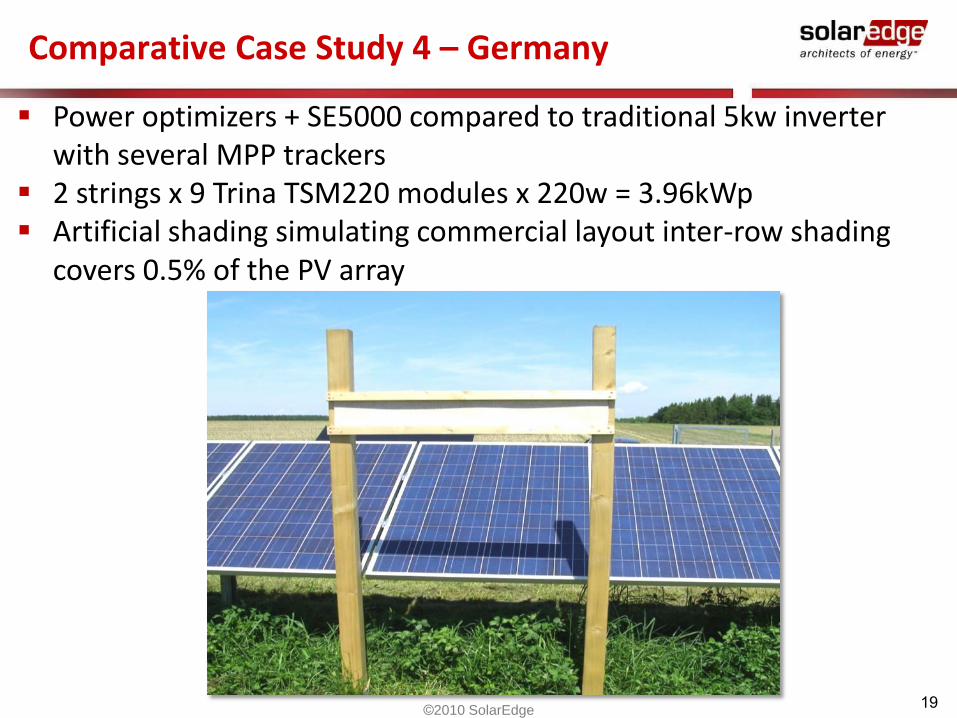
Power optimizers + SE5000 compared to traditional 5kw inverter with several MPP trackers
2 strings x 9 Trina TSM220 modules x 220w = 3.96kWp Artificial shading simulating commercial layout inter-row shading
covers 0.5% of the PV array
Comparative Case Study 4 – Germany

20
Intr
od
uctio
n
SolarEdge Daily Energy gain vs. traditional inverter [%]
©2010 SolarEdge
Comparative Case Study 4 – Results
The distributed system produced 4% - 8% more energy than the traditional inverter on most days of the month
Distributed system production was lower on days with very low irradiance, due to sizable self consumption of the prototype DSP version of the unit, now replaced by an efficient ASIC

21©2010 SolarEdge
Layout Power optimizers + SE5000 compared to traditional inverter of a
leading brand 2 strings x 7 BP 3200N modules x 200w = 2.8kWp
Shading
Shade from a nearby electricity cable
Typical of residential sites
Module-level monitoring revealed shading pattern
©2010 SolarEdge
Comparative Case Study 5 – Spain

22
Traditional [kWh]
SolarEdge [kWh]
Weekly Energy Gain [%]
Accumulated Energy comparisons shows the distributed system consistently produces 4% more energy than the traditional inverter
Ener
gy G
ain
in [
%]
©2010 SolarEdge
Comparative Case Study 5 – Results

23
Inverters Power optimziers + SE6000 compared to two traditional 3kw inverters 4 strings x 10 Isofoton IS-150P modules x 150w = 6 kWp
Inter-row shading
Shading Inter-row shading Typical of commercial roof
with dense installations Modules are shaded for
2-3 hours every morning
Comparative Case Study 6 - Spain
©2010 SolarEdge

24
On sunny days the distributed system produced up to 14% more energy due to intensified partial shading
On very cloudy days the distributed system produced 2% – 3% more energy. Clouds and low irradiance cast diffuse light with little or no partial shading.
©2010 SolarEdge
Comparative Case Study 6 - Results
The distributed system produced 4.5% more energy on average than the traditional inverter.

25
whenhowwhat
whowhere
why
whenhowwhat
whowhere
why
Questions
Questions!
©2010 SolarEdge

26
Thank you
Email:Twitter:Blog:
www.twitter.com/SolarEdgePVwww.solaredge.com/blog
John Berdner, General Manager North America
©2010 SolarEdge
Website:www.solaredge.com