how greater access is changing the world - fedex€¦ · how greater access is changing the world...
TRANSCRIPT
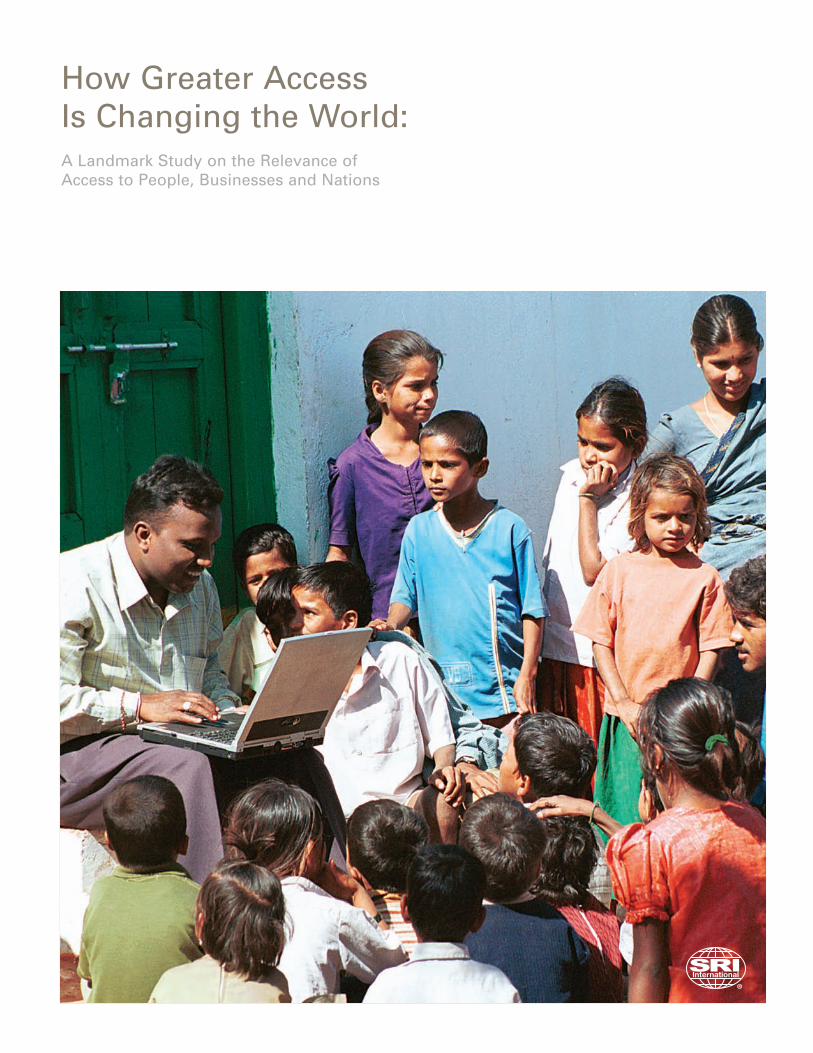
How Greater Access Is Changing the World: A Landmark Study on the Relevance of Access to People, Businesses and Nations
International®

How Greater Access Is Changing the World
Contents:
-Access Overview
-Opportunities for People
-Opportunities for Business
-Opportunities for Nations
-FedEx: Powering Global Access


THE POWER OF ACCESS Executive Overview
FedEx Corporation SRI International i
Higher Personal
Satisfaction,Fulfillment
Increased Access
Innovation, Investment to Expand
Access
Business Expansion
National Economic
Growth
Higher Expectations
for Access
Perpetual Cycle of Access Generation
Expansion
Higher Personal
Satisfaction,Fulfillment
Increased Access
Innovation, Investment to Expand
Access
Business Expansion
National Economic
Growth
Higher Expectations
for Access
Perpetual Cycle of Access Generation
Expansion
Access increases our ability to improve our current conditions and future prospects.
Access creates a perpetual cycle as the “invisible hand” linking supply and demand.
Levelof
Access
Time
1800 1900 2000
Access to Information
Access to Physical Things
Access Has Risen Dramatically Over Time
Internet(widespread use 1990s)
Telefax(widespread use 1960s)
Advanced Logistics
Airplane (1903)
Gas-Powered Automobile
(1885)Steam-Powered
Locomotive (1804)
Telephone (1875)
Telegraph (1835)
Overnight Delivery (1973)
Levelof
Access
Time
1800 1900 20001800 1900 2000
Access to Information
Access to Physical Things
Access Has Risen Dramatically Over Time
Internet(widespread use 1990s)
Telefax(widespread use 1960s)
Advanced Logistics
Airplane (1903)
Gas-Powered Automobile
(1885)Steam-Powered
Locomotive (1804)
Telephone (1875)
Telegraph (1835)
Overnight Delivery (1973)
Despite its centrality to many aspects of life, the concept of access has not been thoroughly studied. This report, the first of a series on access and its impacts, defines and explores various dimensions of the concept of access. What is Access? – Access is a catalytic process that enables interactions, contacts, and exchanges among people, businesses, and nations. While markets represent platforms for transactions to take place, access provides the means for markets to operate. Access indicates ability – the ability to accomplish a broad range of actions, from attaining physical presence to communicating, and from acquiring to using. Historical Context – Over the past three centuries, access has had a measurable impact on people’s lives, businesses, and the economy. Individuals once had access only to those things and people that were within walking distance, severely constraining their choices and capabilities. As transportation and communications systems have evolved, access has continuously increased. This march toward continuously greater access is accelerating. The Access Model – The following foundational concepts underlie access: Functional components: Access is a function
of time, space, and information. Beneficiaries: Access benefits people,
businesses, and nations. Opportunities: Access provides the
opportunity to participate, choose, and improve.
The Cycle of Access – As time, space, and information converge toward perfect access, people, businesses, and nations derive increasing benefits. Greater access results in expanded participation, choice, and

THE POWER OF ACCESS Executive Overview
FedEx Corporation SRI International ii
Access is the core value created by all FedEx companies.
Access Index and GDP Per Capita
$0
$5,000
$10,000
$15,000
$20,000
$25,000
$30,000
$35,000
$40,000
$45,000
$50,000
0 10 20 30 40 50 60 70 80 90 100
Access Index Score
GD
P Pe
r Cap
ita (c
onst
ant 1
995
US$
)
Greater access relates strongly to higher levels of income.
Japan
GermanyUnited States
Hong Kong
United Kingdom
Brazil
China
India
Russia
improvement, which in turn affect the ultimate levels of opportunities for participants. Access expands in a dynamic, ongoing way, as increased access leads directly to greater personal satisfaction – and spurs both higher expectations for access and, ultimately, the innovations required to meet ever-increasing demands for access. Measuring Access – the Access Index™ – The Access Index™ was created to measure the level of access at a given time in the perpetual cycle. It represents the first attempt to quantify access and provides insights into its power and importance at the national level. The index is made up of 22 variables measuring physical access and information access for 75 countries. Key findings from the index include: Physical and information access are closely aligned for the countries studied. Higher access enables faster economic growth. The top ten countries in the
Access Index™ had an average GDP per capita growth rate of 22.6 percent over the 1993-2003 period, whereas growth among the bottom ten scorers was only 14.1 percent over the same period.
Greater access relates strongly to higher levels of income. Access is critical for economic survival and growth. Access is particularly
important for countries that have small internal markets, have limited domestic resources, and/or rely heavily on international trade for economic survival and growth.
FedEx and Access – The various FedEx operating companies are united and bonded by the fact that their core activity is generating access for customers as well as for employees, and by the fact that access is the core value that all FedEx companies espouse. The explosive expansion of access over the past few decades has bestowed upon the current population a level of access that would never have been imagined by previous generations. As a result, expectations for greater access are rising constantly. People of all ages want products and information immediately, and from all parts of the world. FedEx helps make that happen.

THE POWER OF ACCESS Executive Overview
FedEx Corporation SRI International iii
Access continues to change. Personal views toward and expectations for access are shaped by what is possible, and FedEx has expanded what is possible. FedEx generates access by collapsing time and space while increasing information, thereby conferring value to its customers – people, businesses, and nations.


The Power of Access
FedEx Corporation SRI International iv
CONTENTS
Introduction Historical Context for Access The Access Model
Functional Components of Access Beneficiaries of Access Benefits of Access Cycle of Access Multipliers of Access Impacts
Measuring Access Key Findings
FedEx and Access FedEx Contributions to Access FedEx and the Access Generation
1
2
335678
911
141516
APPENDIX: Access Index™ Methodology and Data Sources
18

The Power of Access
FedEx Corporation SRI International 1
Introduction
Access increases our ability to improve our current conditions and future prospects.
Access is the catalytic process that enables interactions, contacts, and exchanges among people, businesses, and nations. While markets represent platforms for transactions to take place, access provides the means for markets to operate. Gaining access enables us to reach goals that improve our current condition and future prospects. Those with access to what they need or desire can achieve their aspirations, and those without such access will inevitably fail to reach their full potential. Access indicates ability – the ability to accomplish a broad range of actions, from attaining physical presence to communicating, and from acquiring to using. Access also implies connection, which has profound implications for the way we conduct our lives, businesses, and governments. Given these important characteristics, why hasn’t access been identified and studied before? In fact, particular aspects of the concept such as “access to markets” or “equal access” have been addressed, but not the overall phenomenon. The lack of extensive study of access probably stems from access being so well ingrained in everything we do that it is taken for granted, similar to the involuntary actions of our bodies (breathing, heart beats, etc.). As the process of access creation has evolved into access expansion, so too has the scope of access broadened to reflect a more complex equation reflecting its impact over time. In this first of a series of reports on access and its impacts, we will systematically construct the logic of access via the following foundational concepts:
The functional components of access: time, space, and information. The beneficiaries of access: people, businesses, and nations. The opportunities generated by access: to participate, choose, and improve.
Together, these elements form the building blocks for the global Access Index™, which measures the level of access in 75 major countries1 and provides an analytical framework to quantify the growing power of access.
1 In this series of reports, the terms “nation” and “country” are used to describe economies that are generally recognized by international organizations as operating autonomously. As used in these reports, neither term is meant to imply sovereignty or independence of any particular economy included in the reports.

The Power of Access
FedEx Corporation SRI International 2
Historical Context for Access Over the past three centuries, access has had a measurable impact on people’s lives, business development cycles, and the economic growth of nations. Individuals once had access only to those things within walking distance. As a result, their choices and capabilities were severely constrained by lack of access. A major reason for the emergence and growth of villages and towns was the desire of inhabitants to gain access – access to others, to security, to specialized trades, and to other factors associated with human commerce and interaction. As transportation systems, technologies, and communications capabilities evolved and networks expanded in breadth and sophistication, degrees of access continuously increased. These changes led to the creation of advanced civilizations and, eventually, to the integration of all societies into a global society. Levels of access are by no means uniform, but rather vary significantly among individuals, nations, and substantive areas (e.g., products, services, information, etc.). Nevertheless, the march toward continuously greater access is accelerating and inevitable. For example, within just a few years after the invention of computers and the Internet, we are rapidly approaching near-perfect access to certain types of information. The introduction of innovations to transmit physical objects and information has resulted in increasing access, which has risen exponentially in recent years.
Levelof
Access
Time
1800 1900 2000
Access to Information
Access to Physical Things
Access Has Risen Dramatically Over Time
Internet(widespread use 1990s)
Telefax(widespread use 1960s)
Advanced Logistics
Airplane (1903)
Gas-Powered Automobile
(1885)Steam-Powered
Locomotive (1804)
Telephone (1875)
Telegraph (1835)
Overnight Delivery (1973)
Levelof
Access
Time
1800 1900 20001800 1900 2000
Access to Information
Access to Physical Things
Access Has Risen Dramatically Over Time
Internet(widespread use 1990s)
Telefax(widespread use 1960s)
Advanced Logistics
Airplane (1903)
Gas-Powered Automobile
(1885)Steam-Powered
Locomotive (1804)
Telephone (1875)
Telegraph (1835)
Overnight Delivery (1973)

The Power of Access
FedEx Corporation SRI International 3
While every generation has witnessed improvement in access, and future generations are expected to have even more access than we have now, people today benefit from a unique level of access to physical things, to information, and to each other. The expectations, behavior, and power of access are exerting profound changes in the ways in which people, businesses, communities, and nations operate, giving rise to both considerable challenges and major opportunities. The Access Model A fundamental logic underlies the process of creating and expanding access. Unraveling this logic into its components and beneficiaries propels greater understanding of the scale and importance of the concept of access.
Functional Components of Access
Access is a function of time, space, and information.
The process of generating access revolves around three functional variables – space, time, and information – as described in the following table.
Access Component Component Description
Space
Space represents the distance between the entity seeking access and the “thing” (physical or informational) being sought. It involves geography and the physical locations of supply and demand. Supplies that are nearby are normally easier to access than those in distant locations. Access dramatically reduces the economic constraint of geographic distance and allows entirely new patterns of production, consumption, and economic development.
Time
This component centers on the amount of time required to obtain that which is being sought. Access not only creates the ability to obtain goods, services, information, etc., in an increasingly short period of time, but also allows the orchestration of delivery, meaning delivery in the specific time horizon desired by the user/customer. Both time-related changes have profound implications for consumer and producer behavior.

The Power of Access
FedEx Corporation SRI International 4
Access Component Component Description
Information
Information is anything that reduces uncertainty. Since uncertainty affects the consequences of decisions, information aids decision-making by helping one to choose between alternatives. Information may be in the form of facts, opinions, or algorithms that are capable of being transmitted and reproduced.2 Increasingly, information is available in digital form.
At its core, access can be explained in the following formula, in which access (A) is a function of time (T), space (S), and information (I).
Achieving access is determined by each of these inputs, or “independent variables.” In various ways, they collectively establish degrees of access.
One consequence of increasing access is the reduction of time required to gain access, thus increasing available time. Access also facilitates the orchestration of products and services provision so that consumers/users are able to obtain what they desire in the timeframe they prefer, rather than the timeframe convenient for the producer or deliverer.
If the desired object is physically located out of one’s reach, then access
will be denied. Improved access has the effect of collapsing space (or alternatively, increasing usable space, since actors can operate effectively within larger areas).
Without information about the existence or location of the desired object,
then one will not obtain it. Increasing information generally expands degrees of access.
Access is generated by reducing time and space, and by providing relevant information. The degree of access generated thus depends upon the degree of reduction in time and space and the level of information provided.
2 Arrow, K., (1979), “The Economics of Information,” in Dertouzos and Moses, J., eds., The Computer Age: A Twenty-Year Review. Cambridge: MIT Press, pp. 302-317.
f (T, S, I) = A

The Power of Access
FedEx Corporation SRI International 5
Beneficiaries of Access
Access benefits people, businesses, and nations.
In human society, all groupings of people need access to satisfy their basic needs and provide fulfillment. Scaling up from the level of the individual, the groups that participate in and benefit from access include People, Businesses, and Nations. While the needs and desires of each group vary, what they have in common is that in order to achieve their full potential they all need access to physical things as well as intangibles such as opportunities and information.
Access Beneficiary Beneficiary Description
People
People need access to products and services to sustain themselves and their consumer desires. Their access needs generally relate to goals of achieving personal income and consumption – education, jobs, health, food, consumer products, personal items, recreation, intellectual stimulation, etc., and the information to obtain them.
Businesses
Businesses of all sizes need access to markets, access to information, and access to inputs to be viable and competitive. Their key access needs focus on various points in their value chains – inputs, logistics, distribution, marketing, etc.
Nations
Nations and the communities and regions within them (large or small, urban or rural, centrally-located or remote) must have access to resources and trading opportunities in order to facilitate productive economic activities, sustain standards of living, and achieve economic growth.

The Power of Access
FedEx Corporation SRI International 6
Benefits of Access
Access provides the opportunity to participate,
choose, and improve.
For all beneficiaries, access produces significant opportunities to participate, choose, and improve, as indicated in the following table.
Access Benefit Benefit Description
Participate
Access allows people, businesses, and nations to participate in activities and markets important to their well-being. For example, individuals who have access to education and training can compete more effectively in the job market.
Choose
Choice lies at the core of markets. The availability of different products or services to maximize utility or satisfaction will continue to change consumer (and buyer) behavior. For example, consumers visiting grocery stores are regularly given the choice of new products, including exotic fruits and vegetables, because of increasing access to global supplies on a year-round basis.
Improve
Allowing individuals, businesses, regions, and nations to link themselves to others in multiple ways is reordering and improving business, economic, social, and cultural relationships. For example, people can interact with their families and friends, learn, conduct research, and obtain products on almost a virtual basis. Businesses can source and sell globally. Nations can increase rates of growth through international trade.
The opportunities created by access ultimately lead to impacts on the beneficiaries of access. The overall impact of access can be modeled as a function of participation by, choice available to, and improvement affecting people, businesses, and nations. In this equation, P stands for level of participation, C stands for amount of choice available, and δ stands for improvement in the status quo. The different types of
Impact = f people (P, C, δ) + f businesses (P, C, δ) + f nations (P, C, δ)

The Power of Access
FedEx Corporation SRI International 7
impacts derived by people, businesses, and nations are summarized in the following table.
Access to What? Impacts of Access
People
More choices of products/services Education/training Job opportunities Information and financial resources Personal and professional
networks
Choice and higher expectations
Empowerment Connection Well-being
Business
Customers Inputs Substitutes Information Financial resources Technologies New business models
Market reach Supply chain strength Innovation Growth and
competitiveness
Nations
Global markets Global supplies Investment Information, financial resources
and physical resources Technology and innovation
Broader markets Global connection National and international
cohesion Growth and prosperity
Cycle of Access
Access creates a perpetual cycle as the
“invisible hand” linking supply and demand.
Access plays a very important role in creating opportunities with positive impacts. Access is, in a large sense, the catalyst that brings together the needed/desired object and the entity seeking it, i.e., the “invisible hand” linking supply and demand. Access is the channel for transactions to be realized. The essence of commerce is transaction, and without transaction there is no commerce. Access provides mechanisms for engaging people and organizations at both the supply and demand ends of commerce. As time, space, and information converge toward perfect access, people, businesses, and nations derive increasing benefits. Greater access results in expanded participation, choice, and improvement, which in turn affect the ultimate levels of impact on the participants.

The Power of Access
FedEx Corporation SRI International 8
Higher Personal
Satisfaction,Fulfillment
Increased Access
Innovation, Investment to Expand
Access
Business Expansion
National Economic
Growth
Higher Expectations
for Access
Perpetual Cycle of Access Generation
Expansion
Higher Personal
Satisfaction,Fulfillment
Increased Access
Innovation, Investment to Expand
Access
Business Expansion
National Economic
Growth
Higher Expectations
for Access
Perpetual Cycle of Access Generation
Expansion
Access expansion is dynamic, ongoing, and permanent, as shown in the following diagram. The provision of increased access leads directly to greater personal satisfaction. Higher levels of satisfaction not only lead to greater demand by existing customers, but also spread to other customers through word of mouth, the media, and other vehicles, thus creating opportunities for businesses to expand their activities. These productive activities aggregate to greater growth at the community and national levels. Improved standards of living trigger heightened expectations. These expectations, in turn, stimulate innovation and investment to provide yet greater access, and the cycle continues.
Multipliers of Access Impacts Access is not the only creator of impacts. Other important factors act to produce or augment the desired benefit, including financial resources, knowledge and technology, and sustainability and ethics. These factors are outside (exogenous to) the access model and can be viewed as multipliers, because they increase or reduce the benefits to/impacts on the beneficiary, at any given level of access and opportunity. For example, all other things equal, a person with a higher level of knowledge and skills to take advantage of access and opportunity is expected to achieve greater personal benefits, compared with a person with limited knowledge and skills. Notwithstanding the presence of other requirements/ multipliers of impacts and benefits, without access, transactions will not take place and benefits will not be created.

The Power of Access
FedEx Corporation SRI International 9
Measuring Access
The Access Index™ measures the level of access
at a given time in the perpetual cycle.
Because the concept of access expansion does not fit into traditional ways of thinking about how society advances, few attempts have been made thus far to quantify access or to measure its impacts comprehensively. Nevertheless, it is possible to capture the meaning, level, and implications of access in statistical form through the systematic aggregation of variables into an Access Index™. The Access Index™ developed by SRI International at FedEx’s request provides insights into the power and importance of the concept of access at the national level.3 This index incorporates 22 different variables measuring both physical access and information access. Physical access – eight indicators in two subcategories:
Trade indicators measure the “openness” of an economy from an international trade perspective (tariff revenues, hidden import barriers, etc.).4
Transport indicators measure the extent of access supported by the existing transportation infrastructure (port infrastructure, air transport infrastructure, etc.) in each country.
Information access – fourteen indicators in two subcategories:
Telecommunications indicators measure hardware (main telephone lines, personal computers, etc.), service availability (number of mobile telephone subscribers, speed of Internet access, etc.), and costs of service (cellular connection charges, business and residential telephone monthly subscriber charges, etc.).
News, Media, and Information Services indicators measure the ability to obtain information through various media (televisions, radios, newspapers, etc.).
3 Separate indices measuring the opportunities created by access for People, Businesses, and Nations will be presented in subsequent reports. 4 Ideally, indicators measuring an economy’s openness also would encompass non-trade barriers related to services. However, the range and nature of such barriers are difficult to capture quantitatively and, thus, indicators related to non-trade barriers in services are not incorporated into the Access Index™. As a result, the Access Index™ scores for countries that retain such barriers may overstate the economic openness of certain countries.

The Power of Access
FedEx Corporation SRI International 10
The indicators were selected because they either measure or provide a proxy measurement of certain important aspects of access. In addition, to be included in the index, all of the data were selected from high-quality and reliable sources that use a uniform methodology for all countries covered. The complete list of the 22 indicators, their sources, and the methodology for developing the Access Index™ are presented in the Appendix to this report. The following table displays the Access Index™ scores and rankings of 75 countries for which Access Indices were developed.
Access Index™ Rankings and Scores
1 Hong Kong 91.1 26 Estonia 63.0 51 Bulgaria 37.6 2 Singapore 89.1 27 Greece 62.9 52 China 37.6 3 Denmark 85.3 28 Italy 61.9 53 Ukraine 37.2 4 Switzerland 84.2 29 Slovak Republic 60.3 54 Romania 37.2 5 Netherlands 83.1 30 Czech Republic 59.9 55 Trinidad and Tobago 36.0 6 Finland 82.6 31 Slovenia 59.8 56 Sri Lanka 35.9 7 Germany 82.1 32 Chile 57.4 57 Costa Rica 35.7 8 Sweden 81.9 33 Malaysia 55.3 58 Egypt 35.7 9 United Kingdom 80.5 34 Latvia 51.2 59 India 34.9 10 France 79.0 35 Lithuania 50.9 60 Indonesia 33.7 11 Belgium 74.9 36 Hungary 45.8 61 Colombia 32.7 12 United States 74.8 37 Thailand 44.4 62 Venezuela 31.3 13 Canada 74.6 38 South Africa 44.3 63 Dominican Republic 31.1 14 Austria 74.3 39 Turkey 43.4 64 Peru 31.1 15 Norway 74.0 40 Poland 41.8 65 Philippines 27.4 16 New Zealand 73.7 41 Mauritius 41.5 66 Bolivia 26.3 17 Iceland 72.4 42 Uruguay 41.4 67 Zimbabwe 23.5 18 Australia 69.8 43 Argentina 41.0 68 Paraguay 23.2 19 Japan 69.7 44 Jordan 40.4 69 Honduras 23.2 20 Israel 69.1 45 Mexico 40.4 70 Guatemala 21.5 21 Taiwan 68.3 46 Russia 40.3 71 Ecuador 20.8 22 South Korea 66.9 47 Brazil 39.9 72 Nicaragua 18.5 23 Ireland 64.7 48 El Salvador 39.3 73 Vietnam 18.3 24 Portugal 64.5 49 Jamaica 38.5 74 Nigeria 17.3 25 Spain 64.0 50 Panama 37.8 75 Bangladesh 14.4

The Power of Access
FedEx Corporation SRI International 11
Physical and Information Access Scores
0
10
20
30
40
50
60
70
80
90
100
0 10 20 30 40 50 60 70 80 90 100
Information Access
Phys
ical
Acc
ess
Physical and information access levels are strongly related.
GDP per capita growth (1993-2003)-Top Ten Access Countries - 22.6%-Bottom Ten Access Countries - 14.1%
Hong Kong
Germany
United Kingdom
United States
Japan
Greece
Russia
Brazil
India
China
Key Findings
1. Physical and information access are closely aligned, but do
not always proceed in tandem. 2. Higher levels of access enable higher economic growth. 3. Greater access relates strongly to higher levels of income. 4. Access is critical for economic survival and growth.
1. Physical and information access are closely aligned, but do not always
proceed in tandem. Countries with advanced economies tend to have very high levels of both physical and information access. However, the process of expanding physical and information access may not proceed entirely in tandem. For instance, Japan and the United States have similar levels of physical access, but the United States is considerably more advanced with respect to information access. Likewise, Brazil and Greece have similar levels of information access, even though Brazil’s level of physical access is much lower. Variations in levels of physical and information access have important implications for how countries’ people, businesses, and nations function.

The Power of Access
FedEx Corporation SRI International 12
Access Index and GDP Per Capita
$0
$5,000
$10,000
$15,000
$20,000
$25,000
$30,000
$35,000
$40,000
$45,000
$50,000
0 10 20 30 40 50 60 70 80 90 100
Access Index Score
GD
P Pe
r Cap
ita (c
onst
ant 1
995
US$
)
Greater access relates strongly to higher levels of income.
Japan
GermanyUnited States
Hong Kong
United Kingdom
Brazil
China
India
Russia
TM
TM
2. Higher levels of access enable higher economic growth. The top ten scorers for access achieved an average GDP per capita growth rate of 22.6 percent over the 1993-2003 period,5 whereas the bottom ten scorers performed much lower, attaining an average growth of only 14.1 percent over the same period.6
3. Greater access relates strongly to higher levels of income. Countries
with high Access Index™ scores enjoy significantly higher income levels than those with lower rankings. The Access Index™ scores strongly suggest that access provides people, businesses, and nations with opportunities to participate, choose, and improve in order to fulfill their potential.7 Most countries with Access Index™ scores below 60 have per capita incomes of less than $5,000, while those with scores over 60 typically have per capita incomes above $15,000.
5 Average growth for the 10 countries over the entire period, not annually. 6 The top ten nations, starting from the highest, include Hong Kong, Singapore, Denmark, Germany, Switzerland, Netherlands, France, Finland, Sweden, and the United Kingdom. The bottom ten scorers, starting from the lowest, include Bangladesh, Nigeria, Vietnam, Nicaragua, Ecuador, Guatemala, Honduras, Paraguay, Zimbabwe, and Bolivia. 7 To be sure, several access variables are driven by increases in levels of development. In addition, as nations develop, their citizens – both people and businesses – typically demand greater access.

The Power of Access
FedEx Corporation SRI International 13
4. Access is critical for economic survival and growth. Access is particularly important for countries that have small internal markets, have limited domestic resources, and/or rely heavily on international trade for economic survival and growth. The top five countries on the Access Index™ scoreboard all have relatively small domestic markets (see 2002 GDP in the table below), and four of them have populations smaller than eight million. These countries also rely heavily on trade for economic survival (see trade as a percentage of GDP in the following table).
Access and the Economy
Rank Country
Access Index™ Score
Trade as a % of GDP
GDP ($ millions)
Population (millions)
1 Hong Kong 91.1 293.3% 159,943 6.79
2 Singapore 89.1 341.4% 88,275 4.16
3 Denmark 85.3 83.0% 172,357 5.37
4 Switzerland 84.2 81.0% 274,469 7.29
5 Netherlands 83.1 120.1% 418,454 16.14
6 Finland 82.6 69.0% 131,567 5.20
7 Germany 82.1 67.5% 1,986,072 82.51
8 Sweden 81.9 81.5% 241,078 8.92
9 United Kingdom 80.5 55.4% 1,563,708 59.23
10 France 79.0 52.2% 1,436,873 59.49
11 Belgium 74.9 164.1% 244,693 10.33
12 United States 74.8 23.4% 10,429,000 288.37
19 Japan 69.7 21.1% 3,972,485 127.40
33 Malaysia 55.3 211.3% 95,164 24.30
46 Russia 40.3 58.8% 345,589 144.07
47 Brazil 39.9 28.9% 460,787 174.49
52 China 37.6 54.8% 1,271,000 1,280.40
59 India 34.9 30.8% 510,241 1,048.64
* Data for trade, GDP, and population are from 2002.

The Power of Access
FedEx Corporation SRI International 14
FedEx Position
in Access Space
Overall
Access
Space
FedEx Position
in Access Space
Overall
Access
Space
Looking at the Access Index™ rankings of major industrialized countries, one may be surprised to find that the United States places 12th, while Japan ranks even lower, at 19th place for its Access Index™ score. The world’s two largest economies have enormous internal markets and resources, with trade therefore only representing a small percentage of their GDP. This may suggest that for economies that are large and wealthy (i.e., have internal resources and markets), access is less critical than for countries that have limited internal markets (due to low per capita income and/or small populations) and that must derive much of their economic growth from trade (e.g., China, Malaysia, Russia, India, etc.). It also should be noted that, absent adequate measures of subtle barriers, especially in services, the economic openness in some countries with high Access Index™ scores may be stronger than otherwise would be warranted if such services-related impediments could be systematically incorporated. FedEx and Access
Access is the core value created by all FedEx companies.
The overall “access space” is created, maintained, and expanded by all actors that create and expand access. FedEx entered that space when it was established, and through the growth of its reach and services it occupies a constantly increasing portion of the access space. The size and contours of the access space continue to change. Personal views toward and expectations for access are shaped by what is possible. FedEx has altered perceptions by expanding what is possible. Therefore, FedEx has not only entered the realm of access, but also continues to increase the scope and level of access. FedEx generates access by collapsing time and space while increasing information, thereby conferring value to its customers – people, businesses, and nations.

The Power of Access
FedEx Corporation SRI International 15
FEDEX IMPACT ON ACCESS
Time. Time sensitivity, not transportation, is the operating theme of FedEx’s activities. All equipment, technologies, human resources, and systems are combined to accelerate velocity, not only to collapse time for delivery to a minimum, but also to guarantee time-definite delivery.
Space. A hallmark of the corporation is the continuous collapsing of space through the extension of FedEx’s network on a global basis and through reducing the amount of time needed to move packages and freight around the world. While the access space covered by FedEx began with 25 cities in 1973, it has grown to include all of North America plus a total of 220 nations.
Information. FedEx has championed access to information not only internally, but also through transparency to its customers. This approach of complete information transparency throughout the entire supply chain has revolutionized business models.
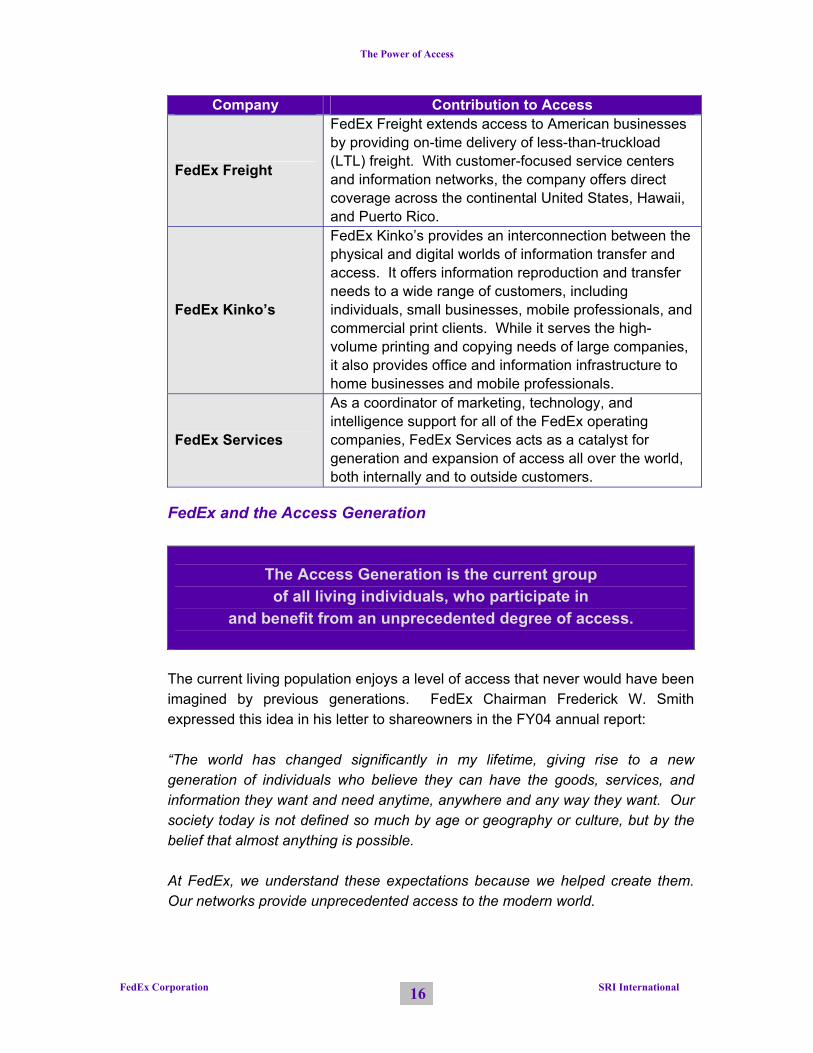
FedEx Contributions to Access The various FedEx operating companies are united and bonded by the fact that their core activity is generating access for customers as well as for employees, and by the fact that access is the core value that all FedEx companies espouse.
Company Contribution to Access
FedEx Corporation
FedEx Corporation provides strategic direction to all of its operating companies that act as agents of access for individuals, businesses, and nations. FedEx Corporation also invests in new technologies and operations to expand the Corporation’s access services and networks.
FedEx Express
FedEx Express pioneered the time-definite shipment business and created the hub-and-spoke logistics model that revolutionized the access market space. By offering reliable, express delivery services to individuals and businesses, FedEx Express has redefined access and enormously contributed to national and global economic prosperity.
FedEx Ground
As a leading service provider in the small-package ground shipping segment, FedEx Ground generates access for millions of participants in the business-to-consumer retail space. It also serves the residential market and extends the reach of businesses to U.S. households with cost-effective shipments.
The Power of Access
FedEx Corporation SRI International 16
Company Contribution to Access
FedEx Freight
FedEx Freight extends access to American businesses by providing on-time delivery of less-than-truckload (LTL) freight. With customer-focused service centers and information networks, the company offers direct coverage across the continental United States, Hawaii, and Puerto Rico.
FedEx Kinko’s
FedEx Kinko’s provides an interconnection between the physical and digital worlds of information transfer and access. It offers information reproduction and transfer needs to a wide range of customers, including individuals, small businesses, mobile professionals, and commercial print clients. While it serves the high-volume printing and copying needs of large companies, it also provides office and information infrastructure to home businesses and mobile professionals.
FedEx Services
As a coordinator of marketing, technology, and intelligence support for all of the FedEx operating companies, FedEx Services acts as a catalyst for generation and expansion of access all over the world, both internally and to outside customers.
FedEx and the Access Generation
The Access Generation is the current group of all living individuals, who participate in
and benefit from an unprecedented degree of access.
The current living population enjoys a level of access that never would have been imagined by previous generations. FedEx Chairman Frederick W. Smith expressed this idea in his letter to shareowners in the FY04 annual report: “The world has changed significantly in my lifetime, giving rise to a new generation of individuals who believe they can have the goods, services, and information they want and need anytime, anywhere and any way they want. Our society today is not defined so much by age or geography or culture, but by the belief that almost anything is possible. At FedEx, we understand these expectations because we helped create them. Our networks provide unprecedented access to the modern world.

The Power of Access
FedEx Corporation SRI International 17
As a parent, I see this ‘power of possibility’ through the eyes of my children. As a business executive, I see how it is transforming our customers. Through either lens, it’s clear to me this access generation will continue to set the agenda for today’s global economy, seeking even greater access to everything they need and desire without regard to time or place. FedEx is in a great position to meet such expectations, creating opportunities across all business lines.” FedEx has been a leading enabler of the Access Generation. In the current economy, people and companies want things from anywhere in the world immediately, and FedEx is operating in an economic space – the access space – that is growing in importance. FedEx not only generates greater access for its customers (and their customers), but also gives investors an opportunity to take a position in the vibrant access space.

The Power of Access
FedEx Corporation SRI International 18
APPENDIX Access Index™ Methodology and Data Sources

The Power of Access
FedEx Corporation SRI International 19
Why an Access Index™? The Access Index™ developed by SRI International at FedEx’s request provides insights into the power and importance of the concept of access at the national level. There are a host of studies that have quantified, ranked, and compared countries based on their level of globalization, economic freedom, competitiveness, and other factors. However, because the concept of “access” does not fit into traditional ways of thinking about how society advances, thus far few attempts have been made to quantify access or to measure its impacts comprehensively. The Access Index™ is similar to a benchmarking exercise. Benchmarking is a powerful, analytical tool that uses a systematic aggregation of variables to assess and compare countries and regions on a certain factor, or set of factors. Benchmarking countries’ level of access allows for an objective analysis of where one country stands in a competitive global environment, helps to pinpoint areas where access is strong, and identifies areas where access is limited. The Access Index™ does not attempt to measure the competitiveness or globalization of countries. Rather, it seeks to measure the “openness” of countries – that is, the access of a country, its businesses, and its citizens to physical items and information from the outside world; as well as the access that the outside world has to a country, its businesses, and its citizens. By quantifying the level of access of nations, the Access Index™ can then be used to conduct comparisons and draw conclusions about the impact of increasing access on a nation, and the relationship between expanding access and growth, competitiveness, and well-being.

The Power of Access
FedEx Corporation SRI International 20
Access Index™ Methodology
Categories of Measurement To succeed and prosper, all people, businesses, and nations require access to two fundamental things: physical items and information. Therefore, the Access Index™ seeks to measure countries’ levels of access in these two categories. These categories were further broken down into four subcategories, described in the table below.
Access Index™ Categories of Measurement Physical Access Information Access
Trade: Measures the “openness” of an economy to international trade (tariff revenues, hidden import barriers, etc.).
Telecommunications: Measures hardware (main telephone lines, personal computers, etc.), service availability (number of mobile telephone subscribers, speed of Internet access, etc.), and costs of service (cellular connection charges, business and residential telephone monthly subscriber charges, etc.).
Transport: Measures the extent of access supported by the existing transportation infrastructure (port infrastructure, air transport infrastructure, etc.).
News, Media, and Information Services: Measures the ability to obtain information through various media (televisions, radios, newspapers, etc.).
Selection of Indicators and Countries The index indicators were selected because they either measure or provide a proxy measurement of certain important aspects of access. Because the Access Index™ attempts to measure “openness” and not growth or competitiveness, the team selected only indicators that measure a country’s potential to obtain or gain access to physical items and information. Indicators such as the amount of trade, level of investment, or growth of GDP are considered to be “outcome” or “impact” indicators. These impacts of access, as they relate to people, businesses, and nations, will be measured in three Access Impact Indices, to be presented in future reports. In each Access Index™ category, quantitative indicators were selected and screened based on the following criteria:

The Power of Access
FedEx Corporation SRI International 21
The indicator is a reasonable, objective measurement of an aspect of access;
The indicator is quantifiable or can be scored based on qualitative/survey results;
The indicator can be drawn from reliable, high-quality data sources; Indicator data are up-to-date (preferably less than 3-4 years old); and Indicator data are available for all, or at least the majority of, the world’s
major economies. A detailed list of the 22 indicators used in the benchmarking analysis is provided at the end of this Appendix. The project team collected comprehensive data for all available countries for the 22 selected indicators. The list of countries was then narrowed down to a set of 75 countries, which were included in the final Access Index™. Only countries that had data available for the majority of the 22 indicators were included in the index. The 75 included countries cover a cross-section of the world’s large, medium, and small economies, and cover all geographical regions. To prevent the large country bias that can easily occur in this type of analysis, many of the indicators were normalized for size (e.g., measuring number of personal computers per capita). It is also important to note that, although statistical measurement and data collection have been dramatically improved and expanded in scope in recent years, the accuracy and comparability of data across countries is far from perfect. Many data sets are based on surveys, for example, which can yield different results in countries facing varying circumstances.
Scoring Methodology Calculation and Normalization of Points for Each Indicator: To make the scoring process as objective as possible, countries received a score for each of the 22 indicators based on the country’s rank for that indicator. If a country ranked the highest for an indicator, it received 75 points for that indicator. Conversely, a country that ranked the lowest in an indicator received one point. Because some countries were missing data on some indicators, the highest possible number of points varied across indicators (ranging from 56 to 75). Therefore, the points were normalized by dividing each country’s points earned by the highest possible number of points for that indicator, and then multiplying the result by 100. For example, Australia received 61 points for the indicator “Hidden Import Barriers,” and the highest possible number of points was 73.

The Power of Access
FedEx Corporation SRI International 22
Therefore, Australia’s normalized score was 83.6 (61/73 times 100). After normalization, the highest possible score for every indicator was 100. Calculation of Total Scores: The Access Index™ scores countries on each of the two Access categories: Physical Access and Information Access. A country’s score for Physical Access or Information Access was calculated by adding all of the normalized points earned for each of the indicators in that category. The total score was then calculated by dividing the country’s total points earned by the maximum possible points a country could have earned if it scored the highest on every indicator. For example, Australia received 528.2 out of a total possible 800 points (or 66.0 percent of the total) for Physical Access, giving Australia a score of 66.0 for the Physical Access category.8 Because the total scores are normalized in this fashion, the maximum possible score for Physical Access and Information Access is 100 points each. The Physical Access and Information Access scores were then combined to calculate a single Total Access score for each country. This score was also normalized, by dividing a country’s total points by the maximum possible score for Physical Access and Information Access combined. For example, Australia received 66.0 points for Physical Access and 73.6 points for Information Access: its combined score is 139.6 points out of a total possible 200 points (or 69.8 percent of the total), giving Australia a score of 69.8 for Total Access. The maximum possible score for Total Access is 100. Weighting of Scores: Depending on one’s perspective on access or the relative importance of different variables, one could assign different weights to each indicator in calculating the points and scores. In this model, most indicators were given equal weight, with the exception of a few instances where two or more similar indicators were combined to create a single indicator.9 The different Access categories also could be weighted when calculating the overall country score. For the purposes of this analysis, however, SRI chose to assign each Access category equal weight. Doing so helps to remove some of the subjectivity implicit in choosing weights for different variables, and it produces a scoring system that more evenly addresses the various factors that affect the level of access of each country.
8 In those few cases where a country was missing data for a particular indicator, the SRI team made the necessary adjustments in the point totals to account for the missing data and to arrive at a score for the country. 9 In a few cases, two or more indicators were combined to create a single indicator. For example, there are four components of cellular phone costs: connection charge, monthly subscription charge, cost of 3-minute local peak call, and cost of 3-minute local off-peak call. In these cases, each indicator was weighted equally – a country’s points for each of the four cellular phone costs indicators were weighted by 0.25 and summed together to create a single indicator of cellular phone costs with a weighting of 1.

The Power of Access
FedEx Corporation SRI International 23
Access Index™ List of Indicators and Data Sources
Physical Access Indicators Indicator Source Publication
Trade Revenues from taxes on international trade as a % of exports plus imports
Fraser Institute Economic Freedom of the World Annual Report 2004
Standard deviation of tariff rates Fraser Institute Economic Freedom of the World Annual Report 2004
Hidden import barriers [In your country, hidden import barriers (that is, barriers other than published tariffs and quotas) are (1=an important problem, 7=not an important problem)]
World Economic Forum Global Competitiveness Report 2004-2005 (Variable 2.11)
Export permits [Approximately how many permits does your company require to export goods? (median response given for each country)]
World Economic Forum Global Competitiveness Report 2001-2002 (Variable 2.19)
Transport
Percent of total roads paved World Bank World Development Indicators
Railroad infrastructure [Railroads in your country are (1=underdeveloped, 7=as extensive and efficient as the world’s best)]
World Economic Forum Global Competitiveness Report 2004-2005 (Variable 5.02)
Port infrastructure [Port facilities and inland waterways in your country are (1=underdeveloped, 7=as developed as the world’s best)]
World Economic Forum Global Competitiveness Report 2004-2005 (Variable 5.02)
Air transport infrastructure [Air transport in your country is (1=infrequent and inefficient, 7=as extensive and efficient as the world’s best)]
World Economic Forum Global Competitiveness Report 2004-2005 (Variable 5.04)

The Power of Access
FedEx Corporation SRI International 24
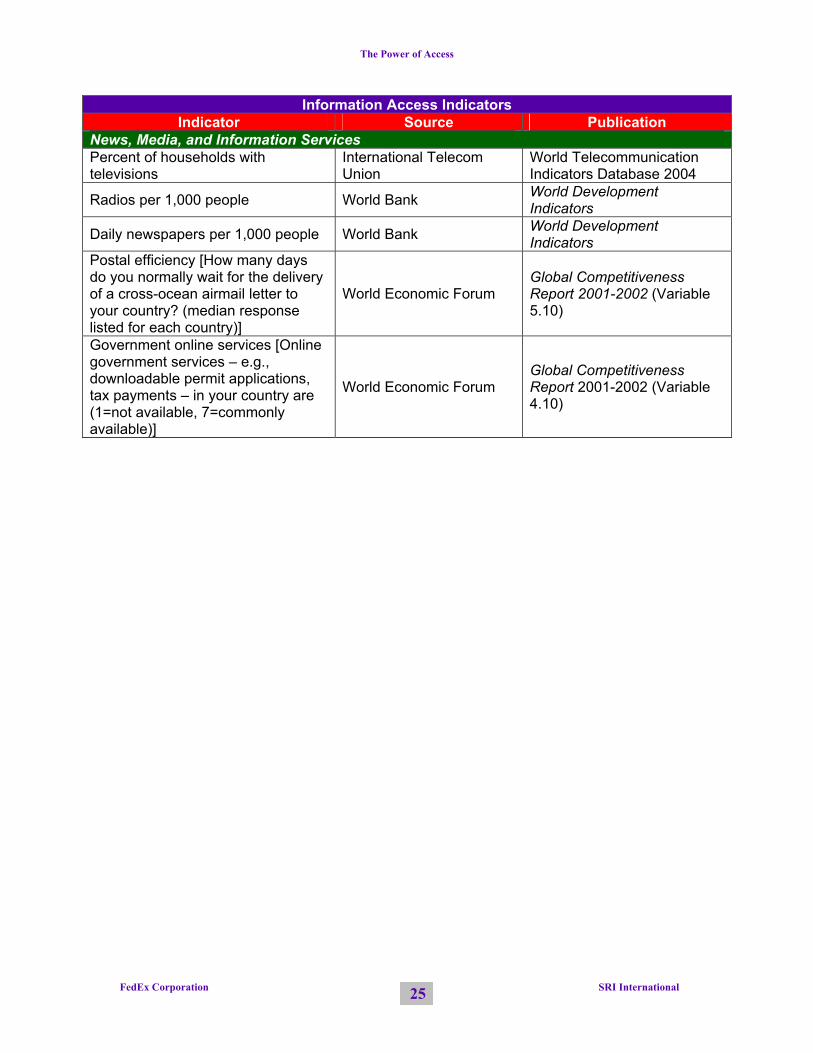
Information Access Indicators
Indicator Source Publication Telecommunications Main telephone lines per 100 inhabitants (used as proxy for % of households with telephones, due to lack of data)
International Telecom Union
World Telecommunication Indicators Database 2004
Number of cellular mobile telephone subscribers per 100 inhabitants
International Telecom Union
World Telecommunication Indicators Database 2004
Telephone Costs: Residential telephone connection and monthly subscription charge
International Telecom Union
World Telecommunication Indicators Database 2004
Business telephone connection and monthly subscription charge
International Telecom Union
World Telecommunication Indicators Database 2004
Cost of 3-minute local call (peak rate)
International Telecom Union
World Telecommunication Indicators Database 2004
Cellular Phone Costs:
Cellular connection charge International Telecom Union
World Telecommunication Indicators Database 2004
Cellular monthly subscription International Telecom Union
World Telecommunication Indicators Database 2004
Cost of 3-minute cellular local call (peak rate)
International Telecom Union
World Telecommunication Indicators Database 2004
Cost of 3-minute cellular local call (off-peak rate)
International Telecom Union
World Telecommunication Indicators Database 2004
Telephone/fax infrastructure quality [New telephone lines for your business are (1=scarce and difficult to obtain; 7=widely available and highly reliable)]
World Economic Forum Global Competitiveness Report 2004-2005 (Variable 5.07)
Number of Secure Servers Netcraft SSL Server Survey, January 2004
Personal computers per 100 inhabitants
International Telecom Union
World Telecommunication Indicators Database 2004
Internet users per 100 inhabitants International Telecom Union
World Telecommunication Indicators Database 2004
Speed and cost of Internet access [Lease-line or dial-up access to the Internet in your country is (1=slow and expensive; 7=as fast and cheap as anywhere in the world)]
World Economic Forum Global Competitiveness Report 2001-2002 (Variable 4.01)
The Power of Access
FedEx Corporation SRI International 25
Information Access Indicators Indicator Source Publication
News, Media, and Information Services Percent of households with televisions
International Telecom Union
World Telecommunication Indicators Database 2004
Radios per 1,000 people World Bank World Development Indicators
Daily newspapers per 1,000 people World Bank World Development Indicators
Postal efficiency [How many days do you normally wait for the delivery of a cross-ocean airmail letter to your country? (median response listed for each country)]
World Economic Forum Global Competitiveness Report 2001-2002 (Variable 5.10)
Government online services [Online government services – e.g., downloadable permit applications, tax payments – in your country are (1=not available, 7=commonly available)]
World Economic Forum Global Competitiveness Report 2001-2002 (Variable 4.10)

How Greater Access Is Changing the World:
Opportunities for People


The Power of Access OPPORTUNITIES FOR PEOPLE
Executive Overview
FedEx Corporation SRI International
i
Introduction
The current living population enjoys – and has been transformed by – a level of access that previous generations never would have imagined. This report is the second of a series that explores the nature, opportunities, and benefits generated by access, based on research and analysis conducted by SRI International and commissioned by FedEx Corporation. This report concentrates on people as one of the three key groups of beneficiaries of access and details the tangible opportunities that access provides vis-à-vis people’s everyday decisions and choices, actions, behavior, and overall way of life. The Model for Opportunities for People The opportunities generated by access for people come from their increased ability to participate in forums as varied as job markets, civil society/public life, and social groups; to choose amongst a wider array of goods and services as well as “life choices,” such as where to live or work; and to improve their educational, financial, health, or employment situations. In order to analyze and measure the varied access-related opportunities available to people, the research team segmented those opportunities into four components, summarized below.
Components of Opportunities for
People Relationship to Access
Choice and Expectations
Access increases consumer choice and power, and consequently raises consumer expectations.
Empowerment Access expands opportunities to learn, to work, and to obtain useful information that empowers individuals.
Connection Access helps fulfill the basic human need to connect with other people.
Well-Being Access enables higher economic growth and improves people’s well-being and quality of life.
Measuring Opportunities for People – the Access Opportunities Index™– People In order to capture and measure the aggregate opportunities that access provides for people around the world, SRI International constructed an Access Opportunities Index™ – People for 75 major markets using 20 variables that cover Choice and Expectations, Empowerment, Connection, and Well-Being. The Access Opportunities Index™ – People can illustrate the relationship between the degree of access available at the national level, and the benefits that individuals enjoy as a result of access.

The Power of Access OPPORTUNITIES FOR PEOPLE
Executive Overview
FedEx Corporation SRI International
ii
Key Findings from the Access Opportunities Index™ – People 1. Access is closely correlated with positive benefits for people.
2. Opportunities for people can be magnified or reduced due to country-specific conditions.
3. Uneven national performance on choice and expectations, empowerment, connection, and well-being can highlight areas where access needs to be improved.
4. Access can be a key tool for countries that seek to increase their citizens’ welfare.

The Power of Access OPPORTUNITIES FOR PEOPLE
FedEx Corporation SRI International iii
CONTENTS
Introduction The Model for Opportunities for People
Choice and Expectations Empowerment Connection Well-Being
Measuring Opportunities for People
The Access Opportunities Index™ – People Key Findings
Appendix: Methodology and Rankings for the Access Opportunities Index™ – People
1
2 3 6 8
10
13 13 16
21
The Power of Access OPPORTUNITIES FOR PEOPLE
FedEx Corporation SRI International 1
Consumer Spending in China 2003
Housing10%
Health Goods & Medical Services
5%
Food, Beverages & Tobacco
31% (1)
Access Goods & Services
19% (2)
Education7%
Clothing & Footwear
8%
Miscellaneous Goods & Services
6%
Household Goods & Services and
Misc.6%
Leisure, Recreation, Hotel
& Catering8%
Source: World Consumer Spending 2004/2005, 5th edition, Euromonitor, SRI calculations
Consumer Spending in the United States 2003
Misc. Goods & Services
14%
Food, Beverages & Tobacco
9%
Education3%
Leisure, Recreation, Hotel
& Catering13%
Household Goods & Services
5%
Access Goods & Services
15% (3)
Health Goods & Medical Services
19% (1) Housing18% (2)
Clothing & Footwear
4%
Source: World Consumer Spending 2004/2005, 5th edition, Euromonitor, SRI calculations
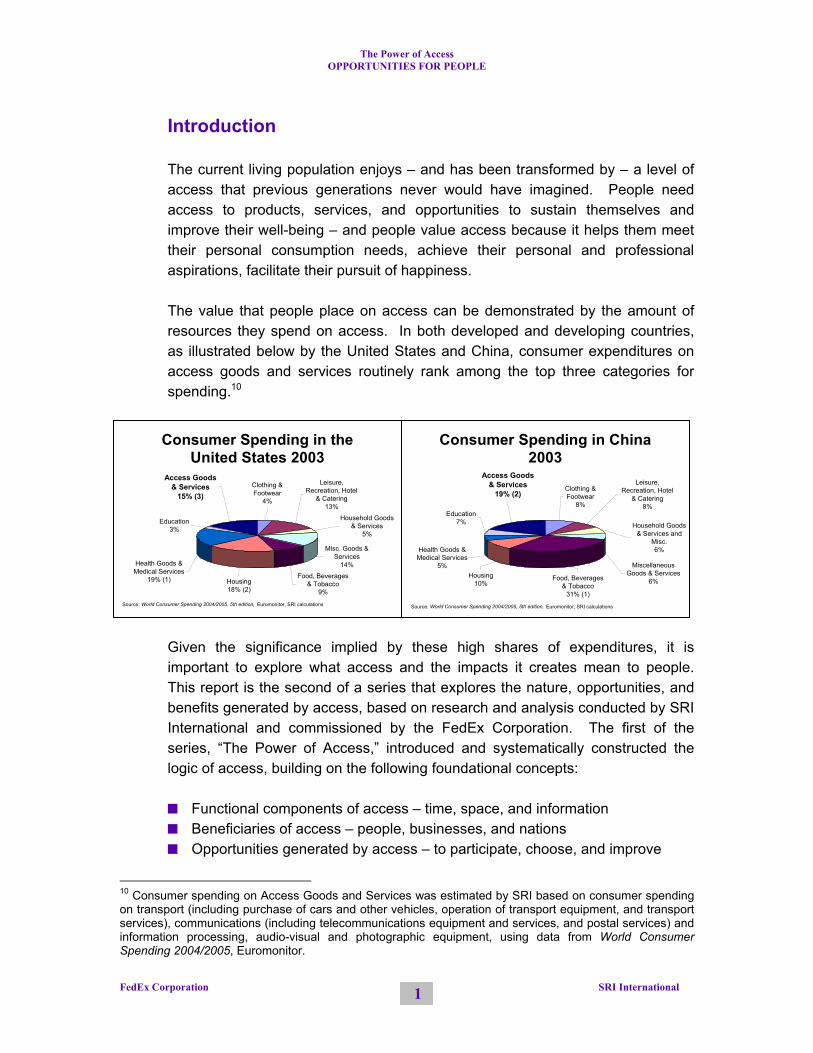
Introduction The current living population enjoys – and has been transformed by – a level of access that previous generations never would have imagined. People need access to products, services, and opportunities to sustain themselves and improve their well-being – and people value access because it helps them meet their personal consumption needs, achieve their personal and professional aspirations, facilitate their pursuit of happiness. The value that people place on access can be demonstrated by the amount of resources they spend on access. In both developed and developing countries, as illustrated below by the United States and China, consumer expenditures on access goods and services routinely rank among the top three categories for spending.10
Given the significance implied by these high shares of expenditures, it is important to explore what access and the impacts it creates mean to people. This report is the second of a series that explores the nature, opportunities, and benefits generated by access, based on research and analysis conducted by SRI International and commissioned by the FedEx Corporation. The first of the series, “The Power of Access,” introduced and systematically constructed the logic of access, building on the following foundational concepts:
Functional components of access – time, space, and information Beneficiaries of access – people, businesses, and nations Opportunities generated by access – to participate, choose, and improve
10 Consumer spending on Access Goods and Services was estimated by SRI based on consumer spending on transport (including purchase of cars and other vehicles, operation of transport equipment, and transport services), communications (including telecommunications equipment and services, and postal services) and information processing, audio-visual and photographic equipment, using data from World Consumer Spending 2004/2005, Euromonitor.

The Power of Access OPPORTUNITIES FOR PEOPLE
FedEx Corporation SRI International 2
This report concentrates on people11 as one of the three key groups of beneficiaries of access and details the tangible opportunities that access provides vis-à-vis people’s everyday decisions and choices, actions, behavior, and overall way of life. The Model for Opportunities for People
Access increases people’s choices and expectations, empowers
them, connects them, and enhances their well-being.
The opportunities that access provides for people come from their increased ability to participate, choose, and improve. In order to analyze and measure the varied potential impacts of access on people, the research team segmented those opportunities into four components: Choice and Expectations; Empowerment; Connection; and Well-Being.
Components of Opportunities for People Description of Components
Choice and Expectations
This component focuses on people as consumers, including their increased choices and access to information. How do consumers benefit from increased access to goods and services (from regional, domestic, and international sources)? How does access to information relate to the physical access to products and services? Do more choices and better products increase consumer expectations, and thus begin a cycle of increasing product choices and improvements?
11 “People” and “consumers” are used interchangeably in the report to refer to individuals as well as self-selected communities of individuals who share particular interests (e.g., neighborhood associations, church groups, social clubs, etc.).

The Power of Access OPPORTUNITIES FOR PEOPLE
FedEx Corporation SRI International 3
Components of Opportunities for People Description of Components
Empowerment
People are constantly striving to improve their situation, and their endeavors take many forms – education, employment, personal financial security, knowledge and information, voice in society, etc. Increased access expands the tools and resources available to individuals, strengthens their ability to participate, and empowers them to improve their personal and professional circumstances.
Connection
This component focuses on people relating to other people. It is a basic human need to connect with other people: families, friends, people who share common interests and goals, and even strangers in faraway lands. Connection comes in many different forms: face-to-face meetings, written correspondence, telephone conversations, or communication by digital means. Access increases personal connection by making communication and travel easier and more affordable.
Well-Being
This component consists of an objective examination of people’s overall state of well-being. By increasing choice and expectations, empowerment, and connection, people’s general well-being and overall quality of life are expected to experience parallel improvements.
Choice and Expectations
Access increases consumer choice and power, and consequently raises consumer expectations.
Access increases choices for consumers. Access benefits people as
consumers by providing them with a wider set of choices, and allowing them to enjoy goods that they otherwise would not have been able to obtain. Recent research indicates that the number of “varieties” available to American consumers increased fourfold between 1972 and 2001 (see

The Power of Access OPPORTUNITIES FOR PEOPLE
FedEx Corporation SRI International 4
Variety in U.S. Imports (1972-2001)Total number of varieties (country-good pairs)
74,667
259,215
173,937 182,375
-
50,000
100,000
150,000
200,000
250,000
300,000
1970 1977 1984 1991 1998
Num
ber o
f Var
ietie
s
Source: Broda & Weinstein (2004)
following chart).12 In 2002, $8.4 trillion worth of goods were shipped in the United States, with an average of 546 miles per shipment, an increase of 26 percent over shipping distances in 1993.13 This shows the increasing interconnectedness of domestic U.S. trade, where a large portion of goods that Americans use were produced or serviced from locations throughout the country.
Access lowers prices. Access helps lower prices by increasing competition
and raising production efficiency. For example, the globalization of information technology (IT) hardware production systems is estimated to have reduced costs of IT products by 10-30 percent worldwide during the 1990s.14 More importantly, access has enabled more businesses to reach consumers directly, and for consumers to reach producers directly, thus bypassing intermediaries that can add to costs. Access to Colombian flowers means that roses are now shipped directly year-round from the Andes to nearby florists and grocery stores, with one consequence being a dramatic fall in the price of roses in the United States.
Access shifts power from producers to consumers. In addition to its
immediate effect on people, choice also heightens competition within market segments as well as spreads competition to other markets and even other roles in life. With choice and information, consumers are more savvy and discerning, which translates into greater market power. In order to remain profitable or even viable, producers must pay close attention to the needs and desires of their customers.
Access increases consumer expectations for products, services, and
delivery. As consumers’ choices and levels of convenience and satisfaction
12 Analysts defined a “variety” as a specific product that is produced in a particular country. In other words, Italian, French, and Australian wines are all varieties of wine. Broda, Cristian, and David Weinstein (2004). “Globalization and the Gains from Variety.” NBER Working Paper 10314. Cambridge, MA: National Bureau of Economic Research. 13 U.S. Census Bureau (2004). 2002 Economic Census: 2002 Commodity Flow Survey. Washington, DC: U.S. Census Bureau. 14 Mann, Catherine (2003). “Globalization of IT Services and White Collar Jobs: The Next Wave of Productivity Growth,” International Economics Policy Briefs No. PB03-11. Washington, DC: Institute for International Economics.

The Power of Access OPPORTUNITIES FOR PEOPLE
FedEx Corporation SRI International 5
expand, their expectations of having their needs and wishes fulfilled also rise. The expectations “bar” is continuously being raised. Consumers want product and service information now, and once they make their choice, they want many of their purchases delivered tomorrow. Indeed, the delivery of products and information to people is the ultimate act in the provision of access. Unless delivery is achieved, access is denied. Consumer expectations for more delivery options, as well as the reduction in time needed for delivery, have risen in tandem with the demand for products themselves. The following table indicates how people are affected by different forms of delivery.
Examples of Positive Impacts of Delivery on People
For senders, personal satisfaction from connecting with family
members and friends.
For recipients, contentment from receiving correspondence or gifts.
The “peace of mind” associated with completing an important personal business transaction (employment or college entrance applications, legal documents, financial transactions, etc.).
The fulfillment of being able to quickly obtain an out-of-stock item
from a store, due to the store’s efficient re-ordering system.
The ease of shopping online, with products delivered to one’s home within a few days.
The pleasure from being able to obtain highly perishable goods
(steaks, barbecued ribs, fruits, flowers) from specialized sources located at distant production sites.
The physical well-being and happiness associated with receiving
medicines and medical devices.

The Power of Access OPPORTUNITIES FOR PEOPLE
FedEx Corporation SRI International 6
Empowerment
Access expands opportunities to learn, to work, and to obtain useful information that empowers individuals.
Access empowers individuals by providing them with the tools to
improve their conditions. People throughout the ages have constantly strived to improve their situation and that of their families, and their efforts to do so manifest themselves in many ways – attaining education and employment, improving personal finances, obtaining knowledge and information, achieving a voice in society, etc. Access provides people with expanded opportunities to learn, to work, and to obtain financial and informational resources. When combined, these opportunities provide people with greater power over their own personal and professional lives, thus dramatically increasing the range of “life choices” available.
Access expands employment opportunities. Access to job postings on
the Internet has dramatically expanded the range of employment options for jobseekers, while reducing the cost of job hunting. The number of Americans who search for jobs online has been growing rapidly. In 2002, 52 million Americans looked at job listings online, a 63 percent increase since 2000. In addition, the proliferation of videoconferencing facilities (such as those available at FedEx Kinko’s) across the country has revolutionized the job interview experience, as more companies are using this technology to reach candidates at greater distances without incurring travel costs.
Access increases job arrangement options to meet people’s needs and
preferences. Societal changes in the past two decades have placed increased pressures on people trying to balance their work, family, and personal lives. Expanded and affordable telecommunications have allowed more and more Americans to take advantage of flexible arrangements, as exemplified by a tripling in the number of teleworkers15 from 1993 to 2003.
15 Here, “teleworkers” are defined as workers, employed by a firm, who use telecommunications to change the location of where they work at least part of the time (e.g., in their cars, at home, at a telework/commuter center, etc.).

The Power of Access OPPORTUNITIES FOR PEOPLE
FedEx Corporation SRI International 7
Estimated Number of U.S. Teleworkers
5.57.6
11.6
14.416.8
3.0
8.5
23.5
0
5
10
15
20
25
1989 1991 1993 1995 1997 1999 2001 2003
Milli
ons
Source: 1989-1995 data from LINK Resources, 1997-2003 data from American Interactive Consumer Survey
People Participating in Adult Education
42%
46%
33%
25%
30%
35%
40%
45%
50%
1991 1995 1999
Perc
enta
ge o
f Adu
lts
Source: U.S. Department of Education. National Center for Education Statistics (2002). Participation Trends and Patterns in Adult Education: 1991 to 1999 (NCES 2002-119), by Creighton, S. and L. Hudson. Washington, DC: U.S. Government Printing Office, p.13.
Access widens education options and enables individuals to pursue
lifelong learning. Studying for a degree while working becomes possible with satellite university campuses near homes or offices, and with distance learning courses that are available for log-on at any time during the day. Combined with other socio-economic changes (e.g., the demands of a knowledge-based economy), access has produced the most highly educated U.S. population ever seen. Access technologies continue to expand the range of platforms for delivering education. “Distance learning” – educational courses in which teachers and students are in different locations – is an increasingly popular avenue for both adults and children who wish to access a wider range of courses beyond traditional classroom instruction. Moreover, as access to education expands, more adults are pursuing lifelong learning, despite the demands of work and family, even while working full-time.
Access to financial markets means cutting out the “middleman” and
earning higher investment returns. Savers, investors and borrowers can now go directly to the financial markets through the Internet to conduct transactions, bypassing intermediaries and reducing transaction costs. This has increased both investment opportunities and investment returns, especially for small investors. Consumers now invest directly in the stock market with minimal transaction costs, whereas just two decades ago, individual investors regularly paid commissions and fees of $100-$400 (in 1980 dollars) to full-service brokerages for each stock trade.
Access to expanded credit choices and opportunities helps fulfill
individual dreams and potential. A greater variety of financial instruments is also expanding people’s access to financial resources. People now can choose among many competing sources of credit, enjoy a wider array of terms and rates, and have more tailored financial services to meet their needs and preferences. Options for purchasing everything from homes to automobiles, and from consumer goods to education, all expanded

The Power of Access OPPORTUNITIES FOR PEOPLE
FedEx Corporation SRI International
8
dramatically over the past several decades. As a result, more people are able to leverage their resources and assets to fulfill dreams such as completing an education or purchasing a home. Indeed, increased access to financing has contributed to a steady rise in U.S. home ownership rates since 1985.
64.0%64.5%
65.5%
63.5%
64.1%
65.1%
67.5%
69.2%
60%
61%
62%
63%
64%
65%
66%
67%
68%
69%
70%
1970 1975 1980 1985 1990 1995 2000 2004
U.S. Home Ownership Rates 1970-2004
Source: U.S. Census Bureau
Connection
Access helps fulfill the basic human need to connect with other people.
Access to telecommunications helps strengthen and deepen personal
connection. Deeply embedded in human nature is the need for people to interact with their family members, friends, colleagues and acquaintances. In the past, these interactions were limited severely by distance and the cost of telecommunications. The connectivity provided by new technologies, such as computers, the Internet, and mobile telephones has allowed families and friends to maintain and deepen their personal ties despite long distances, even across different countries.

The Power of Access OPPORTUNITIES FOR PEOPLE
FedEx Corporation SRI International 9
Percentage of Online Community Participants who Belong to this Group
0 10 20 30 40 50 60
Labor unions
Ethnic or cultural groups
Religious organizations/groups
Political groups
People who share the same belief
Same lifestyle
Support group for medical problems
Fan group of TV show or entertainer
Local community group
Fan group for a sports team
Trade association or professional group
Group for people who share a hobby
Source: Pew Internet Project/ Trends 2005.
Access broadens community participation. Increased access to telecommunications allows individuals to form “virtual” communities around particular interests irrespective of the geographical distance that separates them. It is estimated that close to 100 million people in the United States alone belonged to groups that had an online presence by the end of 2004.16 Members of these groups reported that the chances that they would interact with people outside their social class, racial group, or generational cohort had increased in recent years due to expansion of access through the Internet.
Access to travel enables people to connect with people in other countries. With greater financial capacity to travel, expanded information resources about potential travel destinations, and a plethora of Internet-based travel businesses to facilitate travel-related transactions, people are traveling longer distances to further away lands more than ever. Between 1990 and 2000, travel by Americans to more distant foreign countries such as China, Brazil and Israel more than doubled in volume. During the same period, the number of American students participating in study abroad increased by 145 percent.
Access-creating goods and services are no longer luxury items, but
instead are becoming necessities, as people’s need for connection rises. In countries across a spectrum of economic development and per capita income levels, consumer spending on goods and services that
16 Internet: The Mainstreaming of Online. Trends 2005 by The Pew Internet and American Life Project. Downloaded from http://www.pewinternet.org/pdfs/Internet_Status_2005.pdf on 04/05/2005.

The Power of Access OPPORTUNITIES FOR PEOPLE
FedEx Corporation SRI International 10
generate access consistently totaled between 14 and 20 percent of overall consumer expenditures in 2003 (following chart, left).17 The need and demand for access is particularly acute in countries that are undergoing rapid economic transformation, such as China and India. While the “access” budget stayed somewhat constant for advanced countries such as the United States, the United Kingdom, and Japan between 1990 and 2003, access spending as part of the aggregate consumer budget has risen dramatically in China and India. Particularly notable in the case of China is a sharp rise in spending on telecommunications equipment and services (following chart, right). The fact that access goods and services have become an integral part of consumer expenditures worldwide strongly indicates that desire, need, and expectation to stay connected have become a universal phenomenon.
Access Good and Services as a Share of Consumer Spending 1990-2003
14.1% 14.5%15.2%
19.7%
8.5%6.5%
18.5%
14.8%15.0%
19.7%
0%
5%
10%
15%
20%
25%
China India Japan UK USA
1990
2003
Source: World Consumer Spending 2004/2005, 5th edition, Euromonitor, SRI calculations
China's Spending on Selected Access Goods and Services, 1990-2003
0%1%2%3%4%5%6%7%8%9%
1990 1995 1998 2000 2003
% o
fTot
al C
onsu
mer
Spe
ndin
gTransportservices
Postalservices
Telecomequipment
Telecomservices
Source: World Consumer Spending 2004/2005, 5th edition, Euromonitor, SRI calculations
Well-Being
Access enables higher economic growth and improves people’s well-being and quality of life.
Expanded access and improvements in quality of life around the world
have proceeded in tandem. A natural correlation of the benefits of access – expanded choices, higher expectations, greater empowerment, and increased connection – is that people can achieve higher levels of well-being. General improvements in quality of life for a majority of people in the world have occurred simultaneously with the age of rapidly expanding access. A study by the Economist Intelligence Unit (EIU) finds that more than 50
17 To ascertain how the value that people place on access has evolved, SRI developed a “basket” of access goods and services and examined how consumer spending on those goods and services has changed over time across different countries. The basket includes: personal transport vehicles; transport services such as rail, buses, taxis, air travel and other travel; postal services; telecommunications equipment; telecommunications services; and audio-visual, photographic, and information processing equipment (including television, radio, personal computer, computer software packages, among many other items).
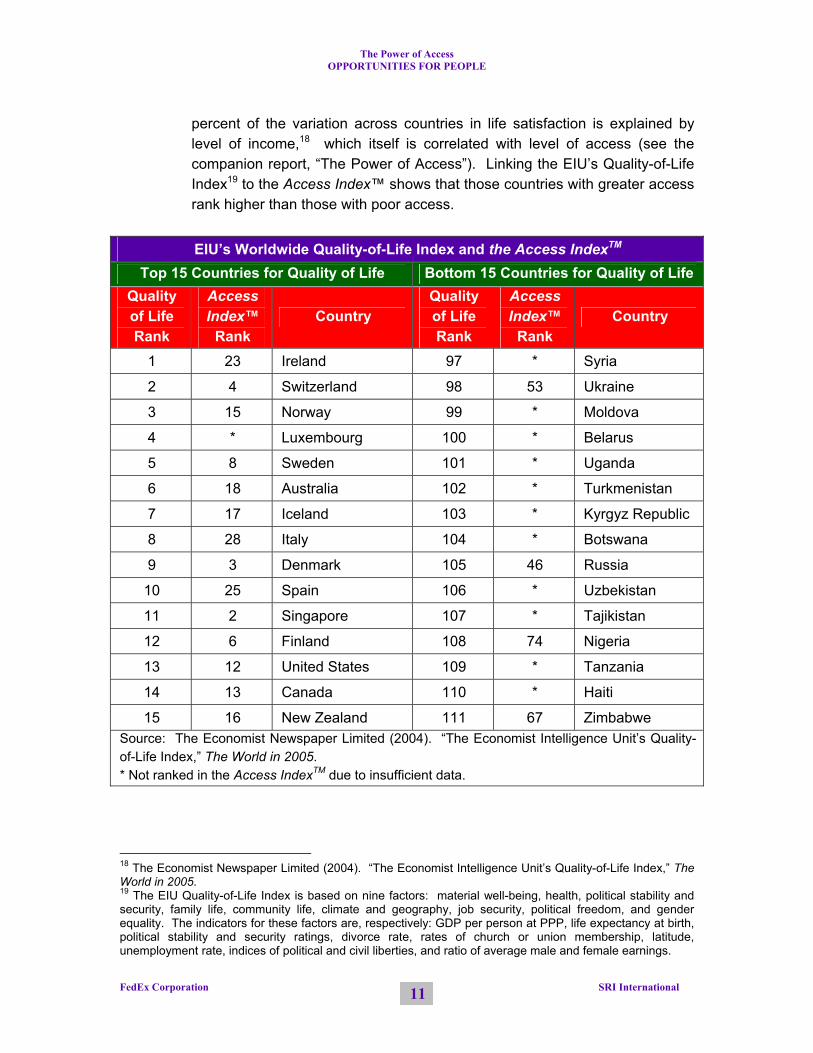
The Power of Access OPPORTUNITIES FOR PEOPLE
FedEx Corporation SRI International 11
percent of the variation across countries in life satisfaction is explained by level of income,18 which itself is correlated with level of access (see the companion report, “The Power of Access”). Linking the EIU’s Quality-of-Life Index19 to the Access Index™ shows that those countries with greater access rank higher than those with poor access.
EIU’s Worldwide Quality-of-Life Index and the Access IndexTM Top 15 Countries for Quality of Life Bottom 15 Countries for Quality of Life
Quality of Life Rank
Access Index™
Rank Country
Quality of Life Rank
Access Index™
Rank Country
1 23 Ireland 97 * Syria
2 4 Switzerland 98 53 Ukraine
3 15 Norway 99 * Moldova
4 * Luxembourg 100 * Belarus
5 8 Sweden 101 * Uganda
6 18 Australia 102 * Turkmenistan
7 17 Iceland 103 * Kyrgyz Republic
8 28 Italy 104 * Botswana
9 3 Denmark 105 46 Russia
10 25 Spain 106 * Uzbekistan
11 2 Singapore 107 * Tajikistan
12 6 Finland 108 74 Nigeria
13 12 United States 109 * Tanzania
14 13 Canada 110 * Haiti
15 16 New Zealand 111 67 Zimbabwe Source: The Economist Newspaper Limited (2004). “The Economist Intelligence Unit’s Quality-of-Life Index,” The World in 2005. * Not ranked in the Access IndexTM due to insufficient data.
18 The Economist Newspaper Limited (2004). “The Economist Intelligence Unit’s Quality-of-Life Index,” The World in 2005. 19 The EIU Quality-of-Life Index is based on nine factors: material well-being, health, political stability and security, family life, community life, climate and geography, job security, political freedom, and gender equality. The indicators for these factors are, respectively: GDP per person at PPP, life expectancy at birth, political stability and security ratings, divorce rate, rates of church or union membership, latitude, unemployment rate, indices of political and civil liberties, and ratio of average male and female earnings.

The Power of Access OPPORTUNITIES FOR PEOPLE
FedEx Corporation SRI International 12
Access to health services and products enhances physical well-being.
The ability of individuals and families to access health services, medical supplies, and other essentials (e.g., potable water, sanitation, etc.) is directly related to their physical welfare. In fact, many health and social indicators are defined in terms of access, such as percentage of the population that has “access to physicians” or “access to clean water.” There is universal consensus on the fact that these forms of access are strongly related to health outcomes such as life expectancy and infant mortality. As a result, many development programs are directed toward increasing levels of access to health services. To be sure, degrees of access to such services vary substantially within and among countries. For “access to physicians,” for example (which can be estimated by comparing the number of doctors in a country to its population), the United States has 276 physicians per 100,000 people, while China, Brazil, and India have 167, 158, and 48 doctors, respectively, per 100,000 people.20 Thus, the average American has greater access to physicians than his or her Chinese or Brazilian counterpart, who in turn has greater access to doctors than the typical Indian citizen.
Access to new technologies changes the way people work and live.
Gains in productivity due to the adoption and speed of new technologies reduce the time and resources required to produce more. Likewise, new technologies result in affordable products and services to assist in completing routine household tasks. In the last century, access to technological advances, along with other socio-economic forces, have produced significant changes in the time people spend at work and on routine responsibilities, resulting in increased personal “free time” that people can use for other activities. Having time for leisure or to pursue activities that are fulfilling or important on a personal level (family, social life, the arts, hobbies, spirituality, community work, etc.) is an important aspect of well-being. The following chart (left) shows estimates of hours worked per week from the late 19th century through the late 20th century, while the chart on the right illustrates decreases in time spent by American women on one daily task, namely food preparation and cleanup. The dramatic reduction in time devoted to job-related work and at-home chores – spurred by access to new and improved technologies – has freed personal time for other pursuits.
20 United Nations Development Program (2003). Human Development Report 2003, pp. 254-256.

The Power of Access OPPORTUNITIES FOR PEOPLE
FedEx Corporation SRI International 13
Length of the Work Week, 1890s to 1991
35
40
48
60
30
35
40
45
50
55
60
65
1890s 1920 1940 1991
Wor
k H
ours
Per
Wee
k
(approximately)
Source: Costa, Dora L., 1998, "The Wage and Length of the Work Day: From the 1890s to 1991," NBER Working Paper 6504, National Bureau of Economic Research, Inc.
Time Spent by Women on Food Preparation and Cleanup
44
30
20
105.5
05
101520253035404550
1900 1920s 1950s 1975 2003
Hou
rs P
er W
eek
Sources: Bowers, Douglas, "Cooking Trends Echo Changing Roles of Women," Food Review , Vol. 23, Issue 1, January-April 2000, pp. 23-29, published by Economic Research Service, U.S. Department of Agriculture, and Bureau of Labor Statistics, 2003 Time Use Survey, Table 1.
Measuring Opportunities for People
The Access Opportunities Index™ – People
In order to capture and measure the aggregate benefits of access for people across the world, SRI International constructed an Access Opportunities Index™ – People for 75 major markets using 20 variables that cover the four components of anticipated impacts on people.
Choice and Expectations indicators measure the extent to which people as consumers have increased product choices due to access, as represented by the openness of the economy to imports and the intensity of market competition (growth of imported products, entry of new competitors to local market, intensity of local competition, and degree of customer orientation exhibited by firms).
Empowerment indicators are proxy measurements of whether people have
the tools and opportunities to improve their conditions as a result of better access, and therefore focus on education, employment, and information (enrollment in secondary and tertiary education, adult literacy rate, quality of public schools, press freedom, unemployment rate, and brain drain).
Connection indicators attempt to capture how connections between people
have intensified through expanded mechanisms for contacting and communicating with other people across distances, as well as by meeting face-to-face (number of Internet users, international telephone traffic, cellular phone subscribers, air passenger traffic, and international tourism departures).

The Power of Access OPPORTUNITIES FOR PEOPLE
FedEx Corporation SRI International 14
Well-Being indicators are outcome measurements that indicate the overall level of well-being (life expectancy, adult and child mortality rates, and income per capita).
All indicators were selected because they measure or provide a proxy measurement of certain aspects of the opportunities that access provides people. As in the Access Index™, all of the data were selected from high-quality and reliable sources that use a uniform methodology for all countries covered. The methodology for compiling the Access Opportunities Index™ – People (including a list of the 20 indicators and their sources) and country scores at the component level are presented in the Appendix to this report. The following table displays the Access Opportunities Index™ – People rankings of 75 countries and their corresponding Access Index™ rankings.

The Power of Access OPPORTUNITIES FOR PEOPLE
FedEx Corporation SRI International 15
Rankings of Opportunities for People and Overall Access
Country
Access Opportunities
Index™ – People Rank
Access Index™
Rank Country
Access Opportunities
Index™ – People Rank
Access Index™
Rank
Iceland 1 17 Trinidad and Tobago 38 55
Netherlands 2 5 Jamaica 39 49 Sweden 3 8 Bulgaria 40 51 Finland 4 6 Mexico 41 45 United Kingdom 5 9 Turkey 42 39 Switzerland 6 4 Thailand 43 37 Denmark 7 3 Jordan 44 44 Ireland 8 23 China 45 52 United States 9 12 Romania 46 54 Belgium 10 11 Mauritius 47 41 Austria 11 14 Uruguay 48 42 Hong Kong 12 1 Panama 49 50 Norway 13 15 El Salvador 50 48 New Zealand 14 16 Argentina 51 43 Canada 15 13 Brazil 52 47 Australia 16 18 Russia 53 46 Germany 17 7 Ukraine 54 53 France 18 10 South Africa 55 38
Singapore 19 2 Dominican Republic 56 63
Israel 20 20 Philippines 57 65 Japan 21 19 Colombia 58 61 Czech Republic 22 30 Sri Lanka 59 56 Spain 23 25 Egypt 60 58 Slovenia 24 31 Venezuela 61 62 Estonia 25 26 Peru 62 64 Italy 26 28 Ecuador 63 71 Greece 27 27 India 64 59 South Korea 28 22 Vietnam 65 73 Portugal 29 24 Guatemala 66 70 Chile 30 32 Honduras 67 69 Hungary 31 36 Paraguay 68 68 Lithuania 32 35 Indonesia 69 60 Malaysia 33 33 Bolivia 70 66 Latvia 34 34 Nicaragua 71 72 Slovak Republic 35 29 Bangladesh 72 75 Poland 36 40 Nigeria 73 74 Costa Rica 37 57 Zimbabwe 74 67

The Power of Access OPPORTUNITIES FOR PEOPLE
FedEx Corporation SRI International 16
Key Findings
The Access Opportunities Index™ – People can illustrate the relationship between the degree of access available at the national level (as measured by the Access Index™)21 and the benefits that individuals enjoy as a result of access. By measuring specific “outputs” of improved access, the Access Opportunities Index™ – People demonstrates quantitatively the value that people derive from access.
1. Access is closely correlated with positive benefits for people. 2. Opportunities for people can be magnified or reduced due to
country-specific conditions.
3. Uneven national performance on choice and expectations, empowerment, connection, and well-being can highlight areas where access needs to be improved.
4. Access can be a key tool for countries that seek to increase their
citizens’ welfare.
1. Access is closely correlated with positive benefits for people. As
indicated in the table above, all but one of the top 20 countries in the Access Index™ are also the top 20 countries in terms of the Access Opportunities Index™ – People. The close correlation between access scores and scores for benefits to people also is illustrated in the following chart. That scores for the Access Opportunities Index™ – People strongly correlate with Access Index™ scores suggests that access generates significant opportunities for people.
21 The Access Index™ developed for FedEx by SRI International, provides insights into the power and importance of access generation at the national level. This index incorporates 22 different variables covering physical access (with trade and transport subcategories) and information access (including subcategories for telecommunications and news/media/information services). Details about the Access Index™ can be found in the companion report “The Power of Access.”

The Power of Access OPPORTUNITIES FOR PEOPLE
FedEx Corporation SRI International 17
Relationship between Access and Opportunities for People
0
10
20
30
40
50
60
70
80
90
100
0 10 20 30 40 50 60 70 80 90 100
Access IndexTM Score
Acc
ess
Opp
ortu
nitie
s In
dexTM
-- P
eopl
e Sc
ore
India
China
Russia
U.S.
U.K.
Brazil
Japan
Ireland
Iceland
Hong Kong
2. Opportunities for people can be magnified or reduced due to country-specific conditions. While the overall correlation between the Access Opportunities Index™ – People and Access Index™ scores is strong, the rankings of countries on the two indexes are not perfectly aligned. For example, Iceland, which ranks No. 1 on the Access Opportunities Index™ – People, only ranks 17th on the Access Index™, while Hong Kong, which ranks No. 1 on the Access Index™, ranks 12th on the Access Opportunities Index™ – People (see following table). These differences can be the result of varying country-specific conditions, particularly their differences in the Multipliers of Access Impacts.22 Multipliers are factors that increase or reduce the benefits of access to beneficiaries, at any given level of access and opportunity. One important multiplier of access impacts is knowledge and education. One can infer that Icelanders, who are among the world’s most well-educated, derive a higher level of positive people-level opportunities from access than the slightly less-educated population of Hong Kong, even though Hong Kong enjoys a higher level of overall access.
22 See main report, The Power of Access, “Multipliers of Access Impacts.”

The Power of Access OPPORTUNITIES FOR PEOPLE
FedEx Corporation SRI International 18
Component Rankings of the Access Opportunities Index™ – People:
Selected Countries
Country
Access Opportunities
Index™ – People
Empower- ment Connection Well-
Being
Choice and
Expectations
Access Index™
Iceland 1 3 1 1 27 17 Netherlands 2 2 8 9 5 5 Sweden 3 7 2 2 28 8 Finland 4 4 7 20 7 6 U.K. 5 10 10 24 2 9 Switzerland 6 6 6 6 30 4 Denmark 7 5 9 12 22 3 Ireland 8 8 5 14 20 23 U.S.A. 9 12 20 23 1 12 Hong Kong 12 28 4 3 9 1 Singapore 19 31 3 11 31 2 Japan 21 17 33 5 32 19 China 45 49 67 48 8 52 Brazil 52 47 59 57 39 47 Russia 53 37 56 58 62 46 India 64 74 73 70 23 59
3. Uneven national performance on choice and expectations,
empowerment, connection, and well-being can highlight areas where access needs to be improved. Similar to the findings in the Access Index™ that physical and information access are not perfectly aligned, the scores on different components of the Access Opportunities Index™ – People can vary dramatically for the same country. For example, as indicated in the preceding table, a number of European countries that rank within the top 10 on the overall Access Opportunities Index™ – People (e.g., Sweden, Switzerland, and Denmark) are strong on Empowerment and Well-Being, but weak on Choice and Expectations, ranking 28, 30, and 22, respectively, for this component. Their component scores indicate that their populations enjoy high levels of education (Empowerment), high living standards and strong health outcomes (Well-Being), but as consumers they can benefit from more market competition (Choice and Expectations). A contrasting case study is China, which fell in the bottom third on the Access Index™ and the Access Opportunities Index™ – People, ranking 52nd and 45th, respectively, but scored very high – 8th – in the Choice and Expectations subcomponent. China’s scores suggest that market and trade reforms have increased access

The Power of Access OPPORTUNITIES FOR PEOPLE
FedEx Corporation SRI International 19
dramatically, thus benefiting its people as consumers. However, China still has a long way to go in achieving strong opportunities for people in Empowerment, Well-Being, and Connection, and thus can benefit from more access within those areas.
4. Access can be a key tool for countries that seek to increase their
citizens’ welfare. Comparing performance on the Access Index™ and the four components of the Access Opportunities Index™ – People demonstrates areas for improvement as well as areas of excellence. The following diagrams depict the relationship between current levels of access (illustrated by the circle) and performance on the four components of the Access Opportunities Index™ – People (illustrated by the diamond) for the United States, China, Iceland, and Hong Kong. Perfect congruence between a country’s level of access and opportunities for its people would be shown by a diamond that meets the access circle at each intersection with the axis. Diamonds that fall short of the access circle for one or more components of the Access Opportunities Index™ – People suggest that a country’s people are not realizing the full benefits that could be generated by the country’s level of access. By contrast, diamonds that extend beyond the access circle signify that the opportunities in that country are being magnified beyond what might normally be expected by the country’s level of access.
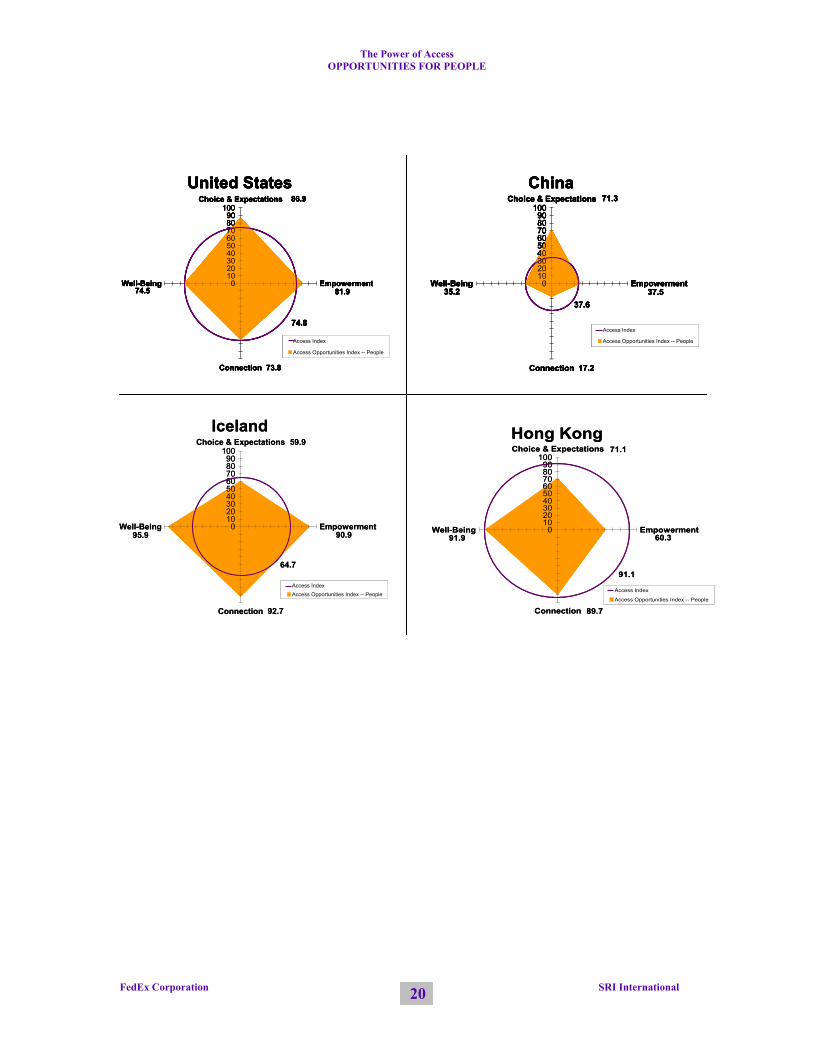
The Power of Access OPPORTUNITIES FOR PEOPLE
FedEx Corporation SRI International 20
United States86.9
81.9
73.8
74.50
102030405060708090
100Choice & Expectations
Empowerment
Connection
Well-Being
Access Index
Access Opportunities Index -- People
74.8
China
35.2
17.2
37.5
71.3
0102030405060708090
100Choice & Expectations
Empowerment
Connection
Well-Being
Access Index
Access Opportunities Index -- People
37.6
Iceland
95.9
92.7
90.9
59.9
0102030405060708090
100Choice & Expectations
Empowerment
Connection
Well-Being
Access IndexAccess Opportunities Index -- People
64.7
Hong Kong
91.9
89.7
60.3
71.1
0102030405060708090
100Choice & Expectations
Empowerment
Connection
Well-Being
Access Index
Access Opportunities Index -- People
91.1
United States86.9
81.9
73.8
74.50
102030405060708090
100Choice & Expectations
Empowerment
Connection
Well-Being
Access Index
Access Opportunities Index -- People
74.8
China
35.2
17.2
37.5
71.3
0102030405060708090
100Choice & Expectations
Empowerment
Connection
Well-Being
Access Index
Access Opportunities Index -- People
37.6
Iceland
95.9
92.7
90.9
59.9
0102030405060708090
100Choice & Expectations
Empowerment
Connection
Well-Being
Access IndexAccess Opportunities Index -- People
64.7
Hong Kong
91.9
89.7
60.3
71.1
0102030405060708090
100Choice & Expectations
Empowerment
Connection
Well-Being
Access Index
Access Opportunities Index -- People
91.1
United States86.9
81.9
73.8
74.50
102030405060708090
100Choice & Expectations
Empowerment
Connection
Well-Being
Access Index
Access Opportunities Index -- People
74.8
China
35.2
17.2
37.5
71.3
0102030405060708090
100Choice & Expectations
Empowerment
Connection
Well-Being
Access Index
Access Opportunities Index -- People
37.6


The Power of Access OPPORTUNITIES FOR PEOPLE
FedEx Corporation SRI International 21
APPENDIX Methodology and Rankings for the Access Opportunities Index™ – People
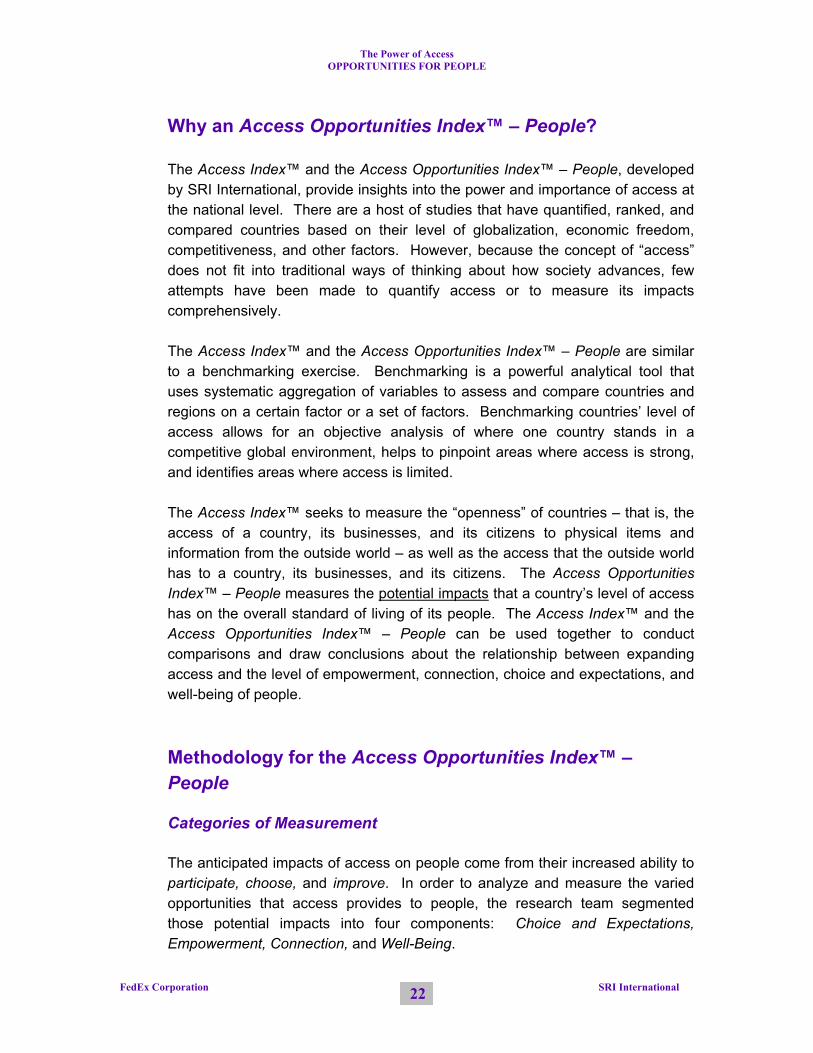
The Power of Access OPPORTUNITIES FOR PEOPLE
FedEx Corporation SRI International 22
Why an Access Opportunities Index™ – People? The Access Index™ and the Access Opportunities Index™ – People, developed by SRI International, provide insights into the power and importance of access at the national level. There are a host of studies that have quantified, ranked, and compared countries based on their level of globalization, economic freedom, competitiveness, and other factors. However, because the concept of “access” does not fit into traditional ways of thinking about how society advances, few attempts have been made to quantify access or to measure its impacts comprehensively. The Access Index™ and the Access Opportunities Index™ – People are similar to a benchmarking exercise. Benchmarking is a powerful analytical tool that uses systematic aggregation of variables to assess and compare countries and regions on a certain factor or a set of factors. Benchmarking countries’ level of access allows for an objective analysis of where one country stands in a competitive global environment, helps to pinpoint areas where access is strong, and identifies areas where access is limited. The Access Index™ seeks to measure the “openness” of countries – that is, the access of a country, its businesses, and its citizens to physical items and information from the outside world – as well as the access that the outside world has to a country, its businesses, and its citizens. The Access Opportunities Index™ – People measures the potential impacts that a country’s level of access has on the overall standard of living of its people. The Access Index™ and the Access Opportunities Index™ – People can be used together to conduct comparisons and draw conclusions about the relationship between expanding access and the level of empowerment, connection, choice and expectations, and well-being of people. Methodology for the Access Opportunities Index™ – People
Categories of Measurement
The anticipated impacts of access on people come from their increased ability to participate, choose, and improve. In order to analyze and measure the varied opportunities that access provides to people, the research team segmented those potential impacts into four components: Choice and Expectations, Empowerment, Connection, and Well-Being.
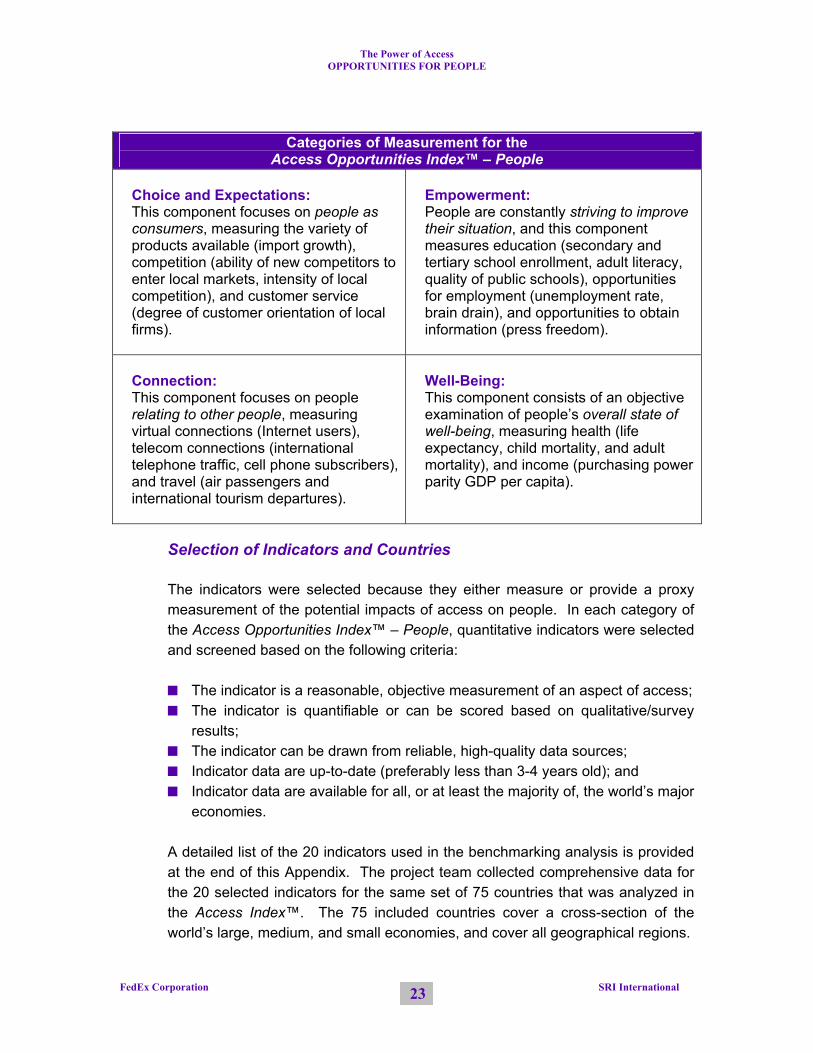
The Power of Access OPPORTUNITIES FOR PEOPLE
FedEx Corporation SRI International 23
Categories of Measurement for the
Access Opportunities Index™ – People Choice and Expectations: This component focuses on people as consumers, measuring the variety of products available (import growth), competition (ability of new competitors to enter local markets, intensity of local competition), and customer service (degree of customer orientation of local firms).
Empowerment: People are constantly striving to improve their situation, and this component measures education (secondary and tertiary school enrollment, adult literacy, quality of public schools), opportunities for employment (unemployment rate, brain drain), and opportunities to obtain information (press freedom).
Connection: This component focuses on people relating to other people, measuring virtual connections (Internet users), telecom connections (international telephone traffic, cell phone subscribers), and travel (air passengers and international tourism departures).
Well-Being: This component consists of an objective examination of people’s overall state of well-being, measuring health (life expectancy, child mortality, and adult mortality), and income (purchasing power parity GDP per capita).
Selection of Indicators and Countries
The indicators were selected because they either measure or provide a proxy measurement of the potential impacts of access on people. In each category of the Access Opportunities Index™ – People, quantitative indicators were selected and screened based on the following criteria:
The indicator is a reasonable, objective measurement of an aspect of access; The indicator is quantifiable or can be scored based on qualitative/survey
results; The indicator can be drawn from reliable, high-quality data sources; Indicator data are up-to-date (preferably less than 3-4 years old); and Indicator data are available for all, or at least the majority of, the world’s major
economies. A detailed list of the 20 indicators used in the benchmarking analysis is provided at the end of this Appendix. The project team collected comprehensive data for the 20 selected indicators for the same set of 75 countries that was analyzed in the Access Index™. The 75 included countries cover a cross-section of the world’s large, medium, and small economies, and cover all geographical regions.

The Power of Access OPPORTUNITIES FOR PEOPLE
FedEx Corporation SRI International 24
Scoring Methodology
Calculation and Normalization of Points for Each Indicator To prevent the large country bias that can easily occur in this type of analysis, many of the indicators were normalized for size (e.g., measuring the number of Internet users per capita). It is also important to note that, although statistical measurement and data collection have improved dramatically and expanded in scope in recent years, the accuracy and comparability of data across countries is far from perfect. Many data sets are based on surveys, for example, which can yield different results in countries facing varying circumstances. To make the scoring process as objective as possible, countries received a score for each of the 20 indicators based on the country’s rank for that indicator. If a country ranked the highest for an indicator, it received 75 points for that indicator. Conversely, a country that ranked the lowest in an indicator received one point. Because some countries were missing data on some indicators, the highest possible number of points varied across indicators (ranging from 56 to 75). Therefore, the points were normalized by dividing each country’s points earned by the highest possible number of points for that indicator and multiplying the result by 100. For example, Australia received 40 points for the indicator “Unemployment Rate,” and the highest possible number of points was 71. Therefore, Australia’s normalized score was 56.3. After normalization, the highest possible score for every indicator was 100.
Calculation of Total Scores The Access Opportunities Index™ – People scores countries on each of the four subcategories: choice and expectations, empowerment, connection, and well-being. A country’s score for each subcategory was calculated by adding together all of the normalized points earned for each of the indicators in that category. The total score was then calculated by dividing the country’s total points earned by the maximum possible points a country could have earned if it scored the highest on every indicator. For example, Australia received 381.1 out of a total possible 500 points (or 76.2 percent of the total) for Connection, giving Australia a score of 76.2 for the Connection category.23 Because the total scores are normalized in this fashion, the maximum possible score for each of the four subcategories is 100 points each.
23 In those few cases where a country was missing data for a particular indicator, the SRI team made the necessary adjustments in the point totals to account for the missing data and to arrive at a score for the country.
The Power of Access OPPORTUNITIES FOR PEOPLE
FedEx Corporation SRI International 25
The scores for the four subcategories were then combined to calculate a single score for each country. This score also was normalized, by dividing a country’s total points by the maximum possible score. For example, Australia received 63.1 points for Choice and Expectations, 78.5 points for Empowerment, 76.2 points for Connection, and 86.4 points for Well-Being: its combined score is 304.2 points out of a total possible 400 points (or 76.1 percent of the total), giving Australia a score of 76.1 in the Access Opportunities Index™ – People. The maximum possible score within the Access Opportunities Index™ – People is 100.
Weighting of Scores Depending on one’s perspective on access or the relative importance of different variables, one could assign different weights to each indicator in calculating the points and scores. In this model, all indicators were given equal weight. The different subcategories of the Access Opportunities Index™ – People also could be weighted when calculating the overall country score. For the purposes of this analysis, however, SRI chose to assign each subcategory equal weight. Doing so produces a scoring system that evenly addresses the various factors that affect the potential impacts of access on people in each country.
List of Indicators and Data Sources for the Access Opportunities Index™ – People
Indicators and Data Sources for the
Access Opportunities Index™ – People
Indicator Source Publication
Choice and Expectations
Average annual growth of imports (minus oil) World Trade Organization WTO Statistics Database
Entry into local markets [Entry of new competitors (1=almost never occurs in the local market, 7=is common in the local market)]
World Economic Forum Global Competitiveness Report 2001-2002 (Variable 8.03)
Intensity of local competition [Competition in the local market is (1=limited in most industries and price-cutting is rare, 7=intense in most industries as market leadership changes over time)]
World Economic Forum Global Competitiveness Report 2004-2005 (Variable 7.01)

The Power of Access OPPORTUNITIES FOR PEOPLE
FedEx Corporation SRI International 26
Indicators and Data Sources for the Access Opportunities Index™ – People
Indicator Source Publication
Degree of customer orientation [Firms in your country (1=generally treat their customers badly, 7=are highly responsive to customers and customer relations)]
World Economic Forum Global Competitiveness Report 2004-2005 (Variable 9.08)
Empowerment Secondary school enrollment (gross enrollment ratio) World Bank World Development
Indicators Tertiary school enrollment (gross enrollment ratio) World Bank World Development
Indicators Adult literacy rate (% of persons 15 and over who can read and write) World Bank World Development
Indicators Quality of public schools [The public (free) schools in your country are (1=of poor quality, 7=equal to the best in the world)]
World Economic Forum Global Competitiveness Report 2004-2005 (Variable 4.02)
Press Freedom Index Reporters Without Borders
Third Annual Worldwide Press Freedom Index
Unemployment rate World Bank World Development Indicators
Brain Drain [Your country's most talented people (1=normally leave to pursue opportunities in other countries, 7=almost always remain in your country)]
World Economic Forum Global Competitiveness Report 2004-2005 (Variable 4.12)
Connection
Internet users per 100 inhabitants ITU World Telecommunication Indicators Database 2004
International telephone traffic (incoming + outgoing) minutes per capita ITU World Telecommunication
Indicators Database 2004 Number of cellular mobile telephone subscribers per 100 inhabitants ITU World Telecommunication
Indicators Database 2004 Air passengers carried (domestic and international) per 1,000 people World Bank World Development
Indicators International tourism departures per 100 people World Bank World Development
Indicators Well-Being
Life expectancy at birth World Bank World Development Indicators
Under 5 mortality rate (deaths per 1,000) World Bank World Development Indicators
Adult mortality rate (deaths per 1,000) World Bank World Development Indicators
PPP GDP per capita (current intl. $) World Bank World Development Indicators

The Power of Access OPPORTUNITIES FOR PEOPLE
FedEx Corporation SRI International 27
Potential Impacts of Access on People
Access Opportunities
Index™ – People
Choice and Expectations Empowerment Connection Well-Being Access
Index™
Country Score Rank Score Rank Score Rank Score Rank Score Rank Score RankIceland 84.9 1 59.9 27 90.9 3 92.7 1 95.9 1 72.4 17 Netherlands 83.9 2 74.9 5 92.1 2 84.1 8 84.7 9 83.1 5 Sweden 82.5 3 58.8 28 87.3 7 91.6 2 92.2 2 81.9 8 Finland 80.6 4 71.8 7 88.3 4 85.2 7 77.0 20 82.6 6 United Kingdom 80.4 5 81.2 2 82.8 10 83.8 10 73.9 24 80.5 9 Switzerland 80.2 6 58.1 30 88.0 6 87.1 6 87.7 6 84.2 4 Denmark 79.6 7 64.2 22 88.2 5 84.1 9 82.1 12 85.3 3 Ireland 79.3 8 65.0 20 85.9 8 87.2 5 79.3 14 64.7 23 United States 79.3 9 86.9 1 81.9 12 73.8 20 74.5 23 74.8 12 Belgium 79.0 10 80.2 3 84.9 9 72.1 23 78.6 17 74.9 11 Austria 78.5 11 69.5 11 81.9 13 78.1 13 84.4 10 74.3 14 Hong Kong 78.2 12 71.1 9 60.3 28 89.7 4 91.9 3 91.1 1 Norway 77.9 13 44.4 46 93.0 1 82.2 11 91.9 4 74.0 15 New Zealand 76.9 14 68.8 12 82.8 11 80.3 12 75.6 22 73.7 16 Canada 76.3 15 65.8 18 79.6 14 74.6 18 85.4 8 74.6 13 Australia 76.1 16 63.1 26 78.5 15 76.2 15 86.4 7 69.8 18 Germany 75.9 17 76.8 4 71.6 20 75.7 16 79.3 13 82.1 7 France 72.2 18 68.5 13 73.1 19 69.2 25 77.9 19 79.0 10 Singapore 71.9 19 56.4 31 58.7 31 89.8 3 82.8 11 89.1 2 Israel 71.0 20 67.8 15 61.7 27 75.4 17 79.3 15 69.1 20 Japan 70.6 21 55.7 32 76.0 17 59.3 33 91.5 5 69.7 19 Czech Republic 68.1 22 65.6 19 66.0 24 73.9 19 66.8 26 59.9 30 Spain 67.9 23 66.9 17 63.9 26 64.9 28 75.9 21 64.0 25 Slovenia 67.8 24 52.2 35 77.5 16 72.5 22 68.9 25 59.8 31 Estonia 65.0 25 73.7 6 75.6 18 70.6 24 40.4 45 63.0 26 Italy 63.8 26 45.8 44 57.7 33 73.2 21 78.6 17 61.9 28 Greece 63.5 27 51.3 37 60.3 29 63.6 30 79.0 16 62.9 27 South Korea 63.4 28 58.5 29 66.9 22 62.5 32 65.5 28 66.9 22 Portugal 62.0 29 48.5 40 68.8 21 64.1 29 66.4 27 64.5 24

The Power of Access OPPORTUNITIES FOR PEOPLE
FedEx Corporation SRI International 28
Potential Impacts of Access on People
Access Opportunities
Index™ – People
Choice and Expectations Empowerment Connection Well-Being Access
Index™
Country Score Rank Score Rank Score Rank Score Rank Score Rank Score RankChile 57.1 30 64.8 21 53.7 35 50.4 39 59.6 30 57.4 32 Hungary 56.0 31 50.3 38 66.4 23 62.6 31 44.5 39 45.8 36 Lithuania 55.7 32 67.7 16 59.4 30 50.7 38 45.1 38 50.9 35 Malaysia 55.2 33 53.4 34 49.3 39 67.3 26 50.9 35 55.3 33 Latvia 54.9 34 63.3 24 64.4 25 58.7 34 33.2 50 51.2 34 Slovak Republic 53.9 35 63.3 25 55.6 34 42.6 43 54.2 31 60.3 29 Poland 53.5 36 54.6 33 53.4 36 52.1 36 53.9 32 41.8 40 Costa Rica 48.8 37 40.6 53 51.1 38 42.0 45 61.3 29 35.7 57 Trinidad and Tobago 46.8 38 44.3 47 42.0 45 58.1 35 42.7 42 36.0 55 Jamaica 44.5 39 35.2 58 31.9 56 67.2 27 43.7 40 38.5 49 Bulgaria 42.5 40 41.0 52 45.0 42 42.2 44 41.7 43 37.6 51 Mexico 41.9 41 39.2 55 41.0 46 43.6 42 43.7 41 40.4 45 Turkey 40.7 42 68.3 14 31.3 58 34.5 50 28.8 54 43.4 39 Thailand 40.6 43 42.4 49 58.0 32 34.0 52 27.8 56 44.4 37 Jordan 40.4 44 51.5 36 33.9 52 45.9 40 30.5 52 40.4 44 China 40.3 45 71.3 8 37.5 49 17.2 67 35.2 48 37.6 52 Romania 39.9 46 41.3 50 44.2 43 40.9 46 33.2 50 37.2 54 Mauritius 38.4 47 22.1 67 33.4 53 51.0 37 47.1 36 41.5 41 Uruguay 37.8 48 12.3 71 46.5 40 40.2 47 52.2 34 41.4 42 Panama 36.6 49 22.7 66 37.8 48 38.9 48 47.1 37 37.8 50 El Salvador 36.2 50 46.6 41 31.4 57 44.0 41 22.7 63 39.3 48 Argentina 35.2 51 14.0 70 42.2 44 30.8 54 53.9 33 41.0 43 Brazil 35.1 52 49.8 39 40.2 47 25.3 59 25.1 57 39.9 47 Russia 33.3 53 27.8 62 52.6 37 27.9 56 24.8 58 40.3 46 Ukraine 33.0 54 38.2 56 46.2 41 23.6 62 24.1 60 37.2 53 South Africa 32.4 55 46.1 43 32.3 54 34.2 51 16.9 65 44.3 38 Dominican Republic 32.3 56 40.5 54 29.5 60 35.3 49 23.7 61 31.1 63 Philippines 31.2 57 46.5 42 30.7 59 24.2 61 23.4 62 27.4 65

The Power of Access OPPORTUNITIES FOR PEOPLE
FedEx Corporation SRI International 29
Potential Impacts of Access on People
Access Opportunities
Index™ – People
Choice and Expectations Empowerment Connection Well-Being Access
Index™
Country Score Rank Score Rank Score Rank Score Rank Score Rank Score RankColombia 28.7 58 30.4 60 23.2 69 25.7 58 35.6 47 32.7 61 Sri Lanka 28.0 59 31.7 59 28.3 62 15.2 69 36.6 46 35.9 56 Egypt 27.9 60 45.7 45 25.3 65 19.2 65 21.3 64 35.7 58 Venezuela 26.6 61 7.7 73 24.5 66 32.4 53 41.7 44 31.3 62 Peru 26.4 62 25.4 63 25.7 64 26.1 57 28.4 55 31.1 64 Ecuador 24.3 63 14.5 69 24.0 67 29.1 55 29.5 53 20.8 71 India 23.6 64 63.6 23 16.6 74 5.4 73 8.8 70 34.9 59 Vietnam 23.6 65 36.0 57 23.4 68 10.5 72 24.4 59 18.3 73 Guatemala 23.3 66 29.6 61 27.2 63 24.5 60 11.9 69 21.5 70 Honduras 22.8 67 25.3 64 29.4 61 21.1 63 15.6 67 23.2 69 Paraguay 22.5 68 5.3 75 32.1 55 18.5 66 33.9 49 23.2 68 Indonesia 21.2 69 24.0 65 35.4 50 11.9 70 13.6 68 33.7 60 Bolivia 18.4 70 10.4 72 34.0 51 20.8 64 8.1 71 26.3 66 Nicaragua 18.3 71 21.6 68 19.7 72 15.7 68 16.3 66 18.5 72 Bangladesh 17.1 72 42.9 48 16.9 73 3.5 74 5.1 72 14.4 75 Nigeria 16.9 73 41.0 51 21.2 70 3.0 75 2.4 74 17.3 74 Zimbabwe 9.8 74 5.7 74 19.8 71 11.3 71 2.4 73 23.5 67 Taiwan n/a n/a 69.7 10 n/a n/a 76.4 14 n/a n/a 68.3 21


How Greater Access Is Changing the World:
Opportunities for Business

The Power of Access OPPORTUNITIES FOR BUSINESS
Executive Overview
FedEx Corporation SRI International
i
Introduction Increases in physical and information access have completely transformed the ways in which today’s businesses operate, innovate, compete, and create value. This report is the third of a series that explores the nature, opportunities and benefits generated by access, based on research and analysis conducted by SRI International and commissioned by FedEx Corporation. The report focuses on business as one of the three key groups of beneficiaries of access, and examines the myriad opportunities provided by access to businesses, including how they operate, maximize efficiency, build long-term competitiveness, and increase investor/shareholder value. The Model for Opportunities for Business The access-related opportunities for business come from their increased ability to participate in expanding markets, to choose among wider ranges of suppliers, production mixes, and business processes, and to improve their products and services to meet customers’ needs and build competitive edge. In order to analyze and measure the varied opportunities for business, the research team segmented those opportunities into four components, summarized below.
Components of Opportunities for Business
Relationship to Access
Market Reach Access helps businesses extend their market reach, creating opportunities for specialization, efficiency, investment, and growth.
Supply Chain Strength
Access helps strengthen supply chains by making them more efficient, flexible, and agile, thereby lowering business costs and increasing profitability.
Innovation Access spurs the supply of innovation by facilitating exchange of ideas and talent within and across national borders, and stimulates demand for innovation by raising consumer expectations and the need for new innovation and business models.
Growth and Competitiveness
Access has become a key driver of business growth, and has transformed the rules of competition for all businesses.
Measuring Opportunities for Business – the Access Opportunities Index™ – Business In order to capture the aggregate opportunities that access provides to business around the world, SRI International constructed an Access Opportunities Index™ – Business for 75 major markets using 19 variables that cover Market Reach, Supply Chain Strength,

The Power of Access OPPORTUNITIES FOR BUSINESS
Executive Overview
FedEx Corporation SRI International
ii
Innovation, and Growth and Competitiveness. The Access Opportunities Index™ – Business is a useful tool for examining the relationship between the access available to each country’s businesses, and the positive impacts they derive from this access. Key Findings from the Access Opportunities Index™ – Business
1. Positive outcomes for business are strongly correlated with access. 2. The degree to which businesses take advantage of access varies considerably
across countries.∗
3. The access-related opportunities for business are felt most keenly in supply chain strength and innovation.
4. Businesses harness access to serve different business goals.∗∗
∗ For example, while the United States and Canada enjoy similar levels of overall access, the United States achieves considerably higher benefits for business, as indicated by its higher Access Opportunities Index™ -- Business score (8th versus 18th for Canada). ∗∗ For example, economies such as Hong Kong, Iceland and Malaysia achieve high levels of opportunities for Supply Chain Strength through access, but do not derive similar levels of opportunities in Innovation. By contrast, the United States, Germany and Japan enjoy significant opportunities for business in Supply Chain Strength and Innovation, but register uneven opportunities on Growth and Competitiveness.

The Power of Access OPPORTUNITIES FOR BUSINESS
FedEx Corporation SRI International
iii
CONTENTS
Introduction
The Model for Opportunities for Business Market Reach Supply Chain Strength Innovation Growth and Competitiveness
Measuring Opportunities for Business The Access Opportunities Index™ – Business Key Findings
Appendix: Methodology and Rankings for the Access Opportunities Index™ – Business
1
2 3 5 8
12
14 14 17
21

The Power of Access OPPORTUNITIES FOR BUSINESS
FedEx Corporation SRI International
1
Introduction Increases in physical and information access have completely transformed the ways in which today’s businesses operate, innovate, compete, and create value. In addition to having access to markets and to the traditional inputs of capital, labor, and raw materials, firms need access to technology, human talent, and new ideas in order to survive, prosper, and grow. Increasingly, this access must be available along a global supply chain and distribution network. Access to information – on talent, technologies, inputs, suppliers, market, investment opportunities and competition, etc. – has become as important as, if not more essential than, the physical access to inputs and markets itself. The rising importance of access to information is confirmed by economy-wide data. According to SRI’s calculations, the number of firms that provide information access products and services nationwide has grown by 60 percent since 1990, reaching 602,560 establishments in 2004, compared to a 38 percent increase in the number of total private sector firms during this period.24 Access industry jobs also pay better on average, with information access workers earning 57 percent more, and physical access workers earning 7 percent more than the average worker in the United States in 2004. Average pay is also rising faster for workers in access industries since 1990, indicating that these sectors and their workers are adding increasing value to the economy. This report is the third of a series that explores the nature, opportunities, and benefits generated by access, based on research and analysis conducted by SRI International and commissioned by the FedEx Corporation. The first of the series, “The Power of Access,” introduced and systematically constructed the logic of access, building on the following foundational concepts:
Functional components of access – time, space, and information Beneficiaries of access – people, businesses, and nations Opportunities generated by access – to participate, choose, and improve
The second report focuses on people as a beneficiary of access. It details the potential impacts of access on people’s everyday decisions and choices, actions, behavior, and overall way of life. This report concentrates on business as one of the three key groups of beneficiaries of access, and examines the myriad opportunities provided by access to business, including how they operate,
24 SRI included the following NAICS Codes in the information access industry: 323, 3341, 3342, 3343, 3346, 33592, 42343, 425, 443112, 44312, 51, 5415, and 8112. The physical access industry covers the following NAICS Codes: 336, 4231, 42386, 441, 48, 49, 541614, 5615, and 8111.

The Power of Access OPPORTUNITIES FOR BUSINESS
FedEx Corporation SRI International
2
maximize efficiency, build long-term competitiveness, and increase investor/shareholder value. A fourth report addresses the opportunities that access generates for nations. The Model for Opportunities for Business
Access helps increase the market reach of businesses, strengthen their supply chains, facilitate and support innovation, and create
opportunities to grow and increase shareholder value.
As for people, the access-related opportunities for business come from their increased ability to participate, choose, and improve. Increased access allows companies large and small to participate in the market, a market that is continuously expanding across regional and national boundaries. Increased access to capital, human resources, and other inputs give businesses more choices regarding their suppliers, production mix, and business processes. Increased access to information and technology gives firms the ability to improve continuously their products, processes, and services to meet their customers’ needs and build a competitive business. In order to analyze and measure the opportunities created by access for business, the research team segmented potential impacts into four components: Market Reach; Supply Chain Strength; Innovation; and Growth and Competitiveness.
Components of Opportunities for Business
Description of Components
Market Reach
There is no business without markets. Increased information and physical access let companies reach customers and sell to a wider market, even beyond national borders. The opportunity to sell to an expanding market in turn allows businesses to specialize, create product niches, achieve economies of scale, and generate additional revenue and investment opportunities. This component examines the benefits of expanded market reach for how businesses operate, compete, and grow.

The Power of Access OPPORTUNITIES FOR BUSINESS
FedEx Corporation SRI International
3
Supply Chain Strength
A profitable and competitive business must be supported by a strong supply chain that is efficient, flexible, and adaptable to a changing market environment. Increases in physical and information access have enabled companies to develop and apply technologies and processes that dramatically increase supply chain efficiency and agility. This component explores how supply chains have been strengthened by increased access and related opportunities including cost savings, faster turnaround to meet customer needs, and the globalization of business operations.
Innovation
Businesses can survive and be profitable through operational efficiencies, but they can become industry leaders only by continuously adding value to their products and services through innovation. This component focuses on the anticipated impacts of access on business innovation, as reflected in shrinking product cycles, cross-border innovation networks, and business process innovations that come from harnessing increased access (e.g., proliferation of “access platforms”).
Growth and Competitiveness
Ultimately, the objectives of most businesses are to be competitive in the marketplace, build long-term growth potential, and maximize investor/shareholder value. Under this component, the SRI team provides empirical evidence on growth and competitiveness on both business and regional levels that has resulted from increased access.
Market Reach
Access helps businesses extend their market reach, creating opportunities for specialization, efficiency, investment, and growth.
Access helps businesses expand beyond their traditional geographical
markets. Advances in information technology, the proliferation of the Internet, and the increased reliability and speed of shipping allow small business to market to customers across the country and, most importantly, to fulfill those orders. A good example is Shari’s Berries, a Sacramento-based company whose hand-dipped strawberries – a highly-perishable, specialty food item – were a quintessentially local product before the age of access.

The Power of Access OPPORTUNITIES FOR BUSINESS
FedEx Corporation SRI International
4
Started in a one-bedroom apartment in 1989 and expanded to five stores in California by 1998, Shari’s Berries decided to launch its website www.berries.com and partnered with FedEx to develop a supply chain that integrates order management, shipment tracking and customer billing. Immediately, nationwide sales took off, increasing by more than ten times for Christmas 1999, and by more than 800 percent in the first quarter of 2000. Shari’s Berries now sells to all 50 states and has achieved market recognition for its unique products and high-quality services. Shari’s Berries has successfully harnessed physical and information access to expand its market and provide customer fulfillment.
Access extends the market reach of small businesses, allowing them to
achieve specialization and operational efficiency. Traditionally, most small businesses serve a limited local market, which constrains opportunities to specialize, achieve efficiency, and grow. Access to a much larger pool of customers via the Internet has changed the market landscape for small businesses worldwide. It is estimated that more than 60 percent of U.S. small businesses now have an online presence. In 2003, the e-sales of non-store retailers (those that only have a virtual store) grew 21 percent, a rate much higher than the overall retail sales growth of 4 percent across the country.25 Companies that list their products and services on eBay, for example, have access to a potential clientele of 60 million active users. eBay has estimated that $40 billion of goods and services will be exchanged in 2005 through eBay.26 The ability to sell to customers anywhere in the country and around the world allows small businesses to do what they do best – provide specialized products and services to a clientele that extends beyond their immediate geographical region, and to achieve a sales volume that makes their business viable.
Access to a global market stimulates competition and creates new
investment opportunities for businesses and shareholders. Increased access to a worldwide market, facilitated by physical and information access and a liberalizing global economy, has created enormous opportunities as well as challenges for businesses worldwide. On one hand, many businesses are now contending with foreign competition at home, but they also find opportunities in an increasingly level playing field in the rest of the world. Intensifying competition does not allow complacency but rewards aggressive marketing strategies that leverage resources, advantages, and experience developed in one market to enter and compete in another. Nokia and
25 U.S. Census Bureau, Economics and Statistics Administration, www.census.gov/estats. 26 Washington Post, “E-Commerce’s Growing Pains,” June 25, 2005, A01.

The Power of Access OPPORTUNITIES FOR BUSINESS
FedEx Corporation SRI International
5
Motorola compete not only in their home countries but in the worldwide cellular market. Multinational firms from Honda to Dell Computers to Citigroup are truly global businesses that operate and sell in all regions of the world, seeking new markets and investment opportunities to maximize return to their businesses and shareholders.
Supply Chain Strength
Access helps strengthen supply chains by making them more efficient, flexible, and agile, thereby lowering
business costs and increasing profitability.
Access was the catalyst for the Supply Chain Revolution. Over the past decade, the processes in which stores and manufacturers stock inventory, initiate delivery orders, and plan production have been completely transformed by a quiet but powerful supply chain revolution. Traditionally, supply chain management was about supply; firms focused on obtaining the best deal from suppliers, stocked “buffer supplies,” and planned production according to purchase orders. Access to real-time information about purchases, inventories, and customer preferences, and access to reliable and express transportation have enabled the development of new supply chain models such as “vendor-managed inventory” (VMI), “just-in-time” manufacturing, and “build-to-order” systems. For example, under the VMI mode, the manufacturer receives electronic data about the sales and stock levels of distributors, and is responsible for generating orders to maintain the inventory plan. The reengineered supply chain focuses on reducing response time, stockpiles of inventory and their carrying costs, while responding to real-time sales data from customers.
Access helps companies provide quality products to customers at low
cost. A company that epitomizes a lean and efficient supply chain is Dell Computer, whose growth from a $1,000 startup in 1983 to a $35 billion global giant in 2002 is largely due to its success in harnessing access to reach customers and deliver products and services through its reliable and low-cost global supply chain. The entire purchase of a Dell product from order receipt (via the Internet) to product shipment takes only a few hours. Dell has also been credited with pioneering systems to deliver customer-configured and built-to-order technology products, online technical assistance, and integrating commerce with the Internet. Without access – to customers, to suppliers, to technology, to finance – advanced supply chains such as Dell’s would not have been possible.

The Power of Access OPPORTUNITIES FOR BUSINESS
FedEx Corporation SRI International
6
Access to advanced logistics management and information technology
reduces inventory and its carrying costs for businesses. By employing information-based logistics management systems, U.S. businesses are increasingly able to manage the flow of inputs and finished products efficiently and with more certainty, and therefore no longer need to carry large stocks of inventory as “insurance.” Since 1982, the economy-wide inventory-to-sales ratio has fallen from 1.67 to 1.37 in 2003.27 The decline was particularly sharp for the manufacturing sector, falling from 1.95 to 1.33 during this period. As a result, over the same period, the inventory carry cost in the United States fell from 7.2 percent of GDP to 2.7 percent. Compared to the 1982 inventory level, the inventory savings for U.S. businesses from increased supply chain efficiency is estimated at $495 billion in 2003 alone.
Access expands choices of suppliers and enables a global value chain.
Access to information and data exchange and access to efficient and reliable global transportation networks have enabled the globalization of business operation in order to maximize human talent and cost advantages. Flextronics, a leading electronics manufacturing services firm, is a success
27 Inventory-to-sales ratio is measured in “months of supply,” based on the inventories at the end of the month to sales for the month.
U.S. Inventory-Sales Ratio1982-2003
1.2
1.3
1.4
1.5
1.6
1.7
1.8
1.9
2
1982 1984 1986 1988 1990 1992 1993 1995 1997 1999 2001 2003
Total manufacturing and trade
Manufacturing
Merchant wholesalers
Source: U.S. Census Bureau

The Power of Access OPPORTUNITIES FOR BUSINESS
FedEx Corporation SRI International
7
case of a company that has built a global value chain to serve customers worldwide. Based in Singapore, Flextronics has global operations spread across five continents in 30 countries. For one of Flextronics’ cellular telephones, the design team was in San Jose and Singapore; functional testing of prototypes was carried out in Sweden, and production was carried out by contract manufacturers in low-cost locations stretching from China to Eastern Europe to Brazil. By harnessing access to build a competitive, global supply chain, Flextronics has grown into a leading electronics manufacturing services firm that boasts revenues of $15.9 billion in 2005.
Greater access raises supply chain efficiency, which increases
profitability. Across competing businesses, those that can master complex supply chains to create product innovations, produce at competitive costs, and deliver to customers with a high degree of reliability become industry leaders. According to a global benchmarking report produced by Deloitte Touche Tohmatsu, manufacturers that manage their supply chains effectively reap the reward of greater profitability.28 These supply chain leaders were distinguished from their peer group by being 73 percent more profitable. The data, compiled from responses from nearly 600 companies in 22 countries around the world, clearly indicates that effectively managing a complex, global supply chain brings significant, positive impact on a company’s financial performance.
28 Deloitte Touche Tohmatsu, “Mastering Complexity in Global Manufacturing: Powering Profits and Growth Through Value Chain Synchronization,” 2003.

The Power of Access OPPORTUNITIES FOR BUSINESS
FedEx Corporation SRI International
8
Innovation
Access spurs the supply of innovation by facilitating exchange of ideas and talent within and across national borders, and stimulates demand for innovation by raising consumer expectations and the
need for new innovation and business models.
Access expands the pool of talent and ideas available to businesses and helps create a global innovation market. Increased access in the form of physical mobility and ease of information exchange and data transfer have made it possible for researchers to brainstorm on ideas, exchange data, and share research findings easily and frequently across borders. In order to access and assemble the most talented research teams to create innovations, industry leaders are establishing and extending networks of laboratories and research/testing facilities around the world. Hewlett Packard, for example, has maintained its innovation leadership position by building a truly global design and development infrastructure – a network of HP laboratories in California, France, India, Israel, Japan, and the United Kingdom. Similarly, GlaxoSmithKline has established seven Centers of Excellence for Drug Discovery, spread out across the United States, the United Kingdom, and Italy. This trend is reflected in the dramatic increases in U.S. investment in R&D abroad, as well as foreign investment in U.S.-based R&D centers since 1980.
R&D Investments by Multinational Corporations
0
5000
10000
15000
20000
25000
30000
1980 1982 1987 1988 1989 1990 1991 1992 1993 1994 1995 1996 1997 1998 1999 2000
Mill
ions
of c
urre
nt U
.S. d
olla
rs
Foreign MNC R&D in U.S.
U.S. MNC R&D Abroad
Source: National Science Board, S&E Indicators 2004, Tables A 4-49 & A 4-51.

The Power of Access OPPORTUNITIES FOR BUSINESS
FedEx Corporation SRI International
9
Growth of International Technology Alliances
0
100
200
300
400
500
600
700
800
1980 1985 1990 1995 2000
Num
ber o
f Alli
ance
s
Source: National Science Board, S&E Indicators 2004, Table A 4-42
Access spurs innovation by facilitating entrepreneurs, inventors, and investors to tap into a global network of ideas, capital, and technology. Increasingly, research from fundamental science to applied, commercial technology development is being undertaken through global networks and alliances. One demonstration of the expanding innovation networks among companies all over the world is the proliferation of international technology alliances. Technology alliances can be defined as “collaborative relationships or partnership among legally distinct parties that involve joint R&D or technology development activities.”29 Firms participating in such alliances share R&D costs, pool risks, complement capabilities, and tap into resources beyond individual firms. The number of international technology alliances has nearly tripled since 1980.
Access increases innovative output in developing countries. The
increasing R&D linkage between the powerhouses of large multinational firms and developing countries provides important spillover and stimulation for indigenous innovation in emerging markets. The access to resources of innovation (i.e., scholarly research, latest theories and thinking, R&D data and findings, etc.), paired with access to a network of other inventors and entrepreneurs, has fueled a steady growth in innovative output in important
29 National Science Board, Science and Engineering Indicators 2004, Volume 1, pg. 4-42.

The Power of Access OPPORTUNITIES FOR BUSINESS
FedEx Corporation SRI International
10
emerging markets such as China, India, and Brazil. In the past 15 years, there has been tremendous growth in the number of patents held by Chinese and Indian inventors. For example, the number of U.S. patents granted to Chinese inventors increased from 47 in 1990 to 297 in 2003. In China, the number of patents granted to Chinese inventors from 1994-2000 grew from 1,659 to 6,475. India’s innovation output growth has been similarly impressive, with the number of U.S. patents granted to Indian inventors growing from 23 to 341 over the 1990-2003 period.
Access raises consumer expectations on products and services, which
in turn drive companies’ innovation and product development cycles. In this age of access, people increasingly expect that their wants and needs should be satisfied quickly – calling people from any place at any time, sending and receiving emails or the latest photos or videos, checking the latest stock prices or sports scores, or downloading the latest music or movie. Consumers have come to expect that whenever they upgrade or purchase a new computer, digital camera, PDA, cell phone or iPod, they will get more features, higher capacity (more memory, higher speed, etc.), better services, and perhaps lower prices compared to the year before. These expectations, and the consumer trend of upgrading products within a shorter time span, are driving businesses to innovate and bring new or improved products at a
Innovative Output in Developing Countries(Number of triadic patent families by residence of inventor)*
0
50
100
150
200
250
300
1985 1990 1995 2000
Num
ber o
f Pat
ents
Gra
nted
Brazil
India
China
Other Developing Countries
* The OECD's "triadic patent family" data covers a set of patents taken at the European Patent Office, the Japanese Patent Office, and the U.S. Patent and Trademark Office to protect the same invention. (For more information see OECD, 2004, "Compendium of Patent Statistics")Source: OECD Compendium of Patent Statistics 2004
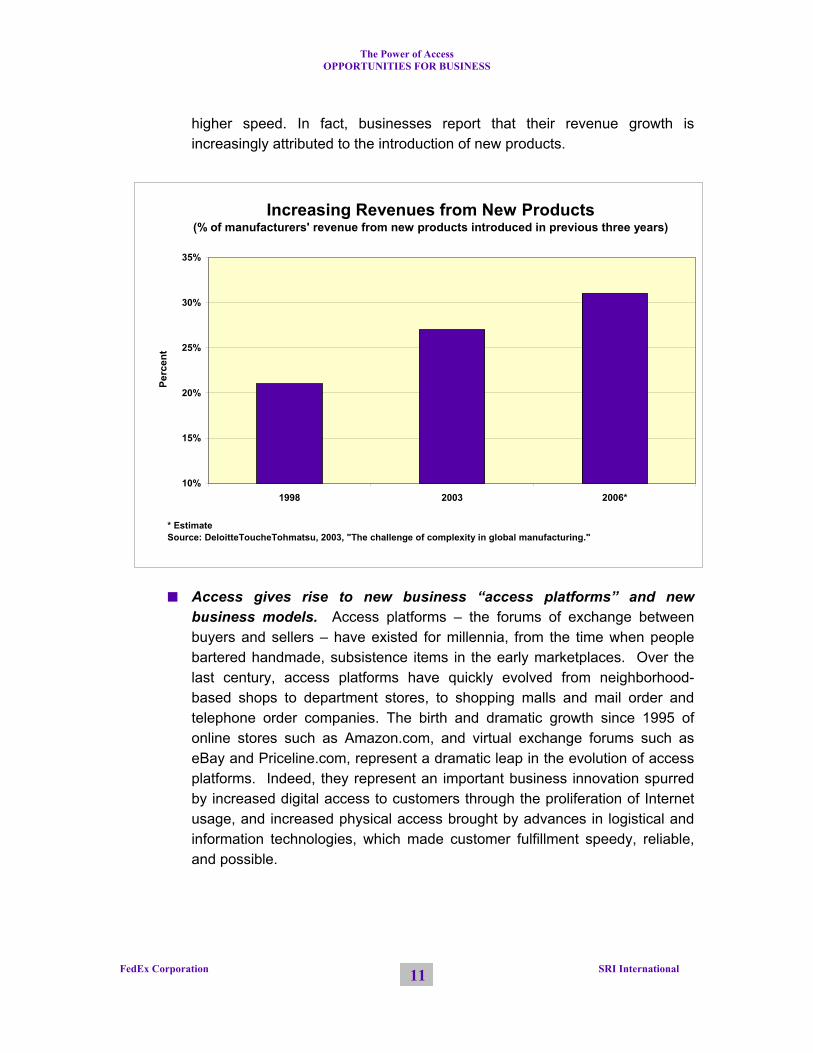
The Power of Access OPPORTUNITIES FOR BUSINESS
FedEx Corporation SRI International
11
higher speed. In fact, businesses report that their revenue growth is increasingly attributed to the introduction of new products.
Access gives rise to new business “access platforms” and new
business models. Access platforms – the forums of exchange between buyers and sellers – have existed for millennia, from the time when people bartered handmade, subsistence items in the early marketplaces. Over the last century, access platforms have quickly evolved from neighborhood-based shops to department stores, to shopping malls and mail order and telephone order companies. The birth and dramatic growth since 1995 of online stores such as Amazon.com, and virtual exchange forums such as eBay and Priceline.com, represent a dramatic leap in the evolution of access platforms. Indeed, they represent an important business innovation spurred by increased digital access to customers through the proliferation of Internet usage, and increased physical access brought by advances in logistical and information technologies, which made customer fulfillment speedy, reliable, and possible.
10%
15%
20%
25%
30%
35%
1998 2003 2006*
* Estimate Source: DeloitteToucheTohmatsu, 2003, "The challenge of complexity in global manufacturing."
Increasing Revenues from New Products(% of manufacturers' revenue from new products introduced in previous three years)
Perc
ent

The Power of Access OPPORTUNITIES FOR BUSINESS
FedEx Corporation SRI International
12
Growth and Competitiveness
Access has become a key driver of business growth, and has transformed the rules of competition for all businesses.
Access has altered the competitive landscape for business, and will
continue to dominate how firms develop competitive advantage in their industry. In the age of access, businesses find that they must continuously keep up with the opportunities and threats created by access in order to survive and stay competitive. Firms are developing and altering their business models in order to access information on their markets, provide increased access to their customers (and give customers greater access to them), and leverage access to reduce cost and improve products and services. Staying in business and vying for industry leadership is no longer only about maximizing market share or operational efficiency, but increasingly is tied to understanding, leveraging, and harnessing physical and information access in order to achieve multiple business objectives.
Access to customers through the Internet is a key growth driver for
retailers. Nationwide, retail e-commerce sales were estimated at $56 billion for 2003, a 25 percent increase over 2002, and much higher than the 4 percent increase in overall retail sales growth.30 Since online sales still represent a very small portion of retail sales (approximately 5 percent), the growth potential in this segment is enormous. In addition, younger age groups, who have grown up in the age of computers, are much more likely than older groups to shop online. As consumers increasingly use the Internet to do product research and comparison shopping, businesses that have the most efficient access platforms (e.g., product search engines and secure and efficient payment systems) and fulfillment capability will have the advantage in gaining a piece of this growing market. Even large retail chains with extensive store networks are building a strong online presence to reach customers who may want to browse for product information before they visit the store, or to skip the stores entirely and shop online.
Access to new markets, to new marketing channels and to innovation is
critical for manufacturing competitiveness. Previous sections of this report have discussed how access helps extend the market reach for business, build a strong and agile supply chain, and support innovation by
30 U.S. Census Bureau, Economics and Statistics Administration, www.census.gov/estats. These figures include both store and non-store retailers.

The Power of Access OPPORTUNITIES FOR BUSINESS
FedEx Corporation SRI International
13
facilitating the flow of ideas and exchange of information. Leading manufacturers around the world have indeed confirmed that new products and services, entering new geographic markets, and developing marketing channels are among their top five revenue drivers.
Access to investment opportunities around the world helps diversify
risks and brings higher profits. The ability to invest abroad, both through corporate expansion and through investing in foreign companies, helps to diversify investment portfolios and risks and bring new profit opportunities. In fact, corporate profits received from overseas have been rising much faster than corporate profits made in domestic industries in the past few years. As indicated by the chart below, corporate profits from domestic industries grew 42 percent in 1998-2004, while receipts from abroad more than doubled. Similarly, foreign companies also found lucrative opportunities investing the U.S. market, as reflected in the rapidly rising payments to the rest of the world.
0% 20% 40% 60% 80% 100%
New products and services
Economic turnaround
Industry market growth
Developing new marketchannels
Entering new geographicmarkets
Percentage of respondents indicating moderate to high importance
Source: DeloitteToucheTohmatsu, 2003, "The challenge of complexity in global manufacturing"
Top Five Revenue Drivers(Results of survey of leading manufacturing executives around the world)

The Power of Access OPPORTUNITIES FOR BUSINESS
FedEx Corporation SRI International
14
Measuring Opportunities for Business
The Access Opportunities Index™ – Business
In order to capture and measure the aggregate benefits of access on business around the world, SRI International constructed an Access Opportunities Index™ – Business for 75 major markets using 19 variables that cover the four components of potential impacts on business: Market Reach, Supply Chain Strength, Innovation, and Growth and Competitiveness. In order to provide cross-country comparisons, the SRI team focuses on country-level data that reflects the access-related opportunities for businesses. However, it should be noted that opportunities for business within each country may vary widely from industry to industry, and from firm to firm.
Market Reach indicators measure how far firms in a given country have extended their business to the international market. They include quantitative measurement of the size of the traded sector relative to a country’s population, size of economy, and geographic location; as well indicators from
Domestic and Overseas Corporate Profits
0
200
400
600
800
1000
1200
1998 1999 2000 2001 2002 2003 2004
Domestic IndustriesReceipts from overseasPayments to the rest of the world
Source: U.S. Department of Commerce, Bureau of Economic Analysis.
$ B
illio
ns

The Power of Access OPPORTUNITIES FOR BUSINESS
FedEx Corporation SRI International
15
qualitative surveys that capture the extent to which businesses export to regional markets and to the rest of the world.
Supply Chain Strength indicators attempt to capture business efficiencies
made possible through increased access. They are mostly proxy measurements because supply chain efficiency is typically measured on a company level, not on a national level. These proxy indicators examine the prevalence of B2B and B2C E-Commerce, the extent to which businesses have adopted the most efficient technologies in their production processes, and whether businesses are adding value along the entire “value chain” (from extraction to logistics, from product design to after-sales services). In addition, indicators on air freight usage and growth are included to measure the extent to which businesses have taken advantage of increased access through air transport.
Innovation indicators focus on the capacity of businesses in each country to
develop new technologies and design new products, and the aggressiveness with which firms absorb and adopt new technologies. This component includes data on patent applications and scientific publications as proxy measurements of innovation outputs. It also includes high-tech exports as a share of GDP as an indicator of businesses’ capability to turn innovation and technology absorption into marketable products.
Growth and Competitiveness indicators measure, on an aggregate (or
national) level, the success of businesses in harnessing increased access in order to grow, expand their markets, and extend their ability to raise capital. Therefore, several are outcome indicators on the macroeconomic level (export growth, growth in foreign direct investment, stock market capitalization, etc.). This component also includes an indicator that reflects the nature of the competitive advantage held by firms in different countries.
All indicators were selected because they measure or provide a proxy measurement of certain aspects of opportunities for business that result from increased access. As in the Access Index™, all of the data were selected from high-quality and reliable sources that use a uniform methodology for all countries covered. The methodology for compiling the Access Opportunities Index™ – Business (including a list of the 19 indicators and their sources) and country rankings at the component level are presented in the Appendix to this report. The following table displays the Access Opportunities Index™ – Business rankings of 75 countries and their corresponding Access Index™ rankings.
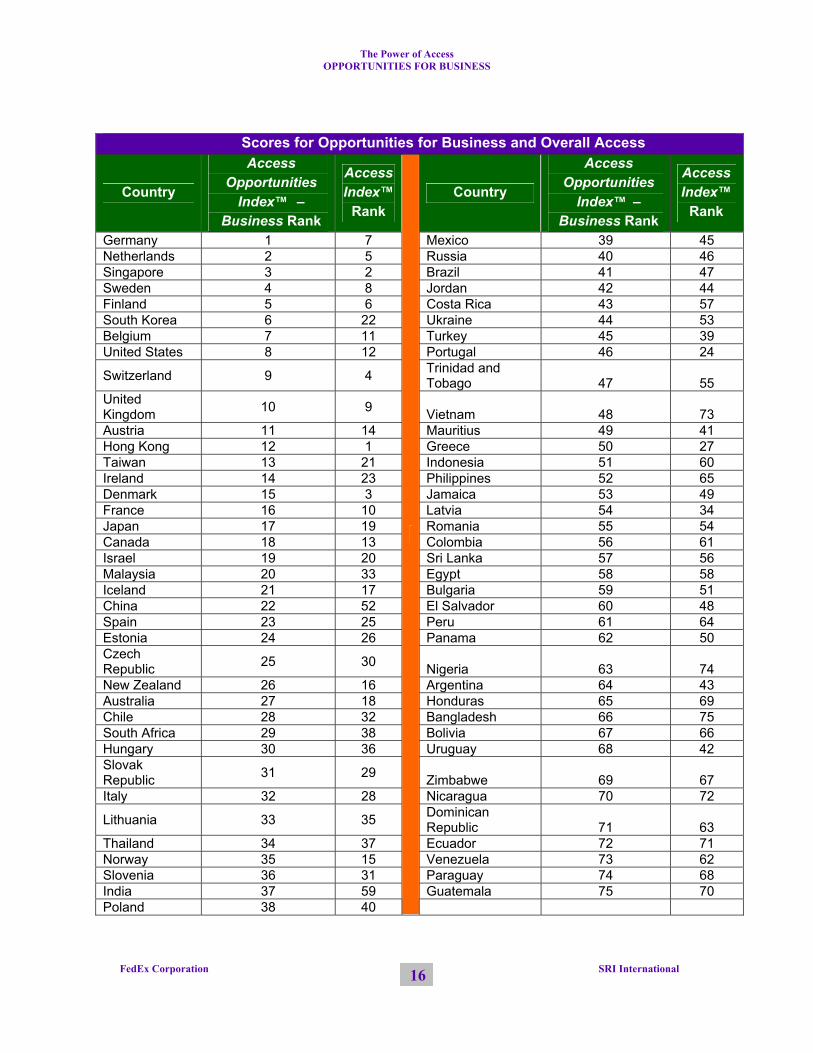
The Power of Access OPPORTUNITIES FOR BUSINESS
FedEx Corporation SRI International
16
Scores for Opportunities for Business and Overall Access
Country
Access Opportunities
Index™ – Business Rank
Access Index™
Rank Country
Access Opportunities
Index™ –Business Rank
Access Index™
Rank
Germany 1 7 Mexico 39 45 Netherlands 2 5 Russia 40 46 Singapore 3 2 Brazil 41 47 Sweden 4 8 Jordan 42 44 Finland 5 6 Costa Rica 43 57 South Korea 6 22 Ukraine 44 53 Belgium 7 11 Turkey 45 39 United States 8 12 Portugal 46 24
Switzerland 9 4 Trinidad and Tobago 47 55
United Kingdom 10 9 Vietnam 48 73 Austria 11 14 Mauritius 49 41 Hong Kong 12 1 Greece 50 27 Taiwan 13 21 Indonesia 51 60 Ireland 14 23 Philippines 52 65 Denmark 15 3 Jamaica 53 49 France 16 10 Latvia 54 34 Japan 17 19 Romania 55 54 Canada 18 13 Colombia 56 61 Israel 19 20 Sri Lanka 57 56 Malaysia 20 33 Egypt 58 58 Iceland 21 17 Bulgaria 59 51 China 22 52 El Salvador 60 48 Spain 23 25 Peru 61 64 Estonia 24 26 Panama 62 50 Czech Republic 25 30 Nigeria 63 74 New Zealand 26 16 Argentina 64 43 Australia 27 18 Honduras 65 69 Chile 28 32 Bangladesh 66 75 South Africa 29 38 Bolivia 67 66 Hungary 30 36 Uruguay 68 42 Slovak Republic 31 29 Zimbabwe 69 67 Italy 32 28 Nicaragua 70 72
Lithuania 33 35 Dominican Republic 71 63
Thailand 34 37 Ecuador 72 71 Norway 35 15 Venezuela 73 62 Slovenia 36 31 Paraguay 74 68 India 37 59 Guatemala 75 70 Poland 38 40

The Power of Access OPPORTUNITIES FOR BUSINESS
FedEx Corporation SRI International
17
Key Findings
The Access Opportunities Index™ – Business is a useful tool for examining the relationship between the degree of access available to each country’s businesses, and the benefits they derive from this access. Delving into the components of access-related opportunities for business also yields insights into differences in the ways in which access has been harnessed by businesses to serve their goals. 1. Positive outcomes for business are strongly correlated with access. 2. The degree to which businesses take advantage of access varies
considerably across countries. 3. The access-related opportunities for business are felt most keenly in
supply chain strength and innovation. 4. Businesses harness access to serve different business goals. 1. Positive outcomes for business are strongly correlated with access. As
indicated in the table above, for most countries there is a strong relationship between the degree of access enjoyed (Access Index™ score) and the opportunities that business derives from access (Access Opportunities Index™ – Business score). Of the top 25 countries in the Access Opportunities Index™ – Business, 21 also rank in the top 25 in the Access Index™, strongly suggesting that access – both physical and informational – is a positive and dynamic factor in achieving business efficiency, innovation, and growth.
2. The degree to which businesses take advantage of access varies
considerably across countries. While the overall correlation between access and business opportunities is strong, some countries derive greater opportunities for business at a given level of access than other countries. In the chart below, countries that appear “above the line” derive above-average levels of opportunities for business, and vice versa for countries that place “below the line.” Country-to-country comparisons yield interesting findings. For example, while the United States and Canada enjoy similar levels of overall access (ranking 12th and 13th respectively in the Access Index™), the United States achieves considerably higher benefits for business, as indicated by its higher score and ranking on the Access Opportunities

The Power of Access OPPORTUNITIES FOR BUSINESS
FedEx Corporation SRI International
18
Relationship between Access and Opportunities for Business
0
10
20
30
40
50
60
70
80
90
100
0 10 20 30 40 50 60 70 80 90 100Access Index ™ Score
Acc
ess
Opp
ortu
nitie
s In
dex
™ --
Bus
ines
s S
core
China (52,22)
India (59,37)
Vietnam (73,48)
Canada (13,18)
Bulgaria (51,59)
Australia (18,27)
South Korea (22,6)
Taiwan (21,13)Singapore (2,3)
Hong Kong (1,12)
United States (12,8)
Germany (7,1)
The numbers in parentheses are rankings (not scores) on the Access Index ™ and Access Opportunities Index ™ -- Business , respectively.
Index™ – Business (8th versus 18th for Canada). Similarly, both China and Bulgaria have limited access (ranking 52nd and 51st), but China reaps much greater opportunities for business from its level of access, particularly in the Growth and Competitiveness component. This suggests that businesses in some countries may be able to use access more effectively in order to achieve efficiency and growth, despite constraints posed by a low overall level of access. Conversely, businesses that maximize the benefits of access in their operations may nevertheless be held back by country-specific (or industry-specific) conditions that are not related to access.
3. The access-related opportunities for business are felt most keenly in supply chain strength and innovation. Comparing across components of opportunities for business, SRI found that Supply Chain Strength and Innovation indicators have the strongest correlations with the Access Index™ score. For example, countries that rank in the top 10 in the Access Index™ also rank in the top 20 in both the Supply Chain Strength and Innovation components (with one exception, see table below). This suggests that of all the components of the Access Opportunities Index™ – Business, Supply Chain Strength and Innovation are the most dependent on both physical access and information access; thus increased access has the most positive and direct relation to increasing supply chain efficiency and levels of innovation across countries.

The Power of Access OPPORTUNITIES FOR BUSINESS
FedEx Corporation SRI International
19
Component Rankings of the Access Opportunities Index™ – Business: Selected Countries
Country Supply Chain Strength Innovation
Growth and Competitive
-ness
Market Reach
Access Index™ Rank
Hong Kong 3 28 33 1 1 Singapore 5 11 25 3 2 Denmark 18 4 7 31 3 Switzerland 12 3 26 17 4 Netherlands 8 10 13 5 5 Finland 16 2 1 21 6 Germany 2 6 24 2 7 Sweden 19 1 6 12 8 United Kingdom 13 8 12 15 9 France 11 16 39 14 10 Belgium 20 14 9 4 11 United States 1 7 29 18 12 Canada 24 18 34 16 13 Austria 10 17 22 8 14 Norway 35 21 31 53 15 New Zealand 22 20 59 24 16 Iceland 9 29 5 44 17 Australia 30 22 46 23 18 Japan 6 5 50 25 19 Israel 17 9 2 49 20
4. Businesses harness access to serve different business goals. Among
countries that enjoy high levels of access, there is a great divergence among opportunities for business across the different components. For example, economies such as Hong Kong, Iceland, Mauritius, and Malaysia achieve high benefits in Supply Chain Strength through access, but do not derive similar levels of benefits in Innovation (see above table). By contrast, the United States, Germany, and Japan enjoy significant opportunities for business in the Supply Chain Strength and Innovation components, but register uneven scores on Growth and Competitiveness. These outcomes may reflect differences in the orientation, industry mix, and competitive advantages present in different economies, as well as differences in the ways that businesses around the world harness access in order to achieve their business goals.

The Power of Access OPPORTUNITIES FOR BUSINESS
FedEx Corporation SRI International
20
United States
70.4
57.9
84.5
85.2
0102030405060708090
100Innovation
Supply Chain Strength
Growth & Competitiveness
Market Reach
Access Index
Access Opportunities Index --Business
74.8
Hong Kong
92.9
55.8
81.9
58.8
0102030405060708090
100Innovation
Supply Chain Strength
Growth & Competitiveness
Market Reach
Access Index
Access Opportunities Index --Business
91.1
Japan
65.4
45.4
79.1
86.2
0102030405060708090
100Innovation
Supply Chain Strength
Growth & Competitiveness
Market Reach
Access Index
Access Opportunities Index --Business
69.7
Netherlands
81.4
78.0
66.0
84.10
102030405060708090
100Innovation
Supply Chain Strength
Growth & Competitiveness
Market Reach
Access Index
Access Opportunities Index --Business
83.1


The Power of Access OPPORTUNITIES FOR BUSINESS
FedEx Corporation SRI International
21
APPENDIX Methodology and Rankings for the Access Opportunities Index™ – Business

The Power of Access OPPORTUNITIES FOR BUSINESS
FedEx Corporation SRI International
22
Why an Access Opportunities Index™ – Business? The Access Index™ and the Access Opportunities Index™ – Business, developed by SRI International, provide insights into the power and importance of the concept of access at the national level. There are a host of studies that have quantified, ranked, and compared countries based on their level of globalization, economic freedom, competitiveness, and other factors. However, because the concept of “access” does not fit into traditional ways of thinking about how society advances, thus far few attempts have been made to quantify access or to measure its impacts comprehensively. The Access Index™ and the Access Opportunities Index™ – Business are similar to a benchmarking exercise. Benchmarking is a powerful analytical tool that uses systematic aggregation of variables to assess and compare countries and regions on a certain factor or a set of factors. Benchmarking countries’ level of access allows for an objective analysis of where one country stands in a competitive global environment, helps to pinpoint areas where access is strong, and identifies areas where access is limited. The Access Index™ seeks to measure the “openness” of countries – that is, the access of a country, its businesses, and its citizens to physical items and information from the outside world – as well as the access that the outside world has to a country, its businesses, and its citizens. The Access Opportunities Index™ – Business measures the potential impacts that a country’s level of access has on overall business operations. The Access Index™ and the Access Opportunities Index™ – Business can be used together to conduct comparisons and draw conclusions about the relationship between expanding access and the level of innovation, supply chain strength, and growth and competitiveness of the country’s businesses.
Methodology for the Access Opportunities Index™ – Business
Categories of Measurement
In order to analyze and measure the varied opportunities that access provides for business, the research team segmented those potential impacts into four components: Market Reach, Supply Chain Strength, Innovation, and Growth and Competitiveness.
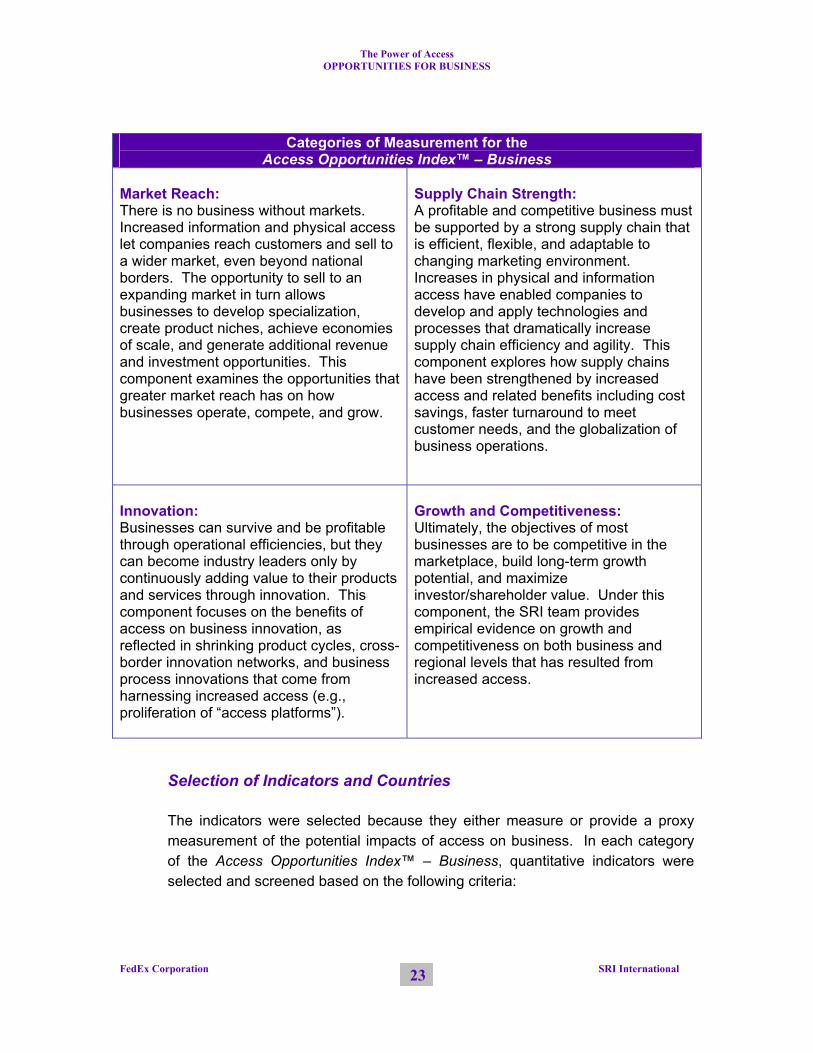
The Power of Access OPPORTUNITIES FOR BUSINESS
FedEx Corporation SRI International
23
Categories of Measurement for the
Access Opportunities Index™ – Business Market Reach: There is no business without markets. Increased information and physical access let companies reach customers and sell to a wider market, even beyond national borders. The opportunity to sell to an expanding market in turn allows businesses to develop specialization, create product niches, achieve economies of scale, and generate additional revenue and investment opportunities. This component examines the opportunities that greater market reach has on how businesses operate, compete, and grow.
Supply Chain Strength: A profitable and competitive business must be supported by a strong supply chain that is efficient, flexible, and adaptable to changing marketing environment. Increases in physical and information access have enabled companies to develop and apply technologies and processes that dramatically increase supply chain efficiency and agility. This component explores how supply chains have been strengthened by increased access and related benefits including cost savings, faster turnaround to meet customer needs, and the globalization of business operations.
Innovation: Businesses can survive and be profitable through operational efficiencies, but they can become industry leaders only by continuously adding value to their products and services through innovation. This component focuses on the benefits of access on business innovation, as reflected in shrinking product cycles, cross-border innovation networks, and business process innovations that come from harnessing increased access (e.g., proliferation of “access platforms”).
Growth and Competitiveness: Ultimately, the objectives of most businesses are to be competitive in the marketplace, build long-term growth potential, and maximize investor/shareholder value. Under this component, the SRI team provides empirical evidence on growth and competitiveness on both business and regional levels that has resulted from increased access.
Selection of Indicators and Countries
The indicators were selected because they either measure or provide a proxy measurement of the potential impacts of access on business. In each category of the Access Opportunities Index™ – Business, quantitative indicators were selected and screened based on the following criteria:
The Power of Access OPPORTUNITIES FOR BUSINESS
FedEx Corporation SRI International
24
The indicator is a reasonable, objective measurement of an aspect of access; The indicator is quantifiable or can be scored based on qualitative/survey
results; The indicator can be drawn from reliable, high-quality data sources; Indicator data are up-to-date (preferably less than 3-4 years old); and Indicator data are available for all, or at least the majority of, the world’s major
economies. A detailed list of the 19 indicators used in the benchmarking analysis is provided at the end of this Appendix. The project team collected comprehensive data for the 15 selected indicators for the same set of 75 countries that was analyzed in the Access Index™. The 75 included countries cover a cross-section of the world’s large, medium, and small economies, and cover all geographical regions. To prevent the large country bias that can easily occur in this type of analysis, many of the indicators were normalized for size (e.g., measuring the amount of air freight as a percentage of gross domestic product). It is also important to note that, although statistical measurement and data collection have improved dramatically and expanded in scope in recent years, the accuracy and comparability of data across countries is far from perfect. Many data sets are based on surveys, for example, which can yield different results in countries facing varying circumstances. Scoring Methodology
Calculation and Normalization of Points for Each Indicator
To make the scoring process as objective as possible, countries received a score for each of the 19 indicators based on the country’s rank for that indicator. If a country ranked the highest for an indicator, it received 75 points for that indicator. Conversely, a country that ranked the lowest in an indicator received one point. Because some countries were missing data on some indicators, the highest possible number of points varied across indicators (ranging from 50 to 75). Therefore, the points were normalized by dividing each country’s points earned by the highest possible number of points for that indicator and multiplying the result by 100. For example, Australia received 56 points for the indicator “Production Process Sophistication,” and the highest possible number of points was 74. Therefore, Australia’s normalized score was 75.7. After normalization, the highest possible score for every indicator was 100.

The Power of Access OPPORTUNITIES FOR BUSINESS
FedEx Corporation SRI International
25
Calculation of Total Scores
The Access Opportunities Index™ – Business scores countries on each of the four subcategories: innovation, supply chain strength, growth and competitiveness, and market reach. A country’s score for each subcategory was calculated by adding together all of the normalized points earned for each of the indicators in that category. The total score was then calculated by dividing the country’s total points earned by the maximum possible points a country could have earned if it scored the highest on every indicator. For example, Australia received 461.3 out of a total possible 700 points (or 65.9 percent of the total) for Innovation, giving Australia a score of 65.9 for the Innovation category.31 Because the total scores are normalized in this fashion, the maximum possible score for each of the four subcategories is 100 points each. The scores for the four subcategories were then combined to calculate a single score for each country. This score also was normalized, by dividing a country’s total normalized points by the maximum possible score. For example, Australia received 66.7 points for Market Reach, 53.3 points for Supply Chain Strength, 65.9 points for Innovation, and 49.5 points for Growth and Competitiveness. Its combined score is 235.5 points out of a total possible 400 points (or 58.9 percent of the total), giving Australia a score of 58.9 on the Access Opportunities Index™ – Business. The maximum possible score for the Access Opportunities Index™ – Business is 100.
Weighting of Scores
Depending on one’s perspective on access or the relative importance of different variables, one could assign different weights to each indicator in calculating the points and scores. In this model, all indicators were given equal weight. The different subcategories of the Access Opportunities Index™ – Business also could be weighted when calculating the overall country score. For the purposes of this analysis, SRI chose to assign each subcategory equal weight. Doing so produces a scoring system that evenly addresses the various factors that affect access-related opportunities for business in each country.
31 In those few cases where a country was missing data for a particular indicator, the SRI team made the necessary adjustments in the point totals to account for the missing data and to arrive at a score for the country.

The Power of Access OPPORTUNITIES FOR BUSINESS
FedEx Corporation SRI International
26
List of Indicators and Data Sources for the Access Opportunities Index™ – Business
Indicators and Data Sources for the
Access Opportunities Index™ – Business Indicators Source Publication
Market Reach Breadth of International Markets [Exporting companies from your country sell (1=primarily in a small number of foreign markets, 7=in virtually all international country markets)]
World Economic Forum Global Competitiveness Report 2004-2005 (Variable 9.11)
Actual vs. Expected Size of Traded Sector [countries with large trade sectors compared to what would be expected, given their population, geographic size, and location, receive a higher score]
Fraser Institute Economic Freedom of the World Report 2004 (Variable 4-C)
Extent of Regional Sales [Exports from your country to neighboring countries are (1=limited, 7=substantial and growing)]
World Economic Forum Global Competitiveness Report 2004-2005 (Variable 9.10)
Supply Chain Strength Production Process Sophistication [Production processes use (1=labor intensive methods or previous generations of process technology, 7=the world's best most efficient process technology)]
World Economic Forum Global Competitiveness Report 2004-2005 (Variable 9.06)
Value Chain Presence [Exporting companies in your country are (1=primarily involved in resource extraction or production, 7=not only produce but also perform product design, marketing, sales, logistics, and after-sales services)]
World Economic Forum Global Competitiveness Report 2004-2005 (Variable 9.02)
Air Freight as a % of GDP World Bank World Development Indicators
Air Freight Average Annual Growth Rate over 10 Years (1993-2003) World Bank World Development
Indicators
B2B and B2C E-Commerce as a % of GDP World Economic Forum
Global Information Technology Report 2003-2004 (Variables 16 and 17)
Innovation Capacity for Innovation [Companies obtain technology (1=exclusively from licensing or imitating foreign companies, 7=by conducting formal research and pioneering their own new products or processes)]
World Economic Forum Global Competitiveness Report 2004-2005 (Variable 9.04)
Uniqueness of Product Designs [Product designs are (1=copied or licensed from abroad, 7=developed locally)]
World Economic Forum Global Competitiveness Report 2001-2002 (Variable 10.05)

The Power of Access OPPORTUNITIES FOR BUSINESS
FedEx Corporation SRI International
27
Indicators and Data Sources for the Access Opportunities Index™ – Business
Indicators Source Publication Firm-Level Technology Absorption [Companies in your country are (1=not interested in absorbing new technology, 7=aggressive in absorbing new technology)]
World Economic Forum Global Information Technology Report 2003-2004 (Variable III.2.02)
High-Tech Exports as a % of GDP World Bank World Development Indicators
Patent Applications Filed (by residents and non-residents) World Bank World Development
Indicators Science and Technical Journal Articles per 10,000 People World Bank World Development
Indicators Royalty and License Fees (receipts + payments) as a % of GDP World Bank World Development
Indicators Growth and Competitiveness Manufacturing and Services Exports Average Annual Growth Rate over 10 Years (1994-2004)
World Trade Organization WTO Statistics Database
Total FDI Stock (outward + inward) Average Annual Growth Rate over 10 Years (1993-2003)
UNCTAD World Investment Report 2004 (Annex Table B3 and B4)
Stock Market Capitalization as a % of GDP World Bank World Development Indicators
Nature of Competitive Advantage [Competitiveness of your country’s companies in international markets is primarily due to [1=low cost labor or local natural resources, 7=unique products and processes)]
World Economic Forum Global Competitiveness Report 2004-2005 (Variable 9.01)

The Power of Access OPPORTUNITIES FOR BUSINESS
FedEx Corporation SRI International
28
Potential Impacts of Access on Business Access
Opportunities Index™ – Business
Innovation Supply Chain Strength
Growth and Competitiveness Market Reach Access
Index™
Country Score Rank Score Rank Score Rank Score Rank Score Rank Score Rank Germany 80.2 1 85.5 6 83.3 2 62.9 24 89.4 2 82.1 7 Netherlands 77.4 2 81.4 10 78.0 8 66.0 13 84.1 5 83.1 5 Singapore 77.3 3 79.7 11 80.2 5 62.8 25 86.7 3 89.1 2 Sweden 76.3 4 94.3 1 67.0 19 70.0 6 74.0 12 81.9 8 Finland 76.3 5 91.9 2 69.7 16 75.8 1 67.8 21 82.6 6 South Korea 76.1 6 78.9 13 78.7 7 72.8 3 73.9 13 66.9 22 Belgium 74.8 7 78.7 14 66.5 20 67.6 9 86.3 4 74.9 11 United States 74.5 8 85.2 7 84.5 1 57.9 29 70.4 18 74.8 12 Switzerland 74.1 9 91.5 3 72.1 12 62.3 26 70.6 17 84.2 4 United Kingdom 73.7 10 84.2 8 71.4 13 66.2 12 72.9 15 80.5 9 Austria 73.2 11 77.5 17 73.2 10 63.5 22 78.5 8 74.3 14 Hong Kong 72.3 12 58.8 28 81.9 3 55.8 33 92.9 1 91.1 1 Taiwan 71.7 13 77.7 15 81.0 4 49.6 45 78.5 7 68.3 21 Ireland 71.4 14 78.9 12 52.8 31 72.4 4 81.6 6 64.7 23 Denmark 70.7 15 88.5 4 67.0 18 69.0 7 58.2 31 85.3 3 France 69.3 16 77.6 16 72.9 11 52.6 39 73.9 14 79.0 10 Japan 69.0 17 86.2 5 79.1 6 45.4 50 65.4 25 69.7 19 Canada 66.1 18 76.4 18 63.0 24 54.2 34 70.6 16 74.6 13 Israel 65.7 19 83.6 9 67.2 17 73.7 2 38.2 49 69.1 20 Malaysia 63.9 20 55.1 33 70.2 15 61.6 27 68.9 19 55.3 33 Iceland 63.3 21 56.8 29 74.2 9 72.2 5 49.9 44 72.4 17 China 63.1 22 56.1 32 64.9 21 67.3 10 64.0 26 37.6 52 Spain 62.6 23 68.9 19 63.7 23 64.1 21 53.9 36 64.0 25 Estonia 60.7 24 63.5 24 51.2 36 68.4 8 59.7 29 63.0 26 Czech Republic 59.9 25 61.3 26 43.3 50 66.2 11 68.8 20 59.9 30 New Zealand 59.1 26 68.2 20 64.2 22 37.8 59 66.1 24 73.7 16 Australia 58.9 27 65.9 22 53.3 30 49.5 46 66.7 23 69.8 18 Chile 58.8 28 43.3 43 58.9 27 66.0 14 67.1 22 57.4 32 South Africa 56.8 29 47.0 42 59.4 26 43.7 53 77.1 9 44.3 38

The Power of Access OPPORTUNITIES FOR BUSINESS
FedEx Corporation SRI International
29
Potential Impacts of Access on Business Access
Opportunities Index™ – Business
Innovation Supply Chain Strength
Growth and Competitiveness Market Reach Access
Index™
Country Score Rank Score Rank Score Rank Score Rank Score Rank Score Rank Hungary 56.2 30 59.5 27 45.1 46 64.5 18 55.7 34 45.8 36 Slovak Republic 56.0 31 56.6 30 38.8 56 52.9 36 75.8 10 60.3 29 Italy 55.9 32 62.2 25 62.6 25 45.3 51 53.6 37 61.9 28 Lithuania 55.6 33 52.0 34 49.2 40 65.7 15 55.4 35 50.9 35 Thailand 55.5 34 50.0 36 49.1 41 47.6 48 75.6 11 44.4 37 Norway 53.0 35 67.3 21 51.7 35 56.7 31 36.4 53 74.0 15 Slovenia 52.5 36 64.2 23 37.9 57 57.4 30 50.7 42 59.8 31 India 51.9 37 38.2 49 52.7 32 64.8 16 51.9 40 34.9 59 Poland 51.2 38 48.1 41 41.2 51 64.4 19 51.2 41 41.8 40 Mexico 50.9 39 40.0 46 52.0 34 52.4 40 59.1 30 40.4 45 Russia 50.8 40 51.3 35 35.0 61 64.2 20 52.7 38 40.3 46 Brazil 50.1 41 49.8 37 53.4 29 41.2 54 56.1 33 39.9 47 Jordan 48.7 42 32.9 53 49.3 39 56.4 32 56.3 32 40.4 44 Costa Rica 47.6 43 56.5 31 39.7 55 43.9 52 50.1 43 35.7 57 Ukraine 46.4 44 48.7 38 39.9 53 51.3 42 45.8 45 37.2 53 Turkey 45.3 45 35.8 51 47.4 44 37.3 60 60.9 27 43.4 39 Portugal 45.3 46 48.6 39 44.8 47 46.1 49 41.6 48 64.5 24 Trinidad and Tobago 43.1 47 32.5 55 52.4 33 52.7 38 34.8 55 36.0 55
Vietnam 42.9 48 41.4 44 37.6 58 64.6 17 28.0 62 18.3 73 Mauritius 42.4 49 28.1 60 70.9 14 39.0 56 31.5 58 41.5 41 Greece 42.2 50 41.3 45 37.3 59 52.9 37 37.1 52 62.9 27 Indonesia 40.8 51 33.1 52 39.8 54 30.1 67 60.4 28 33.7 60 Philippines 40.7 52 36.9 50 35.5 60 38.1 58 52.4 39 27.4 65 Jamaica 40.0 53 30.4 58 55.2 28 51.6 41 22.8 65 38.5 49 Latvia 38.5 54 48.4 40 21.6 65 50.8 43 33.2 56 51.2 34 Romania 38.1 55 38.8 47 18.1 68 60.2 28 35.4 54 37.2 54 Colombia 37.5 56 31.6 56 43.3 49 37.0 61 38.1 50 32.7 61 Sri Lanka 35.9 57 24.3 63 51.1 37 24.6 72 43.5 46 35.9 56

The Power of Access OPPORTUNITIES FOR BUSINESS
FedEx Corporation SRI International
30
Potential Impacts of Access on Business Access
Opportunities Index™ – Business
Innovation Supply Chain Strength
Growth and Competitiveness Market Reach Access
Index™
Country Score Rank Score Rank Score Rank Score Rank Score Rank Score Rank Egypt 33.8 58 31.4 57 49.5 38 31.8 65 22.4 67 35.7 58 Bulgaria 33.4 59 38.5 48 9.1 73 48.2 47 37.7 51 37.6 51 El Salvador 32.8 60 18.6 69 22.6 64 63.3 23 26.6 63 39.3 48 Peru 31.5 61 14.1 71 43.5 48 54.0 35 14.5 70 31.1 64 Panama 31.4 62 29.4 59 48.9 43 36.5 62 10.6 73 37.8 50 Nigeria 30.7 63 21.8 65 18.7 67 40.5 55 42.0 47 17.3 74 Argentina 28.7 64 32.7 54 22.8 63 28.5 68 30.8 60 41.0 43 Honduras 26.6 65 11.1 73 33.7 62 30.3 66 31.2 59 23.2 69 Bangladesh 26.2 66 6.9 75 46.2 45 38.7 57 12.9 72 14.4 75 Bolivia 25.6 67 12.6 72 40.0 52 35.4 63 14.3 71 26.3 66 Uruguay 24.8 68 22.8 64 48.9 42 4.8 75 22.7 66 41.4 42 Zimbabwe 23.8 69 26.3 62 14.3 70 35.1 64 19.3 68 23.5 67 Nicaragua 23.4 70 8.5 74 5.4 74 50.3 44 29.3 61 18.5 72 Dominican Republic 20.6 71 26.5 61 20.6 66 25.8 71 9.6 74 31.1 63 Ecuador 20.6 72 19.6 68 11.2 72 25.9 70 25.5 64 20.8 71 Venezuela 17.8 73 20.9 67 13.8 71 27.2 69 9.4 75 31.3 62 Paraguay 16.3 74 21.7 66 3.0 75 8.8 74 31.8 57 23.2 68 Guatemala 16.0 75 14.8 70 14.5 69 16.7 73 18.0 69 21.5 70

How Greater Access Is Changing the World:
Opportunities for Nations


The Power of Access OPPORTUNITIES FOR NATIONS
Executive Overview
FedEx Corporation SRI International i
Introduction Access is critically important to nations. Nations thrive or stagnate depending on their level of access to inputs (i.e., raw materials, machinery, and components, technology, finance, etc.) that supply their economies, as well as their level of access to markets for the goods and services they produce. This report is the fourth of a series that explores the nature, opportunities, and benefits generated by access, based on research and analysis conducted by SRI International and commissioned by FedEx Corporation. This report concentrates on nations as one of the three key beneficiaries of access, and it examines the opportunities that access provides for nations to improve their performance and future prospects. The Model for Opportunities for Nations The effects of access on nations are derived from an increased ability to participate in the global marketplace, choose among inputs and thereby develop and enhance their economies efficiently, and improve their overall standard of living through erosion of artificial barriers and constraints to efficiency gains. To analyze and measure the varied opportunities that access provides to nations, the research team segmented the opportunities into four components, summarized below.
Components of Opportunities for
Nations Relationship to Access
Broader Markets
The ability of a nation’s industries to specialize and expand depends on the breadth of the markets they serve. The ability to obtain inputs and sell outputs on a global basis enables nations to take advantage of efficiency and scale. This component explores the benefits of market reach on national economic performance and prospects.
Global Connection
In the past, the world experienced few or no contacts among communities and nations; today, contacts are becoming instantaneous and ubiquitous. The presence of a seamless network of global “connectivity” for both physical and digital objects promises to usher in fundamental changes in economic and social structures. This component examines opportunities for global connection that access creates.
National and International Cohesion
Access to opportunities to participate, choose, and improve provides a means for the disadvantaged (i.e., people, regions within nations, and nations themselves) to improve their lot. Empowerment through greater access does not guarantee success, nor does it assure heightened harmony among previously distinct groups, but experience to date suggests that it is the best possible approach. This component examines how access contributes to national and international cohesion.

The Power of Access OPPORTUNITIES FOR NATIONS
Executive Overview
FedEx Corporation SRI International ii
Components of Opportunities for
Nations Relationship to Access
Growth and Prosperity
All nations seek to raise their level of output in order to support higher incomes and better standards of living. Countries that engage actively in international trade and investment achieve much higher growth rates than those which do not. Under this component, the SRI team focuses on how global access generates accelerated growth and prosperity.
Measuring Opportunities for Nations – the Access Opportunities Index™ – Nations In order to capture the aggregate opportunities that access provides to nations around the world, SRI International constructed an Access Opportunities Index™ – Nations for 75 major markets using 18 variables that cover Broader Markets, Global Connection, National and International Cohesion, and Growth and Prosperity. The Access Opportunities Index™ – Nations illustrates the relationship between the degree of access available at the national level, as measured by the Access Index™,32 and the benefits that nations enjoy as a result of access. Key Findings from the Access Opportunities Index™ – Nations 1. Nations derive considerable positive benefits from access. 2. Levels of access play a major role in international trade and financial flows. 3. The political climate and policies of national governments have a major impact on
how much their nations benefit from access.
32 The Access Index™, developed for FedEx by SRI International, provides insights into the power and importance of access at the national level. This index incorporates 22 different variables covering physical access (with trade and transport subcategories) and information access (including subcategories for telecommunications and news/media/information services). Details about the Access Index™ can be found in the companion report The Power of Access.

The Power of Access OPPORTUNITIES FOR NATIONS
FedEx Corporation SRI International iii
CONTENTS
Introduction The Model for Opportunities for Nations
Broader Markets Global Connection National and International Cohesion Growth and Prosperity
Measuring Opportunities for Nations
The Access Opportunities Index™ – Nations Key Findings
Appendix: Methodology and Rankings for the Access Opportunities Index™ – Nations
1
2 3 6 9
13
16 16 19
24
The Power of Access OPPORTUNITIES FOR NATIONS
FedEx Corporation SRI International 1
Introduction Access is critically important to nations.33 Nations thrive or stagnate depending on their level of access to inputs (i.e., raw materials, machinery and components, technology, finance, etc.) that supply their economies, as well as their level of access to markets for the goods and services they produce. The value of access is demonstrated by the fact that many of the most important trends and events in history – exploration, colonization, invasions, etc. – have been driven largely by nations’ continuous quest for access. Fortunately, nations’ access is now provided primarily by economic, diplomatic, and technological processes. Nations are geographic aggregations of people and businesses, all of which require access to physical things and information in order to function, compete, and create value. Access has served nations well, and is now acting to erode national “economic” borders. Access not only affects the performance of individual nations, but also serves as the driving force behind globalization, which is revolutionizing the way in which businesses and nations interact and organize their economic activities. By collapsing space and time and by increasing available information, access is both the catalyst for and driver of the rapidly accelerating integration of the global economy. For the first time in history, all nations – including underdeveloped regions – have the prospect of being able to participate in productive activities that engage any or all countries around the world. This, in turn, offers the possibility of materially reducing or even eliminating global poverty. This report is the fourth of a series that explores the nature, opportunities, and benefits generated by access, based on research and analysis conducted by SRI International and commissioned by the FedEx Corporation. The first of the series, The Power of Access, introduced and systematically constructed the logic of access, building on the following foundational concepts:
Functional components of access – time, space, and information; Beneficiaries of access – people, businesses, and nations; Opportunities generated by access – to participate, choose, and improve.
The second report focused on people as a beneficiary of access and detailed the tangible opportunities access provides with respect to people’s everyday choices, actions, behavior, and overall way of life. The third report showed how
33 In this series of reports, the terms “nation” and “country” are used to describe economies that are generally recognized by international organizations as operating autonomously. As used in these reports, neither term is meant to imply sovereignty or independence of any particular economy included in the reports.

The Power of Access OPPORTUNITIES FOR NATIONS
FedEx Corporation SRI International 2
businesses depend on access to achieve innovation, supply chain efficiency, and growth and competitiveness. It stressed the need for almost perfect access along an increasingly seamless global supply chain and distribution network. This report concentrates on nations as one of the three key beneficiaries of access, and it examines the opportunities that access provides for nations to improve their performance and future prospects. The Model for Opportunities for Nations
Access enables nations to enter broader markets, gain global connections, attain national and international cohesion, and
achieve growth and prosperity.
As for people and businesses, the effects of access on nations are derived from an increased ability to participate, choose, and improve. Increased access allows nations to participate in the global marketplace. Greater access to inputs allows nations to develop and enhance their economies efficiently. A major consequence of higher levels of access among nations is the erosion of artificial barriers that have constrained efficiency gains and the resulting improvements in standards of living throughout the world. In order to analyze and measure the potential impacts of access on nations, the research team segmented the opportunities into four components: broader markets, global connection, national and international cohesion, and growth and prosperity.
Components of Opportunities for
Nations Description of Components
Broader Markets
The ability of a nation’s industries to specialize and expand depends on the breadth of the markets they serve. The ability to obtain inputs and sell outputs on a global basis enables nations to take advantage of efficiency and scale. This component explores the benefits of market reach on national economic performance and prospects.
Global Connection
The world has evolved from a situation of almost no contacts among communities and nations, to the current circumstance in which contacts are becoming instantaneous and ubiquitous. The presence of a seamless network of global “connectivity” for both physical and digital objects promises to usher in fundamental changes in economic and social

The Power of Access OPPORTUNITIES FOR NATIONS
FedEx Corporation SRI International 3
Components of Opportunities for
Nations Description of Components
structures. This component examines opportunities for global connection that access creates.
National and International Cohesion
Access to opportunities to participate, choose, and improve provides a means for the disadvantaged (i.e., people, regions within nations, and nations themselves) to improve their lot. Empowerment through greater access does not guarantee success, but experience to date suggests that it is the best possible approach. Under this component, the SRI team examines how greater access contributes to national and international cohesion.
Growth and Prosperity
All nations seek to raise their level of output in order to support higher incomes and better standards of living. Countries that engage actively in international trade and investment achieve much higher growth rates than those that do not. This component focuses on how global access generates accelerated growth and prosperity.
Broader Markets
Access enables a nation’s people and industries to buy from, sell to, and invest in broader markets.
Access allows nations and their people and businesses to trade and
invest around the world. The growth in trade and investment has led to lower prices (lower inflation) and increased choices for consumers and businesses, and has enabled companies to source from and sell to wider markets, even beyond national borders.
Trade is expanding at twice the rate of output. A growing share of global
output is traded among nations. Since 1960, the global economy has grown at an average 3.6 percent annually. Meanwhile, international trade has grown at 6.1 percent annually. Exports as a share of global GDP have grown from 9.0 percent in 1960 to 25.0 percent in 2003. In other words, an increasing portion of what we consume is sourced from abroad (see chart below). Conversely, an increasing portion of what we earn is generated from sales overseas. In the not so distant past, trade almost exclusively meant the trade of physical goods. Today there is a growing international trade in

The Power of Access OPPORTUNITIES FOR NATIONS
FedEx Corporation SRI International 4
services, where annual U.S. exports have grown by almost $25 billion since 1989.
Increased access has fueled global financial integration. For industrial
economies, average external assets and liabilities have about tripled between 1990 and 2003.34 From foreign direct investment to portfolio flows, these accelerating international financial flows enable markets to spread risks more broadly, allow entrepreneurs to tap into additional sources of capital, and represent the interconnectedness of today’s global economy.
34 IMF, World Economic Outlook 2005, p. 110.
Trade is a Growing Component of the Global Economy(Index of global GDP and exports in 2000 US$; 1980=100)
0
50
100
150
200
250
300
350
400
1960 1970 1980 1990 2000
GDP (Index; 1980=100)
Exports (Index; 1980=100)
Source: World Bank, World Development Indicators 2005.
2000
US$
; 198
0=10
0

The Power of Access OPPORTUNITIES FOR NATIONS
FedEx Corporation SRI International 5
A truly global market provides substantial market “niches.” The global
population is now in excess of 6.1 billion individuals. Every one of these people has unique desires and aspirations for how they would like to live their lives – from different housing preferences, tastes in foods and music, and entertainment choices, to different hobbies and intellectual curiosities, etc. This diversity creates demand for an enormous array of goods and services and a vast range of niches to suit different tastes, styles, and resources. While some suggest that global markets are a homogenizing force, the existence of many unique market niches reflects and is sustained by the existence of dense access networks around the world. For example, blues music is said to be dying in its homeland of the United States, but blues recordings and artists sell strongly in Europe and throughout the rest of the world. Without access to the broader world market, many more blues performers and listeners may have been forced to give up their music.
Trends in Financial Integration(Average national external assets and liabilities as percentage of GDP, 1970-2003)
0%
50%
100%
150%
200%
250%
1970 1975 1980 1985 1990 1995 2000
Assets
Liabilities
Source: IMF
Industrial Countries
Emerging Market Countries

The Power of Access OPPORTUNITIES FOR NATIONS
FedEx Corporation SRI International 6
Global Connection
Increasing access accelerates travel, international economic transactions, and real-time communication and exchange of ideas,
leading to an unprecedented level of global connection.
Access to information on a global basis is transforming most human activities. Information is now available throughout the planet, and enormous amounts of new “content” are being added daily – news, facts, and opinions, shopping opportunities, research resources, etc. Technology advances have provided people with low-cost and instantaneous communication across borders and regions through inexpensive international calls, email, websites, chat rooms, blogs, etc. Consequently, almost everything we do in our personal or professional lives is now affected by this ubiquitous access, from the most mundane acts of checking the weather and looking up driving directions to all forms of business and personal communications, purchases, networking, research, dissemination of information and knowledge, and even political campaigns and social mobilization efforts.
Increasing Global Access to Telecommunications
1991 2003 Main telephone lines (millions) 546 1,210 Mobile cellular subscribers (millions) 16 1,329 International telephone traffic minutes (billions) 38 140 Personal computers (millions) 130 650 Internet users (millions) 4.4 665 Source: International Telecommunication Union.
Increased physical access facilitates migration and international travel,
bringing people from all nations closer together. Increase in physical access not only applies to movement of goods across borders, but also to people. In 2000, 174 million people migrated from one nation to another. Rising incomes, increasing flight options to more destinations, and the desire of people to connect with friends and family and to see the world have all fueled a global travel boom. Between 1995 and 2003, international travel grew by 27 percent, and much of that growth has come from travel to nontraditional destinations.35 Tourism to China, Brazil, and countries in the Middle East and Africa has increased at a particularly fast rate. Tourism from developing countries has also increased dramatically. For example, in 2003
35 It should be noted the growth in international travel would have been at an even higher rate had the events of September 11, 2001 not taken place.

The Power of Access OPPORTUNITIES FOR NATIONS
FedEx Corporation SRI International 7
more than 20 million people from China took a tourism trip outside the country, up from 4.5 million in 1995.
Connections between nations create the means for the development of
cross-border affinities that engender improved relationships. The attribute of being “foreign” generally also carries with it a certain degree of misunderstanding or mistrust. Nations with fewer external connections tend to view each other as more foreign. An example of this would be the relationship between western nations and Soviet bloc nations during the Cold War. Growing connections – trade, financial flows, personal relationships, travel, etc. – provide the basis for mutual understanding and affinity and help to improve international relations.
Increasing access to physical objects is creating a unified global economy. Unlike any other period in time, people and businesses are able to “shop the world,” in that they can obtain products from almost every place on the planet. Traditionally, international trade had been carried out exclusively as a B2B activity. With the proliferation of online shopping and trading portals such as eBay, supported by access services companies such as FedEx, physical objects are increasingly traded across borders on both the B2C and C2C levels. Increased direct connection among people and businesses, both within and across nations, is creating a unified global economy and transforming the roles of nations in the supply chain.
International Tourism Arrivals 1995-2003
0
10,000
20,000
30,000
40,000
50,000
60,000
70,000
80,000
Europe & CentralAsia
Latin America &the Caribbean
Middle East &Africa
USA China
Thou
sand
s
1995
2003
Source: World Bank

The Power of Access OPPORTUNITIES FOR NATIONS
FedEx Corporation SRI International 8
Increased access helps integrate emerging economies into the
international network of scientific discovery and innovation. Increased cross-border investment in R&D facilities and technology alliances has resulted in an expansion in international collaboration in science and engineering between advanced economies and developing economies. One important indicator of this trend is the growing number of internationally co-authored scientific publications from both developed and developing countries within the past ten years (see chart below). This broadened international collaboration allows advanced economies to tap into scientific talent in emerging markets, while facilitating the science and engineering communities in key emerging markets to participate, contribute, and benefit from the results of the latest scientific discoveries and innovations.
Breadth of International Collaboration inScience and Engineering
0
20
40
60
80
100
120
140
160
180
United Stat
es
France
United K
ingdom
German
y
Netherl
ands
ChinaBraz
ilIndia
South Afri
ca
Mexico
Num
ber o
f Col
labo
ratin
g C
ount
ry P
artn
ers
for S
&E
Publ
icat
ions
1994 2001
Source: National Science Board, S&E Indicators 2004, Table 5-22

The Power of Access OPPORTUNITIES FOR NATIONS
FedEx Corporation SRI International 9
National and International Cohesion
Access serves as the backbone system for building and sustaining cohesiveness within and among nations.
Access allows countries to open up their frontiers. The American frontier
was opened by advances in access provided by expanding and evolving physical infrastructure (e.g., roads, canals, railroads, etc.) and information infrastructure (e.g., post offices, Pony Express, telegraph, telephone, etc.). The ability to transport people and products quickly and easily between different cities and regions gives a nation the opportunity to occupy and productively engage all regions within its territory. This causal relationship between access and internal national expansion holds true in all countries. The following charts demonstrate how access contributed to the opening of the U.S. frontier. The first chart shows, over time, the increasing number of miles that could be covered in one day, indicating the growth of usable space through access. Using the same data, the second chart indicates the parallel collapsing of time – it shows the decreasing time required for delivery of a physical package from New York to San Francisco. With virtually no access prior to 1820, shipping time fell from six months in the 1840s to only one day in 1973, when FedEx established its express delivery service.
Access Contribution to the Opening of the U.S. Frontier(Distance able to travel in one day from New York City towards San Francisco)
2,91
9.0
729.
8
417.
0
126.
9
97.3
16.0
0
500
1,000
1,500
2,000
2,500
3,000
3,500
1820 1840 1860 1880 1900 1920 1940 1960
Mile
s
Source: SRI International, Global Impacts of FedEx in the New Economy , p. vii.(*) First commercial transcontinental air service.
(*)

The Power of Access OPPORTUNITIES FOR NATIONS
FedEx Corporation SRI International 10
Access integrates different – even distant – regions into a cohesive
national entity. Most nations, and particularly large nations, consist of a set of regions made distinct by their topography, ethnic populations, history, and/or economic activities. Countries that provide high levels of internal access allow these regions to coalesce around a national identity, while still retaining certain unique characteristics. The ability of people to travel easily to different regions, or to gain access to regional cultures, products, and foods, promotes the development of greater understanding and economic interactions.
23 Days
Increasing Access Through Reduced Delivery Time
Delivery Time: New York to San Francisco
1820 No Delivery Possible (No known routes)
1840s 6 MonthsDepending on the season[Via non-organized carriage, wagon]
1847 1 Month
[Ocean route-NYC to Panama, overland Panama, Panama to San Francisco]
1858
[Transcontinental via Butterfield Express stagecoach]
1858 3 Weeks
[Ocean route improved by completion of Panama railroad]
1860 2 Weeks
[Rail between NYC and St. Joseph, Mo., and 10 ½ days between St.Joseph and San Francisco, via Pony Express]
1869 7 Days
[Via transcontinental rail service]
1920 4 Days
[Via first air mail service-letters only, including pickup and delivery time]
1973 Overnight
[Via FedEx overnight, including pickup/delivery time]
<
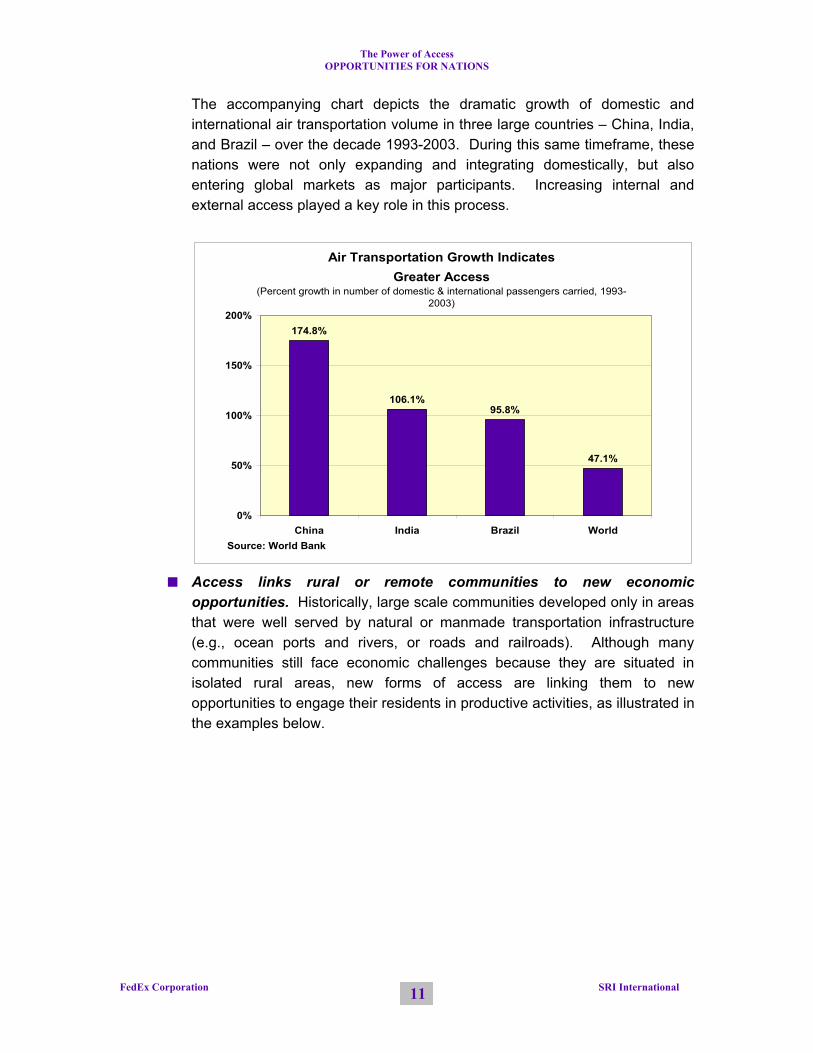
The Power of Access OPPORTUNITIES FOR NATIONS
FedEx Corporation SRI International 11
Air Transportation Growth Indicates Greater Access
(Percent growth in number of domestic & international passengers carried, 1993-2003)
174.8%
106.1%95.8%
47.1%
0%
50%
100%
150%
200%
China India Brazil WorldSource: World Bank
The accompanying chart depicts the dramatic growth of domestic and international air transportation volume in three large countries – China, India, and Brazil – over the decade 1993-2003. During this same timeframe, these nations were not only expanding and integrating domestically, but also entering global markets as major participants. Increasing internal and external access played a key role in this process.
Access links rural or remote communities to new economic opportunities. Historically, large scale communities developed only in areas that were well served by natural or manmade transportation infrastructure (e.g., ocean ports and rivers, or roads and railroads). Although many communities still face economic challenges because they are situated in isolated rural areas, new forms of access are linking them to new opportunities to engage their residents in productive activities, as illustrated in the examples below.

The Power of Access OPPORTUNITIES FOR NATIONS
FedEx Corporation SRI International 12
ACCESS REJUVENATES RURAL COMMUNITIES Fairfield, Iowa has become recognized as one of the nation’s most
entrepreneurial small towns (population 9,600). Residents refer to the town as the “entrepreneurial capital of Iowa” or “Silicon Valley of Iowa.” The community has combined access with the benefits of small town living to attract numerous service sector firms, such as investment research, photography, and software development firms. The city advertises that it is only a few milliseconds from Silicon Valley, London, or New Delhi. Fairfield businesses have created 2,000 new jobs over the past 15 years.
Access to entrepreneurial counseling has helped Turner County, South Dakota to recover from prolonged economic distress. An investment “facilitator” provides confidential advice on business and management plans. Since the program began in 1997, 23 new businesses have started, 10 firms have expanded, and 12 businesses were retained in the community.
The small town of Nevada, Missouri (population 10,000) established community-wide high-speed Internet access through Wi-Fi technology for small and medium sized businesses. Using this access, seven new businesses have opened.
Jadyne and Mike Reichner have used access to develop a successful lavender farm and business in Sequim, Washington. Establishing their organic farm in 1996, Jane’s and Mike’s firm, Purple Haze, now sells more than 50 lavender products through the Internet, catalogs, and more than 2,500 spas and stores across the country. Purple Haze contracts with other firms to produce many products and organizes an annual Lavender Festival that draws more than 35,000 people, thus providing tourism revenues to local shops and farms.
Nations are more closely linked than ever, both physically and
economically, by the access generated through open markets and open skies. As noted elsewhere in this report, nations benefit from the free flow of goods, people, capital, and other economic factors. Trade liberalization has spurred a period of remarkable global growth. Similarly, the achievement of “open skies” increases both access and the gains to be achieved from access. Until the early 1990s, restrictive agreements governed almost all international aviation relationships and there were no open skies agreements. Since that time, many nations around the world have replaced regulation with liberalization, significantly increasing competition and the opportunity for passenger and cargo airlines to expand to new markets and geographic regions.

The Power of Access OPPORTUNITIES FOR NATIONS
FedEx Corporation SRI International 13
In Latin America, for example, countries with new open skies agreements signed by 1998 saw their air traffic grow by an average of 22 percent in that year over the previous year, compared with growth of only three percent in countries that did not sign liberal agreements with the United States.36 Similarly, a study on the economic impacts of full liberalization of integrated express service in Hong Kong, conducted in 1999, concluded that Hong Kong would achieve substantial trade, employment, investment, and technology transfer benefits.37
Growth and Prosperity
Access plays a critical role in nations’ economic prosperity. Limited access leads to stagnation over the long run. Expansion of access leads to faster development and
a higher standard of living for all.
Access through freer trade contributes directly to higher levels of economic growth. Theoretical and quantitative research confirms that nations that extend greater access to their markets achieve higher rates of growth. Access enables greater interaction within and among markets. The positive effect of expanding access on economic prosperity of nations holds true for both developed and developing countries. Countries are forced to become more competitive, and in doing so, attain higher levels of efficiency. The following chart indicates the positive relationship between free trade access and growth. The freedom to trade index scores38 for the top 20 countries are nearly double those of the bottom 20 countries (8.6 versus 4.6). The average growth in GDP per capita for the most open economies over the decade 1993-2003 was over four times as great as that for the most restricted nations (30% versus 7.3%). Access generated through liberalized trade clearly contributes to higher rates of growth.
36 Jennifer Michels, “Open Skies Agreements Bringing Global Dollars Home,” Trade Compass Gateway, September, 2000. 37 Campbell-Hill Aviation Group Inc., “An Analysis of Economic Benefits from Full Liberation of Integrated Express Service in the Hong Kong Special Administrative Region,” February, 1999. 38 Average scores of the top 20 and bottom 20 countries, Freedom to Trade Internationally index, Fraser Institute, Economic Freedom of the World 2005.
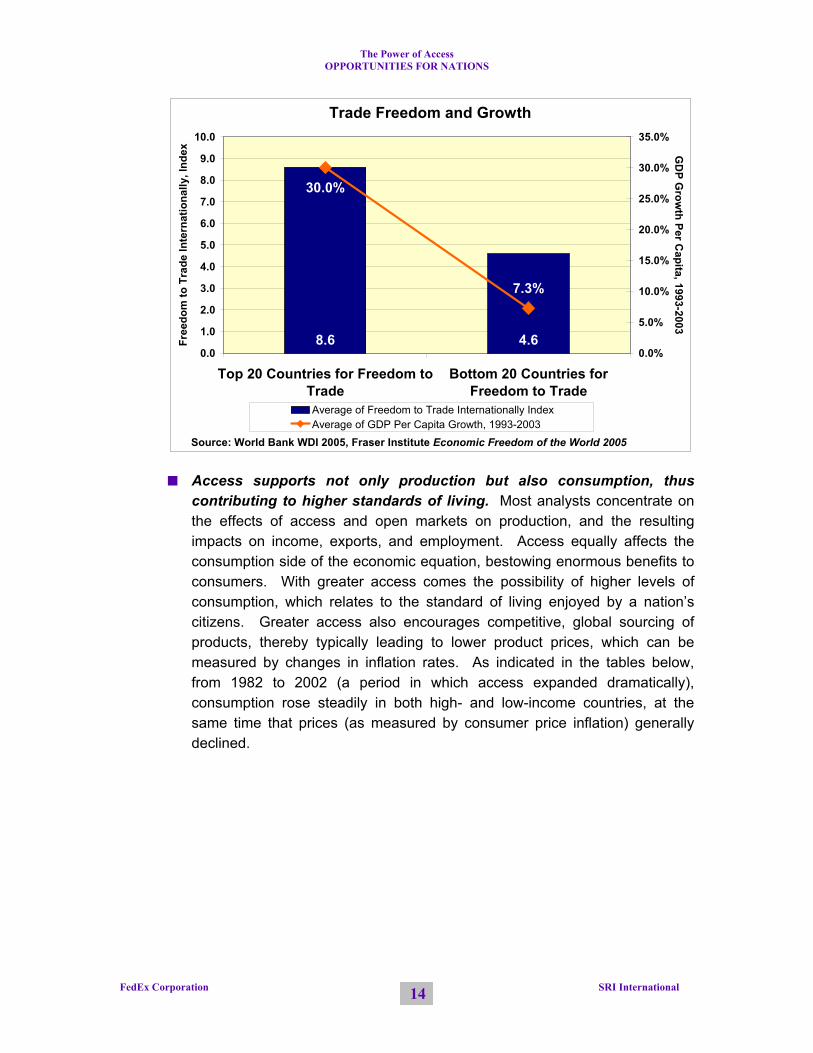
The Power of Access OPPORTUNITIES FOR NATIONS
FedEx Corporation SRI International 14
Access supports not only production but also consumption, thus
contributing to higher standards of living. Most analysts concentrate on the effects of access and open markets on production, and the resulting impacts on income, exports, and employment. Access equally affects the consumption side of the economic equation, bestowing enormous benefits to consumers. With greater access comes the possibility of higher levels of consumption, which relates to the standard of living enjoyed by a nation’s citizens. Greater access also encourages competitive, global sourcing of products, thereby typically leading to lower product prices, which can be measured by changes in inflation rates. As indicated in the tables below, from 1982 to 2002 (a period in which access expanded dramatically), consumption rose steadily in both high- and low-income countries, at the same time that prices (as measured by consumer price inflation) generally declined.
Trade Freedom and Growth
8.6 4.6
30.0%
7.3%
0.0
1.0
2.0
3.0
4.0
5.0
6.0
7.0
8.0
9.0
10.0
Top 20 Countries for Freedom toTrade
Bottom 20 Countries forFreedom to Trade
Free
dom
to T
rade
Inte
rnat
iona
lly, I
ndex
0.0%
5.0%
10.0%
15.0%
20.0%
25.0%
30.0%
35.0%G
DP G
rowth Per C
apita, 1993-2003
Average of Freedom to Trade Internationally IndexAverage of GDP Per Capita Growth, 1993-2003
Source: World Bank WDI 2005, Fraser Institute Economic Freedom of the World 2005

The Power of Access OPPORTUNITIES FOR NATIONS
FedEx Corporation SRI International 15
Opening Up of India's Economy
$0
$50
$100
$150
$200
$250
$300
$350
$400
$450
$500
1980 1983 1986 1989 1992 1995 1998 2001
GD
P pe
r cap
ita in
200
0 U
S$
0%
5%
10%
15%
20%
25%
30%
Trade as a % of G
DP
GDP per capita Trade
Liberalization begins
Source: World Bank WDI 2005, SRI International
Pre-liberalization Post-liberalization
1980-1986 (6 years)-Trade as % of GDP: -18.8% growth-GDP per capita: 19.8% growth
1995-2001 (6 years)-Trade as % of GDP: 21.7% growth-GDP per capita: 25.6% growth
Countries that deny or restrict access harm their performance and
prospects. Economic theory, quantitative evidence, and actual experience amply demonstrate that efforts to restrict access ultimately are self-defeating. Countries that restrict either inward or outward access through tariffs, quotas, export duties, or other trade barriers stagnate over the long run. For example, India had a closed economy until the early 1990s, with trade as a percentage of the country’s GDP declining for two decades. With a limited flow of foreign direct investment and negligible exports, India was on the verge of a balance-of-payments crisis. However, with the liberalization of the Indian economy beginning in 1991, India opened its markets to global competition. Exports have since expanded greatly, and India has become a preferred destination for foreign direct investment. India’s GDP and GDP per capita have also steadily increased since the country increased access to its domestic market and foreign markets.
High Income Countries
0
2,000
4,000
6,000
8,000
10,000
12,000
14,000
16,000
18,000
1982 1987 1992 1997 2002
Hou
seho
ld c
onsu
mpt
ion
(per
cap
ita, i
n cu
rren
t US$
)
0%
2%
4%
6%
8%
10%
12%
14%
16%
Consum
er price inflation (annual %
change)
Household Consumption Consumer Price Inflation (Annual %)Source: World Bank, World Development Indicators, 2005 , calculations by SRI International
Low Income Countries
0
50
100
150
200
250
300
1982 1987 1992 1997 2002
Hou
seho
ld c
onsu
mpt
ion
(per
cap
ita, i
n U
S$)
0%
5%
10%
15%
20%
25%
30%
35%
40%
45%
50%
Consum
er price inflation (annual %
change)
Household Consumption Consumer Price Inflation (Annual %)Source: World Bank, World Development Indicators, 2005 , calculations by SRI International

The Power of Access OPPORTUNITIES FOR NATIONS
FedEx Corporation SRI International 16
The inevitability of rising global access is compelling. Within many if not
all nations, important constituencies question or resist the rise in international access and open markets. These groups harbor legitimate concerns, most of which are based on their desire to maintain their positions in the status quo. But as Thomas Friedman39 and others have written convincingly about the inevitability of globalization, the same holds for access, for the simple fact that people worldwide will continue to demand greater access. As with individuals and businesses, nations need to acknowledge that organizational structures and modes of operation must change to accommodate the ever-evolving nature of the global economy. They must reckon with and hopefully master a number of realities, including globalization, outsourcing, continuous technological transformation within all industries, and the rapid global product cycle.
Measuring Opportunities for Nations
The Access Opportunities Index™ – Nations In order to capture and measure the aggregate opportunities that access provides to nations around the world, SRI International constructed an Access Opportunities Index™ – Nations for 75 major markets using 18 variables that cover the four components of opportunities for nations.
Broader Markets indicators measure the benefits of access on national-level trade (imports and exports) and capital flows (direct investment and portfolio investment). Broader markets not only create export and investment opportunities for a nation’s businesses, but also create more options for its citizens to buy goods and services from around the world.
Global Connection indicators reflect how nations are connected by the physical movement of people through international travel, as well as the participation of nations in international organizations and international treaties.
National and International Cohesion indicators examine the national and international cohesiveness of countries from several aspects: financial risk, government stability, internal and external conflicts, religious and ethnic tensions, and the number of refugees originating from each nation.
39 Thomas Friedman, The Lexus and the Olive Tree: Understanding Globalization, Farrar, Straus and Giroux, New York, 1999.

The Power of Access OPPORTUNITIES FOR NATIONS
FedEx Corporation SRI International 17
Growth and Prosperity indicators are outcome measurements of the
opportunities provided by access with respect to overall economic well-being and growth.
The team selected only those indicators that help to measure certain aspects of the benefits that access has on nations. As in the Access Index™, all of the data were drawn from high-quality and reliable sources that use a uniform methodology for all countries covered. The methodology for compiling the Access Opportunities Index™ – Nations (including a list of the 18 indicators and their sources) and country scores at the component level are presented in the Appendix to this report. The following table displays the Access Opportunities Index™ – Nations rankings of 75 countries and their corresponding Access Index™ rankings.
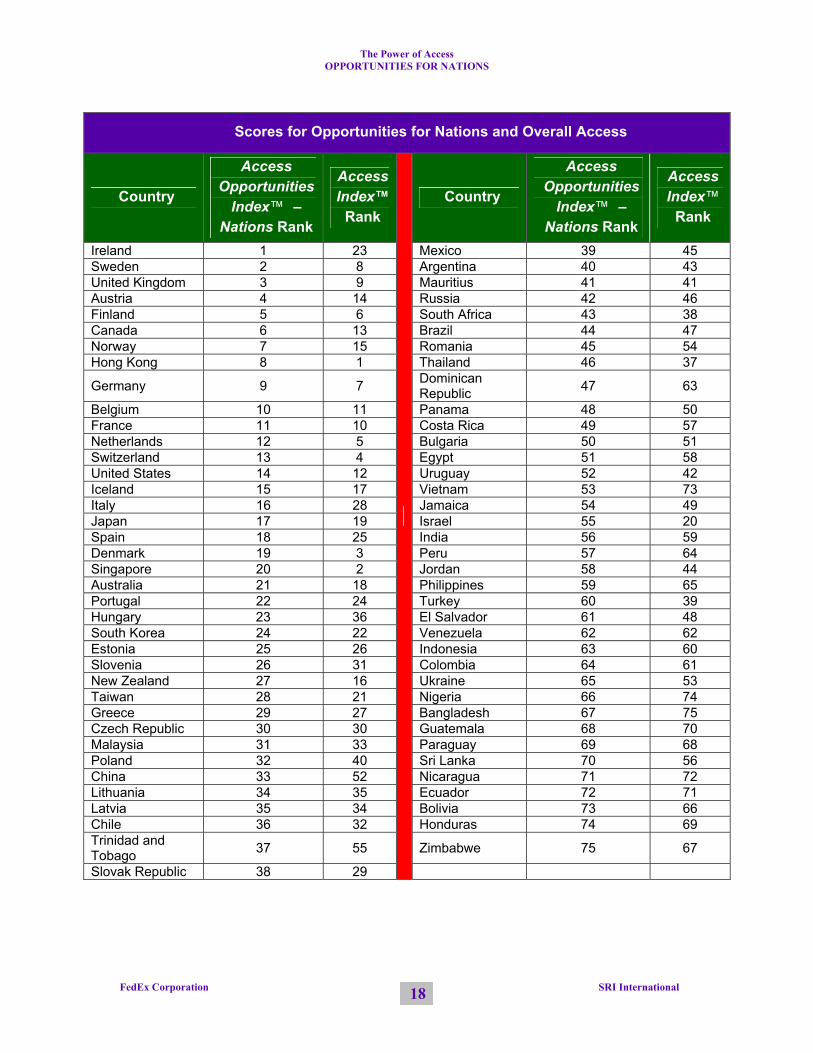
The Power of Access OPPORTUNITIES FOR NATIONS
FedEx Corporation SRI International 18
Scores for Opportunities for Nations and Overall Access
Country
Access Opportunities
Index™ – Nations Rank
Access Index™
Rank Country
Access Opportunities
Index™ – Nations Rank
Access Index™
Rank
Ireland 1 23 Mexico 39 45 Sweden 2 8 Argentina 40 43 United Kingdom 3 9 Mauritius 41 41 Austria 4 14 Russia 42 46 Finland 5 6 South Africa 43 38 Canada 6 13 Brazil 44 47 Norway 7 15 Romania 45 54 Hong Kong 8 1 Thailand 46 37
Germany 9 7 Dominican Republic 47 63
Belgium 10 11 Panama 48 50 France 11 10 Costa Rica 49 57 Netherlands 12 5 Bulgaria 50 51 Switzerland 13 4 Egypt 51 58 United States 14 12 Uruguay 52 42 Iceland 15 17 Vietnam 53 73 Italy 16 28 Jamaica 54 49 Japan 17 19 Israel 55 20 Spain 18 25 India 56 59 Denmark 19 3 Peru 57 64 Singapore 20 2 Jordan 58 44 Australia 21 18 Philippines 59 65 Portugal 22 24 Turkey 60 39 Hungary 23 36 El Salvador 61 48 South Korea 24 22 Venezuela 62 62 Estonia 25 26 Indonesia 63 60 Slovenia 26 31 Colombia 64 61 New Zealand 27 16 Ukraine 65 53 Taiwan 28 21 Nigeria 66 74 Greece 29 27 Bangladesh 67 75 Czech Republic 30 30 Guatemala 68 70 Malaysia 31 33 Paraguay 69 68 Poland 32 40 Sri Lanka 70 56 China 33 52 Nicaragua 71 72 Lithuania 34 35 Ecuador 72 71 Latvia 35 34 Bolivia 73 66 Chile 36 32 Honduras 74 69 Trinidad and Tobago 37 55 Zimbabwe 75 67
Slovak Republic 38 29

The Power of Access OPPORTUNITIES FOR NATIONS
FedEx Corporation SRI International 19
Key Findings
The Access Opportunities Index™ – Nations illustrates the relationship between the degree of access available at the national level, as measured by the Access Index™,40 and the opportunities that nations enjoy as a result of access.
1. Nations derive considerable positive benefits from access. 2. Levels of access play a major role in international trade and financial
flows. 3. The political climate and policies of national governments have a
major impact on how much their nations benefit from access.
1. Nations derive considerable positive benefits from access. With
three exceptions, the countries that rank in the top 25 on the Access Opportunities Index™ – Nations also score in the top 25 on the Access Index™. This consistency in the rankings suggests that access generates positive benefits for nations in the form of broader markets, global connection, national cohesiveness and stability, and growth and prosperity. The chart below indicates that access and opportunities for nations are closely correlated.
40 The Access Index™, developed for FedEx by SRI International, provides insights into the power and importance of access at the national level. This index incorporates 22 different variables covering physical access (with trade and transport subcategories) and information access (including subcategories for telecommunications and news/media/information services). Details about the Access Index™ can be found in the companion report The Power of Access.

The Power of Access OPPORTUNITIES FOR NATIONS
FedEx Corporation SRI International 20
Relationship between Access and Opportunities for Nations
0
10
20
30
40
50
60
70
80
90
100
0 10 20 30 40 50 60 70 80 90 100
Access Index™ Score
Acc
ess
Opp
ortu
nitie
s In
dex™
-- N
atio
ns
Scor
e
2. Levels of access play a major role in international trade and financial flows. Greater access (as measured by the Access Index™) is strongly associated with higher levels of international trade and investment flows. As shown below, country scores on the Access Index™ are positively correlated with country scores in the Broader Markets component of the Access Opportunities Index™ – Nations. The connection between physical access and international trade is obvious – the ability to move goods across borders creates demand for international trade. As discussed in the related report The Power of Access, Opportunities for Business, information access has already become integral to many business transactions today, and this is particularly true for international business transactions. The acceleration of international trade has stimulated international financial transactions in the form of investment and remittances, which in turn create demand by both business and consumers for more access.

The Power of Access OPPORTUNITIES FOR NATIONS
FedEx Corporation SRI International 21
Relationship between Access and Broader Markets
0
10
20
30
40
50
60
70
80
90
100
0 10 20 30 40 50 60 70 80 90 100
Access Index™ Score
Bro
ader
Mar
kets
Sco
re
3. The political climate and policies of national governments have a major impact on how much their nations benefit from access. The scores and rankings of individual countries on the components of the Access Opportunities Index™ – Nations can vary widely, suggesting that nations derive uneven levels of benefits vis-à-vis broader markets, global connection, national and international cohesion, and growth and prosperity. Much of this variation can be attributed to the political climate, government policies, and other unique conditions across countries. For example, the United Kingdom, Germany, United States, and China all rank fairly high in the Broader Markets component because of their pro-trade policies, while their scores in the National and International Cohesion component suffer because of the relatively high risk of external conflicts in those countries. Conversely, some countries, including Singapore, Japan, Norway, and Finland, score very high in National and International Cohesion, but are much weaker in Global Connection, because their governments have chosen to join fewer international organizations or have not signed many of the major international treaties.

The Power of Access OPPORTUNITIES FOR NATIONS
FedEx Corporation SRI International 22
Component Rankings of the Access Opportunities Index™ – Nations:
Selected Countries
Country
Access Opportunities
Index™ – Nations Rank
Broader Markets
Global Connection
National and International
Cohesion
Growth and
Prosperity
Access Index™
Ireland 1 13 16 8 1 23 Sweden 2 15 6 1 20 8 U.K. 3 2 8 29 12 9 Austria 4 16 3 21 25 14 Finland 5 23 19 2 4 6 Canada 6 10 21 11 8 13 Norway 7 25 23 4 3 15 Hong Kong 8 27 2 14 34 1 Germany 9 3 12 28 36 7 United States 14 1 40 40 11 12
Iceland 15 57 1 7 7 17 Japan 17 5 39 3 41 19 Singapore 20 17 48 5 21 2 China 33 8 74 24 29 52

The Power of Access OPPORTUNITIES FOR NATIONS
FedEx Corporation SRI International 23
United States
74.0
48.4
48.2
100.0
0102030405060708090
100Broader Markets
Global Connection
National & InternationalCohesion
Growth & Prosperity
Access Index™Access Opportunities Index™ -- Nations
74.8
Japan
53.9
73.1
48.8
91.4
0102030405060708090
100Broader Markets
Global Connection
National & InternationalCohesion
Growth & Prosperity
Access Index™Access Opportunities Index™ -- Nations
69.7
Singapore
79.5
72.2
39.0
75.6
0102030405060708090
100Broader Markets
Global Connection
National & InternationalCohesion
Growth & Prosperity
Access Index™
Access Opportunities Index™ -- Nations
89.1
China
63.5
54.8
13.3
88.1
0102030405060708090
100Broader Markets
Global Connection
National & InternationalCohesion
Growth & Prosperity
Access Index™
Access Opportunities Index™ -- Nations
37.6

The Power of Access OPPORTUNITIES FOR NATIONS
FedEx Corporation SRI International 24
APPENDIX Methodology and Rankings for the Access Opportunities Index™ – Nations

The Power of Access OPPORTUNITIES FOR NATIONS
FedEx Corporation SRI International 25
Why an Access Opportunities Index™ – Nations? The Access Index™ and the Access Opportunities Index™ – Nations, developed by SRI International, provide insights into the power and importance of access at the national level. There are a host of studies that have quantified, ranked, and compared countries based on their level of globalization, economic freedom, competitiveness, and other factors. However, because the concept of “access” does not fit into traditional ways of thinking about how society advances, few attempts have been made to quantify access or to measure its impacts comprehensively. The Access Index™ and the Access Opportunities Index™ – Nations are similar to a benchmarking exercise. Benchmarking is a powerful analytical tool that uses systematic aggregation of variables to assess and compare countries and regions on a certain factor or a set of factors. Benchmarking countries’ level of access allows for an objective analysis of where one country stands in a competitive global environment, helps to pinpoint areas where access is strong, and identifies areas where access is limited. The Access Index™ seeks to measure the “openness” of countries – that is, the access of a country, its businesses, and its citizens to physical items and information from the outside world – as well as the access that the outside world has to a country, its businesses, and its citizens. The Access Opportunities Index™ – Nations measures the potential impacts of access on the overall welfare of nations. The Access Index™ and the Access Opportunities Index™ – Nations can be used together to conduct comparisons and draw conclusions about the relationship between expanding access and the level of market openness, global connection, national and international cohesion, and growth and prosperity. Methodology for the Access Opportunities Index™ – Nations
Categories of Measurement The opportunities access provides nations come from their increased ability to participate, choose, and improve. In order to analyze and measure the potential impacts of access on nations, the research team segmented those impacts into four components: Broader Markets, Global Connection, National and International Cohesion, and Growth and Prosperity.

The Power of Access OPPORTUNITIES FOR NATIONS
FedEx Corporation SRI International 26
Categories of Measurement for the Access Opportunities Index™ – Nations
Broader Markets: The ability of a nation’s industries to specialize and expand depends on the breadth of the markets they serve. This component measures the potential impacts of access in the form of national level trade (imports and exports) and capital flows (direct investment and portfolio investment).
Global Connection: Indicators in this component examine global connectivity by looking at the physical movement of its citizens (international travel and immigration) and nations’ participation in international organizations and treaties.
National and International Cohesion:These indicators examine the cohesiveness of countries from several aspects: financial risk, government stability, internal and external conflicts, religious and ethnic tensions, and the number of refugees originating from each nation.
Growth and Prosperity: All nations seek to raise their output in order to support higher incomes and better standards of living. This component consists of outcome measurements of the potential impacts of access on overall economic well-being and growth.
Selection of Indicators and Countries The indicators were selected because they either measure or provide a proxy measurement of the potential impacts of access on nations. In each category of the Access Opportunities Index™ – Nations, quantitative indicators were selected and screened based on the following criteria:
The indicator is a reasonable, objective measurement of an aspect of access; The indicator is quantifiable or can be scored based on qualitative/survey
results; The indicator can be drawn from reliable, high-quality data sources; Indicator data are up-to-date (preferably less than 3-4 years old); and Indicator data are available for all, or at least the majority of, the world’s major
economies. A detailed list of the 18 indicators used in the benchmarking analysis is provided at the end of this Appendix. The project team collected comprehensive data for the 18 selected indicators for the same set of 75 countries that was analyzed in the Access Index™. The 75 included countries cover a cross section of the world’s large, medium, and small economies, and cover all geographical regions.
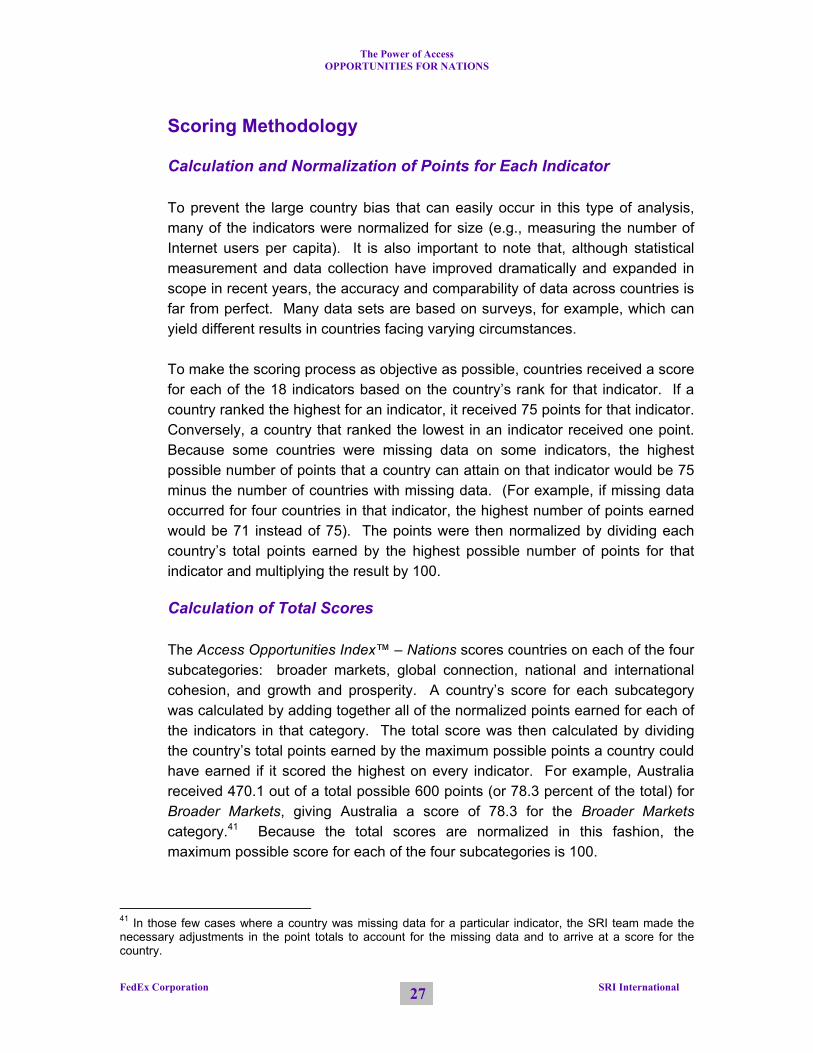
The Power of Access OPPORTUNITIES FOR NATIONS
FedEx Corporation SRI International 27
Scoring Methodology
Calculation and Normalization of Points for Each Indicator To prevent the large country bias that can easily occur in this type of analysis, many of the indicators were normalized for size (e.g., measuring the number of Internet users per capita). It is also important to note that, although statistical measurement and data collection have improved dramatically and expanded in scope in recent years, the accuracy and comparability of data across countries is far from perfect. Many data sets are based on surveys, for example, which can yield different results in countries facing varying circumstances. To make the scoring process as objective as possible, countries received a score for each of the 18 indicators based on the country’s rank for that indicator. If a country ranked the highest for an indicator, it received 75 points for that indicator. Conversely, a country that ranked the lowest in an indicator received one point. Because some countries were missing data on some indicators, the highest possible number of points that a country can attain on that indicator would be 75 minus the number of countries with missing data. (For example, if missing data occurred for four countries in that indicator, the highest number of points earned would be 71 instead of 75). The points were then normalized by dividing each country’s total points earned by the highest possible number of points for that indicator and multiplying the result by 100.
Calculation of Total Scores The Access Opportunities Index™ – Nations scores countries on each of the four subcategories: broader markets, global connection, national and international cohesion, and growth and prosperity. A country’s score for each subcategory was calculated by adding together all of the normalized points earned for each of the indicators in that category. The total score was then calculated by dividing the country’s total points earned by the maximum possible points a country could have earned if it scored the highest on every indicator. For example, Australia received 470.1 out of a total possible 600 points (or 78.3 percent of the total) for Broader Markets, giving Australia a score of 78.3 for the Broader Markets category.41 Because the total scores are normalized in this fashion, the maximum possible score for each of the four subcategories is 100.
41 In those few cases where a country was missing data for a particular indicator, the SRI team made the necessary adjustments in the point totals to account for the missing data and to arrive at a score for the country.

The Power of Access OPPORTUNITIES FOR NATIONS
FedEx Corporation SRI International 28
The scores for the four subcategories were then combined to calculate a single score for each country. This score also was normalized, by dividing a country’s total points by the maximum possible score. For example, Australia received 78.3 points for Broader Markets, 39.1 points for Global Connection, 58.1 points for National and International Cohesion, and 75.9 points for Growth and Prosperity; its combined score is 251.5 points out of a total possible 400 points (or 62.9 percent of the total), giving Australia a score of 62.9 for the Access Opportunities Index™ – Nations. The maximum possible score within the Access Opportunities Index™ – Nations is 100.
Weighting of Scores Depending on one’s perspective on access or the relative importance of different variables, one could assign different weights to each indicator in calculating the points and scores. In this model, all indicators were given equal weight. The different subcategories of the Access Opportunities Index™ – Nations also could be weighted when calculating the overall country score. For the purposes of this analysis, however, SRI chose to assign each subcategory equal weight. Doing so produces a scoring system that evenly addresses the various factors that affect the opportunities provided by access for people in each country.

The Power of Access OPPORTUNITIES FOR NATIONS
FedEx Corporation SRI International 29
List of Indicators and Data Sources for the Access Opportunities Index™ – Nations
Indicators and Data Sources for the Access Opportunities Index™ – Nations
Indicator Source Publication Broader Markets Exports of Goods and Services World Trade Organization WTO Statistics Database Imports of Goods and Services World Trade Organization WTO Statistics Database Foreign Direct Investment Outward Stock UNCTAD World Investment Report 2004
Foreign Direct Investment Inward Stock UNCTAD World Investment Report 2004
Portfolio Investment Outward Stock International Monetary Fund
Balance of Payments Statistics Yearbook 2004
Portfolio Investment Inward Stock International Monetary Fund
Balance of Payments Statistics Yearbook 2004
Global Connection International Tourism Arrivals and Departures Per Capita World Bank World Development Indicators
Membership in International Organizations
A.T. Kearney/Foreign Policy Globalization Index 2004
Number of International Treaties Ratified
A.T. Kearney/Foreign Policy Globalization Index 2004
National and International Cohesion
ICRG Financial Risk Rating PRS Group International Country Risk Guide
ICRG Government Stability Rating PRS Group International Country Risk Guide
ICRG Internal Conflict Risk Rating PRS Group International Country Risk Guide
ICRG External Conflict Risk Rating PRS Group International Country Risk Guide
ICRG Religions Tensions Risk Rating PRS Group International Country Risk
Guide
ICRG Ethnic Tensions Risk Rating PRS Group International Country Risk Guide
Number of Refugees by Country of Origin World Bank World Development Indicators
Growth and Prosperity GDP Per Capita Average Annual Growth Rate (1993-2003) World Bank World Development Indicators
PPP GDP per capita (current intl. $) World Bank World Development Indicators

The Power of Access OPPORTUNITIES FOR NATIONS
FedEx Corporation SRI International 30
Potential Impacts of Access on Nations
Access Opportunities
Index™ – Nations
Broader Markets
Global Connection
National Cohesion and
Stability Growth and Prosperity Access Index™
Country Score Rank Score Rank Score Rank Score Rank Score Rank Score Rank Ireland 79.4 1 79.9 13 69.9 16 68.5 8 99.3 1 64.7 23 Sweden 77.1 2 78.0 15 79.3 6 80.6 1 70.5 20 81.9 8 United Kingdom 75.5 3 97.4 2 77.6 8 53.2 29 73.9 12 80.5 9 Austria 73.7 4 77.7 16 92.5 3 57.9 21 66.6 25 74.3 14 Finland 73.4 5 67.3 23 66.5 19 80.0 2 79.9 4 82.6 6 Canada 72.3 6 86.2 10 63.3 21 62.3 11 77.3 8 74.6 13 Norway 70.4 7 65.1 25 62.5 23 72.5 4 81.3 3 74.0 15 Hong Kong 70.0 8 63.4 27 97.3 2 60.2 14 59.2 34 91.1 1 Germany 69.7 9 97.0 3 71.3 12 53.2 28 57.2 36 82.1 7 Belgium 69.5 10 86.5 9 70.7 14 55.7 23 65.2 27 74.9 11 France 67.8 11 95.1 4 80.9 5 35.4 61 59.9 31 79.0 10 Netherlands 67.8 12 90.5 6 60.2 27 54.0 26 66.6 26 83.1 5 Switzerland 67.8 13 83.5 12 62.2 24 71.4 6 53.9 40 84.2 4 United States 67.7 14 100.0 1 48.2 40 48.4 40 74.0 11 74.8 12 Iceland 67.6 15 23.6 57 98.7 1 70.9 7 77.3 7 72.4 17 Italy 67.5 16 89.6 7 71.7 11 53.0 31 55.8 38 61.9 28 Japan 66.8 17 91.4 5 48.8 39 73.1 3 53.9 41 69.7 19 Spain 66.2 18 85.9 11 67.5 18 41.5 52 69.8 23 64.0 25 Denmark 66.1 19 71.6 20 63.1 22 57.5 22 72.0 18 85.3 3 Singapore 64.3 20 75.6 17 39.0 48 72.2 5 70.5 21 89.1 2 Australia 62.9 21 78.3 14 39.1 47 58.1 20 75.9 9 69.8 18 Portugal 62.5 22 64.5 26 70.8 13 58.4 18 56.4 37 64.5 24 Hungary 61.5 23 49.0 40 78.4 7 47.6 43 71.1 19 45.8 36 South Korea 60.1 24 72.5 18 30.4 55 59.8 16 77.8 6 66.9 22 Estonia 59.4 25 27.0 53 90.7 4 41.7 51 78.4 5 63.0 26 Slovenia 58.5 26 26.5 54 65.4 20 66.8 9 75.1 10 59.8 31

The Power of Access OPPORTUNITIES FOR NATIONS
FedEx Corporation SRI International 31
Potential Impacts of Access on Nations
Access Opportunities
Index™ – Nations
Broader Markets
Global Connection
National Cohesion and
Stability Growth and Prosperity Access Index™
Country Score Rank Score Rank Score Rank Score Rank Score Rank Score Rank New Zealand 57.8 27 52.8 35 52.4 36 63.7 10 62.5 30 73.7 16 Taiwan 57.8 28 72.2 19 27.0 61 48.0 42 84.0 2 68.3 21 Greece 57.8 29 56.6 29 58.9 29 45.1 45 70.5 22 62.9 27 Czech Republic 56.1 30 51.1 38 70.6 15 43.1 50 59.8 32 59.9 30 Malaysia 56.0 31 58.7 28 52.0 37 53.5 27 59.6 33 55.3 33 Poland 55.3 32 54.7 32 58.5 31 34.2 62 73.7 13 41.8 40 China 54.9 33 88.1 8 13.3 74 54.8 24 63.5 29 37.6 52 Lithuania 54.2 34 19.8 60 76.0 9 48.5 39 72.4 17 50.9 35 Latvia 53.6 35 16.5 63 72.0 10 53.0 32 73.0 16 51.2 34 Chile 53.3 36 52.4 36 38.8 49 58.3 19 63.7 28 57.4 32 Trinidad and Tobago 52.6 37 22.5 59 54.7 34 60.2 15 73.0 15 36.0 55 Slovak Republic 51.3 38 34.7 49 56.1 32 41.2 53 73.1 14 60.3 29 Mexico 50.2 39 71.0 21 49.2 38 44.9 46 35.6 53 40.4 45 Argentina 49.9 40 48.4 41 69.3 17 48.7 38 33.1 57 41.0 43 Mauritius 46.3 41 9.2 72 60.0 28 n/a n/a 69.7 24 41.5 41 Russia 45.3 42 67.4 22 35.5 50 44.2 49 34.3 55 40.3 46 South Africa 45.1 43 56.4 30 39.2 46 50.6 36 34.3 54 44.3 38 Brazil 44.1 44 67.1 24 28.1 58 47.6 44 33.6 56 39.9 47 Romania 44.1 45 29.8 51 61.8 25 39.7 54 44.9 46 37.2 54 Thailand 44.0 46 54.2 33 19.3 68 48.2 41 54.3 39 44.4 37 Dominican Republic 42.9 47 23.4 58 46.7 43 44.2 48 57.6 35 31.1 63 Panama 42.8 48 30.4 50 47.9 42 54.8 25 38.2 51 37.8 50 Costa Rica 42.1 49 19.7 61 48.0 41 49.8 37 51.0 42 35.7 57 Bulgaria 41.9 50 25.1 56 61.3 26 37.0 58 44.3 48 37.6 51 Egypt 40.1 51 36.9 47 32.9 51 53.1 30 37.4 52 35.7 58 Uruguay 39.0 52 16.0 65 56.0 33 59.7 17 24.3 61 41.4 42 Vietnam 37.2 53 41.3 46 5.3 75 52.2 33 50.0 43 18.3 73
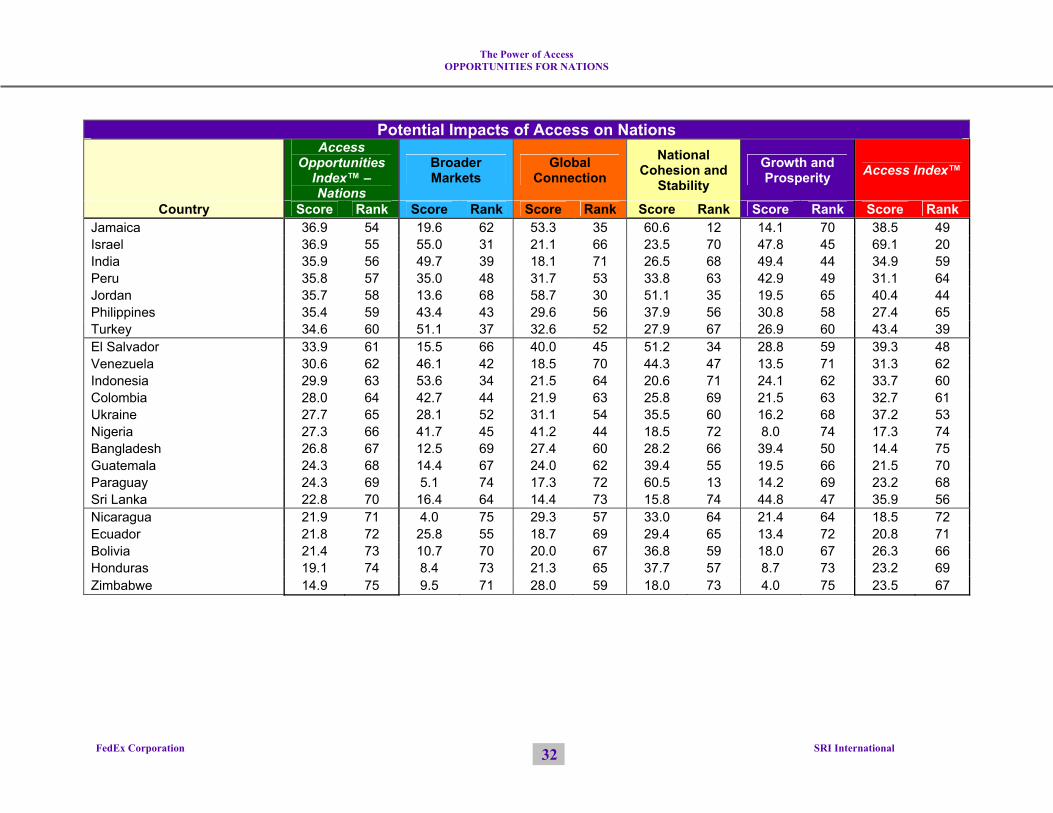
The Power of Access OPPORTUNITIES FOR NATIONS
FedEx Corporation SRI International 32
Potential Impacts of Access on Nations
Access Opportunities
Index™ – Nations
Broader Markets
Global Connection
National Cohesion and
Stability Growth and Prosperity Access Index™
Country Score Rank Score Rank Score Rank Score Rank Score Rank Score Rank Jamaica 36.9 54 19.6 62 53.3 35 60.6 12 14.1 70 38.5 49 Israel 36.9 55 55.0 31 21.1 66 23.5 70 47.8 45 69.1 20 India 35.9 56 49.7 39 18.1 71 26.5 68 49.4 44 34.9 59 Peru 35.8 57 35.0 48 31.7 53 33.8 63 42.9 49 31.1 64 Jordan 35.7 58 13.6 68 58.7 30 51.1 35 19.5 65 40.4 44 Philippines 35.4 59 43.4 43 29.6 56 37.9 56 30.8 58 27.4 65 Turkey 34.6 60 51.1 37 32.6 52 27.9 67 26.9 60 43.4 39 El Salvador 33.9 61 15.5 66 40.0 45 51.2 34 28.8 59 39.3 48 Venezuela 30.6 62 46.1 42 18.5 70 44.3 47 13.5 71 31.3 62 Indonesia 29.9 63 53.6 34 21.5 64 20.6 71 24.1 62 33.7 60 Colombia 28.0 64 42.7 44 21.9 63 25.8 69 21.5 63 32.7 61 Ukraine 27.7 65 28.1 52 31.1 54 35.5 60 16.2 68 37.2 53 Nigeria 27.3 66 41.7 45 41.2 44 18.5 72 8.0 74 17.3 74 Bangladesh 26.8 67 12.5 69 27.4 60 28.2 66 39.4 50 14.4 75 Guatemala 24.3 68 14.4 67 24.0 62 39.4 55 19.5 66 21.5 70 Paraguay 24.3 69 5.1 74 17.3 72 60.5 13 14.2 69 23.2 68 Sri Lanka 22.8 70 16.4 64 14.4 73 15.8 74 44.8 47 35.9 56 Nicaragua 21.9 71 4.0 75 29.3 57 33.0 64 21.4 64 18.5 72 Ecuador 21.8 72 25.8 55 18.7 69 29.4 65 13.4 72 20.8 71 Bolivia 21.4 73 10.7 70 20.0 67 36.8 59 18.0 67 26.3 66 Honduras 19.1 74 8.4 73 21.3 65 37.7 57 8.7 73 23.2 69 Zimbabwe 14.9 75 9.5 71 28.0 59 18.0 73 4.0 75 23.5 67


How Greater Access Is Changing the World:
FedEx: Powering Global Access


FedEx: Powering Global Access Executive Overview
FedEx Corporation SRI International i
In the current economy, people and companies want goods and components from around the world, and they want them in the timeframe that they choose. FedEx has contributed to building and matching these expectations not only through its own pioneering activities, but also through the replication of its model and activities by other businesses and, indeed, across much of the economy.
How FedEx Catalyzes Access
FedEx catalyzes access by collapsing time and space and by increasing information. The three variables that define access – time, space, and information – are also the key elements around which FedEx’s operations revolve. Redefining the boundaries of time, space, and information, therefore, has always been a central objective of the company. At the same time, the global economy has moved rapidly to both require and reward successful adaptation by individuals, companies, and countries to a fast-paced, geographically amorphous, and information-rich environment.
Through its innovations such as applying the “hub and spoke” system
to express transportation, FedEx has created a “global access network.” FedEx founder and CEO, Frederick W. Smith, introduced the innovative “hub and spoke” system of collection and distribution to the transportation industry. From this beginning, FedEx has consistently and assertively forged ahead in extending the reach of its infrastructure, both physical and digital, in order to provide customers with a truly global access network. The explosion of access to goods and information through FedEx is demonstrated in the following charts.
FedEx Delivery and Price Trends
(Includes FedEx Express and Fed/Ex Ground)
14 68452
3,290
1,698
5,966
4,739
$63.27
$56.43
$14.12$14.61$14.83
$31.98
$19.69
0
1,000
2,000
3,000
4,000
5,000
6,000
7,000
1975 1980 1985 1990 1995 2000 2005
Ave
rage
Dai
ly V
olum
e (0
00s)
$10
$20
$30
$40
$50
$60
$70Average Daily Volume of Deliveries (000's) Inflation-Adjusted Price
Inflation Adjusted Price*
* Prices expressed in 2005 dollars, calculated by SRI using the Bureau of Labor Statistics inflation calculator, http://data.bls.gov/cgi-bin/cpicalc.pl. Source: FedEx. Note: FedEx Ground began operations in 1985; FedEx Ground information is estimated for 1985 and 1990.
Data Size of Information on Shipping and Handling Provided by FedEx to Customers
0 0.1 0.4 0.5 1.11.9
3.95.4
8
13.5
10.8
0
2
4
6
8
10
12
14
1995 1996 1997 1998 1999 2000 2001 2002 2003 2004 2005
Dat
a Si
ze (t
erab
ytes
*)
* A terabyte equals one trillion bytes of information. Source: FedEx
The “access space” covered by FedEx has multiplied from 25 cities in 1973 to 220 countries and territories today, serving markets that comprise 90 percent of the world’s gross domestic product.

FedEx: Powering Global Access Executive Overview
FedEx Corporation SRI International ii
Non-U.S.-Based Customer Accounts (FedEx Express)
4.04%
18.18%
22.84%
27.19%
10.61%
0.25%0%
5%
10%
15%
20%
25%
30%
1981 1985 1990 1995 2000 2005Source: FedEx
% o
f U.S
. and
Non
-U.S
. Cus
tom
er A
ccou
nts
FedEx and Nations: Providing Connections
FedEx has continuously broadened its international system to provide access to customers worldwide. As one of the early companies to recognize the inevitability and potential of global manufacturing and supply chains, FedEx began building its global access network more than 25 years ago, when it inaugurated its first international service to Canada. Today, it provides an unprecedented level of access to people worldwide, moving goods door-to-door among 220 countries and territories in just one to three business days. Reflecting the demand for access services, the rate of growth of international customers who have established accounts with FedEx has been steep and strong, as indicated in the chart above, which illustrates growth in non-U.S.-based accounts as a percentage of all customer accounts.
FedEx has consistently championed expanded global access through
“open skies” and deregulation. By advocating for international aviation deregulation, FedEx has played a critical role in linking global markets, providing numerous economic benefits for nations, including lower airfares, expanded air service and choice in Europe, and more investment, trade, and jobs in China.
FedEx has worked to move goods faster across national borders,
thereby decreasing business costs and promoting economic growth. Over the years, FedEx has made a strong case to the U.S. Trade Representative and the World Trade Organization on the importance of harmonizing customs regimes across the globe. Moreover, in advance of comprehensive customs harmonization, FedEx has spearheaded other innovations, such as FedEx Global Trade Manager®, that facilitate the movement of goods across national boundaries.
* Development Research Council of China/Campbell-Hill Aviation Group, as cited in “FedEx Expands
Leadership in Asia Pacific with Plan to Build Region’s Largest Air Cargo Hub in Guangzhou, China” (July 13, 2005 FedEx press release).
The direct impact on China’s economy of the new FedEx hub in Guangzhou is estimated to reach $11 billion in 2010, increasing to $63 billion by 2020.*

FedEx: Powering Global Access Executive Overview
FedEx Corporation SRI International iii
Accelerated worldwide access, provided by companies such as FedEx, drives global growth, including broad economic effects as well as direct, specific impacts related to the company’s decisions and plans. Among the major contributors to growth in China, for example, are exports which have been facilitated by access-related gains (e.g., liberalization of trade regimes).
FedEx and Businesses: Expanding Reach, Innovation, and Profitability
FedEx provides companies with broader market reach. FedEx-provided access enables companies to reach customers and sell to wider markets, both nationally and internationally. Highly perishable or personally tailored products used to be limited to local markets; today such products can be offered to customers globally.
FedEx’s access services enable businesses to improve their supply chains. Profitable and competitive businesses are supported by strong supply chains that are efficient, flexible, and adaptable in changing markets. FedEx provides a wide range of cutting-edge access services that help companies dramatically increase supply chain efficiency and agility.
Access generated by FedEx reduces inventory and increases
profitability. Businesses are increasingly able to manage the flow of inputs and finished products efficiently and with more certainty, eliminating the need to carry large stocks of inventory as “insurance.” The U.S. economy-wide inventory-to-sales ratio fell from 1.67 in 1982 to 1.37 in 2003, a decrease to which FedEx’s advanced logistics management and information technology services has contributed.
FedEx and People: Offering the Choice of What, Where, When, and How
FedEx provides access to individuals in critical moments and in challenging environments. The FedEx network allows rapid distribution of supplies required for human survival, as well as connectivity in times of great distress and need, as has been demonstrated through the December 26, 2004 tsunami affecting Southeast Asia and through Hurricane Katrina.
FedEx is estimated to have saved its U.S. and international clients $1.3 billion in inventory carrying costs over the 1993-2000 period.
Just as access has expanded and become increasingly essential to nations, businesses and people, the role of FedEx in the “access space” has increased consistently.

FedEx: Powering Global Access Executive Overview
FedEx Corporation SRI International iv
FedEx satisfies consumers’ desires for niche products, as the ritual uncorking of Beaujolais Nouveau on the third Thursday of November in countries from France to Japan attests.
Businesses’ access to goods, services, and information exponentially
multiplies benefits to individuals. As businesses incorporate more and more access-related advances into their processes, customers benefit from more reliable availability of goods and quicker access to innovative products.
Expanded choices for how and where individuals can attain access
mean greater convenience and personalization of service. The range of access options available from FedEx increases continuously, with customers now able to choose dates and times that are most convenient, as well as the type of signature necessary for delivery.
FedEx and the Future of Access
All companies in the FedEx family generate physical and digital access under the conditions of reliability, transparency, flexibility, and accelerating speed. The significance of access is demonstrated by the rapid growth of resources devoted to it, as well as the range of goods, services, and business models that are integrally based on access. History has demonstrated that nearly all industries can rise or fall in importance, but it seems likely that the demand for greater access will continue to grow unabated, as will the contribution of FedEx to bringing the benefits of access to people, businesses, and nations.

FEDEX: POWERING GLOBAL ACCESS
FedEx Corporation SRI International v
CONTENTS
Introduction How FedEx Catalyzes Access FedEx and Nations: Providing Connections FedEx and Business: Expanding Reach, Innovation, and Profitability FedEx and People: Offering the Choice of What, Where, When, and How FedEx and the Future of Access
1
1
6
11
15
19

FEDEX: POWERING GLOBAL ACCESS
FedEx Corporation SRI International 1
Introduction From its inception, FedEx has been driven by the goal of generating and providing its clients with greater access to physical objects and information. Since the company began operations in 1973, fundamental shifts in the way people, businesses, and nations conduct their activities have taken place. Some of these shifts have been spurred by deep economic changes facilitated by the increased access that FedEx has generated. In other words, FedEx has played a significant role not only in accelerating changes in the economic environment, but also in creating change through the company’s innovations. In the current economy, people and companies want goods and components from around the world, and they want them in the timeframe that they choose. FedEx has contributed to building and matching these expectations through its own pioneering activities as well as through the replication of aspects of its model and activities by other businesses across the logistics and express delivery industry and, indeed, across much of the economy. Today, with clients that include millions of individuals and many thousands of companies in hundreds of countries, FedEx enables unprecedented levels of access and, through this access, produces immediate opportunities for people, business, and nations. The conceptual framework describing the foundations and core components of access and the relationships between access and its benefits for people, business, and nations are detailed in four reports prepared by SRI International on behalf of FedEx Corporation.1 These documents provide the analytical background for understanding the importance and changing nature of access and its opportunities. Shifting from these broad perspectives on the concept of access, this report focuses exclusively on the direct impacts and benefits generated by FedEx’s continual quest to create and expand access. How FedEx Catalyzes Access
FedEx catalyzes access by collapsing time and space
and by increasing information.
The three variables that define access – time, space, and information – are also the key elements around which FedEx’s operations revolve. Redefining the boundaries of time, space, and information, therefore, has always been a central objective of the company, and FedEx has relentlessly endeavored to collapse
1 These reports include The Power of Access, The Power of Access: Opportunities for Nations, The Power of Access: Opportunities for Business, and The Power of Access: Opportunities for People.

FEDEX: POWERING GLOBAL ACCESS
FedEx Corporation SRI International 2
time and space and to increase the information available to both employees and customers. At the same time, the global economy has moved rapidly to both require and reward successful adaptation by individuals, companies, and countries, to a fast-paced, geographically expansive, and information-rich environment. The table below details the new realities of today’s economy with respect to time, space, and information, as well as the FedEx approach to the challenges and opportunities that they present.
Changes in
Access Variables FedEx’s Approach to
Access Variables
Time
In the past, decreasing the cycle time required to complete a transaction was considered by most to be a luxury. In the current “real-time” economy, collapsing transaction time is a necessity. Physical objects must reach their destination in a customer-responsive timeframe, and information must be available instantaneously.
Time sensitivity, not transportation, is the operating theme of FedEx’s activities. All equipment, technologies, human resources, and systems are combined to accelerate velocity, not only to collapse time for delivery to a minimum, but also to provide time-definite delivery on the date and/or hour that the customer requires.
Space
Space represents the distance between the entity seeking an object and the object being sought, i.e., the physical locations of demand and supply. With access, the economic constraint of geographical distance is reduced dramatically, allowing new patterns of economic development to emerge.
A hallmark of the corporation is the continuous collapsing of space through the extension of FedEx’s global network and through a reduction in the amount of time needed to move an object around the world. The “access space” covered by FedEx has multiplied from 25 cities in 1973 to 220 countries and territories today.
Information
Information is anything that reduces uncertainty in decision-making. Information thereby enables action. The faster the availability of relevant, trustworthy information, the faster and better the results, representing an important change from the past action-decision context.
FedEx has championed access to information not only internally, but also through availability to its customers. FedEx’s approach of rapid deployment of information throughout the entire supply chain has revolutionized business models. In addition, FedEx Kinko’s core business functions revolve around expansion of digital access and transfer, reproduction, and delivery of information goods.

FEDEX: POWERING GLOBAL ACCESS
FedEx Corporation SRI International 3
FedEx Delivery and Price Trends (Includes FedEx Express and FedEx Ground)
14 68452
3,290
1,698
5,966
4,739
$63.27
$56.43
$14.12$14.61$14.83
$31.98
$19.69
0
1,000
2,000
3,000
4,000
5,000
6,000
7,000
1975 1980 1985 1990 1995 2000 2005
Ave
rage
Dai
ly V
olum
e (0
00s)
$10
$20
$30
$40
$50
$60
$70Average Daily Volume of Deliveries (000's) Inflation-Adjusted Price
Inflation Adjusted Price*
* Prices expressed in 2005 dollars, calculated by SRI using the Bureau of Labor Statistics inflation calculator, http://data.bls.gov/cgi-bin/cpicalc.pl. Source: FedEx. Note: FedEx Ground began operations in 1985; FedEx Ground information is estimated for 1985 and 1990.
As a result of FedEx’s efforts to collapse time and space and increase information, people and businesses in large parts of the world today enjoy unequaled ability to obtain physical objects – documents, equipment, spare parts, medical devices, consumer goods, etc. – with fewer concerns about the time or cost of transportation, and with much greater levels of information (and thus assurance) about a package as it moves to its destination. The following chart depicts vividly the explosion of access that has taken place since 1973, as illustrated by the number and average price of deliveries made by FedEx.
In keeping with CEO Frederick W. Smith’s belief that “the information about the package is as important as the delivery of the package itself,” FedEx endeavors to keep its information and communications systems as robust as its ability to physically move items from place to place. Accordingly, the levels of information provided to FedEx customers about the packages entrusted to the company for delivery have increased in parallel with the rapid increases in deliveries made. Through the use of cutting-edge information technologies, FedEx provides customers with near real-time updates on shipments, greatly enhancing reliability and predictability of access. In addition to expanded volume of information about packages, FedEx has played a significant role in multiplying the types of information that are now routinely provided to customers, whether businesses or individuals, as well as to

FEDEX: POWERING GLOBAL ACCESS
FedEx Corporation SRI International 4
employees. The following table highlights some of the information advances in which FedEx was a pioneer.
SELECTED FEDEX INFORMATION INNOVATIONS 1979 COSMOS® – Customer, Operations, Service, Master Online System –
a centralized computer system to manage vehicles, people, packages, routes, and weather scenarios on a real-time basis – is launched. This is the first centralized computer system in the industry used to keep track of all packages handled by the company.
1980 FedEx implements DADS® – the Digital Assisted Dispatch System – to coordinate on-call pickups for customers. DADS® is comprised of tiny terminals, installed in vehicles, to digitally transmit orders and guide couriers to their next pickup.
1984 The first PC-based automated shipping system, later named FedEx PowerShip® is introduced.
1986 FedEx SuperTracker®, a hand-held bar-code scanner system that captures detailed package information, is launched.
1994 FedEx.com becomes the first transportation website to offer package status tracking, enabling customers to conduct business via the Internet.
1996 FedEx interNetShip® (now called FedEx Ship Manager®) provides customers with the first Internet-based service for processing packages.
2000 FedEx launches new customer technology solutions including a redesigned website to integrate express and ground functionality, FedEx e-Commerce Builder®, FedEx Global Trade Manager® and FedEx Ship Manager®.
2001 FedEx InSight® is introduced, becoming the first web-based application to offer proactive, real-time status information on inbound, outbound and third-party shipments.
2002 FedEx launches the first online “landed cost” application for estimating duties and taxes assessed on international shipments.
2003 FedEx Claims Online® is introduced, making it the first tool of its kind in the industry.

FEDEX: POWERING GLOBAL ACCESS
FedEx Corporation SRI International 5
Through its continuous innovations,
FedEx has created a “global access network” that provides unparalleled access for its customers.
CEO Frederick W. Smith created Federal Express Corporation for the purpose of expanding access through overnight express delivery. Smith applied the innovative “hub and spoke” system of collection and distribution, which allowed for the efficient coverage of large numbers of geographic areas. Within the hubs themselves, FedEx aggressively applied new technologies to enhance the capabilities required to collect, sort, and distribute millions of packages within a few hours. FedEx made this possible by becoming a pioneer in the application of an information-based solution – bar-code electronic tracking – leading not only to one of FedEx’s first giant leaps ahead for its hub and spoke system, but also to a revolution in value chain management for most industries, including manufacturing, logistics, and retailing. More recently, FedEx has consistently and assertively forged ahead in establishing both hidden and visible structures that enable it to provide customers with a truly global access network. In the background are FedEx’s extensive investments in regional hubs in Anchorage, Subic Bay, and Paris. These investments permit customer-serving innovations such as AsiaOne® (which provides next-business-day delivery by 10:30 a.m. among major Asian trade centers) and EuroOne® (an intra-European overnight service). Not content with these capabilities and still endeavoring to expand access, FedEx recently announced plans to build Asia’s largest air cargo hub in Guangzhou in order to serve the rapidly growing trade between China and its Asian neighbors, as well as with North America and Europe. At the same time, FedEx’s visible infrastructure has been brought closer and closer to the customer, whether business or individual. Starting with the first FedEx drop boxes in 1975 and continuing to the 2004 acquisition of Kinko’s, FedEx has lengthened its reach to provide ever greater and more convenient access for customers. Aside from physical infrastructure, FedEx also has been in the vanguard of creatively using the Internet to connect customers with the company’s services. Recognizing early that the Internet could serve as a key outward-reaching “spoke” in the system that enables customers to attain access, FedEx today integrates physical and virtual hubs and spokes to create its global access network. The importance of virtual systems to both FedEx and its customers is evident from the following:

FEDEX: POWERING GLOBAL ACCESS
FedEx Corporation SRI International 6
Number of Countries and Territories Served by FedEx Express
220202
1 2
85
106
188
0
50
100
150
200
250
1973 1981 1984 1989 1994 1995 2004Source: FedEx
Today, fedex.com hosts nearly 15 million unique visitors per month. The website handles more than 3 million package tracking requests per day. Electronic transactions account for almost two-thirds of the more than 6
million shipments delivered by FedEx companies each day. 70 percent of the company’s U.S. sales revenue is generated by electronic
transactions. FedEx and Nations: Providing Connections
FedEx has continuously broadened its international system to
provide access to customers worldwide.
As one of the early companies to recognize the inevitability and potential of global manufacturing and supply chains, FedEx Express began building its global access network more than 25 years ago, when it inaugurated its first international service to Canada. Over the years, FedEx continued to expand its services globally through company acquisitions, expansion of landing rights, and construction of new hubs around the world. As indicated in the following chart, FedEx’s network now links 220 countries and territories around the world, serving markets that comprise 90 percent of the world’s gross domestic product. It provides an unprecedented level of access to people worldwide, moving goods door-to-door among these 220 markets in just one to three business days. By 2002, FedEx’s reach extended to virtually every American, and in the newest economic frontier, China, FedEx already serves more than 200 cities and has plans to add 100 more during the next few years.

FEDEX: POWERING GLOBAL ACCESS
FedEx Corporation SRI International 7
Over time, FedEx has broadened access to nations not only by increasing the number of countries and cities which it serves, but also by continuously upgrading the types of services provided, such as expanding next business day service between countries for time-critical shipments. Simultaneously, FedEx has worked to extend to its worldwide customers services such as time-definite delivery, money-back guarantees, and availability of information through its shipment tracking system, which are the hallmarks of its services to U.S. customers. Reflecting the demand for such services, the rate of growth of international customers who have established accounts with FedEx has been steep and strong, as indicated by the growth in non-U.S.-based accounts as a percentage of all customer accounts.
Non-U.S.-Based Customer Accounts (FedEx Express)
4.04%
18.18%
22.84%
27.19%
10.61%
0.25%0%
5%
10%
15%
20%
25%
30%
1981 1985 1990 1995 2000 2005
% o
f U.S
. and
Non
-U.S
. Cus
tom
er A
ccou
nts
Source: FedEx
FedEx has consistently championed expanded global access through “open skies” and deregulation.
FedEx’s efforts to expand global access have not been achieved without addressing significant obstacles. Historically, government regulations and restrictive air landing rights in many countries have posed barriers to developing new international transportation routes. Since the early 1990s, FedEx has been an active champion of “open skies,” encouraging countries to open their markets to international aviation services.

FEDEX: POWERING GLOBAL ACCESS
FedEx Corporation SRI International 8
FedEx has worked tirelessly with U.S. officials and foreign governments to explain the economic benefits of liberalization of aviation regimes, and has encouraged aviation-securing freedoms that are beneficial for both cargo and passenger customers, i.e., in moving both goods and people across borders. In particular, FedEx successfully advocated for the U.S. government’s inclusion of air cargo rights in its bilateral aviation negotiations. The company also has petitioned for these negotiations to include critical 5th and 7th air freedom rights.2 As of May 2005, the U.S. government has negotiated Open Skies agreements with 70 countries, helping to create a free market for aviation services that provides substantial benefits for travelers, shippers, communities, and the economies of individual countries. By spearheading and advocating for international aviation deregulation, FedEx has played a critical role in linking global markets, providing numerous economic benefits for nations, including the following:
From 1992-2004, the United States signed bilateral Open Skies agreements
with 15 of the 25 E.U. nations, thereby expanding competition in the aviation industry (both passenger and cargo). As a result of increased competition, these 15 European countries and their citizens have benefited through increased airline service, greater choice, and lower fares.
FedEx has been a staunch proponent of liberalizing aviation in China,
supporting U.S.-China bilateral talks resulting in a 2004 aviation agreement that will more than double the number of airlines permitted to serve U.S.-China routes and increase the number of flights more than fourfold by 2011.
2 5th Freedom: The right to carry passengers and cargo from one foreign nation to another foreign nation (for flights originating in the airline’s home country). 7th Freedom: The right to carry passengers and cargo from one foreign nation to another without any connection to the airline’s home country.
Benefits of Open Skies in Europe Lower Prices Expanded Service More Choice
Source: U.S. Government Accountability Office, Transatlantic Aviation: Effects of Easing Restrictions on U.S.-European Markets (GAO-04-835), July 2004.
Decrease in Average Airfare1996-1999
20.1%
10.3%
0.0%
5.0%
10.0%
15.0%
20.0%
25.0%
Open Skies Markets Non-Open Skies Markets
U.S.-Europe Overall Air Traffic Growth1996-1999
30.0%
0.0%
5.0%
10.0%
15.0%
20.0%
25.0%
30.0%
35.0%
Percent of European Markets Served by At Least Three Airlines, 2004
87.0%
60.0%
71.0%
0.0%10.0%20.0%30.0%40.0%50.0%60.0%70.0%80.0%90.0%
100.0%
Non
stop
Mar
ket
Dou
ble
Con
nect
ion
Mar
ket
Sin
gle
Con
nect
ion
Mar
ket

FEDEX: POWERING GLOBAL ACCESS
FedEx Corporation SRI International 9
With the dramatically increased choices and competition for U.S.-China routes, this agreement will benefit both the U.S. and Chinese economies.
Expected Benefits of Liberalizing Aviation in China
More Investment More Trade More Jobs Expected Growth of Business Investment
in China, 2004-2005
5.0% growth in
investment
0.0%
1.0%
2.0%
3.0%
4.0%
5.0%
6.0%
Expected Growth of U.S. Exports to China, 2004-2008
0.0%
5.0%
10.0%
15.0%
20.0%
25.0%
30.0%
35.0%
40.0%
23-35% Export Growth
Export Value of $8-12 Billion
Expected Number of New Jobs in China,2004-2005
0100200300400500600700800900
Thou
sand
s
800,000 New Jobs
Source: U.S.-China Business Council, as cited in “FedEx Hails New U.S.-China Accord” (June 18, 2004 FedEx press release).
FedEx has worked to move goods faster
across national borders, thereby decreasing business costs and promoting economic growth.
Aviation freedom is only one aspect of a nation’s access to inputs and essential goods. Once goods arrive at the port of entry, for instance, the transport to their ultimate destination can be delayed by customs procedures. The costs and delays associated with customs clearance are financial burdens for businesses and significant barriers to economic growth. Over the years, FedEx has made a strong case to the U.S. Trade Representative and the World Trade Organization on the importance of harmonizing customs regimes across the globe. FedEx is encouraging a template of customs rules for all countries to adopt, thus adding transparency and efficiency to the global movement of goods, and also is now advocating for E.U.-wide customs reform. In advance of comprehensive customs harmonization, FedEx has spearheaded other innovations that facilitate the movement of goods across national boundaries. For example, as an industry pioneer in China, FedEx is the first international express company to link electronically with Chinese customs authorities and to receive operating permits for U.S.-to-China direct services. Likewise, as illustrated in the following box, FedEx has created tools such as FedEx Global Trade Manager® that permit companies to handle complex trade-related requirements with maximum efficiency.
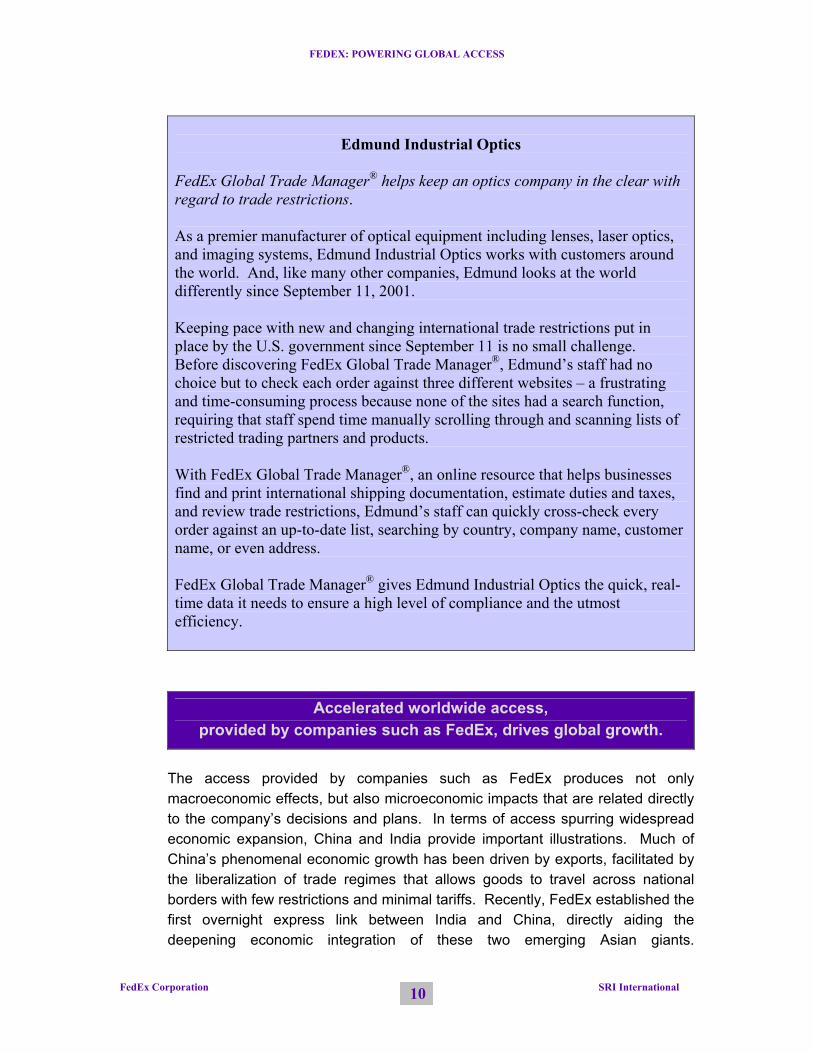
FEDEX: POWERING GLOBAL ACCESS
FedEx Corporation SRI International 10
Edmund Industrial Optics
FedEx Global Trade Manager® helps keep an optics company in the clear with regard to trade restrictions. As a premier manufacturer of optical equipment including lenses, laser optics, and imaging systems, Edmund Industrial Optics works with customers around the world. And, like many other companies, Edmund looks at the world differently since September 11, 2001. Keeping pace with new and changing international trade restrictions put in place by the U.S. government since September 11 is no small challenge. Before discovering FedEx Global Trade Manager®, Edmund’s staff had no choice but to check each order against three different websites – a frustrating and time-consuming process because none of the sites had a search function, requiring that staff spend time manually scrolling through and scanning lists of restricted trading partners and products. With FedEx Global Trade Manager®, an online resource that helps businesses find and print international shipping documentation, estimate duties and taxes, and review trade restrictions, Edmund’s staff can quickly cross-check every order against an up-to-date list, searching by country, company name, customer name, or even address. FedEx Global Trade Manager® gives Edmund Industrial Optics the quick, real-time data it needs to ensure a high level of compliance and the utmost efficiency.
Accelerated worldwide access, provided by companies such as FedEx, drives global growth.
The access provided by companies such as FedEx produces not only macroeconomic effects, but also microeconomic impacts that are related directly to the company’s decisions and plans. In terms of access spurring widespread economic expansion, China and India provide important illustrations. Much of China’s phenomenal economic growth has been driven by exports, facilitated by the liberalization of trade regimes that allows goods to travel across national borders with few restrictions and minimal tariffs. Recently, FedEx established the first overnight express link between India and China, directly aiding the deepening economic integration of these two emerging Asian giants.

FEDEX: POWERING GLOBAL ACCESS
FedEx Corporation SRI International 11
Furthermore, by expanding its China operations to provide direct services to Europe and North America, and by working with the U.S. and Chinese governments to reduce aviation restrictions, FedEx plays a key role in integrating China into the world economy. In terms of direct economic impacts, China also provides a significant example of how FedEx drives growth. FedEx plans to build the regions’ largest air cargo hub in Guangzhou, to be in operation in 2008. It is estimated that the direct impact of the FedEx hub on China’s economy will be $11 billion in 2010, increasing to $63 billion by 2020, with the majority resulting from industrial expansion.3 Even in the high-tech services industry, where product design, development, and delivery can be accomplished over a digital network, physical access is critical to conducting business. The recent conclusion of a U.S.-India Open Skies Agreement (an effort that FedEx strongly supported) was widely hailed by leaders in India’s high-tech industry as improving productivity and response time to clients, because much of the business still needs to be conducted face-to-face. With the anticipated increase in the number of flights, service will become more competitive and affordable. FedEx and Business: Expanding Reach, Innovation, and Profitability
FedEx provides companies with broader market reach.
There is no business without markets. FedEx-provided access enables companies to reach customers and sell to wider markets, both nationally and internationally. The following examples showcase FedEx’s contribution to the expansion of businesses’ reach in the global market:
FedEx helped local hand-dipped strawberry company, Shari’s Berries, reach a national audience. Hand-dipped strawberries are highly perishable, and were a quintessentially local product before the age of access. Started in a one-bedroom apartment in 1989 and expanded to five stores in California by 1998, Shari’s Berries decided to launch its website www.berries.com and partnered with FedEx to develop a supply chain that integrates order management, shipment tracking and customer billing. Immediately, nationwide sales took off, increasing by more than ten times for Christmas
3 Estimates from China’s Development Research Commission and Campbell-Hill Aviation Group of the United States.

FEDEX: POWERING GLOBAL ACCESS
FedEx Corporation SRI International 12
1999, and by more than 800 percent in the first quarter of 2000. Shari’s Berries now sells to all 50 states and has achieved national market recognition for its unique products and high-quality services. FedEx enabled Shari’s Berries to successfully harness physical and information access to expand its market.
Motion Computing partnered with FedEx to help it reach customers
around the world directly from its factory in China. Motion Computing’s tablet PC products are used by clients, mostly in the health care industry, in 18 countries. One of the company’s competitive advantages is that customers can order its tablet PCs with the exact features that suit their needs — and get them shipped overnight. FedEx’s direct-ship program from China to Motion Computing’s distributors and end customers in North America and the European Union has helped the company quickly expand globally in a cost-effective manner.
FedEx’s access services enable businesses to improve their supply chains.
Profitable and competitive businesses are supported by strong supply chains that are efficient, flexible, and adaptable in changing markets. FedEx provides a wide range of cutting-edge access services that help companies dramatically increase supply chain efficiency and agility.
FedEx helped Gateway cut millions off annual shipping costs and better manage its international supply chain. During Gateway’s early years, the company coordinated its own manufacturing and repairs. Rapid growth, cost savings opportunities, and other factors led Gateway to outsource these functions to partners in the United States, China, and Mexico. This outsourcing created a need for reliable and cost-effective supply chain solutions, which the FedEx family offered – in this case through FedEx Ground, FedEx Freight, and FedEx Solutions. FedEx Solutions assisted by developing plans to optimize the best and most cost-effective ways to ship and improve transit times. FedEx now coordinates half of Gateway’s shipments, and the plan shaves millions off Gateway’s annual shipping costs while improving the whole system’s efficiency.

FEDEX: POWERING GLOBAL ACCESS
FedEx Corporation SRI International 13
Number of FedEx Kinko's Locations by Year (includes former FedEx Express locations converted in 2005)
0
200
400
600
800
1,000
1,200
1,400
1974 1980 1985 1990 1995 2000 2005Source: FedEx
FedEx Express and FedEx Kinko’s helped Ken Blanchard Companies trim two weeks off its production and shipping times. Blanchard is one of the world’s premier business training and coaching companies, routinely conducting seminars and workshops all over the world. Customs clearance and other delays meant that the company used to take four weeks to produce training materials at their San Diego headquarters and deliver the materials for use in India. Working with FedEx Express and FedEx Kinko’s, they reduced the cycle by two weeks, sending electronic versions of the documents to be printed at a FedEx Kinko’s location in Asia. Reflecting the role that FedEx Kinko’s can play in providing business solutions, and the consequent demand from the business community to retain a convenient FedEx Kinko’s in their proximity, the number of FedEx Kinko’s locations continues to expand rapidly.
Access generated by FedEx reduces inventory and increases profitability.
Businesses are increasingly able to manage the flow of inputs and finished products efficiently and with more certainty, eliminating the need to carry large stocks of inventory as “insurance.” The U.S. economy-wide inventory-to-sales ratio has fallen from 1.67 in 1982 to 1.37 in 2003. With its advanced logistics management and information technology services, FedEx has contributed to this decrease by reducing inventory and its carrying costs for its business clients.

FEDEX: POWERING GLOBAL ACCESS
FedEx Corporation SRI International 14
FedEx is estimated to have saved its U.S. and international clients $1.3 billion
in inventory carrying costs over the 1993-2000 period. SRI developed an Inventory Carrying Cost Savings Model to estimate the savings enjoyed by FedEx customers. By using FedEx services to reduce the transit time that raises inventory carrying costs, FedEx is estimated to have saved its U.S. and international clients over $325 million in the year 2000, and $1.3 billion from 1993 to 2000.4
FedEx helped Pentax reduce lead times and minimize inventory expenses. It
used to take up to ten days for Pentax’s high-value cameras to move from factories in Asia to a central warehouse in Colorado, and then on to retailers. Working with FedEx, Pentax developed a new Pentax Direct Distribution System, where products go from factories to the central FedEx Asia-Pacific Hub, and then get shipped directly to retailers using FedEx International Priority DirectDistribution. The new model is five days faster and helps Pentax decrease total inventory costs.
FedEx has enabled new business models.
Companies large and small have worked with FedEx to create and execute new business models delivering more client and stakeholder value. Small, specialized local companies such as Shari’s Berries (described above) and countless other niche gourmet firms can build their businesses around serving clients nationwide, assured that their perishable products can be delivered to customers overnight. Similarly, high-tech startups can go “global” more easily, developing and managing global supply chains as never before possible. FedEx’s scope of services and solutions helps business leaders and entrepreneurs pursue their dreams.
4 See SRI International (2001), Global Impacts of FedEx in the New Economy.

FEDEX: POWERING GLOBAL ACCESS
FedEx Corporation SRI International 15
FedEx and People: Offering the Choice of What, Where, When, and How
FedEx provides access to individuals in critical moments and in challenging environments.
The FedEx network allows rapid distribution of supplies required for human survival, as well as connectivity in times of great distress and need. With respect to the former, for example, FedEx assisted international aid organizations in the aftermath of the December 26, 2004 tsunami to facilitate the distribution of medical and relief supplies to victims. Donating its services, FedEx transported nearly 1.3 million pounds of pharmaceuticals (including children’s medicines), first aid supplies, personal hygiene kits, protective suits, and water purification systems to India, Sri Lanka, and Thailand, thereby expediting the provision of critical health services to people in these countries’ devastated regions – and demonstrating the compression of time and space that is possible through access.
Storm Victims – and a FEMA Representative – Plug in at [FedEx] Kinko’s
Krissah Williams, The Washington Post, September 12, 2005, page A11. “The parking lot outside a FedEx Kinko’s on the southern outskirts of [Houston] was dotted with Louisiana license plates. In the days following [Hurricane Katrina] … this place of computers, printers, fax machines, copiers and Internet connectivity became a de facto office for some of the wandering workers and professionals of New Orleans. A woman with a crying baby on her hip took a seat at a computer and began typing her resume. A man walked in the door, plugged his cell phone into an open electrical outlet, and sat down to wait for his phone to power up … Meanwhile, another man sat at a laptop docking station in the store. His cell phone rang furiously. ‘Yes, ma’am,’ he said. ‘I’m at a fax machine right now. Send your information and you should hear from FEMA within three to seven days.’ He was a FEMA representative, using [FedEx] Kinko’s as an office like everyone else … For hours, the [FedEx] Kinko’s cashiers brought stacks of faxes over to the FEMA representative’s desk as homeowners submitted copies of driver’s licenses and other documentation for claims. At lunchtime, the man gathered his laptop and supplies and scribbled a note on a piece of paper that marked his desk as among the most valuable real estate around. ‘This station,’ it read, ‘is being used by FEMA.’ ”

FEDEX: POWERING GLOBAL ACCESS
FedEx Corporation SRI International 16
FedEx satisfies consumer desires for niche products.
At the other end of the spectrum from fulfilling basic human needs for supplies and communications, FedEx also enables people to obtain desired luxury items within days of their availability, regardless of the geographical distance of the product source. Beaujolais Nouveau, produced in France each autumn, is uncorked annually at midnight on the third Thursday in November, only weeks after it is bottled. Halfway around the world, Japanese enthusiasts celebrate the ritual uncorking of this wine on the designated date – via access provided by FedEx. With carefully developed logistics plans prepared months in advance, FedEx and the airport nearest to the Beaujolais region of France (Lyons-Saint Exupéry) coordinate to ensure that thousands of tons of new wine are transported safely and rapidly to eager customers around the world, including about 504,000 bottles to Japanese wine devotees awaiting the 2004 uncorking. In short, whether specialty items, basic living requirements, or any product in between, people today have unprecedented access to what they want and need.
Businesses’ access to goods, services, and information exponentially multiplies benefits to individuals.
Goods are Reliably Available to Individuals
As businesses continue to improve their ability to manage inventory, people have greater assurance that what they want to buy will be available when they go to buy it. FedEx systems make possible the desired end result of smooth supply chain processes: satisfied customers who find what they are looking for. CompUSA provides an illustration of the impact on individuals that FedEx’s services to business provide. To ensure the fast-cycle inventory replenishment it needs to keep customers happy, CompUSA has partnered with FedEx Freight, which picks up products directly from manufacturers at five CompUSA distribution centers (a process that virtually eliminates warehousing costs) and delivers them to CompUSA’s 252 stores, typically within two days – thereby providing shoppers with reliable access to the company’s products.
Innovative Products Rapidly Reach Individuals
In the past, small businesses traditionally started with the intention of satisfying a local market need. If successful, a business subsequently might extend its reach to the regional level and, perhaps, to national or even international markets.
FEDEX: POWERING GLOBAL ACCESS
FedEx Corporation SRI International 17
More ubiquitous access to goods, services, and information has wrought a radical alteration and compression of these stages of small business development. In turn, these changes make possible a rapid expansion of businesses’ reach; consequently individuals also enjoy increased opportunity to obtain products or services that previously were simply unknown or unattainable because a business had no way of contacting or serving far-flung customers. Kaenon Polarized, a California-based company producing polarized sunglasses for athletes, encapsulates these changes – as well as the role that FedEx plays in delivering access services to businesses that in turn have direct benefits for individuals. Almost from its establishment, Kaenon wanted to find a way to enter global markets with its unique product, but the startup faced difficulties managing customs procedures, even when the owners engaged freight forwarders and worked directly with customs personnel. Their solution was to partner with FedEx, which became Kaenon’s broker for global customs. And as a result, athletes from Europe to Australia have access to Kaenon’s clearer, lighter, and customized sunglasses, and Kaenon serves people far beyond its Southern California home.
Expanded choices for how and where individuals can attain access mean greater convenience and personalization of service.
The range of access options available from FedEx increases continuously. For the individual consumer of access services, FedEx Home Delivery and FedEx Kinko’s represent primary access “gateways” within the FedEx family, and both of these operating companies have expanded the variety of ways that their services can be accessed.
Individuals Choose How and When Delivery Takes Place
In recent years, FedEx Home Delivery has modified and added services in order to provide not only the certainty of delivery that is a hallmark of all FedEx companies, but also the convenience of delivery required by (and tailored to) the individual residential customer. In addition to regular delivery hours that extend to 8 p.m., FedEx Home Delivery customers may specify that their package be delivered to the recipient:
On a particular date (FedEx Date Certain Home DeliverySM); On a particular date at a particular time (FedEx Appointment Home
DeliverySM); or

FEDEX: POWERING GLOBAL ACCESS
FedEx Corporation SRI International 18
Data Size of Information on Shipping and Handling Provided by FedEx to Customers
0 0.1 0.4 0.5 1.11.9
3.95.4
8
13.5
10.8
0
2
4
6
8
10
12
14
1995 1996 1997 1998 1999 2000 2001 2002 2003 2004 2005
Dat
a Si
ze (t
erab
ytes
*)
* A terabyte equals one trillion bytes of information. Source: FedEx
During the early evening (5 p.m. to 8 p.m.) on a date within the standard delivery schedule of one to five business days (FedEx Evening Home DeliverySM).
Similarly, so that residential deliveries are more likely to be completed on the first attempt (thereby providing greater convenience for package recipients), FedEx Home Delivery has changed its delivery signature policy: residential packages no longer require signatures. At the same time, FedEx Home Delivery, as well as FedEx Express and FedEx Ground, has expanded the range of delivery signature options for residential customers (or shippers) who still want the certainty of a signature. The possibilities now include options for:
An indirect signature (i.e., any person at the delivery address, a neighbor, or a release from the recipient);
A direct signature (any person at the delivery address); or An adult signature (any person over 21 years of age at the delivery address).
In addition to providing a variety of options for shipment of goods, FedEx has revolutionized the availability of information to individuals about goods in transit. Through the use of cutting-edge information technologies, FedEx provides customers with near real-time updates on shipments, greatly enhancing reliability and predictability of access. The accompanying chart, which uses terabytes as a proxy for volume of data, illustrates the rapid expansion of information available to customers.

FEDEX: POWERING GLOBAL ACCESS
FedEx Corporation SRI International 19
People Enjoy the Option of Either Physical or Virtual Presence
New FedEx Kinko’s services span both place-based and virtual convenience. Geographic proximity to individual customers is provided through more than 1,300 storefronts worldwide, including more than 400 that are open 24 hours a day, 7 days a week. Virtual presence is enabled by options such as File, Print FedEx Kinko’s, which “creates a virtual printer cable from [the customer’s] desktop to any U.S. FedEx Kinko’s location.”5 This software tool means that on-the-road business people can create their documents, presentations, and spreadsheets anywhere in the country, and then send them for printing and production to the most convenient pick-up location, or have them delivered. Since File, Print FedEx Kinko’s was introduced in August 2004, usage has increased to more than 10,000 downloads per week. Other expansions of services at FedEx Kinko’s include an online store of nearly 250,000 office and school supply products, launched just before the beginning of the 2005 school year, and expanded packing services, initiated to precede the 2004 holiday season. FedEx and the Future of Access Just as “access” has expanded and become increasingly essential to nations, businesses and people, the role of FedEx in the “access space” has increased consistently. All companies in the FedEx family generate physical and digital access under the conditions of reliability, transparency, rising options, and accelerating speed. The significance of access is demonstrated by the rapid growth of resources devoted to it, as well as the range of goods, services, and business models that are integrally based on access. History has demonstrated that nearly all industries can rise or fall in importance, but it seems likely that the demand for greater access will continue to grow unabated, as will FedEx’s contribution to bringing the benefits of access to people, businesses, and nations.
5 FedEx Kinko’s, “FedEx Kinko’s Connects Personal Computers to Nationwide Network of Office and Print Centers,” August 17, 2004 press release.


http://access.fedex.com© 2006 FedEx.