how do sovereign credit ratings help to financially...
TRANSCRIPT

Thinking ahead for Europe
How do sovereign credit ratings help
to financially develop low-developed countries?
Prabesh Luitel and Rosanne Vanpée
ECMI Working Paper no 8 | November 2018

Thinking ahead for Europe
The purpose of the ECMI Working Paper Series is to promote the circulation of work in progress prepared
within the European Capital Markets Institute or presented at ECMI Seminars and Conferences by outside
contributors on topics of special interest to ECMI.
The views expressed are those of the author(s) and do not necessarily represent the position of ECMI.
Publisher and editor European Capital Markets Institute
Place du Congrès 1, 1000 Brussels, Belgium
www.eurocapitalmarkets.org
Editorial Board Cosmina Amariei, Karel Lannoo, Apostolos Thomadakis
ISBN 978-94-6138-704-2
© Copyright 2018, Prabesh Luitel and Rosanne Vanpée. All rights reserved.
Thinking ahead for Europe
ECMI Working Paper
How do sovereign credit ratings help
to financially develop low-developed countries?
Prabesh Luitel and Rosanne Vanpée*
No. 8 / November 2018
Abstract
This paper investigates the importance of having a sovereign credit rating for a country’s financial
development. After controlling for endogeneity and selection bias, we compare different aspects
of the financial sector and the capital markets of recently rated countries with otherwise similar,
but unrated countries. We find that obtaining a sovereign credit rating changes the composition
of the assets of domestic banks and leads to a growth in bank assets. With a sovereign rating, the
government is less dependent on bank financing and it can tap international bond markets. Banks
subsequently provide more credit to the private sector, which translates into riskier debt
holdings, resulting in an increase in the banks’ risk-weighted assets. We also show that an initial
sovereign credit rating attracts foreign investors, both FDI and portfolio investments. Hence, we
conclude that a sovereign credit provision plays a crucial role in enabling the financial
development in a country.
* Prabesh Luitel is a researcher at the Research Centre for Finance, KU Leuven, Brussels Campus ([email protected]). Rosanne Vanpée is assistant professor at the Faculty of Economics and Business (FEB) and head of the Research Centre for Finance, KU Leuven, Brussels Campus ([email protected]). We thank Igor Loncarski, Stefan Hirth, Mike Mariathasan, Piet Sercu, Bert d’Espallier and Lieven De Moor, as well as participants in seminars at the University of Ljubljana and the 2018 Annual Conference of ECMI for very helpful comments and discussions. The paper received the Best Paper Award at the 2018 Annual Conference of the European Capital Markets Institute (ECMI). We gratefully acknowledge financial support of the National Bank of Belgium (NBB) and ECMI. The opinions expressed are strictly those of the authors and do not necessarily reflect the views of the NBB. We accept full responsibility for any remaining errors.

Thinking ahead for Europe
Contents
1 Introduction ..................................................................................................................................... 1
2 Sovereign credit risk and financial development - previous literature ............................................ 2
2.1 Sovereign credit risk and financial institutions ........................................................................ 4
2.2 Sovereign credit risk and bond and stock markets ................................................................ 7
2.3 International capital flows ....................................................................................................... 9
3 Methodology: Entropy balancing with Heckman selection ............................................................ 10
3.1 Reweighing the control group ............................................................................................... 11
3.2 Selection equation ................................................................................................................ 12
3.3 Output equation: weighted least squares ............................................................................ 15
4 Data ............................................................................................................................................... 15
5 The influence of a sovereign credit rating on financial devel- opment ............................................. 17
5.1 Impact of the sovereign credit rating on the domestic banking sector ................................... 20
5.2 Sovereign credit rating provision and bond market development ......................................... 22
5.3 Sovereign credit ratings and international financial integration ............................................ 24
5.4 Short-term impact of sovereign rating provision .................................................................. 26
6 Robustness checks ......................................................................................................................... 28
7 Conclusion ..................................................................................................................................... 37
References ............................................................................................................................................. 39

1 Introduction
When a country solicits for a sovereign credit rating at one of the globally recognized ratings
agencies (Moody’s, Standard & Poor’s and Fitch), this typically reflects the intention to borrow
internationally. A sovereign credit rating helps to obtain financing from abroad because the
rating serves as a focal point in financial monitoring and acts as an information equalizer in
investment decisions (Boot et al. (2005)). Credit ratings aim to assess the debt issuer’s default
risk and help investors to determine the risk premium they should demand to compensate for
this default risk. When a country gets rated for the first time, uncertainty about the credit
risk of opaque sovereigns reduces significantly, which in turn will help to channel more funds
towards these typically less developed countries.
A sovereign credit rating is of great economic importance for a country that intends to
issue debt securities. Having a credit rating is instrumental for attracting (foreign) investments
because many investors prefer rated securities over unrated ones of apparently similar credit
risk (Cantor & Packer, 1996). Boot et al. (2005) show that credit rating agencies play an
economically meaningful role in reducing financial fragility in two ways. First, the agencies’
credit watch procedures reduce monitoring costs. Second, credit ratings play a crucial role in
the investment allocation decision of institutional investors like pension fund managers who
are bound by regulatory constraints. The importance of sovereign credit ratings is further
highlighted by Kim and Wu (2008) who show that foreign currency debt ratings encourage
financial sector development and are a catalyser in attracting capital flows. They find that
local currency ratings are also important for the development of domestic stock and bond
markets, but local ratings do not help to attract foreign funds. A well functioning local bond
market is important for financial stability because it allows countries to issue longer-term bonds
in local currency. This mitigates the problem of original sin, the notorious currency mismatch
and maturity mismatch in debt positions of emerging economies.
In this paper, we investigate the transmission channels through which a sovereign credit
rating impacts a country’s domestic and international financial development. Figure 1 illus-
trates the idea. We make a distinction between the domestic financial sector and a country’s
integration in the international financial markets. Establishing a causal link between credit
rating provision and financial development is an exercise plagued by endogeneity issues and
selection bias. We control for both problems simultaneously by preprocessing the data with an
entropy balancing approach and a Heckman selection correction. This process ensures a valid

2
comparison of rated and unrated countries. Earlier studies mainly focus on rated countries
only and the impact of down- and upgrades on their financial markets. Our focus is somewhat
different. We investigate whether and to what extent having a sovereign rating has an impact
on a country’s financial development. This differentiation of rated and unrated countries in
terms of financial development has, to our best knowledge, not yet been investigated so far.
The validity of our results depends to a great extent on the precision by which we can match
rated and unrated countries. Therefore, we run a series of robustness checks by applying
alternative matching methods.
We find that when a country receives its initial rating, banks change their asset portfo-
lio. Because new borrowing channels open up for the government, it becomes less dependent
on bank financing. As a result, claims from banks to the government reduce and banks in-
crease their borrowing to the private sector. Because private debt is typically more risky than
sovereign debt, the banks’ risk-weighted assets increase. We also find that a sovereign credit
rating helps to attract foreign investors. After a country is rated, its ratio of inward foreign
direct investments to GDP is three percent higher compared to unrated countries. Foreigners
hold also more portfolio investments from recently rated countries. After receiving the initial
rating, portfolio investments to GDP are one to two percent higher in rated countries, both in
the short and the long term.
The paper is structured as follows. Section 2 reviews the relevant literature on the impact
of sovereign credit risk on a country’s financial market. In Section 3 we explain the entropy
balancing methodology and Section 4 describes the data. We examine the impact of an initial
sovereign credit rating on financial development in Section 5 and in Section 6 we provide the
results of the robustness checks. Section 7 concludes.
2 Sovereign credit risk and financial development - previousliterature
The objective of this paper is to analyze the impact of obtaining a sovereign credit rating on
the financial development of a country. To get a better understanding of the potential spillover
effects of a sovereign credit rating, we describe in the following sections the transmission
channels of sovereign credit risk to the financial system. More specifically, we discuss the
spillover effects from sovereign credit risk to respectively the banking sector, bond and stock
markets and international capital flows. We subsequently develop the hypotheses that will be

3
Sovereign credit rating
Domestic financial market International financial integration
Financial institutions Capital markets
Asset holdings
Liquidity
Guarantees
New bond issues
Bond marketgrowth
Portfolio investmentinflows
Direct investmentinflows
Financial development
Figure 1: The impact of sovereign credit rating provision on financial development

4
tested in Section 5.1
2.1 Sovereign credit risk and financial institutions
Based on a report of a study group at the Bank of International Settlements BIS (2011)
and Drago and Gallo (2017), we distinguish four channels that transmit sovereign credit risks
to financial institutions, notably an asset holdings channel, a liquidity channel, a guarantee
channel and a rating channel. We discuss each of the transmission channels in the following
paragraphs.
First, the asset holdings channel refers to the potential losses in a bank’s balance sheet
assets resulting from a deterioration in sovereign credit risk. Angeloni and Wolff (2012) show
that during the Euro debt crisis in 2011, banks’ holdings of sovereign bonds of vulnerable
countries were severely affected which resulted in a negative stock market performance of
banking shares. This negative effect on stock market performance was only temporary and
the impact of sovereign distress on banks’ performances was highly dependent on the banks’
geographical location. The asset holdings channel is also found to be an important cause
of contagion between bank and sovereign default risk by DeBruyckere et al. (2013) who show
that banks that have high sovereign debt exposures suffer more contagion from sovereign credit
risk. Drago and Gallo (2017) study the impact of sovereign rating revisions on banking activity
and find that a sovereign rating downgrade significantly increases the risk-weighted assets of
banks. Becker and Ivashina (2018) show that a form of financial repression arises in periods
of sovereign financial distress. Governments put pressure on local banks to buy newly issued
government debt at below market rates. As a result, the corporate lending of banks gets
crowded out and the composition of the banks’ assets changes dramatically with an increasing
weight in sovereign debt holdings.
Second, the liquidity channel implies that sovereign financial distress reduces the value of
the collateral to obtain short-term financing from the central bank and the interbank market.
DeBruyckere et al. (2013) and Drago and Gallo (2017) find that the impact of deteriorating
sovereign credit risk on banks’ capital ratios and lending supply is amplified if they rely heav-
ily on short-term funding during periods of sovereign distress. Negative liquidity shocks are
1Throughout the text, we use the terms sovereign credit risk and sovereign credit ratings interchangeablybecause a sovereign credit rating is supposed to be a good proxy for sovereign credit risk.
5
quickly transmitted across banks and internationally. During the European sovereign debt
crisis of 2011, U.S. branches of euro-area banks suffered dollar liquidity shortage in the form of
reduced access to large time deposits from U.S. money market funds. This liquidity shock led
to a decrease in corporate lending in the U.S., which negatively affected U.S. firms’ investment
(Correa et al., 2016). Popov and VanHoren (2014) come to the same conclusion about the
spillover effects of sovereign distress on bank lending. They show that a deteriorating cred-
itworthiness of foreign sovereigns reduces the lending activity of banks holding the distressed
sovereign debt. Directly linking credit ratings banks’ access to funding, Mensah et al. (2017)
and Kim and Wu (2011) show that a positive sovereign rating announcement helps banks to
access capital from the international interbank market at lower costs. Funding costs of banks
in emerging markets are inversely related to the sovereign credit rating of the home country.
The third transmission channel of sovereign credit risk to financial institutions is the guar-
antee channel. The value of government guarantees depends crucially on the government’s
fiscal position. Banks traditionally benefited from an implicit (in some cases even an explicit)
government guarantee which lowered the banks’ funding cost. However, if the fiscal position of
a sovereign deteriorates, so does the value of its government guarantees, which then increases
the cost of funding (Acharya et al., 2014). Correa et al. (2014) emphasize that investors per-
ceive sovereign and bank risks as interconnected through the government guarantee channel.
They find that sovereign rating downgrades have a pronounced negative impact on banks’ stock
returns, especially if these banks are expected to receive strong support from their government.
Alter and Schuler (2012) find that sovereign CDS spreads impact the spreads of banks’ CDS
after the government interventions on distressed banks during the European debt crisis. The
government guarantee channel is especially relevant for large financial institutions that are con-
sidered to be too-big-to-fail. For large banks, the government is expected to intervene when
a default is imminent. Seemingly contradicting this expectation, DeBruyckere et al. (2013)
find that in general global banks are less sensitive to spillover effects from increased sovereign
credit risk. However, the impact of bank size on the spillover effects of sovereign credit risk is
reversed when tested on domestic banks. The excess correlation between bank default risk and
the home country’s sovereign credit risk is larger for large domestic banks because these banks’
perceived riskiness depends crucially on the probability of government intervention.2 Williams
2Excess correlation is equal to the correlation between bank and sovereign CDS spreads over and above whatis explained by common factors.

6
et al. (2015) assess the impact of sovereign rating actions on banks in emerging countries and
find that the guarantee channel does not play a role of importance to explain the impact of
sovereign downgrades on bank valuation. Instead, Williams et al. find the rating channel as
discussed below to be the main transmission channel of sovereign credit risk to bank valuation.
The fourth transmission channel of sovereign to financial institutions’ default risk is identi-
fied as a rating channel, which implies that sovereign credit ratings have a strong spillover effect
on the home country’s bank ratings (Alsakka et al., 2014, Williams et al., 2013). The sovereign
debt ceiling plays a crucial role here. Empirical evidence has shown that credit ratings of
private-sector bonds are typically lower than the sovereign ratings of the home country of the
bond issuers (Borensztein et al., 2013). Williams et al. (2013) study the impact of sovereign
rating actions on bank ratings in emerging markets and find that bank ratings in emerging
countries closely follow the ratings of their home country, irrespective of the ownership struc-
ture of the bank (state-owned, foreign-owned, or local privately-owned). In a follow-up study,
Williams et al. (2015) show that sovereign credit rating actions have a significant effect on
emerging market bank valuations, especially when the rating action considers new rating in-
formation. The sovereign rating actions of S&P are found to have the biggest effect on bank
valuation.
The literature on the transmission of sovereign credit risk to the banking sector allows us to
develop testable hypotheses regarding the impact of a sovereign credit rating provision. Based
on the asset holdings transmission channel we expect that a sovereign credit rating provision
has a positive effect on the banks’ total assets. Not only do we expect a growth in bank assets,
we also argue that the composition of the asset portfolio may change. When sovereigns are able
to tap international bond markets, they are no longer solely dependent on bank borrowing. As
a consequence, banks will have spare funds to grant more loans to the private sector. Because
of the sovereign debt rating ceiling, the rebalancing of the banks’ asset portfolios may result
in higher risk-weighted assets. Thus, we define the first set of hypotheses as follows:
Hypotheses set 1: In recently rated countries a) banks’ assets are larger, b) banks provide
more (less) credit to the private sector (sovereign state), and c) banks have higher risk-weighted
assets than in unrated countries.
We also want to assess the effect of a sovereign credit rating provision on the liquidity
position of banks. The literature shows that a positive sovereign credit risk event improves the
liquidity position of banks. Receiving an initial credit rating may be considered as a positive
7
rating event because the rating provision reduces information asymmetries and monitoring
costs for banks. Hence, we expect that banks’ access to short term capital improves. We
formulate the second set of hypotheses as:
Hypotheses set 2: In recently rated countries a) banks experience a larger growth in liquid
assets, b) banks experience a larger growth in short term liabilities, and c) financial liquidity
is higher than in unrated countries.
2.2 Sovereign credit risk and bond and stock markets
The literature on the importance of sovereign credit ratings for stock and bond market focuses
on market responses to rating changes with respect to (i) return and volatility, (ii) market
liquidity and (iii) cross-country contagion. Although each of the studies discussed in the
following paragraphs investigate the impact of sovereign credit risk on different aspects of bond
or stock markets, there are two common threads. First, negative rating events like downgrades
and negative outlooks have a significant effect on the capital markets, while upgrades hardly
seem to matter. Second, the impact of rating events on stock and bond markets is larger for
countries with lower levels of development.
Several studies have demonstrated that a change in the home country’s sovereign credit
rating or its outlook has a significant effect on bond yields, stock returns and stock and bond
market volatility. The effects of rating changes on bond and stock returns are stronger for
countries with high inflation and bigger fiscal deficits (Pukthuanthong-Le et al., 2007). For
bond market returns, Pukthuanthong-Le et al. (2007) find that a change in the rating outlook
has a greater impact than actual rating up- or downgrades, suggesting that investors anticipate
the change in a rating. The effect of a change in the outlook is asymmetric: only negative
rating announcements have a discernible impact on bond and equity returns and volatility
(Afonso et al., 2014, Brooks et al., 2004, Pukthuanthong-Le et al., 2007, Treepongkaruna and
Wu, 2012).3 The effects of a rating downgrade are magnified during crises, and especially in
case of a loss of investment grade status. An imminent downgrade further destabilizes the
stock market by increasing the volatility and depressing market returns (Brooks et al., 2015).
Sovereign credit rating announcements also affect market liquidity because investors re-
3An exception is Hooper et al. (2008), who finds that upgrades significantly improve the return and decreasethe volatility of U.S. dollar denominated stocks.

8
balance their portfolios with rating announcements inducing international capital flows from
downgraded to upgraded countries (Gande and Parsley, 2014, Kim and Wu, 2008). Sovereign
rating downgrades induce significant capital outflows, especially for countries that score badly
on the transparency index. Odders-White and Ready (2005) study the relationship between
corporate credit ratings and stock market liquidity and find both to be inversely related. That
is, companies with high effective and quoted bid-ask spreads have poor credit ratings. Studying
the impact of sovereign debt rating changes on stock market liquidity, Lee et al. (2016) find
a positive relationship between sovereign rating events and stock market liquidity. In line
with what is found for returns, only downgrades seem to have an impact on the stock market.
Especially losing the investment grade status has a strongly negative effect on stock market
liquidity, while the positive impact of rating upgrades is negligible.
Sovereign credit ratings serve as an important channel of international financial contagion
in emerging countries, and this contagion effect is magnified during crisis periods (Li et al.,
2008, Glick and Rose, 1999, Ferreira and Gama, 2007, Kaminsky, 2002). Contagion of sovereign
credit risk to neighboring countries is also found when credit risk is measured by bond or CDS
spreads. The contagion effects of sovereign spreads and ratings are found to be asymmetric,
downgrades and increases in credit spreads have a much large effect than upgrades or narrowing
spreads. One exception to this finding is Ismailescu and Kazemi (2010) who find that positive
rating events have a greater impact on CDS markets and they are more likely to spill over
to other emerging countries, while negative events are found to be anticipated by the market.
Christopher et al. (2012) provide evidence for positive rating spillover effects in the stock
markets and negative rating spillover effects in the bond markets. Rating upgrades benefit other
countries’ stock markets in the region, while rating downgrades result in investors shifting their
funds from the downgraded stock market to neighboring countries’ stocks. So sovereign ratings
and outlooks are positively related to regional stock market co-movement. In bonds markets
however, sovereign ratings and outlooks negatively impact cross-country market movements,
suggesting contagion during rating downgrades.
In this study, we will assess the impact of a sovereign credit rating provision on the devel-
opment of a country’s bond markets.4 We assume that countries solicit for a sovereign credit
4We do not look at the impact of a rating provision on the stock market because of data scarcity. Our sampleis limited to countries that received a credit rating after 2000. These are all low developed countries, most ofwhich do not have a stock exchange.

9
rating when they have the intention to issue internationally traded debt securities in the future.
Therefore, we expect that receiving a sovereign credit rating has an immediate effect on the
country’s bond markets and on the issuance activity of international bonds. Also the provision
of a sovereign credit rating can be considered as a positive rating event because it reduces in-
formation asymmetries regarding the country’s default risk. The availability of a credit rating
provided by a globally recognized rating agency also lowers the monitoring costs for banks.
Because in our setting a rating event refers to obtaining a long-term foreign currency rating,
the hypotheses regarding the effect of a sovereign credit rating provision on the bond markets
are stated as follows:
Hypotheses set 3: Recently rated countries a) issue a higher (lower) amount of foreign
(local) currency denominated debt, b) issue longer maturity debt, and c) face lower borrowing
costs than unrated countries.
In the following section we turn to the importance of sovereign credit risk in attracting
international investors.
2.3 International capital flows
If countries are open to investments from abroad, capital can be attracted under the form of
foreign direct investments (FDI) or portfolio investments. Conditional on sufficient absorptive
capacities, foreign capital can contribute significantly to economic growth. In the case of FDI,
there is an additional benefit for the host country because FDI typically comes with a transfer
of know-how and technology from the home to the recipient country (Borensztein et al., Pra).
Although foreign capital has the potential to boost economic growth in the country, foreign
investors can also disrupt the economy and may be a cause of instability. The literature shows
that both net and gross capital flows are volatile and pro-cyclical.5 There is a retrenchment
in capital inflows during crisis periods (Broner et al., 2013, Palma, 2002, Mohamed, 2006).
Albuquerque (2003) shows that FDI inflows are far less volatile than other forms of foreign
capital flows because investments in FDI are much harder to unwind than portfolio holdings.
Over the last two decades, developing countries have attracted a steadily increasing amount
of foreign capital under the form of FDI, portfolio debt and portfolio equity flows. This devel-
5Net capital flows are equal to the difference in gross capital flows, i.e. the net purchases of domestic assetsby foreign investors minus the net purchases of foreign assets by domestic investors.

10
opment was caused by the surging capital account liberalization process of the host countries
combined with periods of near-zero interest rates in the developed countries which led to a
search for yield by investors residing in these countries. Konopczak and Konopczak (2017)
show that foreign capital flows are related to sovereign credit risk in two opposing ways. On
the one hand, the increasing demand for a country’s debt securities decreases bond yields.
On the other hand, the over-reliance on external financing and the increased vulnerability to
sudden stops of capital inflows increases the sovereign bond yields. There is empirical evidence
that for emerging markets, the demand effect outweighs the vulnerability effect (for example
Carvalho and Fidora (2015), Andritzky (2012). Yet, Konopczak and Konopczak (2017) find
that the effects depend on the length of the time horizon studied. They show that in the
short run, the demand effect prevails reflecting the immediate effect of demand pressure. In
the long run however, the emerging market sovereign yields increase with increasing foreign
capital flows, reflecting a dominance of the vulnerability effect.
Investigating the drivers of capital flows into BRICS countries, Swamy and Narayana-
murthy (2018) find that, amongst other factors, sovereign credit ratings have a significantly
positive effect on inward foreign capital. Similarly, Kim and Wu (2008) show that FDI inflows,
international banking and portfolio inflows increase significantly when long-term foreign cur-
rency ratings of emerging countries improve. Thus, based on the literature, we expect to find
a positive effect of a sovereign credit rating provision on a country’s inflow of foreign capital
because of a reduction of information gathering costs for foreign investors. This assumption
leads to the following set of hypotheses:
Hypotheses set 4: Recently rated countries a) attract more FDI inflows, b) attract more
foreign investors in debt and equity instruments, and c) have more internationally oriented
banks than unrated countries.
3 Methodology: Entropy balancing with Heckman selection
The establishment of a causal relationship between sovereign credit rating provision and a
country’s financial development is challenging because of potential endogeneity issues and a
sample selection bias. Endogeneity problems occur when the dependent variable is measured
with error, the predictor(s) and the dependent variable are determined simultaneously, or if the
model suffers from omitted variables. We solve the endogeneity issue in several ways. First, we
apply an entropy balancing approach to preprocess the data to obtain a well-balanced sample.

11
A detailed description of this approach is provided in the following paragraphs. Second, we
control for simultaneity by using lagged values of the predictors in our panel regressions. Third,
we control for country and time fixed effects to address a potential omitted variable bias. In
addition, our selection of variables is based on a broad literature review and continuous and
time-varying variables are added to the model based on a two-directional selection process.
Apart from endogeneity, a self selection bias may occur in our sample of rated countries. This
is because sovereign credit ratings are typically solicited for by the government. A country
that solicits for a credit rating has prepared for a credit risk evaluation process and therefore
a sovereign credit rating cannot be considered as a random event. We address the sample
selection bias by following a three-stage approach, combining the entropy balancing approach
with the Heckman two-stage model (Heckman, 1976, 1979). Entropy balancing addresses the
selection bias due to observed characteristics by eliminating the difference between two groups
such that an exact matching of moments is obtained in the final sample. The Heckman tow-
stage model addresses the selection bias due to unobserved characteristics. To summarize, the
model structure is as follows:
1. Compute the rebalancing weights for the control group
2. Determine the Inverse Mills Ratio (IMR) from the selection equation
3. Estimate a weighted least squares model controlling for the IMR
Each stage of the methodology is explained in detail below.
3.1 Reweighing the control group
In the first stage of our methodology, we apply the entropy balancing data preprocessing
technique developed by Hainmueller (2012) to achieve a covariate balance between the treated
group and the control group.6 In our setting, treatment refers to obtaining a sovereign credit
rating. In entropy balancing, a covariate balance is obtained by imposing a set of balance
constraints that require an equal pretreatment of the covariate means, variances and skewness
across the treated and the non-treated groups. By doing so, it is ensured that the sample of
unrated countries contains units that are as similar as possible to the rated countries.
6Since its introduction by Heinmueller, the entropy balancing technique is commonly used in observationalstudies with binary treatments. In an economic context, entropy balancing has been applied by Neuenkirch andNeumeier (2016) and Balima (2017).

12
In our research setup, obtaining a sovereign credit rating represents the treatment while
the level of financial development (for example the size of the banking sector) represents the
outcome variable. The units of observation are country-year observations. We consider a
sample of n1 countries that are rated during our sample period as the treatment group and a
sample of n0 countries for which a rating is absent for all years as the control group. Each unit
i is exposed to a binary treatment Ri ∈ {1, 0}; Ri = 1 if unit i has a rating and Ri = 0 if i has
no rating. Next, we consider X, a matrix of J exogenous pretreatment variables, where Xi,j
refers to the value of the j th characteristic for unit i such that Xi = [Xi,1, Xi,2, ..., Xi,J ] is the
row vector of characteristics for unit i. The densities of the treatment group (control group)
are denoted as fX|R=1 (fX|R=0). Yi(Ri) denotes the pair of potential outcomes that country i
attains if it is rated or not. Observed outcomes, i.e. levels of financial development (FinDev),
for each country are realized as FinDevi = FinDevi(1)Ri + (1−Ri)FinDevi(0) such that we
simultaneously observe the triple (Ri, F inDevi, Xi).
The measure of interest is the average treatment effect on the treated country (ATT), which
is defined as:
ATT = E[FinDev1|R = 1]− E[FinDev0|R = 1] (1)
The first expectation in equation (1) is the level of financial development when a country is
rated. This can be easily estimated from the treatment group data. The second expectation
in equation (1) is unobserved. It is the counterfactual outcome for a country that is rated, i.e.
the level of financial development that a country would have if it was not rated. To estimate
the unobservable expectation, an appropriate proxy should be used. If being rated is a random
event, we could compute the ATT by simply comparing the level of financial development of
rated and unrated countries (Balima, 2017). However, we expect that being rated is endogenous
to macroeconomic variables. One way to solve this is to use a matching approach to mimic
randomization with respect to the assignment of the credit rating. In entropy balancing,
the rated and unrated units are matched as close as possible with respect of pretreatment
characteristics that are (1) correlated with being rated or not and (2) associated with the level
of financial development. Thus, equation (1) can be rewritten as follows:
ATT = E[FinDev1|R = 1, X = x]−∫E[FinDev0|R = 0, X = x]fX|R=1(x)dx, (2)
where x is a vector of pretreatment characteristics that affect both the likeliness of being rated
and the level of financial development. The last term in equation (2) is equal to the covariate
adjusted mean, or the estimated mean of Y in the source population if its covariates were
13
distributed as in the target population (Hainmueller, 2012).
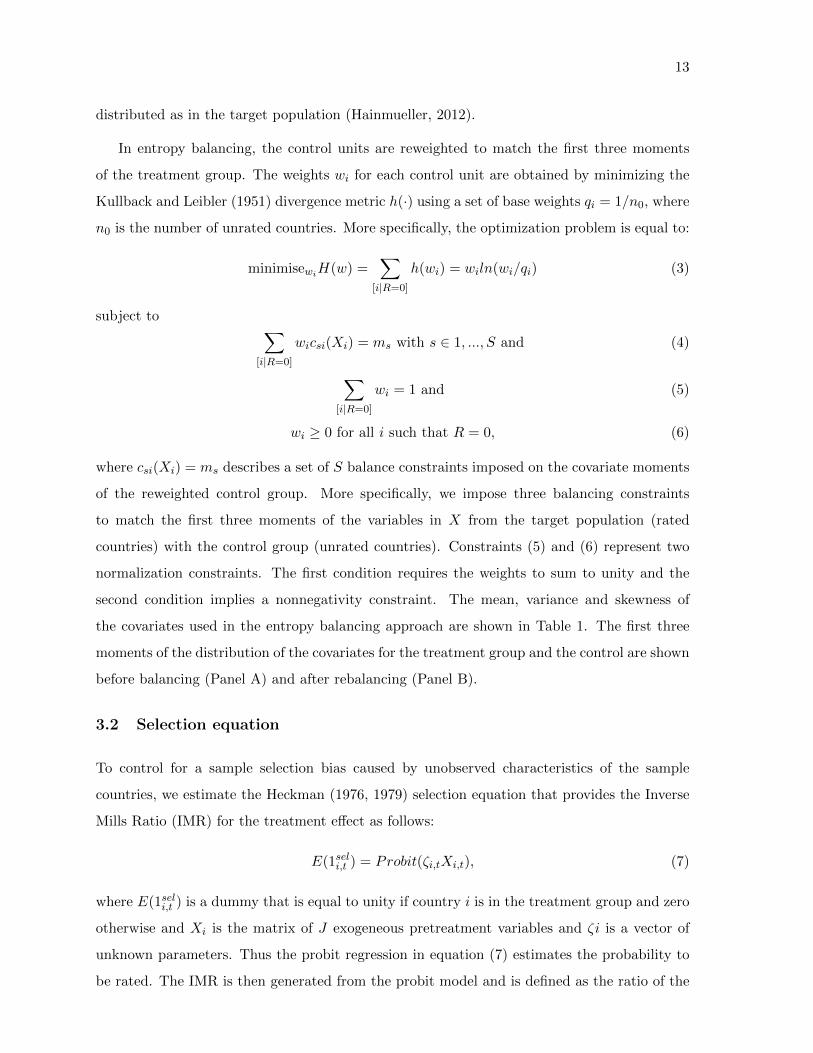
In entropy balancing, the control units are reweighted to match the first three moments
of the treatment group. The weights wi for each control unit are obtained by minimizing the
Kullback and Leibler (1951) divergence metric h(·) using a set of base weights qi = 1/n0, where
n0 is the number of unrated countries. More specifically, the optimization problem is equal to:
minimisewiH(w) =∑
[i|R=0]
h(wi) = wiln(wi/qi) (3)
subject to ∑[i|R=0]
wicsi(Xi) = ms with s ∈ 1, ..., S and (4)
∑[i|R=0]
wi = 1 and (5)
wi ≥ 0 for all i such that R = 0, (6)
where csi(Xi) = ms describes a set of S balance constraints imposed on the covariate moments
of the reweighted control group. More specifically, we impose three balancing constraints
to match the first three moments of the variables in X from the target population (rated
countries) with the control group (unrated countries). Constraints (5) and (6) represent two
normalization constraints. The first condition requires the weights to sum to unity and the
second condition implies a nonnegativity constraint. The mean, variance and skewness of
the covariates used in the entropy balancing approach are shown in Table 1. The first three
moments of the distribution of the covariates for the treatment group and the control are shown
before balancing (Panel A) and after rebalancing (Panel B).
3.2 Selection equation
To control for a sample selection bias caused by unobserved characteristics of the sample
countries, we estimate the Heckman (1976, 1979) selection equation that provides the Inverse
Mills Ratio (IMR) for the treatment effect as follows:
E(1seli,t ) = Probit(ζi,tXi,t), (7)
where E(1seli,t ) is a dummy that is equal to unity if country i is in the treatment group and zero
otherwise and Xi is the matrix of J exogeneous pretreatment variables and ζi is a vector of
unknown parameters. Thus the probit regression in equation (7) estimates the probability to
be rated. The IMR is then generated from the probit model and is defined as the ratio of the

14
Table 1: Summary statistics of the covariates used in the entropy balancing
Panel A: Before balancingmean variance skewness
treat control treat control treat control
GDP per capita 7.0705 6.8783 1.1813 1.5372 0.2244 0.8998FCY reserves 6.4640 5.2818 5.2375 7.5927 -1.1946 -0.3527Unemployment 0.1014 0.0655 0.0069 0.0037 1.2070 1.6981Trade/GDP 0.7872 0.7228 0.1281 0.1277 1.4043 1.0516Current account/GDP -0.0682 -0.0593 0.0066 0.0191 0.2179 0.7394Inflation 0.0711 0.0682 0.0076 0.0043 1.6040 0.4922GDP growth 0.0507 0.0400 0.0011 0.0015 0.1457 0.8714External debt/GDP 0.5202 0.5380 0.1481 0.2812 1.9755 2.8512Previous default 0.2087 0.1776 0.1053 0.0924 1.5021 1.7719Rule of law -0.4663 -0.6613 0.2853 0.4751 0.5584 0.5085Government effectiveness -0.4756 -0.7653 0.2059 0.4307 0.6297 0.7579Political stability -0.3641 -0.4318 0.6354 0.9556 -0.0711 0.0286Banking crisis 0.0102 0.0096 0.0102 0.0091 9.7345 10.2221
Panel B: After balancingmean variance skewness
treat control treat control treat control
GDP per capita 7.0705 7.0705 1.1813 1.1813 0.2244 0.2244FCY reserves 6.4640 6.4640 5.2375 5.2375 -1.1946 -1.1946Unemployment 0.1014 0.1014 0.0069 0.0069 1.2070 1.2070Trade/GDP 0.7872 0.7872 0.1281 0.1281 1.4043 1.4043Current account/GDP -0.0682 -0.0682 0.0066 0.0066 0.2179 0.2179Inflation 0.0711 0.0711 0.0076 0.0035 1.6040 0.4107GDP growth 0.0507 0.0507 0.0011 0.0011 0.1457 0.1457External debt/GDP 0.5202 0.5202 0.1481 0.1481 1.9755 1.9755Previous default 0.2087 0.2087 0.1053 0.1053 1.5021 1.5021Rule of law -0.4663 -0.4663 0.2853 0.2853 0.5584 0.5584Government effectiveness -0.4756 -0.4756 0.2059 0.2059 0.6297 0.6297Political stability -0.3641 -0.3641 0.6354 0.6354 -0.0711 -0.0711Banking crisis 0.0102 0.0102 0.0102 0.0102 9.7345 9.7345
Note: The rated countries are the treatment group (treat) and the unrated countries represent the control group.

15
standard normal density φ divided by the standard normal cumulative distribution function
Φ:
IMR(ζ̂) =φ(ζ̂X)
Φ(ζ̂X)(8)
3.3 Output equation: weighted least squares
In the third stage, the weights estimated from the first stage are used in a weighted least
squares (WLS) regression where a measure of financial development FinDev for country i in
year t is explained by a dummy variable R that controls for a country being rated or not in
the previous year. The WLS regression specification is as follows:
FinDevi,t = α+ βRi,t−1 +∑j=1,J
γjXi,j,t−1 + δIMRi,t + εi,t, (9)
The control variables Xi,j are added to the regression model in a step-wise manner. The data
has an unbalanced panel structure, and we control for country and time fixed effects.
Compared to other data preprocessing methods like propensity score matching, entropy
balancing provides specific advantages. First, in contrast to nearest neighbor matching, where
many data points are discarded, entropy balancing reweights all units to achieve balance,
hereby preventing a loss of information. Second, by applying entropy balancing we do not
have to specify an empirical model for the rating event, which avoids potential problems of
model misspecification or multicollinearity (Neuenkirch and Neumeier, 2016). Third, after
running a horse race between different propensity scoring methods and entropy balancing,
Harvey et al. (2017) conclude that entropy balancing achieves higher estimation accuracy. In
addition, they show that entropy balancing does not require post-processing of the data and
effectively mitigates the selection bias in observational studies. Nevertheless, we provide the
estimation results using propensity score matching, propensity score weighting and a matched
difference-in-difference analysis in the section with robustness checks.
4 Data
We collect data for countries that received an initial credit rating in the year 2000 or later,
the treatment group, and for unrated countries, the control group. Table 2 shows the list of
rated countries, the date of the initial rating, the credit rating received and the name of the
agency that assigned the initial rating. The last column in Table 2 shows the period full period

16
for which data is available. Credit ratings and the initial rating dates are obtained from the
websites of the rating agencies and from Thomson Reuters. All the 24 rated countries are
developing countries and the variety in the initial ratings is minimal. Initial ratings range
from B+ for twelve countries to CCC+ for Malawi. The low variety in initial sovereign credit
ratings justifies the interpretation of the rating event as a binary treatment. One could argue
that the impact of sovereign credit rating provision is conditional upon the level of the rating.
This cannot be tested in this setting since all ratings are fairly similar. The control group
consists of 24 developing countries that are unrated on December 31st, 2016.7
Table 2: Treatment group: Recently rated countries
Country Initial rating date Initial rating Agency Sample period
Albania 2007-06-29 B+ Moody’s 1999–2016Angola 2010-05-19 B+ Moody’s 1999–2016Armenia 2006-05-24 BB- Fitch 1999–2016Bangladesh 2010-04-05 BB- S&P 1999–2016Belarus 2007-08-21 B+ S&P 1999–2016Benin 2003-12-29 B+ S&P 1999–2016Bosnia And Herzegovina 2004-03-29 B- Moody’s 1999–2016Cambodia 2007-04-19 B+ S&P 1999–2016Cameroon 2003-09-04 B Fitch 1999–2016Cape Verde 2003-08-15 B+ Fitch 1999–2016Ethiopia 2014-05-09 B+ Moody’s 1999–2016Georgia 2005-12-06 B+ S&P 1999–2016Ghana 2003-09-04 B+ S&P 1999–2016Kenya 2006-09-08 B+ S&P 1999–2016Macedonia 2004-07-30 BB S&P 1999–2016Madagascar 2004-05-25 B S&P 1999–2016Malawi 2003-05-20 CCC+ Fitch 1999–2015Mali 2004-04-30 B- Fitch 1999–2014Nigeria 2006-01-30 BB- Fitch 1999–2016Rep Of Congo 2013-10-11 BB- Moody’s 1999–2015Seychelles 2006-09-14 B S&P 1999–2016St. Vincent And The Grendines 2007-12-10 B+ Moody’s 1999–2016Uganda 2005-03-17 B Fitch 1999–2015Zambia 2011-03-02 B+ Fitch 1999–2016
Our proxies for financial development focus on the banking sector, the bond market and in-
ternational financial integration. A description of the variables and the data source is provided
in Table 3. A first aspect of financial development is the growth of the local banking sector.
We measure composition and the size of the assets of the domestic banking sector by (1) the
ratio of bank claims on the government to GDP, (2) the ratio of domestic credit provided by
7The unrated countries are Afghanistan, Algeria, Bhutan, Brunei, Burundi, Comoros, Djibouti, Guinea,Guinea Bissau, Guyana, Haiti, Maldives, Myanmar, Nepal, Niger, Samoa, Sao Tome and Principe, SierraLeone, Swaziland, Tanzania, Togo, Tonga, Vanuatu, Zimbabwe.

17
the banking sector to GDP, (3) the ratio of total bank assets to GDP, and (4) the change in
the banks’ risk-weighted assets. The liquidity position of the banking sector is measured by
the change in the banks’ liquid assets. We also measure a country’s financial liquidity more
broadly by the variable broad money scaled by GDP. This liquidity measure is used by many
researchers as a proxy of financial development. It reflects the depth of the financial market
and the overall financial liquidity in a country. So it is a more general measure of domestic
financial development than the banking measures.
Our second indicator of financial development is the development of a country’s bond
market. Because our sample consists of developing countries only, data availability is low,
which implies that we are limited to study the effect of a rating provision on bond issuing
activity and on the average bond yield. We measure bond market development by the ratio of
foreign currency (local currency) bond issue size divided by total bond issue size and distinguish
between long-term, medium term and short-term bond issues. We also consider the average
bond yield as a proxy for a country’s borrowing costs.
The third aspect of financial development is the ability to attract foreign capital under the
form of foreign direct investments, portfolio investments and international bank flows. Capital
inflows can come under the form of foreign direct investment or as portfolio investments,
depending on the size of the foreign ownership stake. A foreign involvement of 10 percent or
more of ordinary shares or voting power is considered to be a direct investment, while any
involvement below 10 percent is considered as a portfolio investment. We use the following
capital inflow variables: (1) direct debt investments, (2) direct equity investments, (3) debt
portfolio and (4) equity portfolio investments. All capital inflow variables are scaled by the
home country’s GDP. To measure the internationalisation of the banking sector, we consider
the ratio of foreign loans and deposits of local banks vis-a-vis the banking sector as a percentage
of total domestic bank deposits.
The control variables in the panel regressions are macroeconomic, political and institutional
indicatros. The description of the control variables and their source is provided in Table 4.
5 The influence of a sovereign credit rating on financial devel-opment
We investigate recently rated countries to determine to what extent the sovereign credit rating
had an impact on the country’s subsequent financial development. As illustrated in Figure 1

18
Tab
le3:
Defi
nit
ion
and
sou
rce
ofth
eva
riab
les
mea
suri
ng
fin
anci
ald
evel
op
men
t
Dat
aset
sD
efin
itio
nS
ou
rce
Ban
kin
gse
cto
r
Ban
kcl
aim
son
gove
rnm
ent/
GD
PF
inan
cial
corp
orati
ons’
(exce
pt
centr
al
ban
ks)
claim
son
centr
al
gov
ern
men
td
ivid
edby
GD
P.
TR
–IF
S
Dom
esti
ccr
edit
by
ban
ks/
GD
PF
inan
cial
reso
urc
esp
rovid
edto
pri
vate
sect
ors
by
finan
cial
inst
itu
tion
s(e
xce
pt
centr
al
ban
ks)
thro
ugh
loan
s,tr
ad
ecr
edit
s,n
on
-equ
ity
secu
riti
esan
doth
erac
cou
nts
rece
ivab
les
TR
–W
DI
Ban
kas
sets
/GD
PG
ross
fin
anci
alan
dn
on-fi
nan
cial
ass
ets
of
ban
ks
div
ided
by
GD
PT
R–
IFS
Ris
kw
eigh
ted
asse
tsB
ank
asse
tsw
eigh
ted
acc
ord
ing
tori
skas
esta
bli
shed
inth
eB
ase
lfr
am
ework
TR
–F
SI
Liq
uid
asse
tsL
iqu
idass
ets
incl
ud
ecu
rren
cy,
dep
osi
tsan
doth
erfi
nan
cial
ass
ets
avail
ab
leei
ther
on
dem
an
dor
wit
hin
3m
onth
sor
less
;se
curi
ties
that
are
trad
edin
liqu
idm
arke
tsan
dre
ad
ily
conve
rted
toca
shT
R–
FS
I
Sh
ort-
term
liab
ilit
ies
Sh
ort-
term
liab
ilit
ies
incl
ud
esh
ort
-ter
mel
emen
tsof
deb
tli
ab
ilit
ies
an
dn
etsh
ort
term
mark
etva
lue
of
fin
an
cial
der
ivati
ves
pos
itio
ns
TR
–F
SI
Bro
adm
oney
/GD
PB
road
mon
eyd
ivid
edby
GD
P.
TR
–W
DI
Bon
ds
mark
et
develo
pm
ent
FC
Yis
sues
/tot
alis
sues
Noti
onal
amou
nt
issu
edin
fore
ign
curr
ency
div
ided
by
tota
lam
ount
of
bon
ds
issu
ed.
Con
sid
ered
as
fore
ign
curr
ency
are
(in
alp
habe
t:)
AU
D,
GB
P,
EU
R,
JP
Yor
US
D.
TR
FC
Ylo
ng-
term
issu
es/t
otal
issu
esN
otio
nal
amou
nt
issu
edin
fore
ign
curr
ency
an
db
on
dm
atu
rity>
10
yea
rsd
ivid
edby
tota
lam
ou
nt
of
bon
ds
issu
ed.
TR
FC
Ym
ediu
m-t
erm
issu
es/t
otal
issu
esN
oti
onal
amou
nt
issu
edin
fore
ign
curr
ency
an
db
on
dm
atu
rity>
5yea
rsan
d<
10
yea
rsd
ivid
edby
tota
lam
ou
nt
ofb
on
ds
issu
ed.
TR
FC
Ysh
ort-
term
issu
es/t
otal
issu
esN
otio
nal
amou
nt
issu
edin
fore
ign
curr
ency
an
db
on
dm
atu
rity<
5yea
rsd
ivid
edby
tota
lam
ou
nt
of
bon
ds
issu
ed.
TR
LC
Yis
sues
/tot
alis
sues
Not
ion
alam
ou
nt
issu
edin
loca
lcu
rren
cyd
ivid
edby
tota
lb
on
dn
oti
on
al
issu
ed.
TR
LC
Ylo
ng-
term
issu
es/t
otal
issu
esN
otio
nal
amou
nt
issu
edin
loca
lcu
rren
cyw
ith
matu
rity>
10
yea
rsd
ivid
edby
tota
lam
ou
nt
issu
ed.
TR
LC
Ym
ediu
m-t
erm
issu
es/t
otal
issu
esN
oti
on
alam
ount
issu
edin
loca
lcu
rren
cyw
ith
matu
rity>
5yea
rsan
d<
10
yea
rsd
ivid
edby
tota
lam
ou
nt
issu
ed.
TR
LC
Ysh
ort-
term
issu
es/t
ota
lis
sues
Noti
onal
am
ount
issu
edin
loca
lcu
rren
cyw
ith
matu
rity<
5yea
rsd
ivid
edby
tota
lam
ou
nt
issu
ed.
TR
Bon
dyie
ldA
vera
ge
yie
ld-t
o-m
atu
rity
of
fixed
-cou
pon
10-y
ear
trea
sury
bon
d.
IFS
Inte
rnati
on
al
fin
an
cia
lin
tegra
tion
Dir
ect
deb
tin
vest
men
t/G
DP
Dir
ect
inve
stm
ent
invo
lvin
gd
ebt
secu
riti
eson
rep
ort
ing
econ
om
yd
ivid
edby
GD
P.
TR
–II
P
Dir
ect
equ
ity
inve
stm
ent/
GD
PD
irec
tin
vest
men
tin
volv
ing
equ
ity
an
din
vest
men
tfu
nd
shar
eson
rep
ort
ing
econ
omy
div
ided
by
GD
P.
TR
–IIP
Por
tfol
iod
ebt
inve
stm
ent/
GD
PP
ortf
oli
oin
ves
tmen
tth
atse
rve
as
deb
tse
curi
ties
inves
ted
on
rep
ort
edec
on
omy
div
ided
by
GD
P.
CP
IS
Por
tfol
ioeq
uit
yin
vest
men
t/G
DP
Port
foli
oin
vest
men
ton
equ
ity
and
inve
stm
ent
fun
dsh
are
son
rep
orte
dec
onom
yd
ivid
edby
GD
P.
CP
IS
For
eign
loan
san
ddep
osit
sF
ore
ign
loans
and
dep
osit
sof
rep
ort
ing
ban
ks
vis
-a-v
isth
eb
ankin
gse
ctor
(%of
dom
esti
cb
an
kdep
osit
s)G
FD
Note:TR:Thomso
nReutersEikon;IM
F:In
ternationalM
oneta
ryFund,IF
S:In
ternationalFin
ancialSta
tistics,
FSI:
Fin
ancialSoundness
Indicato
rs,
WDI:
World
BankW
orld
DevelopmentIn
dicato
rs,
GFD:Globa
lFin
ancialData
base
,ID
S:In
ternationalDebtSta
tistics,
OE:Oxford
Eco
nomics,
WEO:W
orld
Eco
nomic
Outlook,W
GI:
World
BankW
orld
Governance
Indicato
rs,
DOTS:Direc
tion
ofTra
deSta
tistics

19
Tab
le4:
Defi
nit
ion
and
sou
rces
ofth
eco
ntr
olva
riab
les
Data
sets
Defi
nit
ion
Sou
rce
Cu
rren
tac
cou
nt/
GD
PC
urr
ent
acco
unt
bal
an
ceof
the
rep
orti
ng
econ
om
y(%
of
GD
P)
WD
I
Exte
rnal
deb
t/G
DP
Exte
rnal
deb
tst
ock
pos
itio
n(U
SD
)ow
edto
non
-res
iden
ced
ivid
edby
GD
PW
DI,
IDS
,O
E
FC
Yre
serv
esN
atu
ral
loga
rith
mof
fore
ign
curr
ency
rese
rves
.IF
S
GD
Pgr
owth
An
nu
alp
erce
nta
gere
al
GD
Pgro
wth
WD
I,W
EO
GD
Pp
erca
pit
aN
atu
ral
loga
rith
mof
GD
Pp
erca
pit
aW
DI,
WE
O,
OE
Infl
atio
nA
nnu
alin
flat
ion
rate
WD
I
Pol
itic
alst
abil
ity
Pol
itic
alst
abil
ity
an
dab
sen
ceof
vio
len
cein
dex
WG
I
Pre
vio
us
def
ault
Exp
onen
tial
dec
ayva
riab
le.
1fo
rd
efau
lted
/d
ebt-
rest
ruct
ure
dye
art 0
an
dex
pon
enti
all
yd
ecay
at
the
rate
of
40%
till
yeart
+5.
Sta
nd
ard
and
Poor
’s,
Mood
y’s
Def
ault
Dat
abas
e,P
aris
Clu
bA
rch
ive
Ru
leof
law
Ru
leof
law
ind
ex:
con
fid
ence
inth
eru
les
of
soci
ety
WG
I
Gov
ern
men
teff
ecti
ven
ess
Qu
alit
yof
pu
bli
can
dci
vil
serv
ices
an
din
dep
end
ence
of
pol
itic
al
pre
ssure
WG
I
Tra
de/
GD
PT
ota
ltr
ad
eof
the
rep
ort
ing
econ
om
y(%
of
GD
P)
WD
I,D
OT
S,
OE
Un
emp
loym
ent
An
nu
alu
nem
plo
ym
ent
rate
WD
I,W
EO
Ban
kin
gcr
isis
Du
mm
yva
riab
leeq
ual
to1
ifth
eco
untr
ysu
ffer
eda
ban
kin
gcr
isis
inth
ere
spec
tive
yea
rL
aeve
nan
dV
ale
n-
cia
(201
3,20
18)
Note:TR:Thomso
nReutersEikon;IM
F:In
ternationalM
oneta
ryFund,IF
S:In
ternationalFin
ancialSta
tistics,
FSI:
Fin
ancialSoundness
Indicato
rs,
WDI:
World
BankW
orld
DevelopmentIn
dicato
rs,
GFD:Globa
lFin
ancialData
base
,ID
S:In
ternationalDebtSta
tistics,
OE:Oxford
Eco
nomics,
WEO:W
orld
Eco
nomic
Outlook,W
GI:
World
BankW
orld
Governance
Indicato
rs,
DOTS:Direc
tion
ofTra
deSta
tistics
20
in the introduction, we distinguish between domestic financial development and international
financial integration. The domestic financial development of a country is measured through
the banking sector and the domestic bond market. As an element of international financial
integration, we study the impact of the credit ratings on foreign direct investment, equity and
debt holdings of foreigners, the participation in international bond markets and international
bank flows.
5.1 Impact of the sovereign credit rating on the domestic banking sector
We study the impact of sovereign credit rating provision on the banking sector by focusing
on the banks’ assets, notably the amount of claims on the government and credit provided to
the private sector. We also consider whether the banks’ size, measured by their total assets
changes after the sovereign receives its initial rating. Countries that do not have a credit rating
rely for their financing mainly on banks, while rated sovereigns can tap a wider set of financing
sources. Therefore, we expect that banks will hold a lower proportion of sovereign debt and a
higher amount of private sector debt once a country is rated. This as a simple consequence of
the fact that governments borrow from different lenders, once rated by a globally recognized
rating agency. We also scrutinize the change in banks’ risk-weighted assets. Risk-weighted
assets of domestic banks may change when a country receives an initial credit rating because
of two reasons. First, the risk weight of the existing government debt may change if the initial
rating is above BB+ or below B-. According to Basel capital regulations, the risk weight
for unrated sovereign debt is equal to 100%, which is comparable to sovereign bonds with a
BB+ to B- rating. Sovereign debt that is rated below B- has a risk weight of 150%. In our
sample of recently rated countries, Malawi is the only country whose initial rating is below
B-. So the impact of receiving a rating on the risk weights of existing assets should be zero or
negative. A second cause of a change in the risk-weighted assets is a shift in the bank’s asset
portfolio. If, after a country is rated, more sovereign debt is placed elsewhere, the proportion
of corporate and private debt in the bank’s total assets will increase. Since corporate and
private debt are typically riskier than sovereign debt, the rebalancing will lead to an increase
in the risk-weighted assets.
The estimation results for the regressions estimating the impact of sovereign credit rating
provision on the domestic banking sector are reported in Table 5. The variable of interest,
Rated, is highlighted in light grey. We find that when a country obtains a sovereign credit
rating, domestic banks decrease their holdings of sovereign debt and simultaneously increase

21
Tab
le5:
Dom
esti
cfi
nan
cial
dev
elop
men
t:B
ankin
gse
ctor
Bank
clai
ms
ongo
vt.
/GD
PD
omes
tic
cred
itby
ban
ks/
GD
PB
anks
asse
ts/G
DP
∆R
isk
wei
ghte
dass
ets
∆L
iquid
ass
ets
∆Shor
tte
rmliab
ilit
ies
Bro
adm
oney
/G
DP
Bankin
gcr
isis
0.03∗∗∗
−0.0
2−
0.0
4−
0.16∗∗∗
0.22∗∗∗
0.2
8∗−
0.08∗
(0.0
1)
(0.0
5)(0.0
5)(0.0
6)(0.0
3)(0.1
5)(0.0
4)
Curr
ent
acc
ount/
GD
P0.0
20.
17∗∗∗
0.1
4∗∗∗
0.05∗∗
(0.0
2)
(0.0
3)(0.0
4)(0.0
2)G
DP
grow
th−
0.57∗∗∗
−1.8
0∗∗∗
4.0
3∗∗
−0.
18∗∗
(0.1
9)
(0.5
6)(1.9
4)(0.0
9)G
DP
per
capit
a0.
05∗∗∗
−0.
000.
050.2
4∗0.2
5∗0.
01(0.0
1)(0.0
2)(0.0
4)(0.1
3)
(0.1
5)
(0.0
2)G
over
nm
ent
effec
tive
nes
s−
0.09∗∗∗
−0.1
2∗∗
0.18
0.25
(0.0
2)(0.0
6)(0.1
2)(0.2
1)In
flati
on
−0.
05∗
−0.
06−
0.1
0∗−
0.09
0.21
0.25∗
−0.
04∗∗∗
(0.0
3)(0.0
5)(0.0
6)(0.1
5)(0.1
5)
(0.1
4)
(0.0
1)P
olit
ical
stab
ilit
y−
0.01
0.04∗∗∗
−0.0
3−
0.02
0.05
−0.0
2∗∗∗
(0.0
1)
(0.0
1)(0.0
2)(0.0
4)(0.0
6)(0.0
1)R
ule
ofla
w0.
12∗∗∗
0.08∗∗∗
0.2
6∗∗∗
0.81∗∗∗
0.0
90.
04∗∗∗
(0.0
2)(0.0
1)(0.0
3)(0.2
9)(0.1
0)(0.0
1)
Tra
de/
GD
P0.0
1−
0.15
0.39
(0.0
4)(0.2
1)(0.3
9)U
nem
plo
ym
ent
0.00
−0.5
32.0
52.
27
0.39∗∗
(0.1
6)
(0.4
6)(1.3
2)
(2.1
9)
(0.1
9)E
xte
rnal
deb
t/G
DP
0.0
5∗∗∗
0.0
5∗0.
33∗∗∗
0.02
−0.1
7−
0.0
2(0.0
1)(0.0
2)(0.1
1)(0.1
7)(0.1
2)(0.0
2)
Pre
vio
us
def
ault
0.05∗∗∗
0.0
0−
0.34∗∗∗
−0.0
6(0.0
1)(0.0
4)(0.0
6)(0.1
1)F
CY
rese
rves
−0.0
00.2
1∗∗∗
0.12∗∗
0.2
4∗∗∗
0.0
0(0.0
1)(0.0
6)
(0.0
5)(0.0
3)(0.0
0)
Rate
d−
0.03∗∗∗
0.0
3∗∗∗
0.0
2∗∗
0.11∗∗
0.08
0.0
2−
0.01
(0.0
0)(0.0
1)(0.0
1)(0.0
5)
(0.0
6)(0.0
5)(0.0
1)
Inve
rse
Mills
Rat
io−
0.23∗∗
0.26∗∗∗
−0.7
9∗−
1.42∗∗∗
−0.
24
2.05
−0.
04(0.1
1)(0.0
6)(0.4
5)(0.3
5)(0.3
1)
(1.2
7)
(0.0
6)
Obse
rvat
ions
620
661
586
178
182
162
618
R2
0.15
0.08
0.11
0.1
30.
03
0.15
0.03
Cou
ntr
yF
EY
YY
NN
NY
Yea
rF
EY
YY
NN
NY
The
standard
erro
rsare
esti
mate
dacc
ord
ing
toD
risc
oll
and
Kra
ay(1
998)
robust
cova
riance
matr
ixw
ith
four
lags
and
take
into
acc
ount
cross
-sec
tional
dep
enden
ce.
∗∗∗p<
0.0
1,∗∗
p<
0.0
5,∗p<
0.1
22
credit provided to the private sector, which is in line with the portfolio rebalancing hypothesis.
Recently rated countries also have larger balance sheets in terms of total assets. The combined
effect of an increase in total assets and a larger weight of private credit in the asset portfolio
leads to larger growth in risk-weighted assets for rated countries compared to their unrated
counterparts.
We also assess the impact of sovereign rating provision on the liquidity buffer of the domestic
banking sector. As discussed in the literature review, a change in sovereign credit risk is
transmitted through a liquidity channel to the banking sector. We measure the liquidity buffer
of domestic banks by the change in their liquid assets and short-term liabilities. We find that
receiving a sovereign rating leads to an increase in both liquid assets and short-term liabilities,
but we find the impact is not statistically significant.
In the last column of Table 5, we test the effect of a sovereign credit rating on the domestic
money supply in the country. The variable of interest is the amount of broad money scaled
to GDP. The treatment effect for the rating dummy is negative and insignificantly different
from zero. Thus, we find no meaningful effect of sovereign rating provision on the total money
supply.
5.2 Sovereign credit rating provision and bond market development
Receiving a sovereign credit rating has an immediate impact on the international tradability
of a country’s sovereign debt and therefore we expect a strong impact on the development
of the country’s bond market. The distinction between domestic and international bonds is
crucial here since we focus on foreign currency bond ratings. Table 6 shows the impact of a
sovereign credit rating on the proportion of foreign and local currency bond issues relative to
the total bond issues in panels A and B respectively. We make a distinction between long term
(maturity more than ten years), medium term (maturity between five and ten years) and short
term bond (maturity below five years) bond issues. Panel C of Table 6 contains the average
10-year government bond yield.
The estimation results in panel A of Table 6 show that when a country obtains a sovereign
credit rating, the proportion of foreign currency bond issues increases significantly, especially
for long-term foreign currency bonds. This result is not surprising. The credit rating may be
obtained after a government solicited for a rating at one of the rating agencies with the clear
intention to tap the international capital markets by issuing international bonds. The impact

23
Tab
le6:
Bon
ds
mar
ket
dev
elop
men
t:fo
reig
nan
dlo
cal
curr
ency
bon
ds
issu
es
Pan
elA
:F
orei
gnC
urr
ency
Bon
ds
Panel
B:
Loca
lC
urr
ency
Bonds
Panel
C:
Yie
ld
FC
Yis
sues
/tot
alF
CY
long-
term
/tot
alF
CY
med
-ter
m/t
otal
FC
Ysh
ort-
term
/tot
alL
CY
issu
es/t
otal
LC
Ylo
ng-t
erm
/to
tal
LC
Ym
ed-t
erm
/to
tal
LC
Ysh
ort
-ter
m/to
tal
Bond
yie
ld
Ban
kin
gcr
isis
−0.0
1−
0.0
0−
0.0
10.
000.
41∗∗
0.06
0.0
7∗∗
0.16
−0.4
2(0.0
1)(0.0
0)(0.0
1)(0.0
0)(0.1
9)(0.0
4)
(0.0
3)
(0.2
2)
(1.0
6)
GD
Pgr
owth
−0.1
2−
0.2
4∗∗∗
0.0
2−
15.7
6∗
(0.2
2)(0.0
5)(0.0
2)(8.5
8)
GD
Pp
erca
pit
a0.0
5∗∗∗
0.0
3∗∗∗
−0.0
10.
00−
0.49∗∗∗
−0.
18∗∗
−2.5
9∗∗∗
(0.0
2)(0.0
1)(0.0
1)(0.0
0)(0.0
7)(0.0
8)
(0.8
6)
Inflat
ion
0.0
80.0
20.0
2−
0.0
1∗−
0.50∗∗∗
−0.
02
−0.
07
−0.
45∗∗∗
−1.1
2(0.1
1)(0.0
5)(0.0
2)(0.0
0)(0.1
1)(0.0
5)
(0.0
4)
(0.0
8)
(2.2
5)
Pol
itic
alst
abilit
y0.
010.0
1∗−
0.05∗∗
−3.0
0∗∗∗
(0.0
1)(0.0
1)(0.0
2)
(1.1
0)
Pre
vio
us
def
ault
−0.0
2−
0.0
1−
0.21∗∗∗
−0.
16∗∗∗
0.7
3∗
(0.0
2)(0.0
1)(0.0
3)(0.0
4)
(0.4
3)
Rule
ofla
w0.0
10.0
2∗∗∗
0.24∗∗∗
0.09
−0.7
0(0.0
2)(0.0
0)(0.0
6)
(0.1
0)
(0.5
7)
Unem
plo
ym
ent
−0.0
3−
0.1
40.
010.
59
1.00
(0.2
8)(0.0
9)(0.0
3)(0.4
9)
(1.1
3)
Curr
ent
acco
unt/
GD
P0.
030.
080.4
7∗∗∗
0.5
2∗∗∗
−0.
98∗∗
−17.8
8∗∗∗
(0.0
4)(0.3
9)(0.0
9)
(0.0
9)
(0.4
3)
(2.5
3)
FC
Yre
serv
es0.
000.
040.0
2∗0.0
2−
0.01
−0.8
4∗∗
(0.0
0)(0.0
3)(0.0
1)
(0.0
1)
(0.0
1)
(0.3
3)
Gov
ernm
ent
effec
tive
nes
s−
0.0
00.
25∗∗
0.09∗∗∗
−0.
18
(0.0
0)(0.1
0)(0.0
3)
(0.1
3)
Tra
de/
GD
P0.0
0−
0.4
3∗∗
−0.
01
0.0
0−
0.24∗
(0.0
0)(0.1
8)(0.0
2)
(0.0
4)
(0.1
4)
Rat
ed0.0
3∗∗
0.0
1∗∗∗
0.0
00.0
0∗∗∗
−0.
040.
03∗
0.01
−0.
13∗∗
−0.6
8(0.0
1)(0.0
0)(0.0
0)(0.0
0)(0.0
7)(0.0
1)
(0.0
3)
(0.0
5)
(0.6
1)
Inve
rse
Mills
Rat
io−
0.2
2−
0.1
2∗∗∗
−0.0
00.
00−
0.26
−0.
07
0.2
9∗∗∗
−0.
58∗∗
−1.6
3(0.1
3)(0.0
3)(0.0
1)(0.0
0)(0.2
0)(0.0
6)
(0.1
0)
(0.2
3)
(7.5
2)
Obse
rvat
ions
676
676
676
676
676
676
676
676
154
R2
0.4
80.4
90.4
50.
300.
440.3
70.3
70.
41
0.30
Cou
ntr
yF
EY
YY
YY
YY
YY
Yea
rF
EY
YY
YY
YY
YY
Th
est
an
dard
erro
rsare
esti
mate
dacc
ord
ing
toD
risc
oll
an
dK
raay
(1998)
rob
ust
covari
an
cem
atr
ixw
ith
fou
rla
gs
an
dta
ke
into
acc
ou
nt
cross
-sec
tion
al
dep
end
ence
.
∗∗∗p<
0.0
1,∗∗
p<
0.0
5,∗p<
0.1

24
of a credit rating on the size of medium term foreign currency bond issues is not significant.
Obviously, the increase in the proportion of foreign currency bond issues comes at the cost of
local currency bond issues, which is shown in panel B of Table 6. Interestingly, we find that the
substitution effect is not symmetric in terms of maturity. After obtaining a sovereign credit
rating, there is a significantly lower proportion in short term local currency bond issues which
is compensated by a higher proportion of long term foreign currency bond issues. Thus, we find
that obtaining a sovereign credit rating does not help to reduce the problem of original sin in
the strict sense, since countries will issue more debt in a foreign currency, but it does alleviate
the problem of a maturity mismatch. Obtaining a sovereign credit rating allows the country
to issue debt with a longer maturity. Panel C in Table 6 shows that the impact of a sovereign
credit rating provision on the average borrowing costs for the government is estimated to be
negative, but we do not find the coefficient estimate to be statistically significant.
The proportions of foreign versus local currency bond issues show the composition of a
country’s debt issues, but they don’t tell us anything about the growth of the bond market
as a whole. Therefore, in Table 7 we show the impact of sovereign credit rating provision on
the growth of bond issuance, measured by the logratio of the total notional bond issued in
the year after the rating provision relative to the notional amount issued the previous year.
Surprisingly, the results in Table 7 do not provide evidence for growth in a country’s bond
market for recently rated countries. On the contrary, six out of eight coefficient estimates for
the rating dummy are negative, indicating a decrease in issue size, both for foreign currency and
for local currency bonds. For foreign currency bonds, the reduction in issue size is significant
only for medium-term bonds, while the shrinkage in bond issues is more pronounced for local
currency bonds. In short, our analysis reveal that rated countries issue smaller bond issues
than unrated countries, especially when the bonds are issued in local currency.
5.3 Sovereign credit ratings and international financial integration
As a third aspect of financial development, Table 8 shows the impact of receiving a sovereign
credit rating on the international financial integration of a country. We measure international
integration by a country’s ability to attract foreign capital and by the international activities
of its domestic banking sector. The first two columns show the effect of a rating on inward
foreign direct investment (FDI) in a country. The third and fourth column of Table (8) show
the impact of the initial sovereign credit rating on inward portfolio investments, split up in
debt and equity investments respectively. The dependent variable in the last column is equal

25
Tab
le7:
Bon
ds
mar
ket
dev
elop
men
t:gr
owth
ofb
ond
issu
es(n
otio
nal
amou
nt)
∆F
CY
issu
es∆
FC
YL
ong-
term
∆F
CY
Med
-ter
m∆
FC
YShort
-ter
m∆
LC
Yis
sues
∆L
CY
Long-t
erm
∆L
CY
Med
-ter
m∆
LC
YShort
-ter
m
GD
Pgr
owth
12.9
0−
4.69
−0.
83(9.9
4)(3.3
3)
(0.9
7)G
DP
per
capit
a0.
991.
340.
310.3
53.
92∗∗∗
5.3
5∗∗∗
(1.0
5)(0.9
4)
(0.2
7)
(0.2
4)(0.8
6)
(1.3
8)
Inflat
ion
7.21
6.40∗∗
−0.
12−
0.37∗
−5.5
9∗∗∗
−2.3
40.
07
−2.4
1(4.4
5)(3.2
0)(0.2
7)
(0.2
1)(1.2
5)
(4.1
9)
(4.9
1)
(1.9
2)
Pol
itic
alst
abilit
y0.8
3∗0.
61∗∗
6.5
6∗∗∗
(0.4
7)(0.2
8)
(1.6
4)
Pre
vio
us
def
ault
0.09
−0.
11
−0.0
80.0
5(0.5
1)(0.2
2)(0.4
5)
(0.2
6)
Rule
ofla
w−
0.84
0.2
2−
0.54
2.6
5∗∗
(1.4
1)(0.2
5)
(1.2
7)
(1.2
1)
Unem
plo
ym
ent
2.04
−11.0
9−
1.72
0.8
130.
16∗∗
(12.
93)
(7.3
6)
(1.8
5)(2
0.65)
(13.
95)
Curr
ent
acco
unt/
GD
P−
2.11
0.93
−6.8
5−
6.01
−0.6
4(1.9
6)
(2.1
9)
(7.0
7)
(3.8
3)
(2.6
7)
FC
Yre
serv
es−
0.03
1.13∗∗∗
0.9
6∗∗∗
1.23∗∗∗
0.0
4(0.0
4)
(0.4
0)
(0.2
6)
(0.3
9)
(0.1
3)
Gov
ernm
ent
effec
tive
nes
s−
0.46
2.04∗∗
−5.2
1∗∗
2.4
5∗∗
(0.2
9)
(0.8
4)
(2.0
4)
(1.0
1)
Tra
de/
GD
P0.
20−
0.2
4−
1.0
80.
97
0.1
8(0.2
7)
(1.5
1)
(1.6
1)
(3.0
7)
(1.4
8)
Ban
kin
gcr
isis
1.7
7∗∗∗
(0.4
3)
Rat
ed−
1.01
−0.
43
−0.
19∗∗∗
0.06
−1.3
7∗∗∗
−0.9
6∗∗∗
0.52
−1.3
7∗∗
(1.6
8)(0.3
8)
(0.0
7)(0.0
6)(0.4
5)
(0.3
6)
(1.5
0)
(0.5
3)
Inve
rse
Mills
Rat
io2.
04−
1.88
−0.
81∗
−0.
66
4.77∗∗
1.1
1−
3.16
7.4
5∗∗∗
(7.7
6)(1.7
8)
(0.4
2)
(0.5
7)(2.2
0)
(2.6
9)
(2.9
2)
(1.8
7)
Obse
rvat
ions
632
632
632
632
632
632
632
632
R2
0.03
0.05
0.01
0.0
00.
070.1
40.
03
0.0
6C
ountr
yF
EN
NN
NN
NN
NY
ear
FE
NN
NN
NN
NN
Th
est
an
dard
erro
rsare
esti
mate
dacc
ord
ing
toD
risc
oll
an
dK
raay
(1998)
rob
ust
covari
an
cem
atr
ixw
ith
fou
rla
gs
an
dta
ke
into
acc
ou
nt
cross
-sec
tion
al
dep
end
ence
.
∗∗∗p<
0.0
1,∗∗
p<
0.0
5,∗p<
0.1

26
to the amount of external loans and deposits of the banking sector as a percentage of domestic
bank deposits and proxies for the internationalization of the domestic banking sector.
With respect to attracting foreign capital, we find that sovereign credit rating provision
has a significantly positive effect on both direct inward FDI and portfolio investment. When
a country receives a sovereign credit rating its ratio of FDI equity inflows to GDP is three
percent higher than for unrated countries. The positive effect on FDI inflows is found for
equity investments only. For portfolio investments, the rating effect is positive both for debt
and equity investments. More specifically, portfolio investments in debt and equity to GDP
are one percent higher on average for rated countries.
We also find supporting evidence for the hypothesis that sovereign credit ratings improve
the international orientation of banks. The ratio of foreign loans and deposits vis-a-vis the
banking sector to domestic deposits is six percent higher for recently rated countries, on aver-
age, than for unrated countries.
5.4 Short-term impact of sovereign rating provision
The estimation results in Tables 5 to 8 show the long-term effect of a sovereign credit rating
provision on the financial sector following the publication of the initial rating. Developing a
country’s financial sector is a lengthy and challenging process, especially for the countries under
consideration given their initially low levels of development. However, part of the observed
changes in the financial sector during the post-rating period may be attributable to other
events, for which we do not control. Also, the panel regressions are very imbalanced due to
the large variation in initial rating dates. This implies that the rating effect is estimated over
different periods across countries.
In this section we analyse the short-term impact of a credit rating provision. That is, we
only include the first three years post rating for the rated countries. The immediate impact
effect of a sovereign credit rating provision on the banking sector, the bond market and the
international orientation of a country is shown in Tables 9 to 12 respectively. Overall, the short
term impact effect of a sovereign credit rating is in line its long run effect. We find a negative
effect on banks’ holdings of sovereign debt, a positive effect on their holdings of private debt
and a positive impact on banks’ total assets to GDP. Hence, once rated banks experience an
increase in risk-weighted assets. In contrast with the long-run effects, we find that receiving a
sovereign credit rating induces a short-term growth in the banks’ liquid assets. With respect

27
Tab
le8:
Inte
rnat
ion
alfi
nan
cial
inte
grat
ion
:C
apit
alin
flow
s
Dir
ect
deb
tin
vest
men
ts/G
DP
Dir
ect
equit
yin
vest
men
ts/G
DP
Port
folio
deb
tin
ves
tmen
ts/G
DP
Port
folio
equit
yin
vest
men
ts/G
DP
Fore
ign
loans
and
dep
osi
ts
Curr
ent
acco
unt/
GD
P0.
030.
14∗∗
0.00
−0.0
4∗∗
−0.0
5(0.0
4)(0.0
7)
(0.0
2)
(0.0
2)
(0.1
9)
Exte
rnal
deb
t/G
DP
−0.
03∗∗∗
0.1
1∗∗∗
0.03∗∗∗
0.0
1∗∗∗
0.0
3(0.0
1)(0.0
2)
(0.0
1)
(0.0
0)
(0.0
3)
FC
Yre
serv
es−
0.01∗∗∗
0.0
1−
0.00
−0.0
00.
04∗
(0.0
0)(0.0
0)
(0.0
0)
(0.0
0)
(0.0
2)
GD
Pp
erca
pit
a−
0.02∗
0.0
8∗∗∗
0.02∗∗
−0.0
3∗∗∗
−0.4
0∗∗∗
(0.0
1)(0.0
2)
(0.0
1)
(0.0
1)
(0.0
8)
Gov
ernm
ent
effec
tive
nes
s0.0
6∗∗∗
−0.0
5−
0.03
0.0
5∗∗∗
0.2
4∗∗∗
(0.0
1)(0.0
4)
(0.0
2)
(0.0
2)
(0.0
9)
Inflat
ion
−0.
07∗∗∗
−0.0
1−
0.03∗
0.0
2∗∗
0.1
9(0.0
1)(0.0
3)
(0.0
2)
(0.0
1)
(0.1
2)
Pol
itic
alst
abilit
y0.
00−
0.0
2−
0.02∗∗
−0.0
0−
0.0
6(0.0
1)(0.0
2)
(0.0
1)
(0.0
0)
(0.0
4)
Pre
vio
us
def
ault
−0.
010.
01−
0.01
0.0
1(0.0
1)(0.0
2)
(0.0
1)
(0.0
1)
Rule
ofla
w0.0
10.
13∗∗∗
0.01
−0.0
3∗∗∗
−0.2
0∗∗∗
(0.0
1)(0.0
4)
(0.0
2)
(0.0
1)
(0.0
7)
Tra
de/
GD
P0.
020.
19∗∗∗
0.02
−0.0
1−
0.1
8(0.0
2)(0.0
5)
(0.0
2)
(0.0
1)
(0.1
1)
Unem
plo
ym
ent
0.0
1−
0.8
4∗∗∗
−0.
24∗∗
−0.0
6−
3.3
9∗∗
(0.1
1)(0.3
2)
(0.1
1)
(0.0
4)
(1.5
4)
GD
Pgr
owth
−0.8
0∗∗
−0.
35∗
2.4
8∗∗∗
(0.3
7)(0.2
0)
(0.8
0)
Ban
kin
gcr
isis
0.0
2∗−
0.0
0(0.0
1)
(0.0
7)
Rat
ed−
0.00
0.0
3∗∗
0.01∗∗∗
0.0
1∗∗∗
0.0
6∗∗
(0.0
1)(0.0
1)
(0.0
0)(0.0
0)
(0.0
2)
Inve
rse
Mills
Rat
io0.0
5−
0.3
3−
0.30∗∗
−0.0
10.
49
(0.0
4)(0.2
7)
(0.1
4)
(0.0
2)
(0.5
0)
Obse
rvat
ions
422
420
642
642
645
R2
0.27
0.72
0.4
80.4
60.
44
Cou
ntr
yF
EY
YY
YY
Yea
rF
EY
YY
YY
Th
est
an
dard
erro
rsare
esti
mate
dacc
ord
ing
toD
risc
oll
an
dK
raay
(1998)
rob
ust
covari
an
cem
atr
ixw
ith
fou
rla
gs
an
dta
ke
into
acc
ou
nt
cross
-sec
tion
al
dep
end
ence
.
∗∗∗p<
0.0
1,∗∗
p<
0.0
5,∗p<
0.1

28
to the bond market development, the striking difference between the short term and long term
impact of a sovereign credit rating provision is on the average bond yield. Within a period of
three years, obtaining a sovereign credit rating leads to an increase in bond yield of 0.89 percent
on average. The long term impact was estimated to be negative. This indicates that when a
country receives a sovereign credit rating, bond yields initially increase, but over the long run
bond yields decrease. Lastly, we find that recently rated countries attract more equity-based
FDI and foreign investors hold more equity and debt securities as portfolio investments, which
is in line with the estimated effects in the long run.
6 Robustness checks
The validity of our estimation results presented in the preceding sections depends crucially
on the execution of the entropy balancing approach which ensures the comparability between
countries prior to the credit rating event. Yet the matching of the covariates in the control and
treatment groups is not perfect because we are unable to match the variance and skewness of
inflation. Because this mismatch may affect the estimation results, we run a series of robustness
checks for which we report the coefficient estimates of the dummy variable Rated in Table 13
to Table 15. For comparison, the first row of the tables with robustness checks shows the
estimation results for our baseline analysis, notably the entropy balancing approach with a
Heckman selection correction.
As a first robustness check, we apply the entropy balancing approach without the correction
for the selection bias (check 1). Similarly, we also perform the analysis by applying the two-
stage Heckman selection correction only (check 2). In a third check, we focus on the rated
countries only and perform a difference-in-difference (diff-in-diff) analysis. By only considering
the rated countries, we overcome the problem of imperfect matching between rated and unrated
countries. The diff-in-diff framework requires a treatment group dummy, a post-treatment
dummy and the interaction between both. Using only the treatment group in our setting,
the post-treatment and interaction dummy are the same, so the analysis collapses to a simple
difference test on pre and post-rating financial development for rated countries. To solve this
problem and to implement a genuine diff-in-diff framework, we need a post-treatment period for
the control group as well. This is what is done in the fourth robustness check by implementing
a matched diff-in-diff analysis. In a standard diff-in-diff analysis, the intervention time starts
in the same year for both the treatment the control group. However, in our setting, countries

29
Tab
le9:
Sh
ort
term
dev
elop
men
tof
ban
kin
gse
ctor
Ban
kcl
aim
son
govt.
/GD
PD
omes
tic
cred
itby
banks/
GD
PB
anks
ass
ets/
GD
P∆
Ris
kw
eighte
dass
ets
∆L
iquid
ass
ets
∆Short
term
liabilit
ies
Bro
adm
oney
/G
DP
Ban
kin
gcr
isis
0.07∗∗∗
0.06∗∗∗
0.0
10.0
1∗∗∗
(0.0
1)(0.0
1)(0.0
5)(0.0
0)
Curr
ent
acco
unt/
GD
P0.0
10.
12∗∗∗
−0.0
30.0
4(0.0
2)(0.0
3)
(0.0
2)
(0.0
3)
GD
Pgr
owth
−0.5
8∗∗∗
0.6
87.
96∗∗∗
−0.1
3(0.0
8)(0.8
8)
(2.5
1)
(0.0
8)
GD
Pp
erca
pit
a0.
02−
0.01
−0.0
80.1
10.
34∗
−0.0
1(0.0
2)(0.0
3)
(0.0
7)
(0.3
1)
(0.2
0)
(0.0
2)
Gov
ernm
ent
effec
tive
nes
s−
0.0
6∗∗∗
0.0
50.3
8∗∗
0.6
0∗∗
(0.0
1)(0.0
8)
(0.1
5)
(0.2
4)
Inflat
ion
−0.0
9∗∗
−0.
13∗∗∗
−0.0
4−
0.1
4−
0.0
20.
64∗∗∗
−0.0
4∗∗∗
(0.0
4)(0.0
5)(0.0
7)(0.1
9)
(0.2
5)
(0.2
1)
(0.0
1)
Pol
itic
alst
abilit
y−
0.0
10.
03∗∗∗
0.0
2−
0.0
30.
13
−0.0
3∗∗∗
(0.0
1)(0.0
1)(0.0
3)(0.0
5)
(0.0
9)
(0.0
1)
Rule
ofla
w0.1
0∗∗∗
0.04∗∗∗
0.09∗
1.2
1∗∗∗
−0.2
6∗∗
0.0
4∗∗∗
(0.0
1)(0.0
1)(0.0
5)(0.2
0)
(0.1
2)
(0.0
1)
Tra
de/
GD
P0.0
10.0
30.
70
(0.0
4)(0.3
0)(0.4
4)
Unem
plo
ym
ent
0.04
0.9
4∗
4.4
5∗∗∗
5.3
2∗0.6
2∗∗∗
(0.1
5)(0.5
1)(1.3
0)
(2.7
8)
(0.1
4)
Exte
rnal
deb
t/G
DP
0.0
5∗∗∗
−0.
07∗∗
0.2
6−
0.3
4−
0.5
7∗∗∗
−0.0
3∗∗∗
(0.0
1)
(0.0
3)
(0.1
9)(0.2
2)
(0.1
4)
(0.0
1)
Pre
vio
us
def
ault
0.05∗∗∗
0.06
−0.3
6∗∗∗
0.0
6(0.0
2)
(0.0
5)
(0.0
7)(0.1
4)
FC
Yre
serv
es0.0
1∗0.2
1∗∗∗
0.0
80.
26∗∗∗
−0.0
0(0.0
1)
(0.0
6)(0.0
7)
(0.0
4)
(0.0
0)
Rat
ed−
0.0
2∗∗∗
0.04∗∗∗
0.0
3∗∗∗
0.11∗∗
0.0
8∗−
0.0
1−
0.0
0(0.0
1)(0.0
1)(0.0
1)(0.0
5)
(0.0
5)
(0.0
5)
(0.0
1)
Inve
rse
Mills
Rat
io−
0.2
8∗∗∗
0.20∗∗∗
0.6
0−
1.81∗∗∗
−0.3
64.
98∗∗∗
−0.0
3(0.0
5)(0.0
4)
(0.6
3)
(0.3
6)(0.6
5)
(1.6
6)
(0.0
6)
Obse
rvat
ions
487
528
461
100
104
90
485
R2
0.1
10.
010.
050.
14
0.05
0.22
0.01
Cou
ntr
yF
EY
YY
NN
NY
Yea
rF
EY
YY
NN
NY
The
standard
erro
sare
esti
mate
dacc
ord
ing
toD
risc
oll
and
Kra
ay(1
998)
robust
cova
riance
matr
ixw
ith
four
lag
per
iod
and
takes
into
acc
ount
cross
-sec
tional
dep
enden
ce.
∗∗∗p<
0.0
1,∗∗
p<
0.0
5,∗p<
0.1

30
Tab
le10:
Sh
ort
term
bon
dm
arke
td
evel
opm
ent:
bon
ds
issu
es
FC
Yis
sues
/tot
alF
CY
long-
term
/tot
alF
CY
med
-ter
m/t
otal
FC
Ysh
ort-
term
/tot
alL
CY
issu
es/t
otal
LC
Ylo
ng-t
erm
/to
tal
LC
Ym
ed-t
erm
/T
ota
lis
sues
LC
Ysh
ort
-ter
m/to
tal
Bond
yie
ld
Ban
kin
gcr
isis
−0.
02∗∗
−0.
000.0
0∗∗
−0.
00∗∗
1.0
6∗∗∗
0.0
10.0
10.9
4∗∗∗
(0.0
1)(0.0
1)(0.0
0)(0.0
0)(0.1
7)(0.0
1)
(0.0
1)
(0.1
3)
GD
Pgr
owth
−0.
10−
0.41∗∗∗
0.0
3∗∗
−46.5
7∗∗∗
(0.2
4)(0.1
0)(0.0
2)(8.7
3)
GD
Pp
erca
pit
a0.0
30.0
3∗∗∗
0.0
1∗∗∗
−0.0
0−
0.4
2∗∗∗
−0.0
5−
5.6
8∗∗∗
(0.0
2)(0.0
1)(0.0
0)(0.0
0)(0.0
5)(0.1
0)
(1.4
2)
Inflat
ion
0.0
10.0
1−
0.0
0−
0.0
1−
0.6
2∗∗∗
0.0
50.0
3−
0.6
6∗∗∗
−5.5
1∗
(0.0
9)(0.0
5)(0.0
1)(0.0
1)(0.1
1)(0.0
4)
(0.0
4)
(0.1
8)
(3.1
5)
Pol
itic
alst
abilit
y−
0.00
0.0
0∗∗
−0.0
4∗−
4.6
6∗∗∗
(0.0
1)(0.0
0)(0.0
2)
(0.7
4)
Pre
vio
us
def
ault
−0.
01−
0.01
−0.1
1∗∗∗
−0.1
1∗∗∗
−0.4
6(0.0
2)(0.0
1)(0.0
3)(0.0
4)
(0.5
7)
Rule
ofla
w0.0
10.0
00.3
3∗∗∗
0.0
4−
1.6
8∗∗
(0.0
2)(0.0
0)(0.0
8)
(0.0
8)
(0.6
9)
Unem
plo
ym
ent
−0.
04−
0.20∗∗∗
0.0
11.
22∗∗
2.2
1(0.2
4)(0.0
6)(0.0
1)(0.4
7)
(1.5
2)
Curr
ent
acco
unt/
GD
P0.
02−
0.2
20.5
4∗∗∗
0.3
5∗∗∗
−1.1
7∗∗
−11.5
9∗∗∗
(0.0
3)(0.4
4)(0.0
9)
(0.1
0)
(0.4
8)
(2.4
4)
FC
Yre
serv
es0.
000.
03∗
0.0
2∗0.0
3∗∗
−0.0
20.0
6(0.0
0)(0.0
2)(0.0
1)
(0.0
1)
(0.0
1)
(0.2
1)
Gov
ernm
ent
effec
tive
nes
s−
0.0
0∗∗
0.2
8∗∗
0.1
2∗∗∗
−0.2
5∗∗∗
(0.0
0)(0.1
1)(0.0
4)
(0.0
6)
Tra
de/
GD
P0.
00−
0.4
4∗∗
0.0
2−
0.0
3−
0.1
9∗
(0.0
0)(0.1
7)(0.0
3)
(0.0
2)
(0.1
1)
Rat
ed0.
05∗∗∗
0.02∗∗
0.00
0.00∗
−0.0
50.0
10.0
1−
0.1
2∗∗∗
0.89∗∗∗
(0.0
1)(0.0
1)(0.0
0)(0.0
0)(0.0
4)(0.0
1)
(0.0
2)
(0.0
3)
(0.2
2)
Inve
rse
Mills
Rat
io−
0.27∗
−0.
22∗∗∗
−0.
010.
00−
0.3
7∗∗
−0.1
2−
0.2
2∗∗∗
−0.0
4−
24.
77∗∗∗
(0.1
5)(0.0
5)(0.0
2)(0.0
0)(0.1
9)(0.0
8)
(0.0
6)
(0.1
5)
(6.2
1)
Obse
rvat
ions
543
543
543
543
543
543
543
543
106
R2
0.35
0.4
70.4
90.
090.
440.4
60.3
00.2
20.4
0C
ountr
yF
EY
YY
YY
YY
YY
Yea
rF
EY
YY
YY
YY
YY
Th
est
an
dard
erro
sare
esti
mate
dacc
ord
ing
toD
risc
oll
an
dK
raay
(1998)
rob
ust
covari
an
cem
atr
ixw
ith
fou
rla
gp
erio
dan
dta
kes
into
acc
ou
nt
cross
-sec
tion
al
dep
end
ence
.
∗∗∗p<
0.0
1,∗∗
p<
0.0
5,∗p<
0.1

31
Tab
le11
:B
ond
sm
arke
td
evel
opm
ent:
grow
thof
bon
dis
sues
(not
ion
alam
ou
nt)
∆F
CY
issu
es∆
FC
YL
ong-
term
∆F
CY
Med
-ter
m∆
FC
Yis
sues
Shor
t-te
rm∆
LC
Yis
sues
∆L
CY
Long-t
erm
∆L
CY
Med
-ter
m∆
LC
Yis
sues
Short
-ter
m
GD
Pgr
owth
−22.4
9∗∗∗
−7.3
7∗∗
−0.1
3(6.5
8)(3.3
7)(0.3
0)G
DP
per
capit
a1.
071.
54∗∗
0.1
00.0
25.
58∗∗∗
6.07∗∗∗
(0.8
9)(0.6
8)(0.1
0)(0.0
2)(1.2
2)(1.6
3)
Inflat
ion
GD
PD
eflat
or−
2.33∗∗∗
0.5
4−
0.4
5∗∗∗
−0.1
0−
5.0
8∗∗∗
3.38∗∗
5.43∗∗
−0.
72
(0.8
6)(0.8
6)(0.1
6)(0.0
8)(1.2
8)(1.7
1)
(2.7
4)
(1.4
5)
Pol
itic
alSta
bilit
y0.0
20.2
5∗8.
00∗∗∗
(0.3
2)(0.1
5)(1.5
4)
Pre
vio
us
Def
ault
−1.
10∗∗∗
−0.0
1−
0.1
1−
0.04
(0.3
9)(0.2
1)(0.3
6)(0.2
1)
Rule
ofL
aw0.
57−
0.1
50.
55
2.4
9∗
(1.0
2)(0.2
4)(0.7
6)
(1.3
5)
Unem
plo
ym
ent
−8.
76−
9.6
2−
1.66
13.
31
22.
06∗
(19.
57)
(10.6
8)(1.1
4)(2
1.51)
(11.
23)
Curr
ent
A.C
./G
DP
−0.3
6−
1.65
−11.
36∗∗
−6.
58
−3.9
1∗
(1.0
6)(2.3
4)(5.5
3)
(4.3
1)
(2.2
1)
FC
Yre
serv
es−
0.0
7∗∗∗
0.37
1.3
1∗∗∗
0.4
7∗∗∗
−0.3
4∗∗∗
(0.0
2)(0.2
3)(0.3
5)
(0.1
2)
(0.1
0)
Gov
ernm
ent
Eff
ecti
venes
s−
0.13∗∗
2.45∗∗∗
−6.7
9∗∗∗
3.0
1∗∗
(0.0
7)(0.9
3)(1.6
7)
(1.3
5)
Tra
de/
GD
P0.
001.
64∗
−0.9
90.
83
1.6
2(0.0
3)(0.9
5)(1.3
8)
(0.9
0)
(1.4
6)
Ban
kin
gC
rise
s0.8
9∗∗
(0.3
5)
Rat
ed−
0.24
−0.3
5−
0.1
3∗0.1
1∗−
1.6
7∗∗∗
−1.
06∗∗
1.48
−1.
71∗∗∗
(1.2
0)(0.2
9)(0.0
7)(0.0
6)(0.4
3)(0.4
6)
(1.2
1)
(0.5
1)
Inve
rse
Mills
Rat
io−
17.6
1∗∗∗
−0.6
8−
0.4
1−
0.1
13.
25∗
−3.
34∗
−5.
46∗
4.49∗∗∗
(5.4
8)(2.3
6)(0.4
6)(0.2
0)(1.9
6)(1.9
4)
(2.9
8)
(0.6
3)
Obse
rvat
ions
499
499
499
499
499
499
499
499
R2
0.02
0.0
30.
000.0
40.
070.2
70.
03
0.1
0C
ountr
yF
EN
NN
NN
NN
NY
ear
FE
NN
NN
NN
NN
Th
est
an
dard
erro
sare
esti
mate
dacc
ord
ing
toD
risc
oll
an
dK
raay
(1998)
rob
ust
covari
an
cem
atr
ixw
ith
fou
rla
gp
erio
dan
dta
kes
into
acc
ou
nt
cross
-sec
tion
al
dep
end
ence
.
∗∗∗p<
0.0
1,∗∗
p<
0.0
5,∗p<
0.1

32
Tab
le12
:S
hor
tte
rmim
pac
tof
inte
rnat
ion
alin
tegr
atio
n
Dir
ect
deb
tin
vest
men
ts/G
DP
Dir
ect
equit
yin
vest
men
ts/G
DP
Port
folio
deb
tin
ves
tmen
ts/G
DP
Port
folio
equit
yin
vest
men
ts/G
DP
Fore
ign
loans
and
dep
osi
ts
Curr
ent
acco
unt/
GD
P0.
040.
05−
0.01
−0.0
20.
30
(0.0
3)(0.0
5)
(0.0
1)
(0.0
2)
(0.2
1)
Exte
rnal
deb
t/G
DP
−0.
01∗∗
0.0
5∗∗∗
0.02∗∗
0.0
1∗∗∗
0.0
7∗
(0.0
0)(0.0
2)
(0.0
1)
(0.0
0)
(0.0
4)
FC
Yre
serv
es−
0.01∗∗∗
0.0
1∗−
0.00
−0.0
00.
03∗
(0.0
0)(0.0
0)
(0.0
0)
(0.0
0)
(0.0
1)
GD
Pp
erca
pit
a−
0.01∗
0.0
6∗∗
0.01
−0.0
4∗∗∗
−0.4
3∗∗∗
(0.0
1)(0.0
3)
(0.0
1)
(0.0
1)
(0.0
6)
Gov
ernm
ent
effec
tive
nes
s0.0
6∗∗∗
−0.0
6∗∗
−0.
03
0.0
6∗∗∗
0.2
4∗∗∗
(0.0
1)(0.0
2)
(0.0
2)
(0.0
2)
(0.0
8)
Inflat
ion
−0.
07∗∗∗
0.0
2−
0.01
0.0
20.
10
(0.0
1)(0.0
3)
(0.0
2)
(0.0
1)
(0.1
4)
Pol
itic
alst
abilit
y−
0.00
0.00
−0.
02∗∗
0.0
0−
0.0
9∗∗∗
(0.0
0)(0.0
2)
(0.0
1)
(0.0
0)
(0.0
2)
Pre
vio
us
def
ault
−0.
01∗∗
−0.0
0−
0.01
0.0
0(0.0
0)(0.0
1)
(0.0
1)
(0.0
0)
Rule
ofla
w−
0.01
0.09∗∗∗
0.00
−0.0
4∗∗∗
−0.1
2(0.0
1)(0.0
2)
(0.0
1)
(0.0
1)
(0.0
8)
Tra
de/
GD
P−
0.02
0.21∗∗∗
0.01
−0.0
1−
0.3
1∗∗∗
(0.0
1)(0.0
3)
(0.0
1)
(0.0
1)
(0.1
1)
Unem
plo
ym
ent
−0.
13−
0.5
2∗∗
−0.
12
−0.1
4∗∗∗
−4.4
9∗∗∗
(0.1
4)(0.2
2)
(0.1
4)
(0.0
5)
(1.5
2)
GD
Pgr
owth
−0.5
1−
0.27
2.66∗∗∗
(0.3
6)(0.1
8)
(0.8
1)
Ban
kin
gcr
isis
0.0
21.
48∗∗∗
(0.0
2)
(0.2
5)
Rat
ed−
0.01
0.0
3∗∗
0.01∗∗∗
0.0
2∗∗∗
0.0
3(0.0
1)(0.0
1)
(0.0
0)(0.0
1)
(0.0
3)
Inve
rse
Mills
Rat
io0.0
6−
0.2
8−
0.24
−0.0
20.
69
(0.0
5)(0.2
3)
(0.1
4)
(0.0
2)
(0.4
6)
Obse
rvat
ions
313
311
509
509
529
R2
0.30
0.72
0.4
50.4
80.
45
Cou
ntr
yF
EY
YY
YY
Yea
rF
EY
YY
YY
Th
est
an
dard
erro
rsare
esti
mate
dacc
ord
ing
toD
risc
oll
an
dK
raay
(1998)
rob
ust
covari
an
cem
atr
ixw
ith
fou
rla
gs
an
dta
ke
into
acc
ou
nt
cross
-sec
tion
al
dep
end
ence
.
∗∗∗p<
0.0
1,∗∗
p<
0.0
5,∗p<
0.1

33
do not receive a credit rating at the same time and the countries in the control group have no
rating at all. We solve this by running a K-nearest neighbour (K-NN) matching algorithm to
obtain the counterfactual initial rating year for the countries in the control group.8 Countries
that cannot be matched with treated countries are omitted from the subsequent regression
analysis. After matching, we generate a post-rated dummy and the interaction between the
treatment group dummy and the post-rated dummy. The interpretation of the coefficient
estimate of this interaction variable corresponds to that of the variable Rated in the baseline
analysis.
To test whether the estimation results are sensitive to the choice of the balancing method-
ology, we apply two alternative methods notably propensity score matching (check 5) and
propensity score weighting (check 6). Propensity score matching is a two-step approach. First,
a propensity score for being rated is estimated for each country-year observation with a logistic
regression. We use the same control variables as in the entropy balancing approach to predict
the propensity scores. In the second step, each country of the treatment group is matched to
a country of the control group based on the propensity scores and then the average treatment
effect of being rated is estimated. We use the K-nearest neighbor method to do the matching.9
A negative side-effect of matching is that large amounts of data are thrown away large amounts
of the data, because the treatment and control groups are shrunk down to the same size. In
propensity score weighting, all observations are kept in play but they are reweighed according
to the propensity score.
8The number of nodes K used for matching is 10. Matched countries should have minimum distance betweentreated countries and a particular control country. We run the matching for each country in the control group.
9We also applied other matching methods and results are similar. We opt for K-NN because of the shortercomputation time.

34
Tab
le13:
Alt
ern
ati
ve
met
hod
s:S
over
eign
cred
itra
tin
gp
rovis
ion
and
the
ban
kin
gse
ctor
Met
hod
Ban
kcl
aim
son
govt.
/GD
PD
omes
tic
cred
itby
ban
ks/
GD
PB
anks
asse
ts/G
DP
∆R
isk
wei
ghte
das
sets
∆L
iquid
ass
ets
∆Shor
tte
rmliab
ilit
ies
Bro
adm
oney
/GD
P
Entr
opy
bal
anci
ng
wit
hse
lect
ion
corr
−0.
03∗∗∗
0.0
3∗∗∗
0.02∗∗
0.1
1∗∗
0.08
0.02
−0.
01(0.0
0)(0.0
1)(0.0
1)(0.0
5)
(0.0
6)(0.0
5)
(0.0
1)C
hec
k1:
Entr
opy
bala
nci
ng
−0.
03∗∗∗
0.0
4∗∗∗
0.02∗
−0.0
6−
0.05
−0.
000.
00(0.0
1)(0.0
1)(0.0
1)(0.0
6)(0.0
6)
(0.0
3)(0.0
1)C
hec
k2:
Hec
km
an
sele
ctio
nco
rr−
0.04∗∗∗
0.0
5∗∗∗
0.05∗∗∗
0.0
5−
0.04
−0.
010.
02∗∗∗
(0.0
1)(0.0
1)(0.0
1)(0.0
3)
(0.0
7)(0.0
4)(0.0
1)
Chec
k3:
Diff
-in-d
iff(r
ate
don
ly)
−0.
03∗∗∗
0.0
1∗∗∗
0.01
−0.0
3−
0.08
−0.
02
−0.
01(0.0
1)(0.0
0)(0.0
1)(0.0
5)(0.0
6)
(0.0
3)
(0.0
1)C
hec
k4:
Mat
ched
diff
-in-d
iff−
0.04∗∗∗
0.0
7∗∗∗
0.06∗∗∗
0.2
7∗∗∗
−0.
020.
070.
03∗∗∗
(0.0
1)
(0.0
1)(0.0
1)
(0.0
8)(0.1
1)(0.0
8)(0.0
1)C
hec
k5:
Pro
pen
sity
scor
em
atc
hin
g−
0.0
3∗∗∗
0.0
3∗∗∗
0.03
−0.0
2−
0.1
7−
0.17∗∗∗
0.02
(0.0
1)
(0.0
1)(0.0
2)(0.0
7)(0.1
0)
(0.0
5)(0.0
1)C
hec
k6:
Pro
pen
sity
scor
ew
eighti
ng
−0.0
3∗∗∗
0.0
6∗∗∗
0.04∗∗∗
−0.0
0−
0.0
3−
0.01
0.05∗∗∗
(0.0
1)(0.0
2)(0.0
1)(0.0
4)(0.0
6)
(0.0
3)
(0.0
2)
Note
:T
his
tab
lep
rese
nts
esti
mate
dim
pact
of
aso
ver
eign
cred
itra
tin
gp
rovis
ion
on
the
ban
kin
gse
ctor
by
usi
ng
alt
ern
ati
ve
met
hod
olo
gie
s.T
he
dep
end
ent
vari
ab
les
are
inth
eco
lum
nh
ead
ings.
Th
ere
port
edco
effici
ents
esti
mate
sare
for
theRating
du
mm
y.T
he
contr
ol
vari
ab
les
incl
ud
eth
ela
gged
valu
esof
GD
Pp
erca
pit
a,
FC
Yre
serv
es,
un
emp
loym
ent
rate
,tr
ad
e/G
DP
,cu
rren
tacc
ou
nt/
GD
P,
infl
ati
on
,re
al
GD
Pgro
wth
,ex
tern
al
deb
t/G
DP
,p
revio
us
def
au
ltd
um
my,
rule
of
law
,gover
nm
ent
effec
tiven
ess
an
da
ban
kin
gcr
isis
du
mm
y.T
he
contr
ol
vari
ab
les
are
intr
od
uce
din
ast
ep-w
ise
man
ner
base
don
stati
stic
al
sign
ifica
nce
.S
tan
dard
erro
rsare
inp
are
nth
eses
.***
p<
0.0
1,
**
p<
0.0
5,
*p<
0.1
.

35
Tab
le14:
Alt
ern
ati
ve
met
hod
s:S
over
eign
cred
itra
tin
gp
rovis
ion
and
fore
ign
and
loca
lcu
rren
cyb
ond
sis
sues
Met
hod
FC
Y/to
tal
FC
Ylo
ng-
term
/tot
alF
CY
med
-ter
m/t
otal
FC
Ysh
ort-
term
/tota
lL
CY
/tot
al
LC
Ylo
ng-
term
/to
tal
LC
Ym
ed-t
erm
/tota
lL
CY
short
-ter
m/to
tal
Bon
dyie
ld
Entr
opy
bal
anci
ng
wit
hse
lect
ion
corr
0.03∗∗
0.01∗∗∗
0.0
00.
00∗∗∗
−0.
040.0
3∗0.
01−
0.1
3∗∗
−0.6
8(0.0
1)(0.0
0)
(0.0
0)(0.0
0)(0.0
7)(0.0
1)
(0.0
3)(0.0
5)(0.6
1)C
hec
k1:
Entr
opy
bala
nci
ng
0.04∗∗∗
0.01∗∗∗
0.0
1∗∗
0.01∗∗
0.02
0.0
4∗∗∗
0.03
−0.1
0∗∗∗
−0.7
6(0.0
1)(0.0
0)(0.0
0)(0.0
1)(0.0
5)(0.0
1)(0.0
3)
(0.0
3)(0.6
9)
Chec
k2:
Hec
km
anse
lect
ion
corr
0.05∗∗∗
0.01∗∗∗
0.0
1∗∗∗
0.01∗∗
−0.
040.0
2−
0.02
−0.0
3−
0.4
0(0.0
2)(0.0
0)
(0.0
0)(0.0
1)(0.0
6)(0.0
1)
(0.0
3)(0.0
4)(0.6
9)C
hec
k3:
Diff
-in-d
iff0.
010.0
1∗
0.0
10.
01−
0.04
0.0
1−
0.02
−0.0
2−
0.4
2(0.0
2)
(0.0
0)
(0.0
1)(0.0
1)(0.0
5)(0.0
2)
(0.0
3)(0.0
4)
(1.0
6)C
hec
k4:
Mat
ched
Diff
-in-d
iff0.0
5∗0.
01∗
0.0
2∗∗∗
0.02∗∗
0.01
0.0
3∗∗
0.00
−0.0
2−
1.4
7(0.0
3)
(0.0
0)(0.0
0)(0.0
1)(0.0
5)
(0.0
2)
(0.0
4)(0.0
2)
(0.9
1)C
hec
k5:
Pro
pen
sity
scor
em
atc
hin
g0.0
6∗∗∗
0.02∗∗∗
0.0
1∗∗
0.01
−0.
06∗
0.0
1−
0.02
−0.0
8∗∗∗
−0.5
0(0.0
2)(0.0
0)
(0.0
1)(0.0
1)(0.0
4)(0.0
1)
(0.0
2)(0.0
3)(0.8
7)C
hec
k6:
Pro
pen
sity
scor
ew
eigh
ting
0.05∗∗∗
0.01∗∗∗
0.0
1∗∗
0.01∗
−0.
00
0.0
3∗∗
0.03
−0.0
9∗∗∗
−0.6
2(0.0
2)(0.0
0)(0.0
0)(0.0
1)(0.0
5)(0.0
1)(0.0
3)
(0.0
3)(0.7
2)
Note
:T
his
tab
lep
rese
nts
esti
mate
dim
pact
of
aso
ver
eign
cred
itra
tin
gp
rovis
ion
on
the
pro
port
ion
of
fore
ign
(loca
l)cu
rren
cyb
on
dis
sues
toto
tal
bon
dis
sues
.T
he
dep
end
ent
vari
ab
les
are
inth
eco
lum
nh
ead
ings.
Th
ere
port
edco
effici
ents
esti
mate
sare
for
theRating
du
mm
y.T
he
contr
ol
vari
ab
les
incl
ud
eth
ela
gged
valu
esof
GD
Pp
erca
pit
a,
FC
Yre
serv
es,
un
emp
loym
ent
rate
,tr
ad
e/G
DP
,cu
rren
tacc
ou
nt/
GD
P,
infl
ati
on
,re
al
GD
Pgro
wth
,ex
tern
al
deb
t/G
DP
,p
revio
us
def
au
ltd
um
my,
rule
of
law
,gover
nm
ent
effec
tiven
ess
an
da
ban
kin
gcr
isis
du
mm
y.T
he
contr
ol
vari
ab
les
are
intr
od
uce
din
ast
ep-w
ise
man
ner
base
don
stati
stic
al
sign
ifica
nce
.S
tan
dard
erro
rsare
inp
are
nth
eses
.***
p<
0.0
1,
**
p<
0.0
5,
*p<
0.1
.

36
Tab
le15
:A
lter
nat
ive
met
hod
s:S
over
eign
cred
itra
tin
gp
rovis
ion
and
cap
ital
infl
ows
and
inte
rnati
onal
ban
kin
g
Met
hod
Dir
ect
deb
t/G
DP
Dir
ect
equit
y/G
DP
Por
tfol
iodeb
t/G
DP
Por
tfol
ioeq
uit
y/G
DP
For
eign
loans
and
dep
osit
s
Entr
opy
bala
nci
ng
wit
hse
lect
ion
corr
−0.
000.0
3∗∗
0.0
1∗∗∗
0.0
1∗∗∗
0.06∗∗
(0.0
1)(0.0
1)(0.0
0)(0.0
0)(0.0
2)C
hec
k1:
Entr
opy
Bal
anci
ng
−0.
000.0
3∗∗
0.0
1∗∗∗
0.0
1∗∗∗
0.06∗∗∗
(0.0
1)(0.0
1)(0.0
0)(0.0
0)(0.0
2)
Chec
k2:
Hec
km
anse
lect
ion
corr
−0.
010.0
5∗∗∗
0.0
1∗∗∗
0.0
1∗∗∗
0.11
(0.0
1)(0.0
1)(0.0
0)(0.0
0)(0.0
7)
Chec
k3:
Diff
-in-d
iff−
0.00
−0.
02∗∗
0.0
0∗∗∗
0.0
1∗0.
12∗∗∗
(0.0
1)(0.0
1)(0.0
0)(0.0
0)(0.0
3)C
hec
k4:
Matc
hed
diff
-in-d
iff−
0.02∗
0.09∗∗∗
0.0
1∗∗∗
0.0
1∗∗∗
0.13
(0.0
1)(0.0
1)(0.0
0)(0.0
0)(0.1
1)
Chec
k5:
Pro
pen
sity
score
mat
chin
g−
0.02∗
0.01
0.01∗∗∗
0.0
1∗∗∗
0.05
(0.0
1)(0.0
1)(0.0
0)(0.0
0)(0.0
5)C
hec
k6:
Pro
pen
sity
scor
ew
eigh
ting
−0.
010.0
2∗∗
0.0
1∗∗∗
0.0
1∗∗∗
0.03
(0.0
1)(0.0
1)(0.0
0)(0.0
0)(0.0
4)
Note
:T
his
tab
lep
rese
nts
esti
mate
dim
pact
of
aso
ver
eign
cred
itra
tin
gp
rovis
ion
on
inw
ard
fore
ign
dir
ect
inves
tmen
ts,
port
folio
inves
tmen
tsan
dfo
reig
nlo
an
san
dd
eposi
tsp
rovid
edto
the
ban
kin
gse
ctor.
Th
ed
epen
den
tvari
ab
les
are
inth
eco
lum
nh
ead
ings.
Th
ere
port
edco
effici
ents
esti
mate
sare
for
theRating
du
mm
y.T
he
contr
ol
vari
ab
les
incl
ud
eth
ela
gged
valu
esof
GD
Pp
erca
pit
a,
FC
Yre
serv
es,
un
emp
loym
ent
rate
,tr
ad
e/G
DP
,cu
rren
tacc
ou
nt/
GD
P,
infl
ati
on
,re
al
GD
Pgro
wth
,ex
tern
al
deb
t/G
DP
,p
revio
us
def
au
ltd
um
my,
rule
of
law
,gover
nm
ent
effec
tiven
ess
an
da
ban
kin
gcr
isis
du
mm
y.T
he
contr
ol
vari
ab
les
are
intr
od
uce
din
ast
ep-w
ise
man
ner
base
don
stati
stic
al
sign
fica
nce
.S
tan
dard
erro
rsare
inp
are
nth
eses
.***
p<
0.0
1,
**
p<
0.0
5,
*p<
0.1
.

37
7 Conclusion
Moody’s, Standard and Poor’s and Fitch, three privately owned and U.S.-based credit rating
agencies, have immense power over debt issuers all around the world. By assigning credit
ratings, credit rating agencies provide opinions about the default risk of a borrower. Although
the credit rating is just an opinion, rating agencies dictate the actions of sovereign borrowers.
This is because being rated is a necessary condition for tapping the international capital mar-
kets. The quality of the credit rating determines the interest rates governments have to pay
to service their debt. In addition, credit ratings play an important role in the legal system.
Most institutional investors like pension funds are only allowed to invest in securities rated
above a specific level and the capital ratio’s of banks depend on the credit ratings of the assets
they hold on their balance sheets. In short, having a credit rating is of utmost importance if
a country aims to issue publicly traded debt.
Income per capita is generally low in emerging economies, which translates into low sav-
ings, on average. In addition, domestic financial institutions are not efficient enough to mobilize
these savings for capital formation. Access to international capital markets is important for
emerging countries to guarantee investment and economic growth. International investors
bring not only the capital but also managerial expertise and technical know-how to the host
countries (Schnitzer, 2002). However, investment in low-income countries is generally per-
ceived to be risky. Not only because of the high volatility and significant political risk that is
typically associated with these countries, but also because of important information asymme-
tries disfavoring international investors. The provision of a sovereign credit rating can improve
the information provision regarding the sovereign credit risk of the low-income countries. In-
creased transparency about the sovereign default risk may create positive spillover effects to
the domestic banking sector and can be a catalyser to develop the country’s financial markets.
In this article we investigate the impact of a sovereign credit rating provision on the financial
markets of low income countries. We find this effect to be important in several ways. First and
foremost we find that sovereign credit ratings foster foreign inward investment, both in terms
of FDI and portfolio investments. We also show that banks rebalance their asset portfolio
and provide more credit to the private sector and lend less to the government. This increase
in private lending activity by domestic banks may foster private investment in the country.
Our results also show that a sovereign credit rating provision increases the risk-weighted assets
of domestic banks, which is a logical consequence of the rebalancing of the asset portfolio.

38
Contrary to our expectations, we only find a small impact on the sovereign’s debt issuing
behavior. We do find that the proportion of foreign (local) currency bond issues relative to
total bond issues in rated countries is higher (lower) than in unrated countries, but we do not
find an increase in bond issue size. Rated countries seem to issue smaller bond principals,
especially when the bond is issued in local currency.
Overall, we conclude that receiving an initial sovereign credit rating has positive effects on
the financial market of the rated country. However, we do want to express a small concern
with respect to our findings. In general we find that a newly rated country relies more on
external financing than before it was rated. Several studies have shown that foreign capital
flows can be highly volatile and there is even a risk of so-called sudden stops in capital flows.
Also, issuing foreign currency denominated debt aggravates the problem of original sin, which
implies that a country has a currency mismatch between its assets and its liabilities, exposing
the country to foreign currency risk. This is a serious concern for low-income countries, that
typically have weaker currencies. Although our results indicate that the foreign currency credit
rating increase the currency mismatch of sovereign borrowing, we do provide some evidence
that the rating provision helps to solve the maturity mismatch of sovereign borrowing. Low-
income countries generally rely on shorter term financing than developed countries. We find
that when a country gets rated, it issues less short term debt and more long term debt.

39
References
Foreign capital and economic growth. Brookings Papers on Economic Activity, 2007(1).
Acharya, V., Drechsler, I., and Schnabl, P. (2014). A pyrrhic victory? bank bailouts and sovereigncredit risk. The Journal of Finance, 69(6):2689–2739.
Afonso, A., Gomes, P., and Taamouti, A. (2014). Sovereign credit ratings, market volatility, andfinancial gains. Computational Statistics & Data Analysis, 76:20–33.
Albuquerque, R. (2003). The composition of international capital flows: risk sharing through foreigndirect investment. Journal of International Economics, 61(2):353–383.
Alsakka, R., ap Gwilym, O., and Vu, T. N. (2014). The sovereign-bank rating channel and ratingagencies’ downgrades during the european debt crisis. Journal of International Money and Finance,49:235–257.
Alter, A. and Schuler, Y. S. (2012). Credit spread interdependencies of european states and banksduring the financial crisis. Journal of Banking & Finance, 36(12):3444–3468.
Andritzky, J. R. (2012). Government bonds and their investors; what are the facts and do they matter?Federal Reserve Bank of St Louis.
Angeloni, C. and Wolff, G. B. (2012). Are banks affected by their holdings of government debt?Technical report, Bruegel working paper.
Balima, H. W. (2017). Do domestic bond markets participation help reduce financial dollarization indeveloping countries? Economic Modelling, 66:146–155.
Becker, B. and Ivashina, V. (2018). Financial repression in the european sovereign debt crisis. Reviewof Finance, 22(1):83–115.
BIS (2011). The impact of sovereign credit risk on bank funding conditions. Committee on the GlobalFinancial System.
Boot, A. W. A., Milbourn, T. T., and Schmeits, A. (2005). Credit ratings as coordination mechanisms.Review of Financial Studies, 19(1):81–118.
Borensztein, E., Cowan, K., and Valenzuela, P. (2013). Sovereign ceilings ’lite’? the impact of sovereignratings on corporate ratings. Journal of Banking & Finance, 37(11):4014–4024.
Borensztein, E., Gregorio, J. D., and Lee, J.-W. How does foreign direct investment affect economicgrowth? Journal of International Economics, 45(1).
Broner, F., Didier, T., Erce, A., and Schmukler, S. L. (2013). Gross capital flows: Dynamics and crises.Journal of Monetary Economics, 60(1):113–133.
Brooks, R., Faff, R., Treepongkaruna, S., and Wu, E. (2015). Do sovereign re-ratings destabilize equitymarkets during financial crises? new evidence from higher return moments. Journal of BusinessFinance & Accounting, 42(5-6):777–799.
Brooks, R., Faff, R. W., Hillier, D., and Hillier, J. (2004). The national market impact of sovereignrating changes. Journal of Banking & Finance, 28(1):233–250.
Carvalho, D. and Fidora, M. (2015). Capital inflows and euro area long-term interest rates. Journal ofInternational Money and Finance, 54:186–204.
Christopher, R., Kim, S.-J., and Wu, E. (2012). Do sovereign credit ratings influence regional stock andbond market interdependencies in emerging countries? Journal of International Financial Markets,Institutions and Money, 22(4):1070–1089.

40
Correa, R., Lee, K.-H., Sapriza, H., and Suarez, G. A. (2014). Sovereign credit risk, banks’ governmentsupport, and bank stock returns around the world. Journal of Money, Credit and Banking, 46(s1):93–121.
Correa, R., Sapriza, H., and Zlate, A. (2016). Liquidity shocks, dollar funding costs, and the banklending channel during the european sovereign crisis. FRB Boston Risk and Policy Analysis UnitPaper No. RPA 16-4.
DeBruyckere, V., Gerhardt, M., Schepens, G., and VanderVennet, R. (2013). Bank/sovereign riskspillovers in the european debt crisis. Journal of Banking & Finance, 37(12):4793–4809.
Drago, D. and Gallo, R. (2017). The impact of sovereign rating changes on the activity of europeanbanks. Journal of Banking & Finance, 85:99–112.
Ferreira, M. A. and Gama, P. M. (2007). Does sovereign debt ratings news spill over to internationalstock markets? Journal of Banking & Finance, 31(10):3162–3182.
Gande, A. and Parsley, D. C. (2014). Sovereign credit ratings, transparency and international portfolioflows. SSRN Electronic Journal.
Glick, R. and Rose, A. K. (1999). Contagion and trade: Why are currency crises regional? Journal ofInternational Money and Finance, 18(4):603–617.
Hainmueller, J. (2012). Entropy balancing for causal effects: A multivariate reweighting method toproduce balanced samples in observational studies. Political Analysis, 20(1):25 – 46.
Harvey, R. A., Hayden, J. D., Kamble, P. S., Bouchard, J. R., and Huang, J. C. (2017). A comparisonof entropy balance and probability weighting methods to generalize observational cohorts to a popu-lation: a simulation and empirical example. Pharmacoepidemiology and Drug Safety, 26(4):368–377.
Heckman, J. J. (1976). The common structure of statistical models of truncation, sample selection andlimited dependent variables and a simple estimator for such models. Annals of Economic and SocialMeasurement, 5:475–492.
Heckman, J. J. (1979). Sample selection bias as a specification error. Econometrica, 47:153–162.
Hooper, V., Hume, T., and Kim, S.-J. (2008). Sovereign rating changes—do they provide new informa-tion for stock markets? Economic Systems, 32(2):142–166.
Ismailescu, I. and Kazemi, H. (2010). The reaction of emerging market credit default swap spreads tosovereign credit rating changes. Journal of Banking & Finance, 34(12):2861–2873.
Kaminsky, G. (2002). Emerging market instability: Do sovereign ratings affect country risk and stockreturns? The World Bank Economic Review, 16(2):171–195.
Kim, S.-J. and Wu, E. (2008). Sovereign credit ratings, capital flows and financial sector developmentin emerging markets. Emerging Markets Review, 9(1):17–39.
Kim, S.-J. and Wu, E. (2011). International bank flows to emerging markets: Influence of sovereigncredit ratings and their regional spillover effects. Journal of Financial Research, 34(2):331–364.
Konopczak, K. and Konopczak, M. (2017). Impact of international capital flows on emerging markets’sovereign risk premium – demand vs. vulnerability effect. Finance Research Letters, 23:239–245.
Kullback, S. and Leibler, R. (1951). On information and sufficiency. The Annals of MathematicalStatistics, 22(1):79–86.
Laeven, L. and Valencia, F. (2013). The real effects of financial sector interventions during crises.Journal of Money, Credit, and Banking, 45(1):147–177.

41
Laeven, L. and Valencia, F. (2018). Systemic banking crises revisited. IMF Working Paper, 206.
Lee, K.-H., Sapriza, H., and Wu, Y. (2016). Sovereign debt ratings and stock liquidity around theworld. Journal of Banking & Finance, 73:99–112.
Li, H., Jeon, B. N., Cho, S.-Y., and Chiang, T. C. (2008). The impact of sovereign rating changesand financial contagion on stock market returns: Evidence from five asian countries. Global FinanceJournal, 19(1):46–55.
Mensah, M. O., Agbloyor, E. K., Harvey, S. K., and Fiador, V. O. (2017). Sovereign credit ratingsand bank funding cost: Evidence from africa. Research in International Business and Finance,42:887–899.
Mohamed, S. (2006). The impact of international capital flows on the south africa economy since theend of apartheid. Wits University-unpublished.
Neuenkirch, M. and Neumeier, F. (2016). The impact of us sanctions on poverty. Journal of DevelopmentEconomics, 121:110 – 119.
Odders-White, E. R. and Ready, M. J. (2005). Credit ratings and stock liquidity. Review of FinancialStudies, 19(1):119–157.
Palma, G. (2002). The three routes to financial crises. International Capital Markets: Systems inTransition, page 297.
Popov, A. and VanHoren, N. (2014). Exporting sovereign stress: Evidence from syndicated bank lendingduring the euro area sovereign debt crisis. Review of Finance, 19(5):1825–1866.
Pukthuanthong-Le, K., Elayan, F. A., and Rose, L. C. (2007). Equity and debt market responses tosovereign credit ratings announcement. Global Finance Journal, 18(1):47–83.
Schnitzer, M. (2002). Debt v. foreign direct investment: The impact of sovereign risk on the structureof international capital flows. Economica, 69(273):41–67.
Swamy, V. and Narayanamurthy, V. (2018). What drives the capital flows into BRICS economies? TheWorld Economy, 41(2):519–549.
Treepongkaruna, S. and Wu, E. (2012). Realizing the volatility impacts of sovereign credit ratingsinformation on equity and currency markets: Evidence from the asian financial crisis. Research inInternational Business and Finance, 26(3):335–352.
Williams, G., Alsakka, R., and ap Gwilym, O. (2013). The impact of sovereign rating actions on bankratings in emerging markets. Journal of Banking & Finance, 37(2):563–577.
Williams, G., Alsakka, R., and ap Gwilym, O. (2015). Does sovereign creditworthiness affect bankvaluations in emerging markets? Journal of International Financial Markets, Institutions and Money,36:113–129.

Thinking ahead for Europe
European Capital Markets Institute
ECMI conducts in-depth research aimed at informing the debate and policy-making process on a broad range of issues related to capital markets. Through its various activities, ECMI facilitates interaction among market participants, policymakers and academics. These exchanges are fuelled by the various outputs ECMI produces, such as regular commentaries, policy briefs, working papers, statistics, task forces, conferences, workshops and seminars. In addition, ECMI undertakes studies commissioned by the EU institutions and other organisations, and publishes contributions from high-profile external researchers.
Centre for European Policy Studies
CEPS is one of Europe’s leading think tanks and forums for debate on EU affairs, with an exceptionally strong in-house research capacity and an extensive network of partner institutes throughout the world. As an organisation, CEPS is committed to carrying out state-of-the-art policy research that addresses the challenges facing Europe and maintaining high standards of academic excellence and unqualified independence and impartiality. It provides a forum for discussion among all stakeholders in the European policy process and works to build collaborative networks of researchers, policy-makers and business representatives across Europe.