how do institutions trade around corporate news?*
TRANSCRIPT

0
How do Institutions Trade around Corporate News?*
Alan Guoming Huang Hongping Tan Russ Wermers†
March 2013
Abstract
Combining a comprehensive database of news releases during 2000 to 2010 with a large
high-frequency database of institutional trades, we examine how institutions trade on the
qualitative information embedded in public news releases. We find that institutions trade on the
tone of news on the days of news releases but not around news arrivals. That institutions trade
speedily on but do not predict qualitative information in corporate news suggests that institutions’
informational advantage, if any, stems mostly from their ability to process information in a
highly timely manner.
* We gratefully acknowledge financial support from the Social Sciences and Humanities Research Council of Canada. Lei Ma provided excellent research assistance. All errors are ours. † Huang is with the University of Waterloo, email: [email protected]; Tan is with the University of Waterloo, email: [email protected]; and Wermers is with the University of Maryland, email: [email protected].

1
How do Institutions Trade around Corporate News?
Abstract
Combining a comprehensive database of news releases during 2000 to 2010 with a large high-frequency database of institutional trades, we examine how institutions trade on the qualitative information embedded in public news releases. We find that institutions trade on the tone of news on the days of news releases but not around news arrivals. That institutions trade speedily on but do not predict qualitative information in corporate news suggests that institutions’ informational advantage, if any, stems mostly from their ability to process information in a highly timely manner.

2
I. Introduction
There is a long tradition in the finance literature assuming that institutional investors as a
group are so-called “informed” investors and enjoy an informational advantage relative to retail
or uninformed investor (e.g., Grossman and Stiglitz 1980; Glosten and Milgrom 1985; Kyle
1985). Apart from indirect evidence that focuses on liquidity measures to support the dichotomy
of informed and uninformed investors (e.g., Amihud and Mendelson 1986; Hasbrouck and Seppi
2001; Pastor and Stambaugh 2003), studies also directly suggest that institutions possess an
informational advantage over other market participants (e.g., Cohen, Frazzini and Malloy 2007,
Irvine, Lipson and Puckett 2007), and that they exhibit superior trading skills (e.g., Lakonishok,
Shleifer, and Vishny 1992, Nofsinger and Sias 1999, Gompers and Metrick 2001, and Sias,
Starks, and Titman 2001, Puckett and Yan 2011).
Yet ample evidence also shows that institutional investors overall do not generate returns
higher than the market.1 For example, it has long been recognized that mutual funds, arguably
the most pervasive type of institutional investors, did not outperform the market in the past five
decades. If institutional investors enjoy an informational or trading advantage, it remains
puzzling why then this advantage does not translate into returns.
In this paper we offer a direct test to examine whether institutional investors exhibit
trading advantage when they face uncertain arrivals of corporate news. We collect a large sample
of corporate news releases. Our data are sufficiently general that allow us to examine how
institutions trade around news releases, regardless of news types. Our data also provide the
distinct time stamps of both trades and news, so that we can analyze institutions’ trading timing
on news. We analyze institutions’ trading direction on the tone of news, and find that institutions
trade on the tone of news on the days of news releases but not around news arrivals. Our results 1 See, for example, popular textbook teachings such as Bodie, Kane, and Marcus (2010).

3
suggest that institutions trade speedily on but do not predict qualitative information embedded in
corporate news.
Our findings add to the debate of whether and through what channels institutional
investors possess informational advantage. In particular, our examination of institutional trading
is related to a large literature on the trading behaviors of institutional investors, who have
gradually emerged as the most dominant players in the equity market over the past half century.2
There are two non-mutually exclusive views regarding the trading skills of institution investors.
The first view is that institutions are able to gather private information and trade ahead of major
news events. Supporting evidence of this view typically concerns a certain type of news. For
example, Irvine, Lispon and Puckett (2007) show that institutions are able to anticipate the
contents of analysts’ initial buy recommendation by receiving tips from sell-side analysts; Larson
(2008) finds that institutions trade before the public disclosure of accounting frauds; and Baker
and Savasoglu (2010) find that mutual fund can forecast earnings surprises. A number of studies
also show that institutions are likely to have private information of M&A and related activities.
For example, acquirer-advisor-affiliated funds buy target firms before takeover announcements
(Bodnaruk, Massa and Simonov 2009), and there is a significant inside information leakage from
target brokerages (Jegadeesh and Tang 2010) or information leakage in buyout deals through
corporate connections (Acharya and Johnson 2010).3
The second view of the trading skills of institution investors is their ability to quickly
process publicly available information. A number of studies (e.g., Rubenstein 1993, Kim and
2 According to the Federal Reserve Board’s Flow of Funds report, institutional ownership reached over 60% in 2005 from just 7% in 1950. Jegadeesh and Tang (2010) document that major institutions own about 73% of publicly traded stocks in the U.S. 3 Acharya and Johnson (2010) find that stock price run-up prior to buyouts is positively related to the number of private equity participants, suggesting information leakage through corporate connections. This finding is in contrast with Griffin, Shu and Topaloglu (2013), who do not find evidence that investment bank clients take advantage of connections through takeover advising, IPO and SEO underwriting, or lending relationships.

4
Verrecchia 1994, Kandel and Pearson 1995) suggest that traders generate differential
interpretations to the same public news. As such, public news releases leave room for investors
with different information processing abilities to interpret the value-relevant information
embedded in the news differently. For example, Griffin, Shu, and Topaloglu (2007) examine
institutional trading around takeover and earnings announcements and find that aggregate
institutional trading profits stem from their ability to quickly process publicly available
information rather than from private information.
While our findings support institutions’ superior information processing skills, they seem
to contrast with the findings that institutions possess private information ahead of news. We note
that we derive our findings from a large sample of news stories—we have over 2 million initial
news stories over the period of 2000 to 2010. Although we screen out news around earnings
announcements, our conclusions are robust to the inclusion of earnings announcements news. In
addition, news around M&A announcements account for only about one percent of our final
sample. We do find that, institutions’ trading intensity is higher on news that is more informative
about firms’ fundamentals, such as news that are related to firm earnings. Our findings in general
suggest that institutional investors’ informational advantage stem mainly from their superior
information processing skills.
Our paper is also related to the growing literature of textual analysis of public news.
Unlike specific corporate news events such as earnings and M&A announcements that cover
only a fraction of corporate news,4 this literature examines all types of corporate news in mass
4 There is a voluminous literature on the impact of specific corporate news events such as earnings announcements, mergers, and management turnover in the past few decades. For example, Kothari and Warner (2006) report that over the period 1974-2000, five major finance journals publish over 500 articles related to specific corporate events.
5
media to better measure the supply of public information for publicly listed firms.5 This stream
of literature has primarily focused on the price impacts of news stories and has shown that
qualitative information embedded in news stories are return-relevant. A number of papers
document that public news releases predict the cross-section of asset returns (e.g., Klibanoff et al.
1998, Tetlock, Saar-Tsechansky, and Macskassy 2008, Fang and Peress 2009, and Engelberg,
Reed, and Ringenberg 2010). In particular, Tetlock et al. (2008) document that the fraction of
negative words embedded in firm-specific news stories (hereafter “negative tone”) can predict
short-term returns. Studies also link news contents to return momentums (e.g., Chan 2003) and
reversals (e.g., Tetlock 2007, Tetlock 2011), and earnings momentums (Tetlock et al. 2008,
Engelberg 2008). Our study extends this line of research to institutional trading. Unlike previous
studies that typically rely on single source of news provider such as the Wall Street Journal or
Dow Jones news archive, our study features a large number of wired news stories from a wide
array of sources from the major news sources in the Factiva database. Our large dataset of news
enables us to capture the general supply of information to the public. Importantly, our use of
wired news allows us to pin down the time stamp of news that institutions can trade on. We show
that institutions’ news-content-contingent trading is concentrated in the first 15 minutes of news
arrival, which provides further support of the speed at which institutions react to news.
To arrive at our conclusions, we carry out a careful research design to address
confounding effects. We examine whether institutions as a group net-buy or net-sell around the
news announcement, contingent on the news content. We deal with multiple same-day news
appearances, multiple-day consecutive news sequels, and potential confounding effects from
earnings and M&A announcements. In addition to negative tone that is typically used in the news
5 See, for example, Klibanoff et al. (1998), Chan (2003), Tetlock (2007), Tetlock et al. (2008), Fang and Peress (2009), Tetlock (2011), Tetlock et al. (2008), ), Loughran and McDonald (2011), Engelberg (2008) and Engelberg et al. (2012).

6
literature, we use net negative tone (that is, negative tone net of positive tone). We also examine
the news contents beyond its negative tone, such as news related to firm fundamentals of
earnings or to firm major events of M&A, and examine the news tone in both the full text of
news and in the forward-looking statements only. Our results show that institutions trade on the
tone of news on the news day, but not around (before and after) the news day; and such pattern is
more pronounced when news is more informative of firm fundamentals or signals major events.
This study contributes to the literature in the following ways. First, we contribute to an
emerging literature on how market participants respond to public news. We construct a
comprehensive public news dataset on all US firms during 2000 to 2010 to examine how
institutional investors respond to the qualitative information embedded in the news. Using all
types of corporate news enables us to sort the universe of trading days into those with and
without news and to examine the differential trading activities of institutional investors
surrounding news releases. Second, we shed light on an ongoing debate on whether institutional
investors are informed traders or their trading advantage arises from the ability to process
publicly available information. Public news release is one of the most important channels of
information dissemination for public firms, yet institutions’ trading patterns around public news
releases have received limited attention in the literature. To the extent that institutional investors
are informed, one possible hypothesis is that institutional investors not only trade based on the
contents of the news, but also anticipate the news and trade accordingly prior to news releases.
Our results show that institutions’ trading advantage, if any, stems mostly from their ability to
process information in a highly timely manner.

7
The remainder of this paper proceeds as follows. Section II describes the sample. Section
III presents our analyses and findings. Section IV provides a discussion of our results, and
Section V concludes.
II. Data and Sample Selection
This study relies on two major datasets. Our first dataset contains all public news stories
in the U.S during 2000 to 2010 from Factiva; and our second dataset contains institutional
trading data from ANcerno. In this section we describe our data sources and sample selection
process.
2.1 The news events sample
We retrieve corporate news for all U.S firms from the Top Sources in the Factiva
database between January 1, 2000 and December 31, 2010. We first follow Tetlock et al. (2008)
by requiring that each news release contains at least fifty words in total and that the first twenty-
five words should mention a company identity, which includes company name, trading ticker,
URL and company name initials. We assign a news article to the firm that has the highest
frequency of company-identity mentions in the article. When there are more than two firm names
in the same news article, we compute the frequency of appearance of the two names. If the
frequency of mentions of the second highest firm is less than 90% of that of the highest firm, we
assign the news to the highest-frequency firm; otherwise we drop the news from the sample. We
obtain nearly 2.2 million news releases that mention a company identity at least once. To
minimize false identification of news to a particular company, we require that each news release
contain at least three mentions of company identity. We also drop observations that we cannot
match to a Compustat Gvkey. After these sample screens, we are left with a total of nearly 1.7
million news articles.

8
We next deal with news sources. Prior studies on public news typically focus on Dow
Jones archive which contains all Dows Jones news and Wall Street Journal stories (e.g., Tetlock
(2007), Tetlock et al. (2008), Tetlock (2010), Engelberg et al. (2012)). Our news dataset contains
news stories from more than 150 sources included in the Top Sources of Factiva.6 To tailor these
news sources to our study, we first note that this paper examines institutional trading around
news releases. A common perception is that institutional investors are able to process news
efficiently and therefore are sensitive to the timeliness of news. We therefore remove news from
newspapers and magazines, as news from these sources tends to be “stale.”7 Based on the
amount of news stories, we identify five major news sources: Dow Jones Newswire, Press
Release Newswire, Business Wire, Reuters Newswire, and the Associated Press Newswire.
News releases from sources other than these five are grouped as “Others.” This last group
includes many small news providers; for example, more than one hundred sources release less
than 1,000 news stories in our sample period. To compare with previous studies, we note that
Dow Jones Newswire supplies about one-quarter of the total number of news in our sample.
Our next step of news-data processing addresses timing and clustering of news. We
assign a news article to the same trading day if the news is released on the same day before the
market close at 4:00 p.m.; and to the next trading day if the news is released on the trading day
but after 4:00 p.m., or if the news is released on a non-trading day such as in a weekend and a
holiday.8 26% of times in our sample a firm has at least two news releases on the same trading
day. To address potential estimation biases arising from these multiple news on a same day, we
combine multiple news releases for each firm in a given trading day into a single “composite”
6 There are five categories included in the Top Sources of Factiva: Dow Jones Newswires, Major News and Business Publications, Press Release Wires, Reuters Newswires and The Wall Street Journal. 7 Only seven percent of news stories in our sample are from newspapers and magazines. Including these news stories does not change our conclusions. 8 “Day” and “trading day” in this paper both refer to trading day throughout.
9
story. In this case, we take the average of the news content measures (to be elaborated
subsequently), but keep the time stamp of the first news as the time of the news. At this step our
news sample has around 1.1 million news articles for 15,540 firms.
We then intersect the news sample with institutional trading data from Abel Noser
Solutions Co. Ltd., a.k.a. ANcerno data (to be discussed subsequently). We require that there is
at least one ANcerno institutional trade of the firm on the trading day of news announcement.
This reduces news stories to nearly half a million.9 Panel A of Table I shows the coverage of
these news stories by year and by news source. As previously mentioned, Dow Jones Newswire
covers about one-quarter news stories. Business Wire and Press Release offer about the same
percentage of news articles, followed by the Associated Press (about 10%) and Reuters (about
5%). These five major newswires provide about 90% of the new stories.
[Table I about here.]
We examine institutional trading around news releases on various samples constructed
from the news stories from Panel A of Table I. In our primary final sample, we further enforce
two screens. First, we remove news releases within [-3, 3] days around quarterly earnings
announcements to avoid any compounding effect from earnings announcement.10 Doing so
reduces the news article number by about 20%. Second, it is not uncommon that the same event
gets multiple days of media coverage. This will result in news “clustering,” in the sense that the
multiple days of media coverage may refer to the same news event. To address this issue, we
9 This reduction in sample size indicates that there is no trading on many news stories. We suspect this is due to the portfolio holdings of the ANcerno institutions, the majority of which are plan sponsors and mutual funds. For these institutions, the “prudent man” rule typically prevents them from holding risky securities. Relaxing the requirement increases the number of news survived. For example, requiring that there is ANcerno institutional trading in any day within [-10, 10] days around the news announcement increases the surviving news to 720 thousand. Our results, however, are insensitive to how we cut the final sample. 10 Griffin, Shu, and Topaloglu (2007) find that a certain groups of institutions are able to predict the information in the forthcoming quarterly earnings announcement. They argue that investors are able to predict the direction of earnings announcements by using information from past earnings and public reports.

10
group consecutive news of a firm (i.e., non-stopping news stories over a number of days) into a
news cluster. We again average news properties within the cluster but keep the time stamp and
source of the first news in the cluster as the event start time and news source. The cluster will be
broken only when news coverage stops for at least one day. On average, a news cluster has 1.3
composite news stories. While the majority of news clusters have single-day coverage, over 10%
of times firms get two or more days of consecutive news coverage. It should be noted that these
clusters define our events, and that our event “window” has the duration of the cluster, which
may not necessarily last for one day. We define pre- and post-event periods relative to the
boundary of the cluster. Panel B of Table I shows the news source distribution of our primary
sample. Again, around 90% of news stories are provided by the five major newswires. Our
primary final sample consists of 306,280 news clusters covering 6,684 firms. See Appendix A
for a description of our sample selection procedures.
We consider the following alternative samples revised from our primary final sample: i)
adding back news around earnings announcements; ii) removing all news clusters that lasts more
than one day, or iii) removing news around mergers and acquisitions announcements. Our
conclusions remain robust to these alternative samples.
2.2 The ANcerno institutional trading data
Abel Noser Solutions collects its institutional clients’ complete transaction records into
the ANcerno database. ANcerno’s clients include some large pension plan sponsors and mutual
funds, such as the Commonwealth of Virginia and Massachusetts Financial Services. For each
transaction, ANcerno provides, among other items, the unique code for each institution, the code
of stock traded, the time of execution, the number of shared traded, the execution price, and

11
whether the execution is a buy or sell.11 A number of studies use the ANcerno database, such as
Chemmanur, He, and Hu (2009), Goldstein, Irvine, and Puckett (2010), Puckett and Yan (2011).
Puckett and Yan (2011) estimate that ANcerno institutions account for 8% of the CRSP trading
volume and 10% of all institutional trading volume.
Following Goldstein, Irvine, and Puckett (2010) and Puckett and Yan (2011), we include
only trades on common stocks. The most distinct advantage of the ANcerno data is that it
provides to-the-minute high-frequency institutional trading, which allows us to accurately match
with the time stamp of news. We include all of the before- and after-hours trading and align
trades with news based on their respective time stamps. Trades and news may take place on the
same day. In this case, if the trade happens before the news, the trade is categorized as a
previous-event-day trading, otherwise it is treated as event-day trading.12
Panel A of Table II presents the overview of the ANcerno trading data for our sample
period. During 2000 to 2010, ANcerno covers a total of 1,072 institutions, 386 of which are
mutual funds and 686 pension plan sponsors. In total, these institutions traded 9,860 stocks and
generated 40 trillion dollars of volume.
[Table II about here.]
Panel B of Table II shows the summary statistics of institutional trading on the news
announcement dates only. Compared with Panel A, 1,060 out of 1,072 institutions trade on news
announcements. Also compared with Panel A, on the news announcement dates institutions trade
2/3 of the stocks, make one tenth of the trades and trade about one sixth of the share and dollar
11 Puckett and Yan (2011) provide a detailed description of the ANcerno data. 12 ANcerno puts a time stamp of 16:20 for all after-hours trades executed after 4:20 p.m. If there are news releases after this time, we remove all of the ANcerno 16:20 trades since we cannot identify the precedence between news and trades in this case. This affects less than 0.1% of our sample.

12
volumes. This suggests that on news announcement dates, the average trading size of institutions
is larger.
How large is institutions’ trading size around new releases? Panel C of Table III provides
a brief overview. On the announcement day of each news, an average institution trades 54,606
shares, with a dollar trading size of $1.6 million. These numbers roughly double when we
expand the window to [-3, 3] days around news announcement. Again, these numbers confirm
that institutions trade more heavily on news announcement days. Further, the median trade size is
much smaller than the average trade size in both time windows, suggesting that the trade
distribution is highly skewed towards large orders. This is consistent with Puckett and Yan
(2011), who suggest that “institutional trade sizes are likely to be either very large or very small”
(page 606).
2.2 Primary measures of news contents and institutional trading
Following prior research (e.g., Tetlock (2007), Tetlock et al. (2008), Loughran and
McDonald (2011)), we measure the news contents by the degree of negativity of the news. As is
standard in this strand of literature, we count the number of positive and negative words in each
news article to examine the tone and sentiment of a text. Our word list is from Lougharn and
Mcdonald (2011), who develop, among other types, a list of negative and positive words for the
financial context. Lougharn and Mcdonald’s (2011) list contains 2,349 unique negative words
and 354 unique positive words. Our primary measure of news tone, Neg_net, is defined as the
fraction of total negative-word count (including those in the headline and body of the news) net
of total positive-word count in each news article, i.e.,
_ . .
. (1)

13
Since the literature emphasizes negative words only (e.g., Tetlock et al. (2008)), we also consider
, the ratio of negative word count to total number of words in the news. Obviously, is
bounded below at zero.
Figure 1 shows the distribution of _ and Neg in our primary sample. Neg_net has
a mean (median) of -0.0007 (-0.0016), indicating that an average news story has a slightly
positive tone. The distribution of Neg_net is rightly skewed—that is, when a news article is
negative, the negative tone tends to be severe. Turning to Neg, we note that 23% of the times
Neg has a value of zero; i.e., about a quarter of our news stories are purely positive news. The
right-side distributions of _ and Neg have approximately the same magnitudes, indicating
that the more negative news contain few positive words. Lastly, the correlation between
_ and Neg is high at 0.85.
[Figure 1 about here.]
We next turn to institutional trading measures. ANcerno’s buy and sell directions enable
us to calculate not only the total institutional trading but also the net institutional trading of a
stock for a given time. Following Irvine, Puckett and Lipson (2007), we first calculate the total
number of shares traded regardless of trading direction and the net shares traded (i.e., shares
purchased minus shares sold). We then scale these two values by the firm’s total shares
outstanding retrieved from the CRSP to facilitate cross-firm and institution comparison. For our
primary results, we calculate these measures at the daily frequency (where “days” are defined
relative to news). The former measure is the total institutional trading, and the latter is the trading
imbalance by institutions.
Panel D of Table II compares the distribution of total institutional trading and trading
imbalance between days around and days not news announcements. When aggregating trading

14
by stock and trading day, our ANcerno sample gives 7.4 million stock-trading days. Out of the
7.4 million days, 2.1 million days or roughly 30% are within [-3, 3] days around news
announcements. We note that days around news announcements have higher total trading but
lower trading imbalance relative to days not around news announcements. Total institutional
trading is 0.15% vs. 0.12% for around-news days vs. non-around-news days (with a t-statistic of
the difference of 26.82), indicating that institutions trade more actively around news
announcements. On average, institutions are net buyers, as the trading imbalances around news
days and not around news days are both positive. However, the mean of trading imbalance
between the two types of days is 0.002% vs. 0.004% (with a t-statistic of the difference of -5.70).
This lower mean of around-news-day trading imbalance, coupled with its larger magnitude in
both tails (25th and 75th percentiles), suggesting that institutions’ opinions are more dispersed
around news. Overall, these statistics show that institutions net-buy stocks, but net-buy less
around news.
For the sake of news-event study, we examine institutional trading 10 days before and
after news announcement. As with the traditional event-study literature and related prior studies,
we normalize trading imbalance at the firm level to ameliorate firm-specific idiosyncrasies, in
particular, to ameliorate the problem that some firms may be more actively traded than others. In
their investigation of institutional trading before the release of analysts’ initial buy
recommendations, Irvine, Puckett and Lipson (2007) calculate abnormal trading imbalance of
each firm by adjusting for the firm’s mean daily institutional trading imbalance during the
benchmark window of [-60, -20] and [20, 60] days. In our case, there are likely news arrivals in
any benchmark window that would impair its benchmarking purposes.13 Accordingly, we take
13 For example, in the benchmark window of [-60, -20] and [20, 60] days, there are on average 14 news announcements for each firm, and 75% of times a firm has more than five news announcements.

15
the days that are likely to be impacted by news out of the benchmark window; specifically, we
remove [-3, 3] days around news announcement. In addition, we use [-250, -20] days (adjusted
for news arrivals) as the benchmark to avoid look-ahead bias. This benchmark window roughly
corresponds to prior year’s trading days. Thus, our primary measure of abnormal trading
imbalance, labeled as Abt, is net trading imbalance subtracted by the firm’s normal trading
imbalance over the window of [-250, -20] days. We use the window of [-60, -20] and [20, 60]
days as a robustness check. Since institutions net-buy more in non-news days, our abnormal
trading imbalance measures will necessarily be negative.
III. How do Institutions Trade around News?
In this section, we examine whether institutional trading shows systematic patterns prior
to, on, and after news announcement contingent on new contents. We carry out both univariate
and multivariate analyses, and also present robust evidence.
3.1 Portfolio Analysis
Our primary objective is to investigate whether institutional trading is associated with the
tone of news. We start by univariate analysis where we divide the sample into quintile portfolios
based on the ranked value of _ and examine the abnormal trading imbalance 10 days
before and after the news announcement. Panel A of Table III presents the results.
[Table III about here.]
The most striking result that we observe from Panel A of Table III is that institutions
trade on the news tone only on the news announcement day but not the other days. Prior to news
announcement, Abt does not display a monotonic pattern with Neg_net; and the difference of Abt
between quintile 5-news (the most negative news) and quintile 1-news (the most positive news)

16
(“Q5-Q1” difference) is insignificant in any of the 10 days before news announcement. The
results with the 10 days after news are similar—we do not find significance in the Q5-Q1
difference. In contrast, on the announcement day, Abt monotically decreases with Neg_net,
indicating that more negative news incurs higher amount of net-selling, and the Q5-Q1
difference is highly significant (t-statistic = − 4.36). Panel (a) of Figure 2 plots the Q5-Q1
difference over these 21 days. We observe that the Q5-Q1 difference fluctuates around zero
before and after news, but dips significantly at day 0. In Panel (b) of Figure 2, we also plot the
Q5-Q1 difference contingent on the ratio of Neg. Again, the pattern is highly similar.
[Figure 2 about here.]
It is possible that the Abt pattern identified above may be caused by certain firm
characteristics. We examine the firm characteristics of size, media coverage, and return
momentum, due to the following considerations. The general size effect (that smaller firms drive
empirical results) exists in many empirical findings. Fang and Peress (2009) show that media
coverage affects investors’ preferences and stock returns. And lastly, abnormal trading
imbalance may be driven by momentum trading by institutions (Griffin, Harris, and Topaloglu
(2003)).
We carry out a double-sorting to examine the impact of firm characteristic. For each
characteristic, we first sort our sample into tercile groups; and within each tercile sub-group, we
further sort firms into quintile portfolios based on the ranked values of Neg_net. As with before,
we examine of the Q5-Q1 difference of Abt for each quintile within each firm-characteristic
tercile. For definitions and measurements of size, media coverage (the number of news stories of
the firm in the prior year), and momentum, as well as other variables, refer to Appendix B, which
provides a summary of variables used in this paper. Since Panel A of Table III shows that only

17
day-0 Abt has a significant Q5-Q1 difference, we will focus on day-0 trading for these sub-
portfolios. Panel B of Table III presents the results. We observe that i) the Q5-Q1 difference of
Abt is negative for all sizes of firms, all levels of media coverage, and all levels of return
momentum, ii) the difference is significant for medium and small firms (and marginally
significant for large firms), significant for medium and low media coverage, and significant for
all levels of return momentum, and iii) the magnitude of the difference is largest for smallest
firms, for lowest media-coverage firms, and for highest momentum firms. In sum, even though
the day-0 institutional trading pattern on news is more pronounced in smaller and less-covered
firms, it exists in a wide spectrum of firms. In multivariate analyses that follow, we control for
these firm characteristics.
3.2 Multivariate Regression Analysis
The portfolio analysis in the previous section indicates that institutions trade on news on the
announcement day, but neither before nor after the announcement day. To show that these results
are not caused by other confounding factors, we next run the following regression analysis:
_ ∗ (2)
where the control variables are mostly based on Bennet, Sias, and Starks (2003), Griffin, Harris,
and Topaloglu (2003), and Yan and Zhang (2009). The control variables include size, firm age,
dividend yield, book-to-market equity, price, turnover, return volatility, whether the firm is
included in the S&P 500 index, short-term return momentum (past month abnormal return), and
longer-term return momentum (past one-year abnormal return). We measure all of the control
variables at time horizons before the measurement of Abt, so that we do not have look-ahead
biases in the determinants regression of Abt. In addition, we control for the degree of media
coverage, as the literature suggests that media coverage affects investor choice and returns (Fang

18
and Peress 2009; Zhao 2012). We include two media coverage variables, the logarithm of the
number of news stories of the firm in the prior year, and a dummy variable (multiple_dummy)
indicating whether there are more than one news stories during the news announcement day. We
include the last control because the variable indicates news intensity, which is shown to affect
stock returns (Zhao, 2012). We also control for year and 2-digit SIC industry dummies.
Table IV reports the pooled regressions results, where we cluster-adjust the standard
errors a la Petersen (2009) at firm and trading day levels. We report the determinants of Abt of
windows [-5, -3] (i.e., 3 to 5 days before news announcement), [-2, -1], [0], [1, 2], and [3, 5]. The
pre-event windows of [-5, -3] and [-2, -1] test whether institutions has predictive power and trade
in advance of news, and the post-event windows of [1, 2] and [3, 5] test whether institutions
continue to trade after the release of the news.
[Table IV about here.]
Table IV confirms the results from the earlier portfolio analysis. After controlling for
commonly used stock and media-coverage characteristics, the coefficient estimate of Neg_net on
Abt is only significant on the event day, but not on the other windows. On the event day, the
coefficient estimate of Neg_net is −0.079, indicating that as the negative tone of the news
increases by one percent, institutions’ (abnormal) net selling of the shares outstanding of the firm
will increase by 0.079 basis points. However, the news tone is not significantly related to
institutional trading imbalance in pre- and post-event windows. Collectively, the evidence points
to that institutions trade on news but not around news. Institutions react speedily to news; but
they do not predict news.
Interestingly, we also find similar results with the news intensity measure
multiple_dummy (a dummy variable indicating whether there are multiple news articles on the

19
news announcement day). The coefficient estimate on multiple_dummy is significantly negative
on day 0 but not on other days, suggesting that institutions tend to net-sell when news are more
intensive on day 0. In untabulated results, we also include an interaction term of multiple_dummy
× Neg_net, and find that the coefficient estimate on this term is significantly negative on day 0.
Thus, institutions’ net-selling on day-0 on negative news is larger when the news is also more
intense.
Regarding the control variables, we find that Abt is positively related to size and one-
month return momentum and negatively related to price and volatility. These results indicate that
institutions tend to buy large firms and firms that experience short-term price momentum (all
consistent with Yan and Zhang 2009), and tend to sell firms with high volatility (consistent with
Brandt et al. 2010). The negative sign on price looks puzzling at first sight; and we note that this
is due to the compounding effect of other variables, in particular, that of firm size. When we
remove firm size from the regression, price is on longer significant in predicting Abt, a result
consistent with Yan and Zhang (2009). In sum, results on our control variables are consistent
with the literature.
3.3 Robustness
Our results so far notably concern i) the net negative tone of news, ii) abnormal trading
imbalance benchmarked against the estimation window of [-250, -20], and iii) consecutive news
clustering. We now show that our results are robust to alternatives along these dimensions.
We first examine using the negative tone (Neg) instead of net negative tone of news.
Panel A of Table V presents the results. We again observe that Abt is negatively related to Neg
on day 0 only, reaffirming the results with Neg_net in Table IV. In addition, since there are many

20
zero-value observations (about 20% of the sample) in Neg, we remove those observations. The
second half of Panel A of Table V shows that our conclusions remain the same.
[Table V about here.]
Next we turn to abnormal trading imbalance using the estimation window of [-60, -20]
and [20, 60] of Puckett and Yan (2011). The results are in Panel B Table V, which again confirm
that institutions trade on news on day 0. Albeit somewhat weak, the results also show that
institutions trade in the first two days post news announcement but there is no further delayed
reaction to news —this is consistent with our theme that institutions do not predict news but react
to news speedily.
Panel C of Table V takes on various schemes of news clustering: we either cluster all
news articles that are within three days apart, or remove all of the news clusters that have
coverage of more than one day. The former treats news articles within three days apart as a group.
We carry out the latter, because when there are clusters of news, firms may have significant
activities that are otherwise difficult to detect in machine parsing; and the trading pattern that we
uncover may reflect only this part of news but not others. We therefore drop all clustered news
(i.e., any news sequel that consists of two or more days of news articles). Lastly, in Panel C of
Table V, we also remove news that is potentially related to M&A announcements. This is also
due to the confounding-effect consideration. In our previous data screening, we filter out news
surrounding earnings announcement days to remove the compounding effects of earnings
announcements. Other significant firm activities include mergers and acquisitions (M&A). To

21
address the confounding effects from M&A activities, we drop news articles that are three-days
before and after M&A announcements.14 Our results remain robust to these three alternatives.
In Panel D, we consider the effect of the recent financial crisis. One of the common
observations from the recent financial crisis is that there was an elevated demand for liquidity
across board. If so, negative news-driven selling may be aggravated in the financial crisis,
because it is understood that liquidity is in short supply. We create a dummy variable for the
NBER crisis period (Dec. 2007 to June 2009) and interact the dummy variable with Neg_net. As
expected, the interaction term is significantly negative for Abt on day 0 (but not on other days),
indicating that institutions are more sensitive to news contents during the financial crisis.
Importantly, the coefficient estimate on Neg_net is still significantly negative on day 0 and not
significant on other days, confirming our overall conclusion.
Lastly, Panel E considers an alternative tone measure developed from the General
Inquirer’s Harvard-IV-4 classification dictionary. Earlier studies use this dictionary for various
contexts (e.g., Tetlock 2007, Engelberg 2008). Lougharn and Mcdonald (2011) find that about
73.8% of the negative words in the Harvard-IV-4 dictionary do not convey negative information
in the financial context. For completeness, we calculate the measure of Neg_net based on the
word list from the Harvard-IV-4 dictionary and repeat the regression in Table IV. The results are
again robust.
IV. Discussion
4.1 Other informative news contents
14 The M&A announcement dates are from the SDC Platinum. We include all M&A announcement days relating to target, acquirer, and if there is any, target and acquirer parent companies. About 1% of our news sample is [-3, 3] days around M&A announcement dates.

22
So far we examined how institutions trade on the negative tone of news. News stories
contain a heterogeneity of information other than sentiment. Arguably, news related to firm
fundamentals or firm major events has a larger impact than news of “regular” firm events. We
identify two types of news that are related to firm fundamentals and major events: i) news that
contains the word root “earn” , and ii) news on M&A.15 The first type of news follows the
approach in Tetlock, Saar-Tsechansky, and Macskassy (2008), who show that negative words in
news stories that mention the word stem “earn” contain more information about firms’
fundamentals than other stories. The second type of news signals a potential M&A activity, one
of the most important corporate events. In our primary sample of news (i.e., the sample that does
not include news articles in [-3, 3] days around news announcements), more than three-quarters
of news articles do not contain the word “earn,” and the same is true for the M&A related words.
Collectively, 28% of the news articles have at least one occurrence of the key words on “earn” or
M&A.
To examine whether these two types of news indeed have a larger impact on institutional
trading, we run the following regression:
_ _ ∗ ∗ (2)
where ContentDummy is a dummy variable if the new story contains at least once the word stem
of “earn” or the key words related to M&A. Table VI reports the regression results of Equation
(2). We first note that the coefficient estimate of _ on day-0 Abt is significantly negative,
confirming our previous results. As expected, the coefficient estimate on the interaction term of
_ ∗ is not only significantly negative, but also much larger than the
coefficient estimate of _ . The results are similar when Neg is used in lieu of _ . In
15 To identify M&A in the news, we search for the following key words and their stemming in the news: merger, acquisition, M&A.

23
sum, the evidence in Table VI supports the notion that institutions trade more heavily on more
informative news. Institutions, however, do not trade in advance of more informative news.
[Table VI about here.]
News could also be more informative when they are issued as forward-looking statements.
As such, we examine the tone of the forward-looking statements. Panel A of Table VII shows the
distribution statistics of the number of forward-looking sentences in our news sample. In total,
more than 90% of the news articles have at least one sentence of forward-looking statements. We
calculate Neg_net and Neg from the forward-looking statements only and repeat the baseline
regression with these ratios in lieu of the ratios calculated from the full text. Panel B of Table
VII shows that the results using these ratios are highly similar to our baseline results.
[Table VII about here.]
4.2 A Possible reconciliation with the literature
A number of previous studies propose that institutions have the ability to trade in advance
of news. Notably, Griffin, Shu, and Topaloglu (2007) find that a certain group of institutional
investors are able to anticipate the information in the forthcoming quarterly earnings
announcement based on information from past earnings and public reports. And using NYSE
institutional trading data of NYSE stocks from 2003 to 2005 and news announcements from
Reuters, Hendershott, Livdan and Schurhoff (2011) find that institutional order flow predicts the
sentiment of the news.16 Our results, however, are in stark contrast with these studies. In this
section, we offer a potential reconciliation with these studies by showing that the compounding
16 These authors also report that institutional order flow predicts stock return and earnings announcement surprises, similar to Tetlock et al. (2008). We find that institutional trading on news is clustered in day 0; an issue that is not discussed in Hendershott, Livdan and Schurhoff (2011). Our paper is also different by discussing how institutions trade post news announcements.

24
effects of earnings announcements may explain the differences of our study from the previous
ones.
One of the differences of our sample is that we exclude news that is around earnings
announcements. Panel A of Table VIII shows the results when we instead include these news
stories. What we observe now is that while _ and Neg are still significantly related to Abt
of day 0, _ is marginally significantly and negatively and Neg is significantly and
negatively related to Abt of days [-2, -1]. In other words, institutions are able to predict the tone
of news, in particular, the negative tone of news, and trade one to two days in advance.
[Table VIII about here.]
Clearly, the addition of the sample [-3, 3] days around earnings announcement leads to
the different results in Panel A of Table VIII. In order to examine institutions’ predictive trading
ability in detail, we further examine separately the pre-, on, and post-earnings announcement
periods by breaking the [-3, 3] days around earnings announcements to the periods of [-3, -1)
(i.e., pre-earnings announcement and not inclusive of the earnings announcement day), 0
(earnings announcement day), and (1,3] (post earnings announcement days). Panel B of Table
VIII shows that i) on and pre-earnings announcement, Abt of days [-2, -1] is not significantly
related to either _ or Neg; ii) Abt of days [-2, -1] is only significantly related to _
and Neg post-earnings-announcement.17 Therefore, the seemingly predictive power of
institutions in our sample is driven by advance trading on post-earnings-announcement news—
these trades may well dwell on the after-effects of the earnings announcement. In contrast, on
and pre-earnings announcement, institutions do not advance-trade. Overall, the results are
17 In untabulated robustness check, we can report that these results are robust to the additional control of earnings surprise on the earnings announcement day.

25
consistent with the conclusion that institutions trade on but not around news, and they do not
predict the contents of news and trade accordingly.
4.3 What happens on Day 0?
Our previous results indicate that institution trading is clustered on day 0. We now further
show that the day-0 trading is concentrated in a short period of time. As with the portfolio
analysis, we partition news stories into quintiles based on the ranked value of Neg_net and
examine the minute-by-minute trading of the quintile portfolios.18 Figure 3 plots the trading
imbalance and abnormal trading imbalance of the most positive and negative news 360 minutes
before and after the news announcement. We group trading into 15-minute bins relative to the
news time stamp, with the first trading bin (the first 15 minutes) defined as five minutes prior to
and 10 minutes post the news time. From Figure 3, we observe that for the most positive news
(Quintile 1 of Neg_net), there is a spike of net-buying and total trading volume in the first 15
minutes; similarly, total trading volume and net-selling spikes for the most negative news
(Quintile 5 of Neg_net) in the first 15 minutes. The net-buy and net-sell around news are non-
symmetrical: For the most positive news, institutions are more likely to be net-sellers 360
minutes before and after the news; and for the most negative news, institutions are very likely to
be net-sellers 360 minutes before and after the news. These results are consistent with earlier
observation that institutions are net sellers around news (Panel D of Table II).
[Figure 3 about here.]
Table IX further presents the net trading of quintile portfolios sorted on Neg_net. We
examine the significance of the net trading difference between Quintiles 5 and 1. We benchmark
the difference against the average net trading 12 hours to 4 hours before the news announcement
18 In the minute-by-minute analysis, we use regular-hours trading only. We drop pre-hours and after-hours trades following the tradition of market microstructure research.

26
and 4 hours to 12 hours after the news announcement. Compared with the benchmark, none of
the time bins before the news announcement has significant Quintiles 5 and 1 net trading
difference. In contrast, the Quintiles 5 and 1 net trading difference is significantly negative in
time bins 1 and 2 but not immediately afterwards, indicating that institutions react immediately
to news contents. In sum, the evidence suggests that institutions react to news without delay.
[Table IX about here.]
V. Conclusion
We offer a direct test of whether institutional investors exhibit trading advantage when
they face uncertain arrivals of corporate news. We match a comprehensive sample of corporate
news of US firms from the major news sources from 2000 to 2010 with a large database of high-
frequency institutional trades, and examine how institutional investors trade on the qualitative
information embedded in public news releases. We find that the abnormal institutional trading
imbalance is significantly negatively related to the negative tone of news stories on the news-
announcement day but not on other days. Our results indicate that institutions trade speedily on
but do not predict qualitative information in corporate news. To the extent that institutions may
be informed investors, our findings suggest that institutions’ informational advantage stems
mostly from their ability to process information in a highly timely manner.

27
REFERENCES
Acharya, V., and T. Johnson. 2010. More Insiders, More Insider Trading: Evidence from Private Equity Buyouts. Journal of Financial Economics 98 (3), 500–523.
Amihud, Y., 2002. Illiquidity and stock returns: Cross-section and time-series effects, Journal of Financial Markets 5(1), 31-56.
Amihud, Yakov and Yakov, Mendelson, 1986, Asset pricing and the bid/ask spread. Journal of Financial Economics 17, 223- 249.
Anand, A., P. Irvine, A. Puckett and K. Venkataraman, 2010. Performance of institutional trading desks: An analysis of persistence in trading costs, working paper, Southern Methodist University.
Badrinath, S. G., Jayant R. Kale, and Thomas H. Noe, 1995, Of shepherds, sheep, and the crossautocorrelations in equity returns, The Review of Financial Studies 8, 401-430.
Baker, M., and S. Savasoglu, 2010, Limited arbitrage in mergers and acquisitions, Journal of Financial Economics 64, 91-115.
Bodie, Zvi, Alex Kane, and Alan Marcus, 2010, Investments, 9th edt., McGraw-Hill/Irwin Publishing, New York.
Bodnaruk, A., M. Massa, and A. Simonov. 2009. Investment Banks as Insiders and the Market for Corporate Control. Review of Financial Studies 22:4989–5026.
Boehmer, Ekkehart, and Eric K. Kelley, 2009, Institutional investors and the informational efficiency of prices, The Review of Financial Studies 22, 3563-3594.
Brandt, M. W., A. Brav, J. R. Graham, and A. Kumar. 2010. The idiosyncratic volatility puzzle: Time trend or speculative episode? Review of Financial Studies 23: 863–899.
Brunnermeier, Markus and Sannikov Yuliy, 2009, Macroeconomic model with a financial sector, Princeton University, working paper.
Busse, Jeffrey A., Amit Goyal, and SunilWahal, 2010, Performance and persistence in institutional investment management, Journal of Finance 65, 765–790.
Carhart, Mark M., 1997, On persistence in mutual fund performance, Journal of Finance 52, 57–82.
Chang, E. and W. Lewellen. 1984. Market timing and mutual fund investment performance. Journal of Business 57, 57-72.
Chemmanur, T., S. He, and G. Hu. 2009. The role of institutional investors in seasoned equity offerings. Journal of Financial Economics 94: 384-411.
Cohen, Lauren, Frazzini Andrea and Malloy Christopher, 2007, The small world of investing: board connections and mutual fund returns, NBER working paper.
Cremers, K. J. Martijn, and Antti Petajisto, 2009, How active is your fund manager? A new measure that predicts performance, Review of Financial Studies 22, 3329–3365.
Engelberg, Joseph, 2008, Costly information processing: evidence from earnings announcements, University of North Carolina working paper.
Engelberg, Joseph, Reed Adam and Matthew Ringgenberg, 2012, How are shorts informed? Short sellers, news, and information processing, Journal of Financial Economics 105 (2).
Fang, Lily, and Joel Peress, 2009, Media coverage and the cross-section of stock returns, The Journal of Finance 64, 2023 - 2052.

28
Froot, Kenneth A., 1989, Consistent covariance matrix estimation with cross-sectional dependence and heteroskedasticity in financial data, Journal of Financial and Quantitative Analysis 24,333–355.
Gompers, P. and A. Metrick. 2001. Institutional investors and equity prices. The Quarterly Journal of Economics 116, 229-259.
Griffin, John M., Jeffrey H. Harris, and Selim Topaloglu, 2003, The dynamics of institutional and individual trading, Journal of Finance 58, 2285–2320.
Griffin, John M., Tao Shu, and Selim Topaloglu, 2007, How informed are the smart guys? Evidence from short-term institutional trading prior to major events, SSRN eLibrary.
Griffin, John M., Tao Shu, and Selim Topaloglu, 2012, Examining the Dark Side of Financial Markets: Do Institutions Trade on Information from Investment Bank Connections? Review of Financial Studies 25, 2155-2188.
Goldstein, M., P. Irvine and A. Puckett, 2011, Purchasing IPOs with commissions. Journal of Financial and Quantitative Analysis, 1193-1225.
Glosten, L. and P. Milgrom, 1985, Bid, ask and transaction prices in a specialist market with heterogeneously informed traders, Journal of Financial Economics 13, 71-100.
Grossman, S. J., and J. E. Stiglitz, 1980, On the impossibility of informationally efficient markets, American Economic Review, 70, 393–408.
Hasbrouck, J. and Seppi, D. J., 2001, Common factors in prices, order flows and liquidity. Journal of Financial Economics, 59(3):383–411.
Hendershott, Terrence, Dmitry Livdan, and Norman Schurhoff, 2011, Are Institutions Informed About News? Working paper, University of California, Berkeley.
Irvine, Paul, Marc Lipson, and Andy Puckett, 2007, Tipping, The Review of Financial Studies 20, 741-768.
Jegadeesh, Narasimhan, and Sheridan Titman, 1993, Returns to buying winners and selling losers: Implications for stock market efficiency, Journal of Finance 48, 65-91.
Jegadeesh, Narasimhan, and Yue Tang, 2011, Institutional trades around takeover announcements: skill vs. insider information, Emory University, working paper.
Jensen, M. 1968. The performance of mutual funds in the period 1945-1964. Journal of Finance 23, 389-416.
Kandel, Eugene and Neil D. Pearson, 1995, Differential interpretation of public signals and trade in speculative markets, Journal of Political Economy 103, 831-872.
Ke, Bin and Petroni Kathy, 2004, How informed are actively trading institutional investors? Evidence from their trading behavior before a break in a string of consecutive earnings increases, Journal of Accounting Research 42, 895-927.
Kim, Oliver and Robert E. Verrecchia, 1994, Market liquidity and volume around earnings announcements, Journal of Accounting and Economics 17, 41-67.
Klibanoff, Peter, Owen Lamont, and Thierry A. Wizman, 1998, Investor reaction to salient news in closed-end country funds, Journal of Finance 53, 673–699.
Kyle, Albert S., 1985, Continuous auctions and insider trading, Econometrica 53, 1315-1336.
Larson, Chad R., 2008, Accounting fraud and institutional investors, University of Michigan, working paper.

29
Loughran, Tim, and Bill McDonald, 2011, When Is a Liability Not a Liability? Textual Analysis, Dictionaries, and 10-Ks, Journal of Finance 66: 35–65.
Mikhail, M., B. Walther, and R. Willis. 2007. When security analysts talk, who listens? The Accounting Review 82, 1227-1253.
Nofsinger, J. and R. Sias. 1999. Herding and feedback trading by institutional and individual investors. Journal of Finance 54, 2263–2295.
Oppenheimer, H. and Z. Sun. 2009. Institutional trading, analysts recommendations and stock performance. Working paper.
Pastor, L. and Stambaugh, R. F. 2003, Liquidity risk and expected stock returns. Journal of Political Economy, 111(3): 642–685.
Petersen, Mitchell A., 2009, Estimating standard errors in finance panel data sets: Comparing approaches, Review of Financial Studies 22, 435-480.
Puckett, Andy, and Xuemin Sterling Yan, 2011, The interim trading skills of institutional investors, The Journal of Finance 66(2), 601-633.
Rubinstein, Ariel, 1993, On Price Recognition and Computational Complexity in a Monopolistic Model, Journal of Political Economy 101, 473-84.
Sias, Richard W, and Laura T. Starks, 1997, Institutions and individuals at the turn of the year, The Journal of Finance 52, 1543-1562.
Tetlock, Paul C., Maytal Saar-Tsechansky, and Sofus Macskassy, 2008, More than words: quantifying language to measure firms’ fundamentals, The Journal of Finance 63, 1437-1467.
Tetlock, Paul C., 2011, All the News That’s Fit to Reprint: Do Investors React to Stale Information? Review of Financial Studies 24, 1481-1512.
Tetlock, Paul C., 2010, Does Public Financial News Resolve Asymmetric Information? Review of Financial Studies 23, 3520-3557.
Wermers, R. 1999. Mutual fund herding and the impact on stock prices. Journal of Finance 54, 381-622.
Zhao, Xiaofei, 2012, Information Intensity and the Cross-Section of Stock Returns, working paper, University of Toronto.

30
Appendix A News Filtering and Sample Selection
We retrieve corporate news for all U.S firms from the Top Sources in the Factiva database between January 1, 2000 and December 31, 2010. We first follow Tetlock et al. (2008) by requiring that each news release contains at least fifty words in total and that the first twenty five words should mention a company identity, which includes company name, trading ticker, URL and company name initials. We assign a news article to a particular firm that has the highest frequency of company identity mentions in the news article. When there are more than two firm names in the same news article, we compute the frequency of appearance of the two names. If the frequency of the second highest-frequency firm is less than 90% of that of the highest-frequency firm, we assign the news to the highest-frequency firm; otherwise we drop the news from the sample. We obtain nearly 2.2 million news releases that mention a company identity at least once. To minimize false identification of news to a particular company, we require each news article mentions at least three times of the firm identity. We also drop observations that we can not match to a Compustat Gvkey.
# of news
stories # of firms
News stories retrieved from Factiva between Jan. 1, 2000 and Dec. 31, 2010 2,187,720
Subtract:
Non-matched gvkey, and firm identify occurrences less than 3 times (473,384)
Total firm-specific news stories 1,714,336 15,650
Wired news (including Federal Filings Newswires) 1,594,284 15,540
Combine news released on the same trading day for a given firm (506,106) 0
Total composite news stories 1,088,178 15,540
Traded by ANcerno institutions on the day of news announcement 505,352 6,956
Remove [-3,+3] days around quarterly earnings announcements 394,708 6,684
Cluster consecutive news to a single cluster 306,280 6,684

31
Appendix B Variable Definitions
Variable Definition
Abt
Abnormal institutional trading imbalance. The primary measure of abnormal trading balance is the net trading imbalance (buy minus sell), measured as volume turnover, relative to the average net trading imbalance of the benchmark window [-250, -20] days of news announcement. In the benchmark window, all days that are [-3, 3] days around any news announcement are removed. Day-0 Abt refers to the abnormal trading imbalance on the news day; and Abt of a specific day range, such as Abt[-2, -1], refers to the cumulative Abt of the day range.
Neg_net The fraction of total negative word count net of total positive word count relative to the total number of words in a news article, based on the word list of Loughran and McDonald (2011).
Neg The fraction of total negative word count relative to the total number of words in a news article, based on the word list of Loughran and McDonald (2011).
lnme The logarithm of market capitalization at the end of the previous quarter, or at the end of the previous two quarters if the end of the previous quarter is less than 10 days away from the news.
age The logarithm of the number of months that a stock has appeared in the CRSP.
dy The annualized dividend yield of the past 12 months (past 12-month dividend / beginning-of-the-month price).
bm Book value of equity divided by the market value of equity, at the end of the previous quarter, or at the end of the previous two quarters if the end of the previous quarter is less than 10 days away from the news.
prc The logarithm of the average stock price over the days of -27 to -6 (roughly corresponding to past month) relative to news.
turnover The average daily market stock turnover ratio (overall CRSP market trading volume / shares outstanding) over the days of -27 to -6 relative to news.
volatility The standard deviation of stock returns over the days of -27 to -6 relative to news.
sp A dummy variable that equals one if the stock is included in the S&P 500 index.
ff4abret[-27, -6] Cumulative abnormal returns relative to Fama-French four factors of market, size, book to market and momentum over the days of -27 to -6 (roughly corresponding to past month).
ff4abret[-252, -31] Cumulative abnormal returns relative to Fama-French four factors of market, size, book to market and momentum over the days of -252 to -31 (roughly corresponding to past year).
log_media The logarithm of one plus the number of articles mentioning the firm in the prior calendar year. For the first year of the sample (year 2000), this variable refers to the same year.
multiple_dummy A dummy variable that equals one if there are more than one news story written on the firm on the same day.
crisis A dummy variable that equals one if the time falls in the NBER financial crisis period (Dec. 2007 to June 2009).

32
Table I Summary Statistics of Wired News
This table presents the summary statistics of the sample wired news from the following sources: Dow Jones Archive Newswire (“Dow Jones”), Press Release Newswire (“Press Release”), Business Newswire, Reuters Newswire (“Reuters”), Associated Press Newswire (“Associated Press”), and all other sources (“Others”). In Panel A, news at each day is treated independently and is not grouped. In Panels B and C, we group each non-stopping, consecutive-days news-sequel into a news “cluster.” Panel A: News that are accompanied by ANcerno trading on the news announcement day
All News Press Business Associated
Year Sources Dow Jones Release Newswires Reuters Press Others
2000 36,268 8,961 8,589 9,888 1,487 3,086 4,257
2001 40,735 10,482 9,285 11,074 1,677 3,458 4,759
2002 48,376 12,710 10,949 12,716 2,012 4,322 5,667
2003 27,819 7,299 6,681 6,935 1,151 2,558 3,195
2004 16,996 4,456 3,996 4,415 739 1,507 1,883
2005 21,898 5,844 4,792 5,704 953 1,959 2,646
2006 41,411 11,598 8,921 10,194 1,835 4,150 4,713
2007 42,011 12,012 9,135 9,862 2,060 4,165 4,777
2008 43,299 12,387 9,726 10,060 2,003 4,257 4,866
2009 37,409 10,394 8,030 8,786 1,690 3,921 4,588
2010 38,486 10,781 7,981 8,985 1,765 4,306 4,668
Total 394,708 106,924 88,085 98,619 17,372 37,689 46,019
Panel B: Initial Sources of news clusters
All News Press Business Associated
Year Sources Dow Jones Release Newswires Reuters Press Others
2000 28,654 7,064 6,776 7,793 1,173 2,486 3,362
2001 31,492 8,135 7,174 8,433 1,299 2,695 3,756
2002 35,991 9,498 8,113 9,400 1,510 3,216 4,254
2003 22,309 5,751 5,211 5,670 902 2,124 2,651
2004 13,270 3,519 3,030 3,421 614 1,187 1,499
2005 17,027 4,533 3,754 4,305 776 1,579 2,080
2006 32,107 9,055 6,810 7,739 1,441 3,336 3,726
2007 33,165 9,478 7,124 7,783 1,575 3,397 3,808
2008 33,385 9,448 7,409 7,755 1,565 3,374 3,834
2009 29,202 8,084 6,297 6,781 1,313 3,097 3,630
2010 29,678 8,382 6,185 6,760 1,372 3,313 3,666
Total 306,280 82,947 67,883 75,840 13,540 29,804 36,266

33
Table II Summary Statistics of the ANcerno Institutional Trading Data This table includes ANcerno institutional trading of common stocks (those with a share code of 10 or 11 in CRSP). Panel B shows institutional trading on the news announcement days only. In Panel C, “Day 0” refers to the news announcement day, and “Days [-3, 3]” refers to the period three days before and three days after the earnings announcement. In Panel D, “News-day” is defined as [-3, 3] days around news announcement. t-statistics are two-way cluster-adjusted and are in parentheses. Panel A: The full ANcerno sample, 2000-2010 2000 2001 2002 2003 2004 2005 2006 2007 2008 2009 2010 Total No. of institutions 373 400 427 404 406 376 399 377 334 317 308 1,072 Mutual funds 44 65 82 86 119 132 157 157 152 144 139 386 Plan sponsors 329 335 345 318 287 244 242 220 182 173 169 686 # of stocks traded 6,347 5,474 5,196 5,751 6,128 5,891 5,854 5,774 5,331 5,199 4,559 9,860 No. of trades (million) 3.14 3.48 4.37 4.65 6.03 5.40 6.86 7.11 8.15 7.52 7.03 63.73 # of shares traded (billion) 74.6 100.0 133.8 109.3 147.8 121.2 135.6 134.8 160.1 152.4 116.1 1,385.7 Trading volume ($trillion) 3.22 3.03 3.23 2.70 4.20 3.80 4.37 4.77 4.57 3.25 3.06 40.20
Panel B: Institutional trading on news days only 2000 2001 2002 2003 2004 2005 2006 2007 2008 2009 2010 Total No. of institutions 368 397 424 403 405 374 397 374 330 315 303 1,060 # of stocks traded 4,061 3,647 3,603 3,126 2,744 3,033 3,644 3,717 3,406 3,116 3,042 6,739 No. of trades (million) 0.33 0.42 0.60 0.40 0.37 0.39 0.77 0.74 0.89 0.77 0.73 6.42 # of shares traded (billion) 11.3 16.9 29.8 15.2 15.9 15.0 23.7 20.4 26.8 25.1 18.1 218.1 Trading volume ($trillion) 0.55 0.51 0.67 0.37 0.48 0.49 0.74 0.73 0.75 0.51 0.48 6.27
Panel C: Trading per institution per news around news announcement Day 0 Days [-3, 3]
Mean std p25 Median p75 Mean std p25 Median p75 Shares 54,606.1 419,816 675 3,197 17,100 113,280.1 911,935 1,200 5,800 30,400 Dollars (thousand) 1,583.3 11,035.4 20.7 98.9 520.3 3,330.0 25,691.4 36.0 176.9 920.1
Panel D: Total trade and trade imbalance of news vs. non-news days (% turnover) (news-day defined as [-3,3] days around news announcement) News-day Non-news-day Mean
trade days Mean p25 median p75 trade days Mean p25 Median p75 diff. t-stat. Total inst. trading 2,104,270 0.151 0.017 0.061 0.170 5,332,704 0.120 0.011 0.043 0.133 0.031 (26.82) trade imbalance 2,104,270 0.002 -0.031 0.0011 0.037 5,332,704 0.004 -0.023 0.0013 0.031 -0.002 (-5.70)

34
Table III Institutional Trading and Negative Tone: Portfolio Analysis Panel A shows the abnormal trading imbalance of quintile portfolios sorted on Neg_net. Panel B shows the abnormal trading imbalance of portfolios first sorted on a certain firm characteristic then on Neg_net. The firm characteristics include: market capitalization, media coverage, and the past-month return momentum. t-statistics are two-way cluster-adjusted and are in parentheses. Panel A: Abnormal trading imbalance around news announcement
Neg_net Quitile Difference
Day 1 2 3 4 5 5-1 t-stat.
-10 -0.0030 -0.0027 -0.0032 -0.0029 -0.0032 -0.0002 (-0.13)
-9 -0.0043 -0.0026 -0.0023 -0.0043 -0.0038 0.0005 (0.39)
-8 -0.0022 -0.0034 -0.0025 -0.0048 -0.0025 -0.0003 (-0.22)
-7 -0.0046 -0.0021 -0.0018 -0.0031 -0.0027 0.0019 (1.48)
-6 -0.0044 -0.0025 -0.0019 -0.0030 -0.0024 0.0020 (1.41)
-5 -0.0028 -0.0033 -0.0026 -0.0037 -0.0029 0.0000 (-0.01)
-4 -0.0038 -0.0019 -0.0027 -0.0040 -0.0032 0.0007 (0.52)
-3 -0.0039 -0.0030 -0.0033 -0.0032 -0.0032 0.0007 (0.55)
-2 -0.0040 -0.0043 -0.0029 -0.0035 -0.0044 -0.0004 (-0.29)
-1 -0.0043 -0.0038 -0.0025 -0.0039 -0.0064 -0.0021 (-1.35)
0 -0.0053 -0.0049 -0.0037 -0.0060 -0.0125 -0.0072 (-4.36)
1 -0.0033 -0.0040 -0.0032 -0.0034 -0.0056 -0.0022 (-1.50)
2 -0.0039 -0.0036 -0.0039 -0.0031 -0.0047 -0.0008 (-0.57)
3 -0.0057 -0.0028 -0.0038 -0.0046 -0.0050 0.0007 (0.50)
4 -0.0051 -0.0034 -0.0048 -0.0046 -0.0050 0.0001 (0.06)
5 -0.0051 -0.0047 -0.0044 -0.0038 -0.0035 0.0016 (1.24)
6 -0.0039 -0.0043 -0.0058 -0.0040 -0.0051 -0.0012 (-0.87)
7 -0.0037 -0.0034 -0.0041 -0.0035 -0.0047 -0.0010 (-0.78)
8 -0.0047 -0.0048 -0.0055 -0.0039 -0.0038 0.0008 (0.61)
9 -0.0049 -0.0049 -0.0048 -0.0038 -0.0036 0.0013 (0.96)
10 -0.0052 -0.0051 -0.0048 -0.0033 -0.0035 0.0017 (1.25)
Panel B: Abnormal trading imbalance of portfolios first sorted on a firm trait then on Neg_net
Neg_net Market cap Media Coverage Past-Month Ret. Momentum
quintile Large Medium Small High Medium Low High Medium Low
1 -0.00207 -0.00465 -0.00856 -0.00471 -0.00544 -0.00497 -0.00310 -0.00308 -0.00865
5 -0.00221 -0.01342 -0.02255 -0.00559 -0.01179 -0.01840 -0.01148 -0.00858 -0.01557
5-1 -0.00013 -0.00877 -0.01399 -0.00088 -0.00635 -0.01343 -0.00837 -0.00549 -0.00692
(-1.49) (-3.12) (-4.48) (-0.30) (-2.31) (-5.04) (-3.14) (-2.48) (-2.46)

35
Table IV Institutional Trading and News Tone
Abt = abnormal trading imbalance, Neg_net = fraction of negative words net of positive words in each news story, lnme = logarithm of market equity, age = logarithm of months the firm has appeared in CRSP, dy = annualized dividend yield, bm = book to market ratio, prc = average daily stock price of the past month, turnover = stock turnover of the past month, volatility = daily stock return volatility of the past month, sp = a dummy variable indicating whether a stock is included in the S&P500 index, ff4abret[-27, -6] = cumulative abnormal return relative to Fama-French four factors of the past 27 to 6 days, ff4abret[-252, -31] = cumulative abnormal return relative to Fama-French four factors of the past 252 to 31 days, log_media = one plus the number of articles mentioning the firm in the prior calendar year; and multiple_dummy = a dummy variable that equals one if there are more than one news story written on the firm on the same day. See Appendix B for detailed variable definitions. All variables are winsorized at 1% and 99% percentile. t-statistics are two-way cluster-adjusted and are in parentheses. *, **, and *** indicate significance at the 10%, 5%, and 1% levels, respectively.
[-5, -3] [-2, -1] 0 [1, 2] [3, 5] Neg_net 0.087 -0.004 -0.079** -0.025 0.070
(1.38) (-0.08) (-2.42) (-0.52) (1.10) lnme 0.002 0.002 0.001* 0.002* 0.003*
(1.27) (1.49) (1.89) (1.89) (1.83) age 0.002 0.001 0.001 0.001 0.001
(1.02) (0.70) (0.63) (0.76) (0.74) dy 0.072 0.115 0.001 0.051 0.038
(0.69) (1.47) (0.03) (0.68) (0.37) bm -4.217 -5.540* -1.378 -3.822 -4.968
(-1.19) (-1.69) (-0.80) (-1.25) (-1.19) prc -0.008*** -0.006*** -0.002 -0.004** -0.007***
(-3.17) (-3.15) (-1.58) (-2.26) (-2.75) turnover 0.023 -0.056 -0.122 -0.001 -0.216
(0.10) (-0.36) (-1.21) (-0.01) (-1.01) volatility -0.432*** -0.282*** -0.123*** -0.205*** -0.239***
(-5.10) (-4.41) (-3.14) (-3.22) (-2.83) sp 0.004 0.003 0.001 0.001 0.003
(0.92) (0.98) (0.66) (0.25) (0.55) ff4abret[-27 -6] 0.104*** 0.048*** 0.027*** 0.034*** 0.038***
(13.29) (8.14) (7.30) (6.06) (5.12) ff4abretn[-252, -31] 0.002 -0.000 0.002 0.002 -0.002
(0.50) (-0.03) (1.18) (0.79) (-0.54) log_media -0.002 -0.002 -0.001 -0.001 -0.003
(-0.88) (-1.39) (-0.65) (-1.11) (-1.42) multiple_dummy -0.001 -0.001 -0.003*** 0.000 0.000
(-0.33) (-0.56) (-3.02) (0.23) (0.10) Constant 0.032 0.030 -0.009 -0.006 0.040 (0.97) (1.36) (-0.43) (-0.20) (0.99) Year dummy Yes Yes Yes Yes Yes Industry dummy Yes Yes Yes Yes Yes Observations 264,862 262,689 272,561 262,439 264,850 R-squared 0.003 0.002 0.002 0.002 0.002

36
Table V Robustness of Institutional Trading on News Tone
Working from the baseline specification of Table III where we use Neg_net as the news tone proxy and the sample that is removed of news around earnings announcements, this table presents various robustness checks on this baseline specification. In each panel, we alter one dimension of the baseline regression, and run the full-model specification of Table III. Results on all control variables are suppressed for brevity. The left column indicates the news tone measure. In Panel E, “crisis” is a dummy variable that equals one for the recent financial crisis period as defined by NBER (from Dec. 2007 to June 2009). t-statistics are two-way cluster-adjusted and are in parentheses. *, **, and *** indicate significance at the 10%, 5%, and 1% levels, respectively. Panel A: Using Neg instead of Neg_net as news tone measure
Including all obs. Removing zero-Neg obs.
Abt at day(s) Abt at day(s)
[-2,-1] 0 [1,2] [-2,-1] 0 [1,2]
Neg -0.094 -0.196*** -0.094 -0.078 -0.213*** -0.077
(-1.47) (-4.73) (-1.60) (-1.19) (-4.58) (-1.19) Panel B: Using abnormal trading imbalance derived using window of [-60, -20] and [20, 60]
Abt at day(s)
[-5,-3] [-2,-1] 0 [1, 2] [3, 5]
Neg_net -0.001 -0.063 -0.111*** -0.078* -0.005
(-0.01) (-1.37) (-3.60) (-1.74) (-0.09)
Panel C: Alternative news-clustering schemes and other confounding factors
Clustering of consecutive news Further removing
that are within 3 days apart Removing all news clusters M&A news
Abt at day(s) Abt at day(s) Abt at day(s)
[-2,-1] 0 [1,2] [-2,-1] 0 [1,2] [-2,-1] 0 [1,2]
Neg_net -0.041 -0.095*** -0.054 -0.007 -0.076** -0.028 -0.015 -0.082** -0.026
(-0.76) (-2.64) (-1.02) (-0.14) (-2.27) (-0.57) (-0.30) (-2.54) (-0.53) Panel D: Financial Crisis
Abt at day(s)
[-2,-1] 0 [1,2]
Neg_net 0.005 -0.065* -0.066
(0.10) (-1.89) (-1.32)
Neg_net*crisis -0.136 -0.138* 0.204
(-1.02) (-1.70) (1.61) Panel E: Alterntaive news-tone measure (Harvard-IV-4 dictionary)
Abt at day(s)
[-2,-1] 0 [1,2]
Neg_net -0.025 -0.120*** -0.046
(-0.59) (-4.35) (-1.11)

37
Table VI Institutional Trading on More Informative News Contents
ContentDummy is a dummy variable if the news article contains either the word stem “earn” or key words related to “M&A” at least one time. See Appendix B for all other variable definitions. t-statistics are two-way cluster-adjusted and are in parentheses. *, **, and *** indicate significance at the 10%, 5%, and 1% levels, respectively.
Abt at day(s) Abt at day(s)
[-2,-1] 0 [1,2] [-2,-1] 0 [1,2]
Neg_net -0.002 -0.049* -0.022 (-0.03) (-1.66) (-0.43)
Neg_net * ContentDummy -0.066 -0.205*** -0.041 (-0.64) (-2.91) (-0.41)
Neg -0.068 -0.124*** -0.062 (-1.14) (-3.05) (-1.05)
Neg * ContentDummy -0.116 -0.312*** -0.138 (-1.16) (-4.37) (-1.33)
lnme 0.001 0.001* 0.002* 0.001 0.001* 0.002* (1.23) (1.66) (1.68) (1.27) (1.75) (1.71)
age 0.001 0.000 0.000 0.001 0.000 0.000 (0.41) (0.15) (0.26) (0.43) (0.19) (0.28)
dy 0.110 0.007 0.049 0.111 0.008 0.049 (1.43) (0.16) (0.65) (1.44) (0.19) (0.66)
bm -2.595 -0.423 -0.606 -2.546 -0.357 -0.571 (-0.84) (-0.25) (-0.23) (-0.83) (-0.21) (-0.22)
prc -0.005*** -0.001 -0.003* -0.005*** -0.001 -0.003* (-2.72) (-1.14) (-1.65) (-2.76) (-1.18) (-1.67)
turnover -0.095 -0.134 -0.053 -0.092 -0.131 -0.051 (-0.61) (-1.32) (-0.34) (-0.59) (-1.30) (-0.32)
volatility -0.271*** -0.117*** -0.179*** -0.270*** -0.116*** -0.178*** (-4.24) (-3.00) (-2.81) (-4.22) (-2.98) (-2.80)
sp 0.004 0.002 0.002 0.005 0.002 0.002 (1.32) (0.95) (0.67) (1.32) (0.99) (0.68)
ff4abret[-27,-6] 0.048*** 0.027*** 0.035*** 0.048*** 0.027*** 0.035*** (8.42) (7.45) (6.27) (8.38) (7.38) (6.24)
ff4abret[-252,-31] 0.001 0.002 0.003 0.001 0.002 0.003 (0.50) (1.36) (1.21) (0.47) (1.30) (1.18)
log_media -0.002 -0.000 -0.002 -0.002 -0.001 -0.002 (-1.38) (-0.49) (-1.15) (-1.41) (-0.61) (-1.18)
multiple_dummy -0.000 -0.003*** 0.001 -0.000 -0.003*** 0.001 (-0.30) (-2.99) (0.46) (-0.10) (-2.63) (0.62)
Constant 0.030 -0.008 -0.007 0.031 -0.006 -0.006 (1.39) (-0.37) (-0.22) (1.41) (-0.30) (-0.20)
Year dummy Yes Yes Yes Yes Yes Yes Industry dummy Yes Yes Yes Yes Yes Yes Observations 258,733 268,443 258,492 258,733 268,443 258,492 R-squared 0.002 0.002 0.001 0.002 0.002 0.001

38
Table VII Institutional Trading on the Tone of Forward-Looking-Statements
Neg_net and Neg in this table are defined from the forward-looking statements of each news article. Neg_net is the fraction of negative words, net of positive words, in total words in the forward-looking statements. Neg is the fraction of negative words in total words in the forward-looking statements. See Appendix B for all other variable definitions. t-statistics are two-way cluster-adjusted and are in parentheses. *, **, and *** indicate significance at the 10%, 5%, and 1% levels, respectively.
Panel A: Number of sentences of forward-looking statements per news
Mean Std 10th percentile Median 90th percentile 4.06 3.22 1 3.43 5.5
Panel B: Institutional trading on the tone of forward-looking statements
Abt at day(s) Abt at day(s) [-2,-1] 0 [1,2] [-2,-1] 0 [1,2]
Neg_net -0.021 -0.053** 0.013 (-0.61) (-2.28) (0.40)
Neg -0.073 -0.124*** 0.004 (-1.50) (-3.65) (0.09)
lnme 0.001 0.001 0.002 0.001 0.001 0.002 (1.10) (1.46) (1.43) (1.12) (1.50) (1.44)
age 0.001 0.000 0.000 0.001 0.000 0.000 (0.64) (0.12) (0.29) (0.65) (0.15) (0.29)
dy 0.119 0.013 0.069 0.119 0.013 0.070 (1.46) (0.28) (0.86) (1.46) (0.29) (0.86)
bm -3.131 -0.280 -0.699 -3.098 -0.237 -0.691 (-1.12) (-0.17) (-0.27) (-1.11) (-0.14) (-0.27)
prc -0.005*** -0.001 -0.003 -0.005*** -0.001 -0.003 (-2.85) (-1.07) (-1.53) (-2.87) (-1.13) (-1.53)
turnover -0.068 -0.149 -0.051 -0.066 -0.147 -0.051 (-0.41) (-1.40) (-0.31) (-0.40) (-1.38) (-0.31)
volatility -0.271*** -0.123*** -0.176*** -0.270*** -0.121*** -0.176*** (-4.05) (-3.00) (-2.66) (-4.03) (-2.97) (-2.66)
sp 0.005 0.002 0.003 0.005 0.002 0.003 (1.50) (1.16) (0.80) (1.50) (1.19) (0.80)
ff4abret[-27,-6] 0.050*** 0.028*** 0.037*** 0.050*** 0.028*** 0.037*** (8.38) (7.43) (6.52) (8.36) (7.39) (6.52)
ff4abret[-252,-31] 0.001 0.002 0.003 0.001 0.002 0.003 (0.53) (1.39) (1.29) (0.51) (1.35) (1.29)
log_media -0.002 -0.000 -0.001 -0.002 -0.000 -0.001 (-1.24) (-0.27) (-0.92) (-1.24) (-0.24) (-0.93)
multiple_dummy -0.000 -0.003*** 0.000 -0.000 -0.003*** 0.000 (-0.12) (-3.06) (0.25) (-0.05) (-2.93) (0.27)
Constant 0.037 -0.009 0.008 0.037 -0.008 0.008 (1.34) (-0.38) (0.24) (1.35) (-0.35) (0.24) Year dummy Yes Yes Yes Yes Yes Yes Industry dummy Yes Yes Yes Yes Yes Yes Observations 235,679 244,451 235,480 235,679 244,451 235,480 R-squared 0.002 0.002 0.001 0.002 0.002 0.001
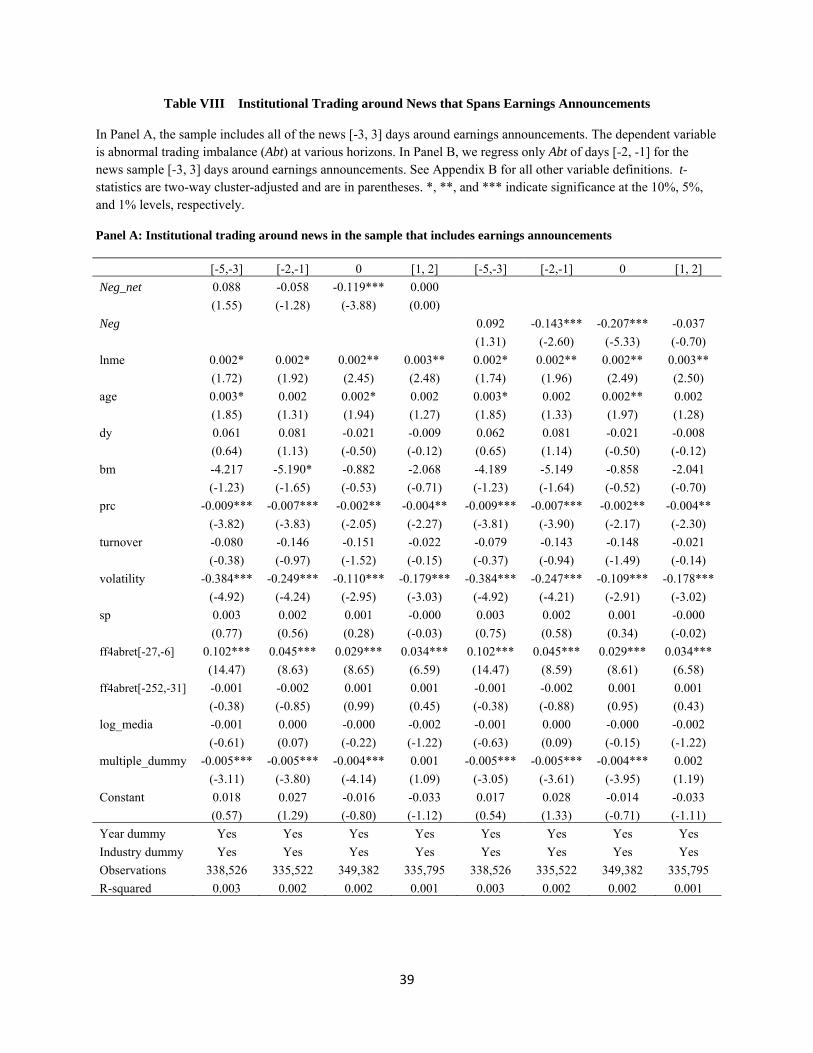
39
Table VIII Institutional Trading around News that Spans Earnings Announcements
In Panel A, the sample includes all of the news [-3, 3] days around earnings announcements. The dependent variable is abnormal trading imbalance (Abt) at various horizons. In Panel B, we regress only Abt of days [-2, -1] for the news sample [-3, 3] days around earnings announcements. See Appendix B for all other variable definitions. t-statistics are two-way cluster-adjusted and are in parentheses. *, **, and *** indicate significance at the 10%, 5%, and 1% levels, respectively.
Panel A: Institutional trading around news in the sample that includes earnings announcements
[-5,-3] [-2,-1] 0 [1, 2] [-5,-3] [-2,-1] 0 [1, 2]
Neg_net 0.088 -0.058 -0.119*** 0.000
(1.55) (-1.28) (-3.88) (0.00)
Neg 0.092 -0.143*** -0.207*** -0.037
(1.31) (-2.60) (-5.33) (-0.70)
lnme 0.002* 0.002* 0.002** 0.003** 0.002* 0.002** 0.002** 0.003**
(1.72) (1.92) (2.45) (2.48) (1.74) (1.96) (2.49) (2.50)
age 0.003* 0.002 0.002* 0.002 0.003* 0.002 0.002** 0.002
(1.85) (1.31) (1.94) (1.27) (1.85) (1.33) (1.97) (1.28)
dy 0.061 0.081 -0.021 -0.009 0.062 0.081 -0.021 -0.008
(0.64) (1.13) (-0.50) (-0.12) (0.65) (1.14) (-0.50) (-0.12)
bm -4.217 -5.190* -0.882 -2.068 -4.189 -5.149 -0.858 -2.041
(-1.23) (-1.65) (-0.53) (-0.71) (-1.23) (-1.64) (-0.52) (-0.70)
prc -0.009*** -0.007*** -0.002** -0.004** -0.009*** -0.007*** -0.002** -0.004**
(-3.82) (-3.83) (-2.05) (-2.27) (-3.81) (-3.90) (-2.17) (-2.30)
turnover -0.080 -0.146 -0.151 -0.022 -0.079 -0.143 -0.148 -0.021
(-0.38) (-0.97) (-1.52) (-0.15) (-0.37) (-0.94) (-1.49) (-0.14)
volatility -0.384*** -0.249*** -0.110*** -0.179*** -0.384*** -0.247*** -0.109*** -0.178***
(-4.92) (-4.24) (-2.95) (-3.03) (-4.92) (-4.21) (-2.91) (-3.02)
sp 0.003 0.002 0.001 -0.000 0.003 0.002 0.001 -0.000
(0.77) (0.56) (0.28) (-0.03) (0.75) (0.58) (0.34) (-0.02)
ff4abret[-27,-6] 0.102*** 0.045*** 0.029*** 0.034*** 0.102*** 0.045*** 0.029*** 0.034***
(14.47) (8.63) (8.65) (6.59) (14.47) (8.59) (8.61) (6.58)
ff4abret[-252,-31] -0.001 -0.002 0.001 0.001 -0.001 -0.002 0.001 0.001
(-0.38) (-0.85) (0.99) (0.45) (-0.38) (-0.88) (0.95) (0.43)
log_media -0.001 0.000 -0.000 -0.002 -0.001 0.000 -0.000 -0.002
(-0.61) (0.07) (-0.22) (-1.22) (-0.63) (0.09) (-0.15) (-1.22)
multiple_dummy -0.005*** -0.005*** -0.004*** 0.001 -0.005*** -0.005*** -0.004*** 0.002
(-3.11) (-3.80) (-4.14) (1.09) (-3.05) (-3.61) (-3.95) (1.19)
Constant 0.018 0.027 -0.016 -0.033 0.017 0.028 -0.014 -0.033
(0.57) (1.29) (-0.80) (-1.12) (0.54) (1.33) (-0.71) (-1.11)
Year dummy Yes Yes Yes Yes Yes Yes Yes Yes
Industry dummy Yes Yes Yes Yes Yes Yes Yes Yes
Observations 338,526 335,522 349,382 335,795 338,526 335,522 349,382 335,795
R-squared 0.003 0.002 0.002 0.001 0.003 0.002 0.002 0.001
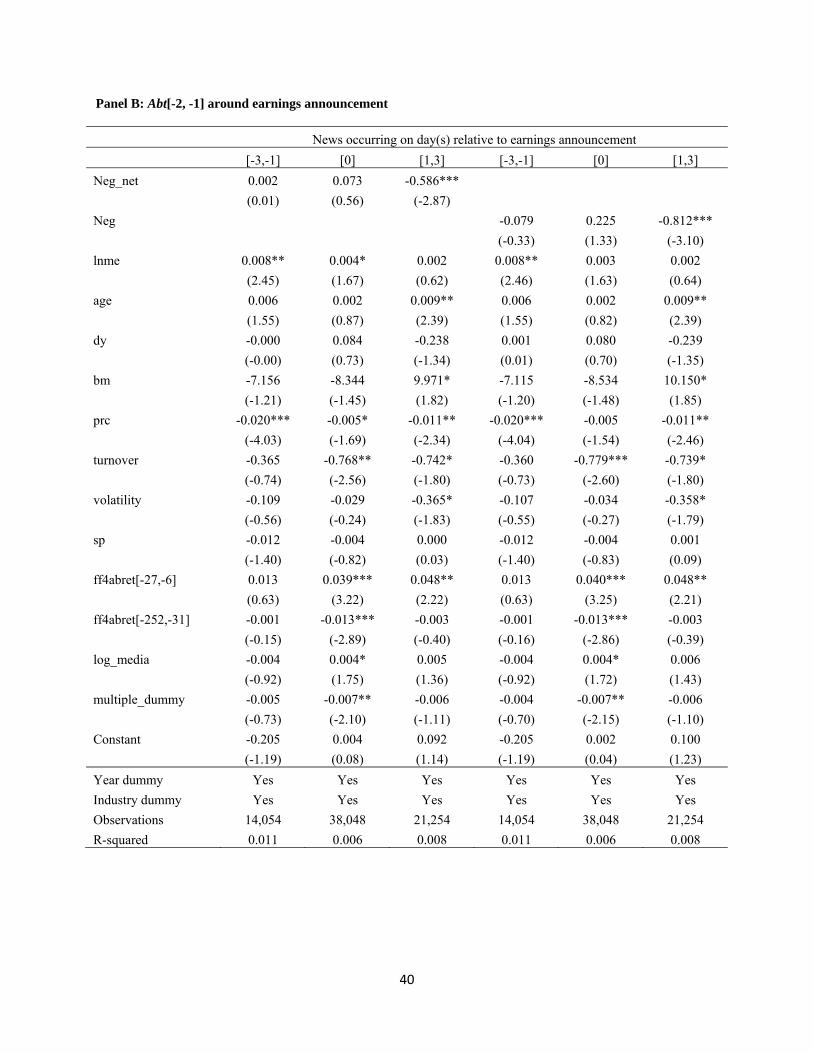
40
Panel B: Abt[-2, -1] around earnings announcement
News occurring on day(s) relative to earnings announcement
[-3,-1] [0] [1,3] [-3,-1] [0] [1,3]
Neg_net 0.002 0.073 -0.586***
(0.01) (0.56) (-2.87)
Neg -0.079 0.225 -0.812***
(-0.33) (1.33) (-3.10)
lnme 0.008** 0.004* 0.002 0.008** 0.003 0.002
(2.45) (1.67) (0.62) (2.46) (1.63) (0.64)
age 0.006 0.002 0.009** 0.006 0.002 0.009**
(1.55) (0.87) (2.39) (1.55) (0.82) (2.39)
dy -0.000 0.084 -0.238 0.001 0.080 -0.239
(-0.00) (0.73) (-1.34) (0.01) (0.70) (-1.35)
bm -7.156 -8.344 9.971* -7.115 -8.534 10.150*
(-1.21) (-1.45) (1.82) (-1.20) (-1.48) (1.85)
prc -0.020*** -0.005* -0.011** -0.020*** -0.005 -0.011**
(-4.03) (-1.69) (-2.34) (-4.04) (-1.54) (-2.46)
turnover -0.365 -0.768** -0.742* -0.360 -0.779*** -0.739*
(-0.74) (-2.56) (-1.80) (-0.73) (-2.60) (-1.80)
volatility -0.109 -0.029 -0.365* -0.107 -0.034 -0.358*
(-0.56) (-0.24) (-1.83) (-0.55) (-0.27) (-1.79)
sp -0.012 -0.004 0.000 -0.012 -0.004 0.001
(-1.40) (-0.82) (0.03) (-1.40) (-0.83) (0.09)
ff4abret[-27,-6] 0.013 0.039*** 0.048** 0.013 0.040*** 0.048**
(0.63) (3.22) (2.22) (0.63) (3.25) (2.21)
ff4abret[-252,-31] -0.001 -0.013*** -0.003 -0.001 -0.013*** -0.003
(-0.15) (-2.89) (-0.40) (-0.16) (-2.86) (-0.39)
log_media -0.004 0.004* 0.005 -0.004 0.004* 0.006
(-0.92) (1.75) (1.36) (-0.92) (1.72) (1.43)
multiple_dummy -0.005 -0.007** -0.006 -0.004 -0.007** -0.006
(-0.73) (-2.10) (-1.11) (-0.70) (-2.15) (-1.10)
Constant -0.205 0.004 0.092 -0.205 0.002 0.100
(-1.19) (0.08) (1.14) (-1.19) (0.04) (1.23)
Year dummy Yes Yes Yes Yes Yes Yes
Industry dummy Yes Yes Yes Yes Yes Yes
Observations 14,054 38,048 21,254 14,054 38,048 21,254
R-squared 0.011 0.006 0.008 0.011 0.006 0.008

41
Table IX Trading Three Hours Before and After the News Announcement
This table shows the net institutional trading balance three hours before and three hours after the news announcement. Each time bin represents 15 minutes, and the time duration shown ranges from -12th time bin to 12th time bin. The robust P-value is from the test whether the difference between quintiles 5 and 1 is different from the benchmark, where the benchmark of each news announcement is defined as the average quintiles-5 and 1 difference of net trading 12 hours to 4 hours before the news announcement and 4 hours to 12 hours after the news announcement.
Neg_net Quintile Diff.
15m bin 1 2 3 4 5 5-1 P-value
-12 -0.00024 -0.00010 -0.00054 -0.00103 -0.00091 -0.00067 [0.79]
-11 0.00017 -0.00021 -0.00049 -0.00066 -0.00099 -0.00116 [0.15]
-10 -0.00004 0.00020 -0.00084 -0.00065 -0.00057 -0.00053 [0.46]
-9 -0.00005 -0.00024 0.00004 -0.00051 -0.00119 -0.00114 [0.24]
-8 0.00013 -0.00042 0.00000 -0.00068 -0.00085 -0.00098 [0.45]
-7 -0.00016 -0.00002 0.00003 -0.00056 -0.00112 -0.00097 [0.49]
-6 -0.00001 -0.00021 -0.00038 -0.00062 -0.00090 -0.00090 [0.60]
-5 -0.00004 -0.00013 -0.00050 -0.00058 -0.00090 -0.00085 [0.68]
-4 0.00007 -0.00021 -0.00014 -0.00070 -0.00118 -0.00125 [0.18]
-3 -0.00012 0.00003 -0.00025 -0.00029 -0.00094 -0.00082 [0.82]
-2 -0.00001 -0.00017 -0.00059 -0.00068 -0.00084 -0.00083 [0.76]
-1 -0.00009 -0.00057 -0.00055 -0.00055 -0.00110 -0.00100 [0.41]
1 0.00091 0.00067 -0.00031 -0.00036 -0.00206 -0.00297 [<0.01]
2 -0.00026 -0.00025 -0.00046 -0.00130 -0.00154 -0.00129 [0.09]
3 -0.00022 -0.00062 -0.00036 -0.00097 -0.00094 -0.00072 [0.93]
4 -0.00031 -0.00026 -0.00065 -0.00104 -0.00081 -0.00051 [0.47]
5 -0.00030 -0.00038 -0.00064 -0.00117 -0.00127 -0.00098 [0.49]
6 0.00012 -0.00034 -0.00053 -0.00111 -0.00078 -0.00090 [0.62]
7 0.00002 -0.00013 -0.00068 -0.00053 -0.00107 -0.00109 [0.32]
8 0.00012 -0.00030 -0.00055 -0.00093 -0.00112 -0.00125 [0.10]
9 -0.00067 -0.00006 -0.00036 -0.00099 -0.00051 0.00016 [<0.01]
10 -0.00015 -0.00026 -0.00053 -0.00073 -0.00097 -0.00082 [0.82]
11 -0.00011 -0.00020 -0.00066 -0.00108 -0.00141 -0.00130 [0.57]
12 0.00001 0.00001 -0.00044 -0.00081 -0.00140 -0.00140 [0.07]

Mean = - 0.0007
Std. = 0.015
-0.040 -0.030 -0.020 -0.010 0 0.010 0.020 0.030 0.040 0.050 0.060
0
5
10
15
20
25
%
Neg_net
(a) Neg net
Mean = 0.009
Std. = 0.011
0 0.005 0.010 0.015 0.020 0.025 0.030 0.035 0.040 0.045 0.050 0.055 0.060
0
10
20
30
40
50
%
Neg
(b) Neg
Figure 1: Percentage histogram
42

%
-0.012
-0.010
-0.008
-0.006
-0.004
-0.002
0.000
0.002
0.004
Event day
-10 -9 -8 -7 -6 -5 -4 -3 -2 -1 0 1 2 3 4 5 6 7 8 9 10
Abnormal trade Q5-Q1
(a) Neg net Q5–Q1 abnormal trade imbalance differ-ence
%
-0.012
-0.010
-0.008
-0.006
-0.004
-0.002
0.000
0.002
0.004
Event day
-10 -9 -8 -7 -6 -5 -4 -3 -2 -1 0 1 2 3 4 5 6 7 8 9 10
Abnormal trade Q5-Q1
(b) Neg Q5–Q1 abnormal trade imbalance difference
Figure 2: Abnormal trading imbalance difference between news-tone Quintiles 5 and 1
43

Imb
-0.0004
-0.0002
0.0000
0.0002
0.0004
0.0006
0.0008
0.0010
0.0012
Time (each bin is 15 m.)
-24 -21 -18 -15 -12 -9 -6 -3 0 3 6 9 12 15 18 21 24
Tot.
0.000
0.005
0.010
0.015
0.020
0.025
0.030
0.035
0.040Trade Imbalance Total Trade
(a) Most positive news: Quintile 1 of Neg net
Imb
-0.0022
-0.0020
-0.0018
-0.0016
-0.0014
-0.0012
-0.0010
-0.0008
-0.0006
-0.0004
-0.0002
0.0000
0.0002
0.0004
0.0006
Time (each bin is 15 m.)
-24 -21 -18 -15 -12 -9 -6 -3 0 3 6 9 12 15 18 21 24
Tot.
0.000
0.005
0.010
0.015
0.020
0.025
0.030
0.035
0.040Trade Imbalance Total Trade
(b) Most negative news: Quintile 5 of Neg net
Figure 3: Net trading imbalance and total trading 360 minutes before and after the news announce-ment. Each bin represents 15 minutes. The left vertical axis indicates net trading imbalance, andthe right vertical axis indicates total trading.
44