housing… still crazy after all these years economic issues & residential real estate business...
Post on 21-Dec-2015
215 views
TRANSCRIPT

Housing…
Still CRAZY
After All These
Years
Housing…
Still CRAZY
After All These
Years Economic Issues & Residential Real Estate Business Trends Forum
Washington, DC -- May 2005
David Lereah, Ph.D., Chief EconomistNATIONAL ASSOCIATION OF REALTORS®
Economic Issues & Residential Real Estate Business Trends Forum
Washington, DC -- May 2005
David Lereah, Ph.D., Chief EconomistNATIONAL ASSOCIATION OF REALTORS®
Bubble or Bust? Bubble or Bust?
• Wall Street Bears -- Monitoring Housing Performance
• Media Sensationalizing Bubble Stories
• Loose lending and speculative buying raising bubble risks
• Sub-prime, interest only, ARMS, and negative amortization loans on the rise
• Speculative Buying: What is it?
• Wall Street Bears -- Monitoring Housing Performance
• Media Sensationalizing Bubble Stories
• Loose lending and speculative buying raising bubble risks
• Sub-prime, interest only, ARMS, and negative amortization loans on the rise
• Speculative Buying: What is it?

Wall Street Monitoring Ratios Wall Street Monitoring Ratios
• Price-to-Income Ratio
• Price-to-Rent Ratio
• Overvalued/Undervalued Markets
• Homeowners Carrying Burdensome Mortgage Debt
• Price-to-Income Ratio
• Price-to-Rent Ratio
• Overvalued/Undervalued Markets
• Homeowners Carrying Burdensome Mortgage Debt

Home Price to Income RatioHome Price to Income Ratio
2
3
4
1968 1971 1974 1977 1980 1983 1986 1989 1992 1995 1998 2001 2004
Median Single-family home price to Median family income
2
3
4
1968 1971 1974 1977 1980 1983 1986 1989 1992 1995 1998 2001 2004
Median Single-family home price to Median family income
Source: NAR

Home Price to Rent RatioHome Price to Rent Ratio
0.8
0.9
1.0
1.1
1.2
1.3
1981 1983 1985 1987 1989 1991 1993 1995 1997 1999 2001 2003 2005
House price index to rent index
0.8
0.9
1.0
1.1
1.2
1.3
1981 1983 1985 1987 1989 1991 1993 1995 1997 1999 2001 2003 2005
House price index to rent index
Source: NAR, BLS
House price index =100 and rent index = 100 in 1983

Mortgage Debt Service to IncomeMortgage Debt Service to Income
8.0
9.0
10.0
11.0
1981 1983 1985 1987 1989 1991 1993 1995 1997 1999 2001 2003
Mortgage Financial Obligation Ratio
8.0
9.0
10.0
11.0
1981 1983 1985 1987 1989 1991 1993 1995 1997 1999 2001 2003
Mortgage Financial Obligation Ratio
Source: Federal Reserve
Several Markets experienced price declines when above 10%
%

Mortgage DebtMortgage Debt
0.0
2.0
4.0
6.0
8.0
10.0
1981 1983 1985 1987 1989 1991 1993 1995 1997 1999 2001 2003
Mortgage Debt in $trillion
0.0
2.0
4.0
6.0
8.0
10.0
1981 1983 1985 1987 1989 1991 1993 1995 1997 1999 2001 2003
Mortgage Debt in $trillion
Source: Federal Reserve

Often-Said Overvalued - Undervalued Markets
Often-Said Overvalued - Undervalued Markets
Overvalued Undervalued
San Francisco Buffalo
San Diego Toledo
Los Angeles Syracuse
New York Indianapolis
Honolulu Salt Lake City

Speculative Buying: What is it?Speculative Buying: What is it?• Quick and sizable profit and loss potential • More difficult to recoup initial transaction cost• More vulnerable to panic selling• Lose tax advantage if non-occupied and selling within
2 years• Wider prevalence of interest-only, cash-flow (negative
amortization), and adjustable-rate mortgages• Heavy pre-construction
purchase/sales• Flipping
• Quick and sizable profit and loss potential • More difficult to recoup initial transaction cost• More vulnerable to panic selling• Lose tax advantage if non-occupied and selling within
2 years• Wider prevalence of interest-only, cash-flow (negative
amortization), and adjustable-rate mortgages• Heavy pre-construction
purchase/sales• Flipping

Looser Lending StandardsLooser Lending Standards
• Fierce industry competition• Short-term focus• Lower FICO score• Higher debt servicing-to-income ratios• Rising minimal-documentation loans• Reliability of desktop/drive-by appraisals?• Government push to lend in areas with high risk
borrowers • Will unseasoned loans come under pressure from rising
rates and weaker labor market?

Recent Surge in Adjustable Loans Despite Low 30-year Rates
Recent Surge in Adjustable Loans Despite Low 30-year Rates
0
10
20
30
40
50
2001
- Ja
n
2002
- Ja
n
2003
- Ja
n
2004
- Ja
n
2005
- Ja
n
% Adjustable Loans 30-year rate
0
10
20
30
40
50
2001
- Ja
n
2002
- Ja
n
2003
- Ja
n
2004
- Ja
n
2005
- Ja
n
% Adjustable Loans 30-year rate%
Source: Federal Housing Finance Board

Markets With More Adjustable Loans
Markets With More Adjustable Loans
0
10
20
30
40
50
60
70
80
90
100
San D
iego
San F
ranc
isco
Sacra
men
to
Denve
r
Los A
ngel
es
Chica
go
Colum
bus
Las V
egas U.S
.
% Adjustable Loans
0
10
20
30
40
50
60
70
80
90
100
San D
iego
San F
ranc
isco
Sacra
men
to
Denve
r
Los A
ngel
es
Chica
go
Colum
bus
Las V
egas U.S
.
% Adjustable Loans
%
Source: Federal Housing Finance Board

Where is it Happening?Where is it Happening?
• Select Hot Vacation Communities
• Select Hot Retirement Destinations
• Select Markets with Vibrant Downtowns
• Select Hot Vacation Communities
• Select Hot Retirement Destinations
• Select Markets with Vibrant Downtowns

The Other Side of the Housing Coin
The Other Side of the Housing Coin

Other Side of the Housing CoinOther Side of the Housing Coin• Market realties suggest rational buying
• Second-home buying on the rise
• Inventories remain lean
• Housing affordability remains high
• Lower closing costs
• Larger down payments
• Real price declines are misleading
• Comparisons to stock market are nonsensical
• Foreign housing markets possess larger bubbles than U.S.
• Main street not listening to Wall Street
• Market realties suggest rational buying
• Second-home buying on the rise
• Inventories remain lean
• Housing affordability remains high
• Lower closing costs
• Larger down payments
• Real price declines are misleading
• Comparisons to stock market are nonsensical
• Foreign housing markets possess larger bubbles than U.S.
• Main street not listening to Wall Street

Housing Market RealitiesHousing Market Realities
• Buyers outnumber sellers
• Financial checks and balance in place
– Mortgage companies screen and lend to only those that are financially capable
– Mortgage companies are for-profit and will be financially disciplined if taking on too much risk
– Lower closing cost allows for additional financial stretching
• Sought-after homes are often non-quantifiable
– Nice weather, ocean views, vibrant downtown

Existing-Home Sales Existing-Home Sales
0
1
2
3
4
5
6
7
8
1981
1983
1985
1987
1989
1991
1993
1995
1997
1999
2001
2003
Total existing home sales
0
1
2
3
4
5
6
7
8
1981
1983
1985
1987
1989
1991
1993
1995
1997
1999
2001
2003
Total existing home salesIn million units
Source: NAR

Second-Home Buying on the RiseSecond-Home Buying on the Rise
64%
23%
13%
Primary Investment Vacation
Source: NAR

Typical Second-Home BuyersTypical Second-Home BuyersInvestment Homes
Vacation Homes
Age 47 years old 55 years old
Income $85,700 $71,000
Distance from primary home
18 miles 49 miles
Home price $148,000 $190,000
Reason for buying
Rental income and diversify investments
Family retreat and future retirement home
Source: NAR

Top Markets for Second-Home Purchases
Top Markets for Second-Home Purchases
0
10
20
30
40
50
60
Myr
tle B
each
Atlantic
City
Naple
s
Barns
tabl
e
Panam
a City
Wili
min
gton N
C
Punta
Gor
da
Ft. M
eyer
s
% Loans for non-occupied home purchase
0
10
20
30
40
50
60
Myr
tle B
each
Atlantic
City
Naple
s
Barns
tabl
e
Panam
a City
Wili
min
gton N
C
Punta
Gor
da
Ft. M
eyer
s
% Loans for non-occupied home purchase
%
Source: 2003 HMDA

Top Large Markets for Second-Home Purchases Top Large Markets for
Second-Home Purchases
0
5
10
15
20
25
Las V
egas
Wes
t Pal
m B
each
Tallah
asse
eRen
o
Orlando
Honolu
lu
Charle
ston
Mia
mi
Tampa
Ft. Lau
derda
le
% Loans for non-occupied home purchase
0
5
10
15
20
25
Las V
egas
Wes
t Pal
m B
each
Tallah
asse
eRen
o
Orlando
Honolu
lu
Charle
ston
Mia
mi
Tampa
Ft. Lau
derda
le
% Loans for non-occupied home purchase
%
Source: 2003 HMDA
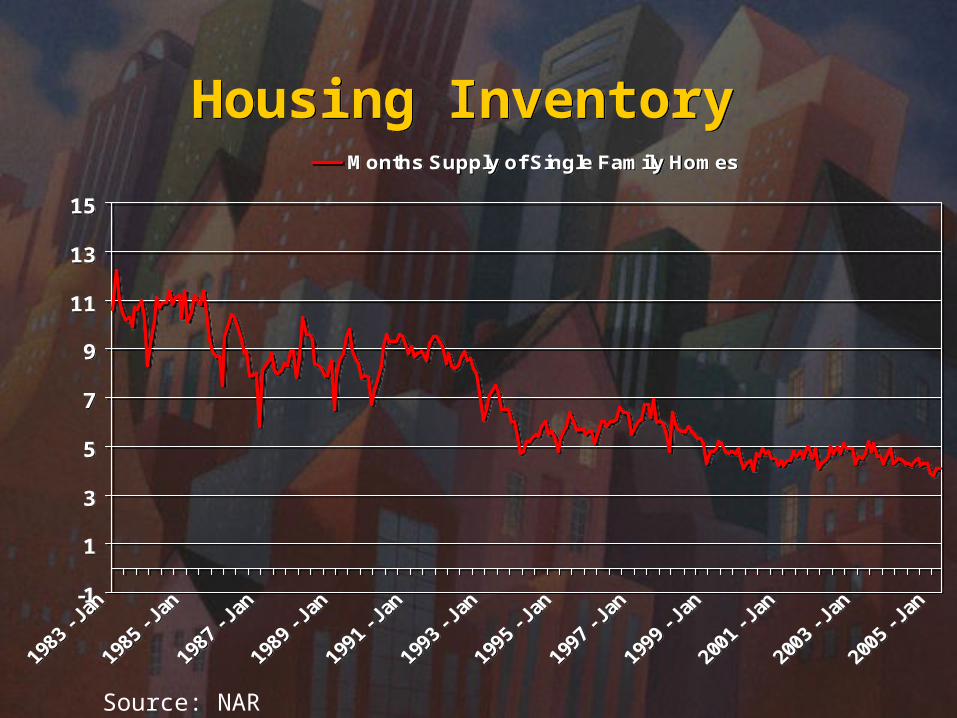
Housing Inventory Housing Inventory
-1
1
3
5
7
9
11
13
15
Months Supply of Single Family Homes
-1
1
3
5
7
9
11
13
15
Months Supply of Single Family Homes
Source: NAR

Typical Homebuyer’s Mortgage Payment
Typical Homebuyer’s Mortgage Payment
0
10
20
30
40
1983
- Ja
n
1985
- Ja
n
1987
- Ja
n
1989
- Ja
n
1991
- Ja
n
1993
- Ja
n
1995
- Ja
n
1997
- Ja
n
1999
- Ja
n
2001
- Ja
n
2003
- Ja
n
2005
- Ja
n
Mortgage payment as % of income for median priced home by a median income family
0
10
20
30
40
1983
- Ja
n
1985
- Ja
n
1987
- Ja
n
1989
- Ja
n
1991
- Ja
n
1993
- Ja
n
1995
- Ja
n
1997
- Ja
n
1999
- Ja
n
2001
- Ja
n
2003
- Ja
n
2005
- Ja
n
Mortgage payment as % of income for median priced home by a median income family
Source: NAR

Housing Affordability Still HighHousing Affordability Still High
50
75
100
125
150
1983
- Ja
n
1985
- Ja
n
1987
- Ja
n
1989
- Ja
n
1991
- Ja
n
1993
- Ja
n
1995
- Ja
n
1997
- Ja
n
1999
- Ja
n
2001
- Ja
n
2003
- Ja
n
2005
- Ja
n
Housing affordability
50
75
100
125
150
1983
- Ja
n
1985
- Ja
n
1987
- Ja
n
1989
- Ja
n
1991
- Ja
n
1993
- Ja
n
1995
- Ja
n
1997
- Ja
n
1999
- Ja
n
2001
- Ja
n
2003
- Ja
n
2005
- Ja
n
Housing affordability
Source: NAR
Rates have to rise to 8.6%to bring Affordability to 100

Lower Closing Costs Lower Closing Costs
0
0.5
1
1.5
2
2.5
3
1983
- Ja
n
1985
- Ja
n
1987
- Ja
n
1989
- Ja
n
1991
- Ja
n
1993
- Ja
n
1995
- Ja
n
1997
- Ja
n
1999
- Ja
n
2001
- Ja
n
2003
- Ja
n
2005
- Ja
n
Initial Fees and Charges
0
0.5
1
1.5
2
2.5
3
1983
- Ja
n
1985
- Ja
n
1987
- Ja
n
1989
- Ja
n
1991
- Ja
n
1993
- Ja
n
1995
- Ja
n
1997
- Ja
n
1999
- Ja
n
2001
- Ja
n
2003
- Ja
n
2005
- Ja
n
Initial Fees and Charges
Source: Federal Housing Finance Board
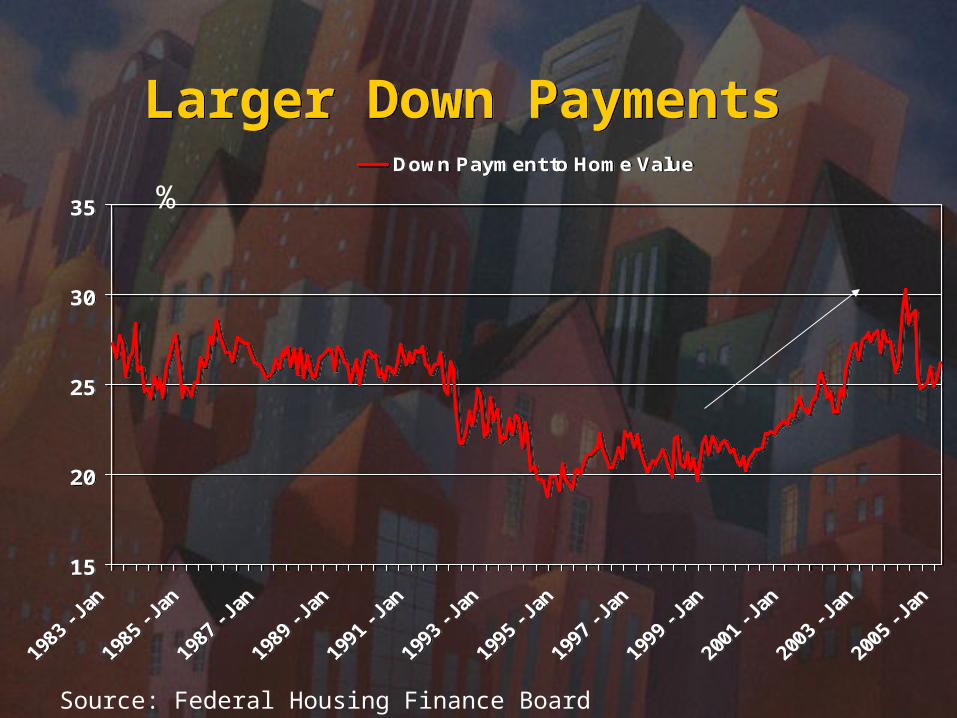
Larger Down Payments Larger Down Payments
15
20
25
30
35
Down Payment to Home Value
15
20
25
30
35
Down Payment to Home Value
Source: Federal Housing Finance Board
%

“Real” Home Prices Do Decline
“Real” Home Prices Do Decline
-5.0
-3.0
-1.0
1.0
3.0
5.0
7.0
9.0
1969 1972 1975 1978 1981 1984 1987 1990 1993 1996 1999 2002
Home price growth - CPI inflation
-5.0
-3.0
-1.0
1.0
3.0
5.0
7.0
9.0
1969 1972 1975 1978 1981 1984 1987 1990 1993 1996 1999 2002
Home price growth - CPI inflation
Source: NAR

Misleading “Real” Home Price Analysis
Misleading “Real” Home Price Analysis
• Real price growth = nominal price growth – consumer price inflation
• If home price rise 2% and inflation heats to 3%, then real home price decline of 1%
• A homebuyer does not suffer from this real price decline– Buys a typical home at $185,000 with 10% down
– Price rise 2% to $188,700
– $18,500 down payment results in $3,700 return
– Rate of return = 20%, easily beating 3% inflation rate

Misleading Stock Market to Real Estate Comparisons
Misleading Stock Market to Real Estate Comparisons
• NASDAQ bubble resulted in 75% peak to trough decline (2000 to 2002)
• A similar offing for housing?
• Apples/Oranges Comparison
• NASDAQ bubble resulted in 75% peak to trough decline (2000 to 2002)
• A similar offing for housing?
• Apples/Oranges Comparison

Apples/OrangesApples/Oranges
Feature Stocks Homes
Buy and Sell Easy, quick Time-consuming
Transaction cost $7 to $200 $ thousands
Benefits Purely financial Financial and a place for life experiences
Investment funds from where?
No questions asked Mortgage lender scrutiny
Price Declines Some years, months, days, hours, seconds
No national price decline since the 1930s
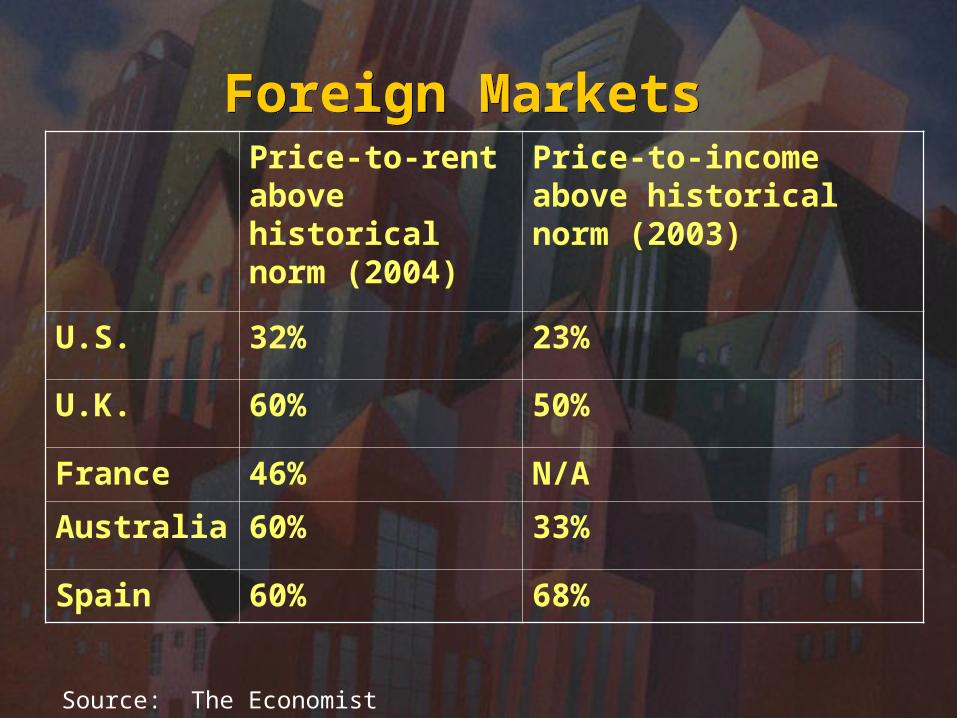
Foreign Markets Foreign Markets Price-to-rent above historical norm (2004)
Price-to-income above historical norm (2003)
U.S. 32% 23%
U.K. 60% 50%
France 46% N/A
Australia 60% 33%
Spain 60% 68%
Source: The Economist

Foreign Markets Foreign Markets
Recent price trend
U.S. 8.5% in 2003 and 9.3% in 2004
U.K. 25% in 2002 and more than 10% in 2003 and 2004
France 16% in 2004
Australia 19% in 2003 and 3% in 2004
Hong Kong 31% in 2004
Spain 17% in 2004
Source: The Economist

Foreign Markets Foreign Markets Condo/Apartment
Price per square footTokyo $1,271
Hong Kong $1,220
London $1,101
Singapore $906
New York (Manhattan) $890
Sydney $839
Paris $700
San Francisco $620
Source: Corcoran Group

Main Street Benefiting byNot Listening to Wall StreetMain Street Benefiting by
Not Listening to Wall Street
0
2
4
6
8
10
12
2000 2004
RE Equity
0
2
4
6
8
10
12
2000 2004
RE Equity
$ trillions
Source: Federal Reserve
$3 trillion gain in four year

Most Local Balloons will Deflate Rather than Pop
Most Local Balloons will Deflate Rather than Pop
• Modest rise in mortgage Rates
• Growing local economy
• Steady job gains
• Lean inventories
• Modest rise in mortgage Rates
• Growing local economy
• Steady job gains
• Lean inventories

Perfect Storm Required for Local Home Price Decline
Perfect Storm Required for Local Home Price Decline
• Strong prior run-up in home prices
• Economic recession
• Local job losses lasting several years
• Sharp rise in inventories
• Speculators leaving the markets quickly
• Strong prior run-up in home prices
• Economic recession
• Local job losses lasting several years
• Sharp rise in inventories
• Speculators leaving the markets quickly

Boom/Bust IndicatorsBoom/Bust IndicatorsBoom Indicators Bust Indicators
Home sales Rising Falling
Price growth Exceeds historical average
Below historical average
Housing inventory
Less then 5.5 months supply
More than 6.5 months supply
Days on market Falling Rising
Local job growth Rising Falling
Mortgage rates Falling Rising
Net migration Positive Negative
Loan-to-Value Falling Rising

Real Estate Doesn’t Need A Boom to Roar
Real Estate Doesn’t Need A Boom to Roar

The Benefits of Real EstateThe Benefits of Real Estate
Real Estate:• Outperforms stocks• Is number-one vehicle for creating wealth• Is America’s greatest
leveraged investment• Offers great tax benefits and government
subsidies• Increases borrowing power• Generates social benefits to both the
property owner and community
Real Estate:• Outperforms stocks• Is number-one vehicle for creating wealth• Is America’s greatest
leveraged investment• Offers great tax benefits and government
subsidies• Increases borrowing power• Generates social benefits to both the
property owner and community

Real Estate Outperforms Stock Market Over Many Years
Real Estate Outperforms Stock Market Over Many Years
020406080
100120140160180
1970 1980 1990
RE
SP 500
020406080
100120140160180
1970 1980 1990
RE
SP 500
$ thousand
Source: NAR
RE gains = home price in 2004 – home price in start year + 20% down paymentStock gain = 20% down payment * stock market growth from start year to 2004Note: excludes amortization

Median Household Net Worth Median Household Net Worth
171.7
122.3
4.8 40
50
100
150
200
Homeowner Renter
2001
1998
1995
1992
171.7
122.3
4.8 40
50
100
150
200
Homeowner Renter
2001
1998
1995
1992
$ thousand
Source: Federal Reserve
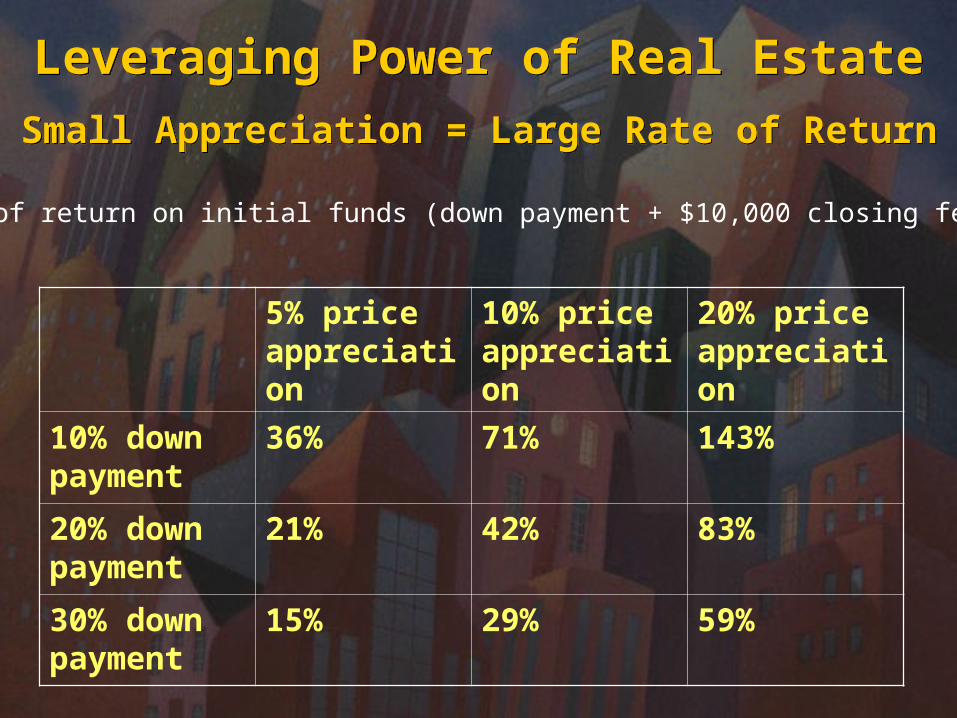
Leveraging Power of Real EstateSmall Appreciation = Large Rate of Return
Leveraging Power of Real EstateSmall Appreciation = Large Rate of Return
5% price appreciation
10% price appreciation
20% price appreciation
10% down payment
36% 71% 143%
20% down payment
21% 42% 83%
30% down payment
15% 29% 59%
Rate of return on initial funds (down payment + $10,000 closing fees)

Tax Benefits and Government Programs
Tax Benefits and Government Programs
• Mortgage Interest Deduction
• Property Tax Deduction
• Capital Gains Tax Exclusion (for most)
• FHA/VA Mortgage Products
• Fannie Mae/Freddie Mac
Low Down Payment Products
• Federal Home Loan Bank
• Mortgage Interest Deduction
• Property Tax Deduction
• Capital Gains Tax Exclusion (for most)
• FHA/VA Mortgage Products
• Fannie Mae/Freddie Mac
Low Down Payment Products
• Federal Home Loan Bank

Increased Borrowing PowerIncreased Borrowing Power
• Cash-out Refinancing
• Home Equity Loans
• Home Equity Lines of Credit (HELOC)
• Cash-out Refinancing
• Home Equity Loans
• Home Equity Lines of Credit (HELOC)
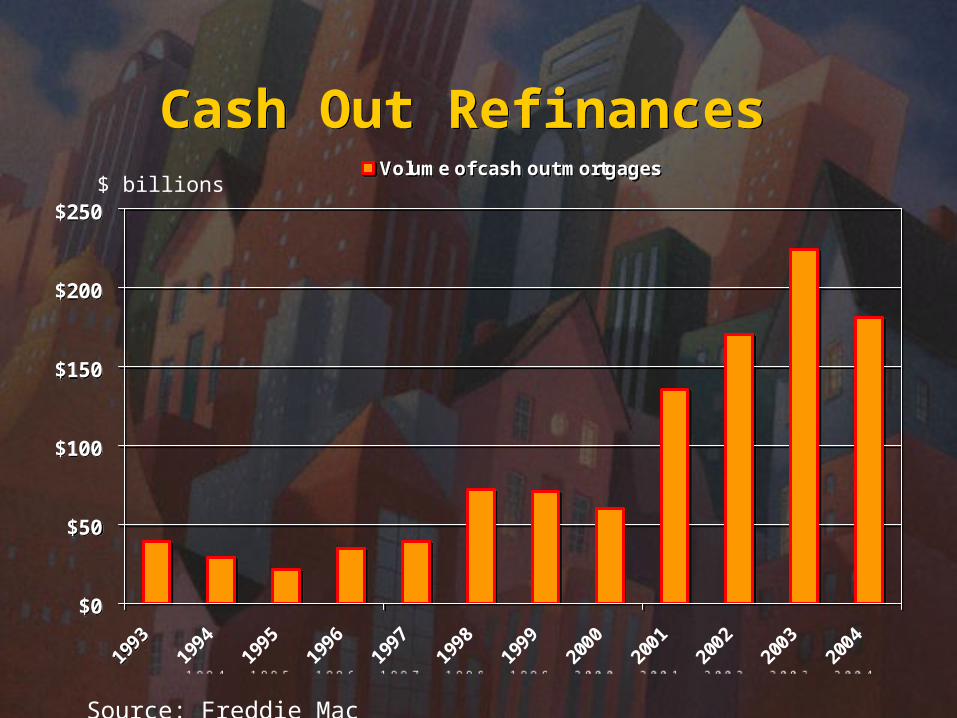
Cash Out Refinances Cash Out Refinances
$0
$50
$100
$150
$200
$250
1993
1994
1995
1996
1997
1998
1999
2000
2001
2002
2003
2004
Volume of cash out mortgages
$0
$50
$100
$150
$200
$250
1993
1994
1995
1996
1997
1998
1999
2000
2001
2002
2003
2004
Volume of cash out mortgages$ billions
Source: Freddie Mac

Social Benefits of Owning Real EstateSocial Benefits of
Owning Real Estate
• Higher Student Test Scores
• Lower Teen Delinquency
• Higher Lifetime Income
• Higher Voter Participation
• Better Physical Health
• Easier Access to Small Business Capital
• Neighborhood Stability
• Pride in Neighborhood/Community
• Higher Student Test Scores
• Lower Teen Delinquency
• Higher Lifetime Income
• Higher Voter Participation
• Better Physical Health
• Easier Access to Small Business Capital
• Neighborhood Stability
• Pride in Neighborhood/Community

Economic BackdropEconomic Backdrop

Economy Expanding butLosing Momentum
Economy Expanding butLosing Momentum
-2
-1
0
1
2
3
4
5
6
7
8
Q1 '00
Q1 '01
Q1 '02
Q1 '03
Q1 '04
Q1 '05
Real Gross Domestic Product (SAAR, Bil.Chn.2000$)
-2
-1
0
1
2
3
4
5
6
7
8
Q1 '00
Q1 '01
Q1 '02
Q1 '03
Q1 '04
Q1 '05
Real Gross Domestic Product (SAAR, Bil.Chn.2000$)
Source: BEA

Jobs AddedBut Not Consistently Robust
Jobs AddedBut Not Consistently Robust
-500
-400
-300
-200
-100
0
100
200
300
400
500
600
2000
- Ja
n
2000
- Ju
l
2001
- Ja
n
2001
- Ju
l
2002
- Ja
n
2002
- Ju
l
2003
- Ja
n
2003
- Ju
l
2004
- Ja
n
2004
- Ju
l
2005
- Ja
n
-500
-400
-300
-200
-100
0
100
200
300
400
500
600
2000
- Ja
n
2000
- Ju
l
2001
- Ja
n
2001
- Ju
l
2002
- Ja
n
2002
- Ju
l
2003
- Ja
n
2003
- Ju
l
2004
- Ja
n
2004
- Ju
l
2005
- Ja
n
Source: BLS
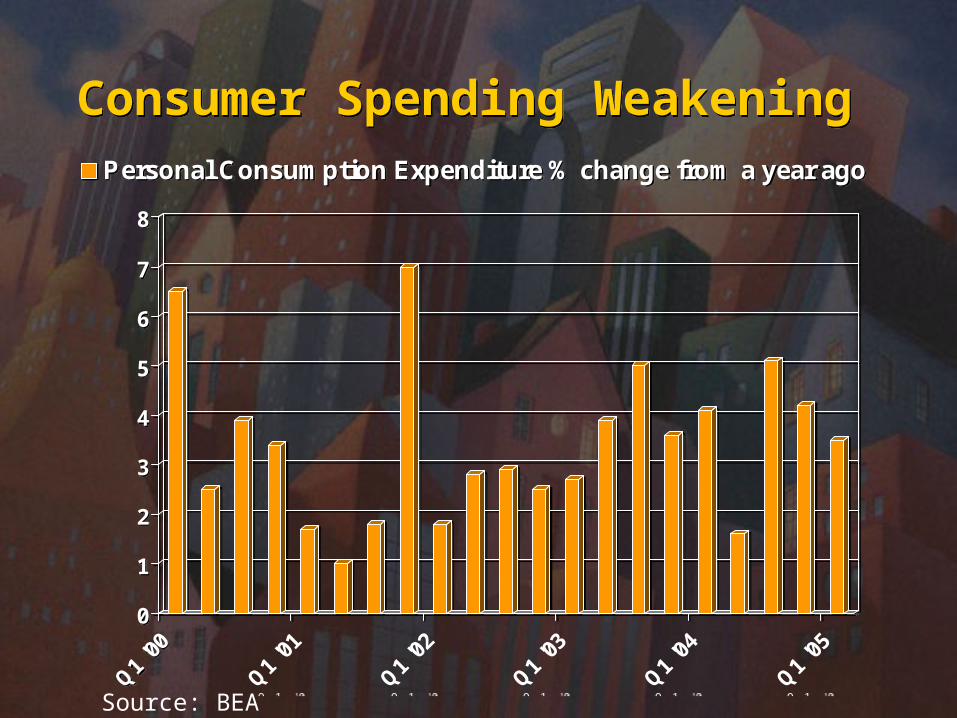
Consumer Spending Weakening Consumer Spending Weakening
0
1
2
3
4
5
6
7
8
Q1 '00
Q1 '01
Q1 '02
Q1 '03
Q1 '04
Q1 '05
Personal Consumption Expenditure % change from a year ago
0
1
2
3
4
5
6
7
8
Q1 '00
Q1 '01
Q1 '02
Q1 '03
Q1 '04
Q1 '05
Personal Consumption Expenditure % change from a year ago
Source: BEA

Durable Goods Orders TumblingDurable Goods Orders Tumbling
-25
-20
-15
-10
-5
0
5
10
15
20
2000
- J
an
2001
- J
an
2002
- J
an
2003
- J
an
2004
- J
an
2005
- J
an
-25
-20
-15
-10
-5
0
5
10
15
20
2000
- J
an
2001
- J
an
2002
- J
an
2003
- J
an
2004
- J
an
2005
- J
an
% change from a year ago
Source: Census

Stock Market Pessimistic about Future Business
Stock Market Pessimistic about Future Business
600
700
800
900
1000
1100
1200
1300
1400
1500
1600
1999
- Ja
n
2000
- Ja
n
2001
- Ja
n
2002
- Ja
n
2003
- Ja
n
2004
- Ja
n
2005
- Ja
n
S&P 500
600
700
800
900
1000
1100
1200
1300
1400
1500
1600
1999
- Ja
n
2000
- Ja
n
2001
- Ja
n
2002
- Ja
n
2003
- Ja
n
2004
- Ja
n
2005
- Ja
n
S&P 500

Accumulating RisksAccumulating Risks
• Budget Deficit
• Trade Deficit/Dollar
• High Oil Price
• Inflation
• Social Security reform/non-reform
• Tax reform
• GSE reform
• Budget Deficit
• Trade Deficit/Dollar
• High Oil Price
• Inflation
• Social Security reform/non-reform
• Tax reform
• GSE reform

Deficit ContinuingDeficit Continuing
-500
-400
-300
-200
-100
0
100
200
300
90 92 94 96 98 '00 '02 '04 '06 '08 '10 '12 '14
Federal Budget Surplus or Deficit {-}: CBO Projections (Fiscal Yr, Bil.$)
-500
-400
-300
-200
-100
0
100
200
300
90 92 94 96 98 '00 '02 '04 '06 '08 '10 '12 '14
Federal Budget Surplus or Deficit {-}: CBO Projections (Fiscal Yr, Bil.$)
CBO assumes tax rates revert back to pre 2001
Source: CBO

Trade Deficit Swelling Trade Deficit Swelling
-700
-600
-500
-400
-300
-200
-100
0
1980 1983 1986 1989 1992 1995 1998 2001 2004
Net Exports
-700
-600
-500
-400
-300
-200
-100
0
1980 1983 1986 1989 1992 1995 1998 2001 2004
Net Exports
Source: BEA

Dollar Under PressureDollar Under Pressure
100
105
110
115
120
125
130
135
1997
- Ja
n
1998
- Ja
n
1999
- Ja
n
2000
- Ja
n
2001
- Ja
n
2002
- Ja
n
2003
- Ja
n
2004
- Ja
n
2005
- Ja
n
Trade-weighted exchange value of dollar (1997 = 100)
100
105
110
115
120
125
130
135
1997
- Ja
n
1998
- Ja
n
1999
- Ja
n
2000
- Ja
n
2001
- Ja
n
2002
- Ja
n
2003
- Ja
n
2004
- Ja
n
2005
- Ja
n
Trade-weighted exchange value of dollar (1997 = 100)
Source: Federal Reserve

Inflation Building Inflation Building
0
0.5
1
1.5
2
2.5
3
3.5
4
Jan-0
0
Jan '0
1
Jan '0
2
Jan '0
3
Jan '0
4
Jan '0
5
Core Overall CPI
0
0.5
1
1.5
2
2.5
3
3.5
4
Jan-0
0
Jan '0
1
Jan '0
2
Jan '0
3
Jan '0
4
Jan '0
5
Core Overall CPI% change from a year ago
Source: BLS
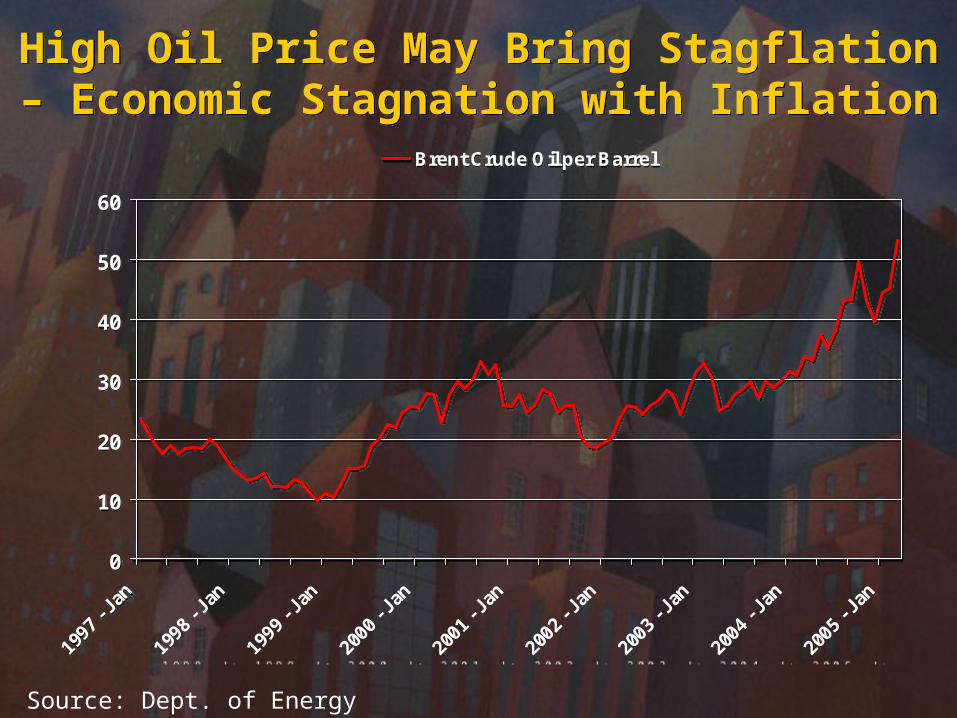
High Oil Price May Bring Stagflation – Economic Stagnation with Inflation
High Oil Price May Bring Stagflation – Economic Stagnation with Inflation
0
10
20
30
40
50
60
1997
- Ja
n
1998
- Ja
n
1999
- Ja
n
2000
- Ja
n
2001
- Ja
n
2002
- Ja
n
2003
- Ja
n
2004
- Ja
n
2005
- Ja
n
Brent Crude Oil per Barrel
0
10
20
30
40
50
60
1997
- Ja
n
1998
- Ja
n
1999
- Ja
n
2000
- Ja
n
2001
- Ja
n
2002
- Ja
n
2003
- Ja
n
2004
- Ja
n
2005
- Ja
n
Brent Crude Oil per Barrel
Source: Dept. of Energy

Fed Nervous About Inflation – Forced to Tighten Credit
Fed Nervous About Inflation – Forced to Tighten Credit
0
1
2
3
4
5
6
7
Jan-0
0
Jan '0
1
Jan '0
2
Jan '0
3
Jan '0
4
Jan '0
5
Federal Open Market Committee: Fed Funds Target Rate (%)
0
1
2
3
4
5
6
7
Jan-0
0
Jan '0
1
Jan '0
2
Jan '0
3
Jan '0
4
Jan '0
5
Federal Open Market Committee: Fed Funds Target Rate (%)
Forecast to4.00% by Dec. 2005

Narrow Spreads Suggest Further Short-term Fed Rate Hikes Pushing up Long-term
Rates
Narrow Spreads Suggest Further Short-term Fed Rate Hikes Pushing up Long-term
Rates
0
1
2
3
4
5
6
7
Jan-0
0
Jan '0
1
Jan '0
2
Jan '0
3
Jan '0
4
Mar
'05
3-month 10-year Treasury
0
1
2
3
4
5
6
7
Jan-0
0
Jan '0
1
Jan '0
2
Jan '0
3
Jan '0
4
Mar
'05
3-month 10-year Treasury

Industry Challenges Industry Challenges• Tax Reform
– Mortgage interest deduction– Home equity loan interest deduction– Second home interest deduction– Property tax deduction– Capital gains tax exclusion– Estate tax– National sales tax
• GSE Reform– Financial scandals– Impact on mortgage liquidity
• Tax Reform– Mortgage interest deduction– Home equity loan interest deduction– Second home interest deduction– Property tax deduction– Capital gains tax exclusion– Estate tax– National sales tax
• GSE Reform– Financial scandals– Impact on mortgage liquidity

Economic OutlookEconomic Outlook
2005 2006
GDP 3.3% 3.3%
Unemployment Rate 5.3% 5.5%
CPI Inflation 2.9% 2.8%
Real Disposable Income 3.5% 3.8%
10-year Treasury 4.6% 5.2%

Housing OutlookHousing Outlook
2005 2006
Existing-Home Sales 6.70 million 6.47 million
New Home Sales 1.17 million 1.04 million
Housing Starts 1.97 million 1.83 million
30-Year FRM 6.2% 6.8%
1-Year ARM 4.8% 5.6%
Existing-Home Price Growth 7.1% 4.5%

Housing…
Still CRAZY
After All These
Years
Housing…
Still CRAZY
After All These
Years Economic Issues & Residential Real Estate Business Trends Forum
Washington, DC -- May 2005
David Lereah, Ph.D., Chief EconomistNATIONAL ASSOCIATION OF REALTORS®
Economic Issues & Residential Real Estate Business Trends Forum
Washington, DC -- May 2005
David Lereah, Ph.D., Chief EconomistNATIONAL ASSOCIATION OF REALTORS®