housing market update greater moncton0104.nccdn.net/1_5/2d9/0a0/2f6/moncton-housing... · canada...
TRANSCRIPT

Housing market intelligence you can count on
Housing Market Update
Greater Moncton

CANADA MORTGAGE AND HOUSING CORPORATION
Multi-Residential/Rental Market
Resale Market
2013/2014 Outlook
Housing Market Drivers
New Home Market – Single Family Homes

CANADA MORTGAGE AND HOUSING CORPORATIONSource: Statistics Canada Labour Force Survey
Em
plo
yed/L
abour
Forc
e (
000’s)
4%
5%
6%
7%
8%
9%
10%
11%
0
10
20
30
40
50
60
70
80
90
100
Employment Labour Force Unemployment Rate
Moncton CMA
Total Employment, Labour Force (000’s) and
Unemployment Rate (%)
Unem
plo
yment
Rat
e (
%)

CANADA MORTGAGE AND HOUSING CORPORATIONSource: Statistics Canada Labour Force Survey
Annual Employment Growth
2.2%
7.4%
1.0%
2.6%
0.3% 0.1%
-0.6%
4.5%
1.6%
-3.2%
0.3%
4.3%
-2.5%
-4%
-2%
0%
2%
4%
6%
8%
10%
2001 2002 2003 2004 2005 2006 2007 2008 2009 2010 2011 2012 2013
YTD
Moncton CMA
Average Annual
Increase (2001-2012)1.7% Employed 2012 74,200

CANADA MORTGAGE AND HOUSING CORPORATIONSource: Statistics Canada Labour Force Survey
Annual Employment Change by Age GroupYear-to-Date 2013 vs. 2012
-18.9%
0.9%2.3%
-24%
-20%
-16%
-12%
-8%
-4%
0%
4%
8%
12%
15-24 25-44 45-64
Moncton CMA
Year-to-date = January to October
CANADA MORTGAGE AND HOUSING CORPORATIONSource: Statistics Canada Labour Force Survey
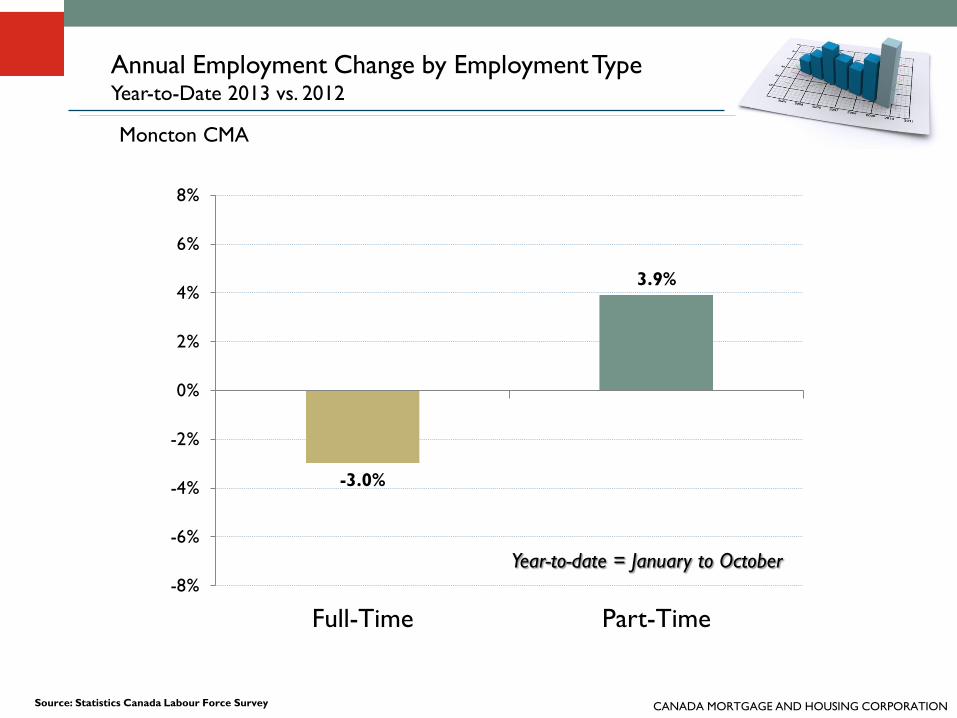
Annual Employment Change by Employment TypeYear-to-Date 2013 vs. 2012
-3.0%
3.9%
-8%
-6%
-4%
-2%
0%
2%
4%
6%
8%
Full-Time Part-Time
Moncton CMA
Year-to-date = January to October
CANADA MORTGAGE AND HOUSING CORPORATION
-3,000
-2,500
-2,000
-1,500
-1,000
-500
0
500
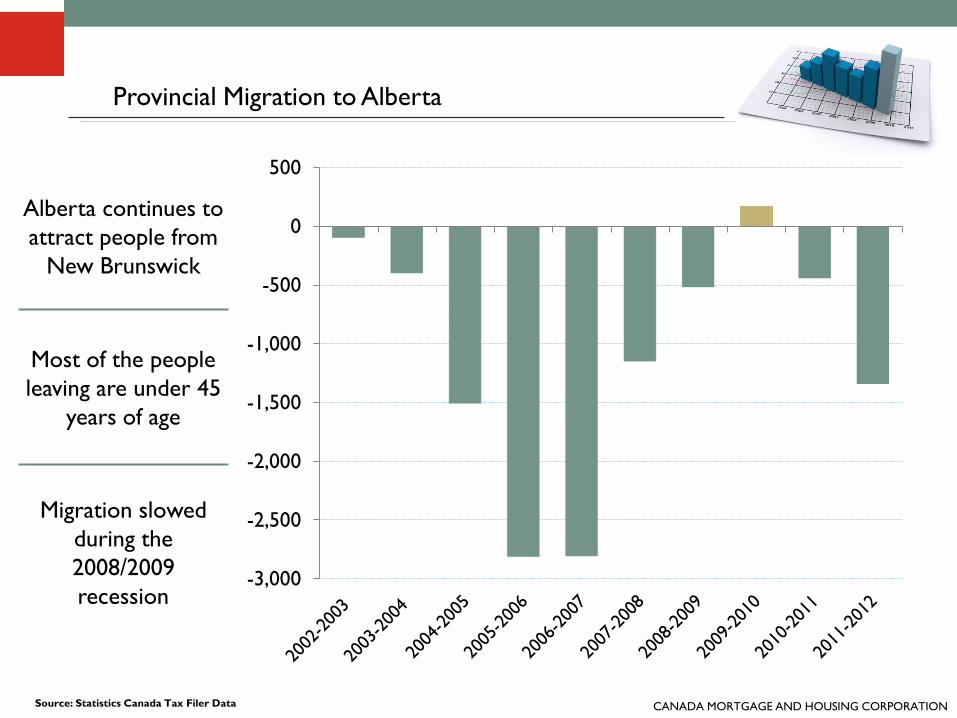
Provincial Migration to Alberta
Alberta continues to
attract people from
New Brunswick
Most of the people
leaving are under 45
years of age
Migration slowed
during the
2008/2009
recession
Source: Statistics Canada Tax Filer Data
CANADA MORTGAGE AND HOUSING CORPORATIONSource: Statistics Canada Tax Filer Data
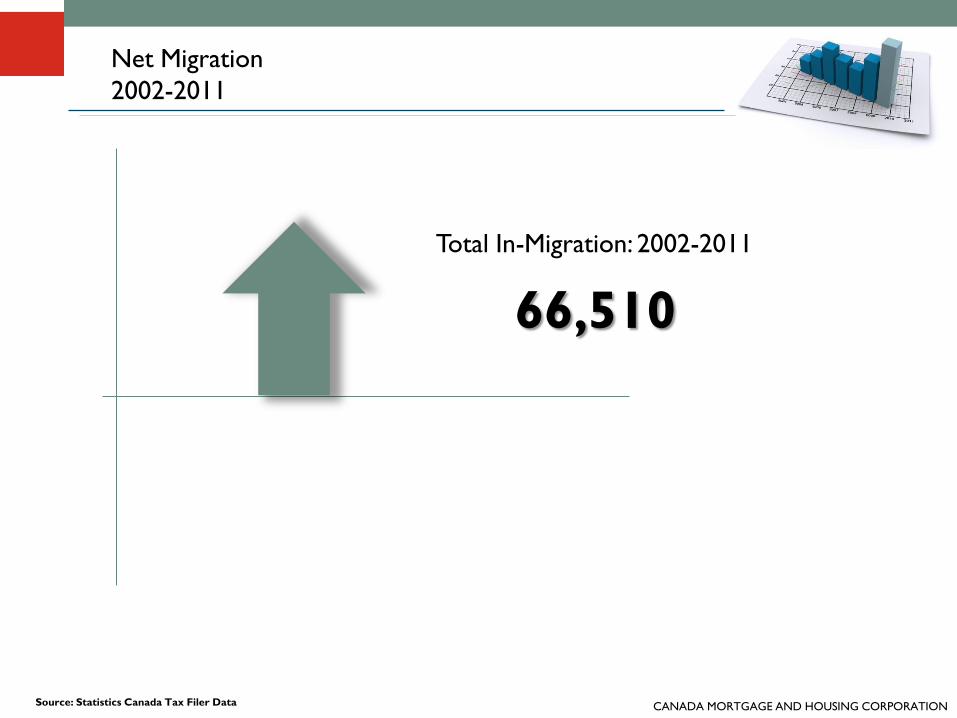
Net Migration
2002-2011
Total In-Migration: 2002-2011
66,510
CANADA MORTGAGE AND HOUSING CORPORATIONSource: Statistics Canada Tax Filer Data
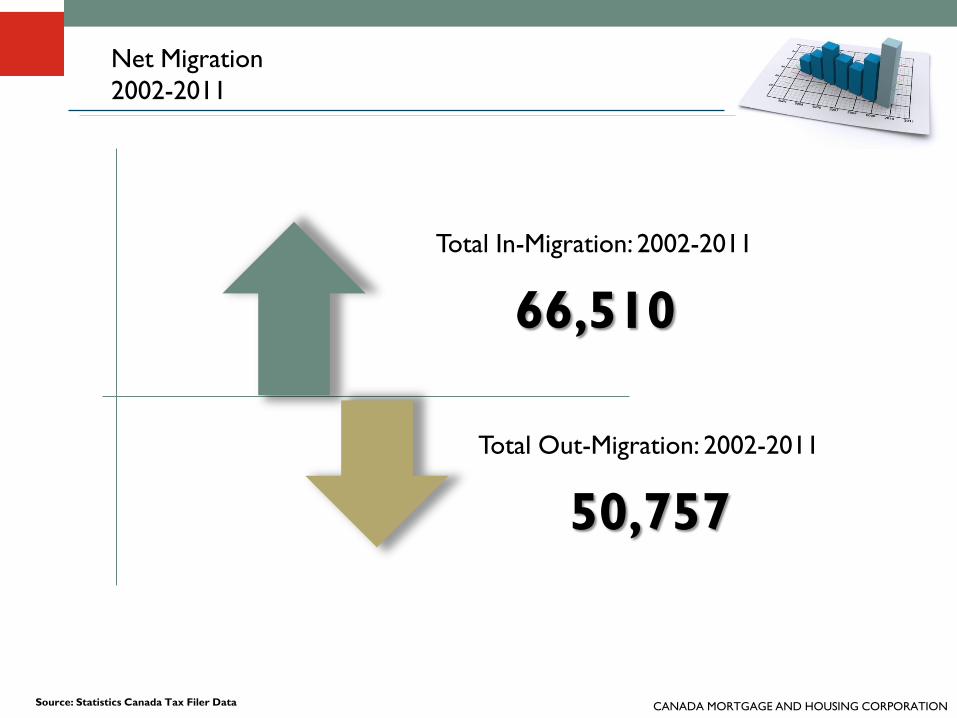
Net Migration
2002-2011
Total In-Migration: 2002-2011
66,510
Total Out-Migration: 2002-2011
50,757
CANADA MORTGAGE AND HOUSING CORPORATIONSource: Statistics Canada Tax Filer Data
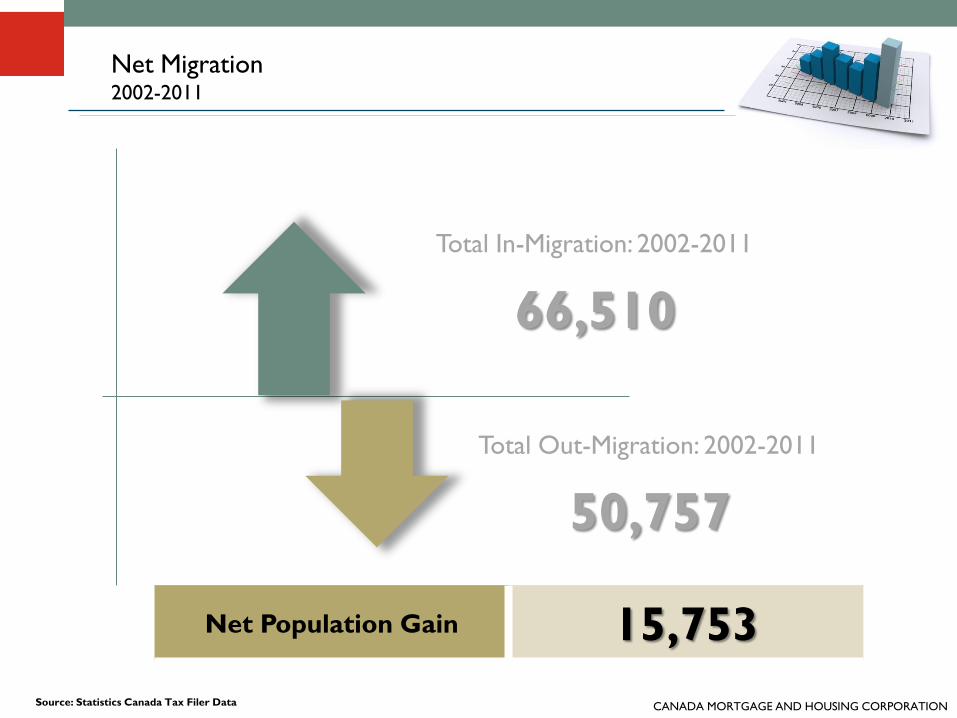
Net Migration 2002-2011
Total In-Migration: 2002-2011
66,510
Total Out-Migration: 2002-2011
50,757
Net Population Gain 15,753

CANADA MORTGAGE AND HOUSING CORPORATION
-2,745
4,791
8,723
-6,000
-4,000
-2,000
0
2,000
4,000
6,000
8,000
10,000
Only 2 counties recorded significant
positive net-migration
Largest inflows of people were to the
Moncton and Fredericton areas
Source: Statistics Canada Tax Filer Data
Net Migration by County
2006-2011

CANADA MORTGAGE AND HOUSING CORPORATION
426616
1,725
2,303
2,839
-500
0
500
1,000
1,500
2,000
2,500
3,000
3,500
York County
recorded the
largest inflow of
international
migration
The inflow of
international
migrants is
centered around
the areas with
universities
International Migration by County
2006-2011
Source: Statistics Canada Tax Filer Data
CANADA MORTGAGE AND HOUSING CORPORATION
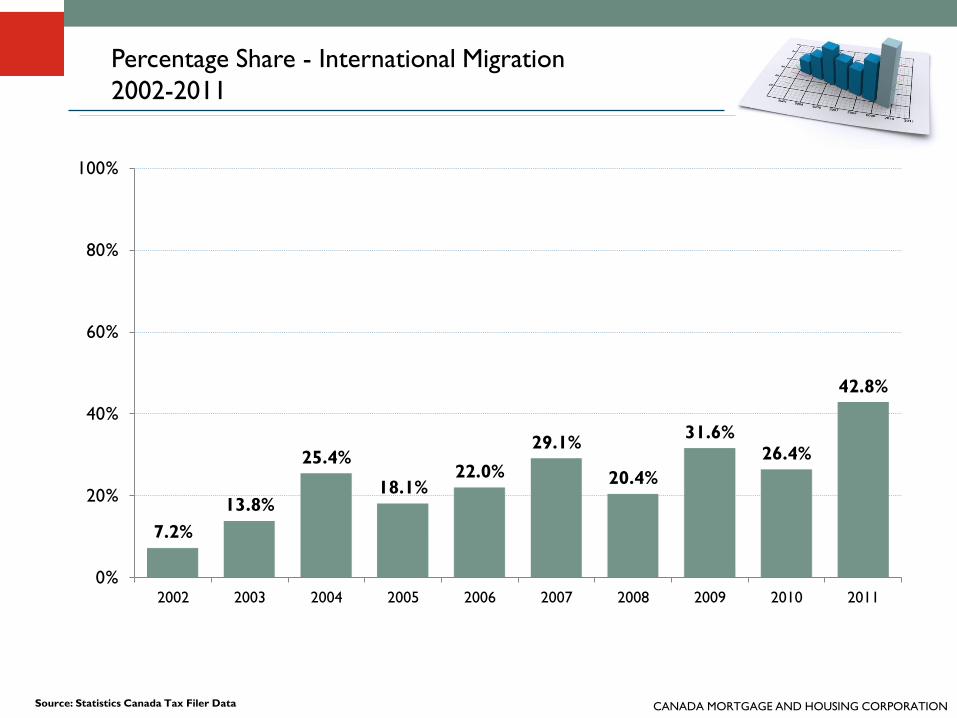
7.2%
13.8%
25.4%
18.1%22.0%
29.1%
20.4%
31.6%26.4%
42.8%
0%
20%
40%
60%
80%
100%
2002 2003 2004 2005 2006 2007 2008 2009 2010 2011
Percentage Share - International Migration
2002-2011
Source: Statistics Canada Tax Filer Data

CANADA MORTGAGE AND HOUSING CORPORATION
0
500
1,000
1,500
2,000
2,500
Net Migration – Greater Moncton
Net Gain
Since
2000-2001
18,521
Average Annual
Gain Since
2000-2001
1,543
Source: Statistics Canada Tax Filer Data
(Westmorland County)

CANADA MORTGAGE AND HOUSING CORPORATION
3,4264,628
6,894
2,799
774
18,521
0
5,000
10,000
15,000
20,000
0-17 Yrs 18-24 Yrs 25-44 Yrs 45-64 Yrs 65 Yrs + Total
Source: Statistics Canada Tax Filer Data
Net-Migration by Age Group (2000-2011)
Greater Moncton
(Westmorland County)
Total Share by Age Group
0-17 18-24 25-44 45-64 65+
18.5% 25.0% 37.2% 15.1% 4.2%
80.7%

CANADA MORTGAGE AND HOUSING CORPORATION
Multi-Residential/Rental Market
Resale Market
New Home Market – Single Family Homes
2013/2014 Outlook
Housing Market Drivers
CANADA MORTGAGE AND HOUSING CORPORATIONSource: CMHC
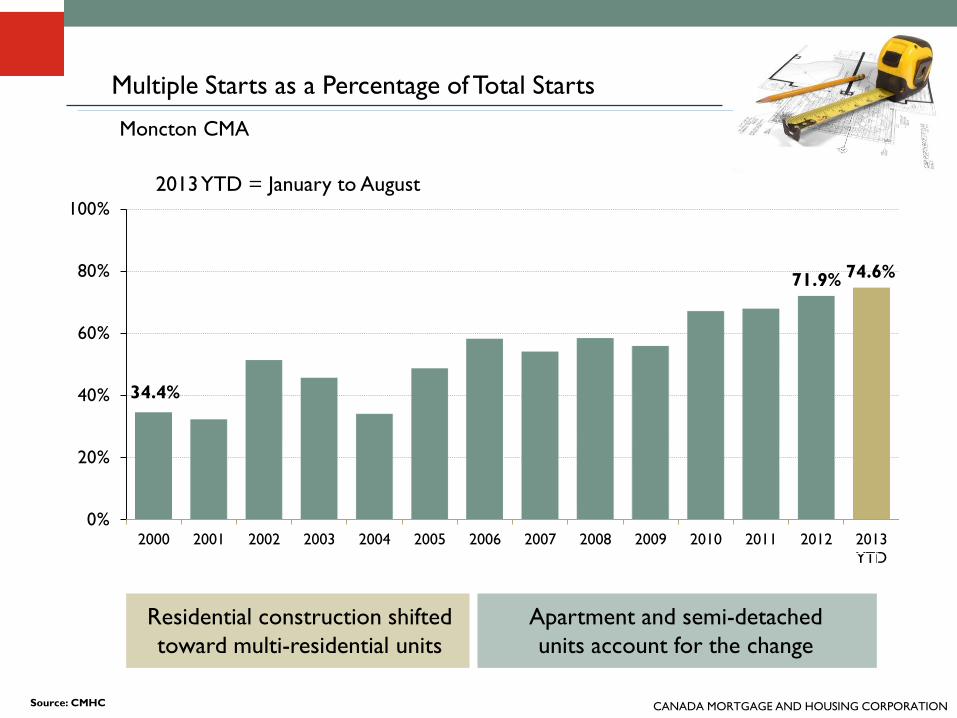
34.4%
71.9% 74.6%
0%
20%
40%
60%
80%
100%
2000 2001 2002 2003 2004 2005 2006 2007 2008 2009 2010 2011 2012 2013
YTD
Multiple Starts as a Percentage of Total Starts
Moncton CMA
Residential construction shifted
toward multi-residential units
Apartment and semi-detached
units account for the change
2013 YTD = January to August
CANADA MORTGAGE AND HOUSING CORPORATION
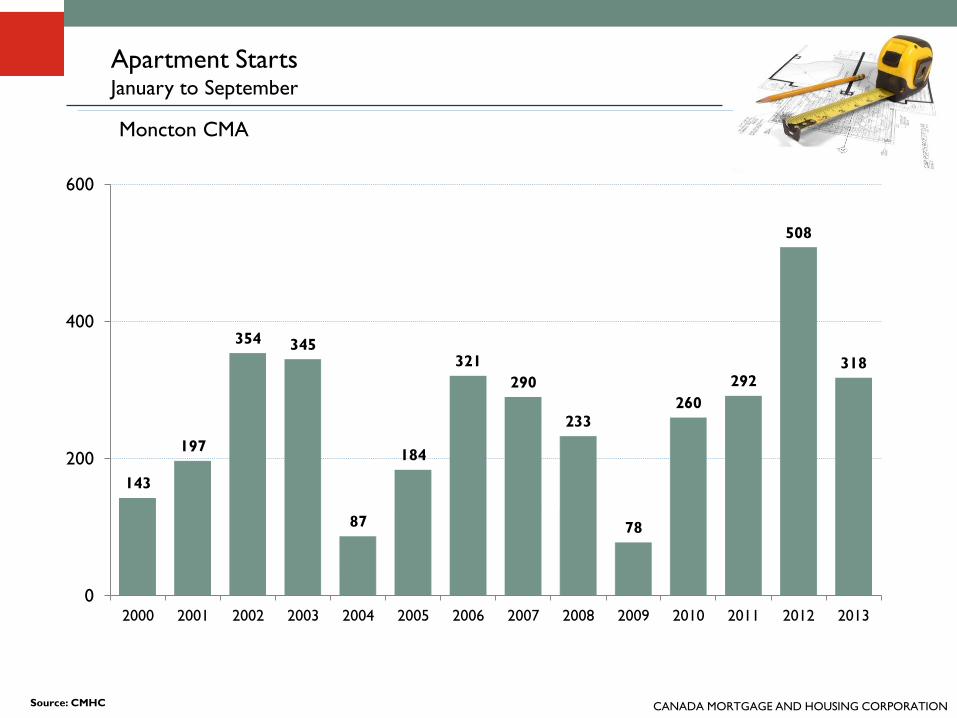
Apartment Starts January to September
Moncton CMA
143
197
354 345
87
184
321
290
233
78
260
292
508
318
0
200
400
600
2000 2001 2002 2003 2004 2005 2006 2007 2008 2009 2010 2011 2012 2013
Source: CMHC
CANADA MORTGAGE AND HOUSING CORPORATION
0
10
20
30
40
50
60
70
80
90
100
Jan-73 Jan-78 Jan-83 Jan-88 Jan-93 Jan-98 Jan-03 Jan-08 Jan-13
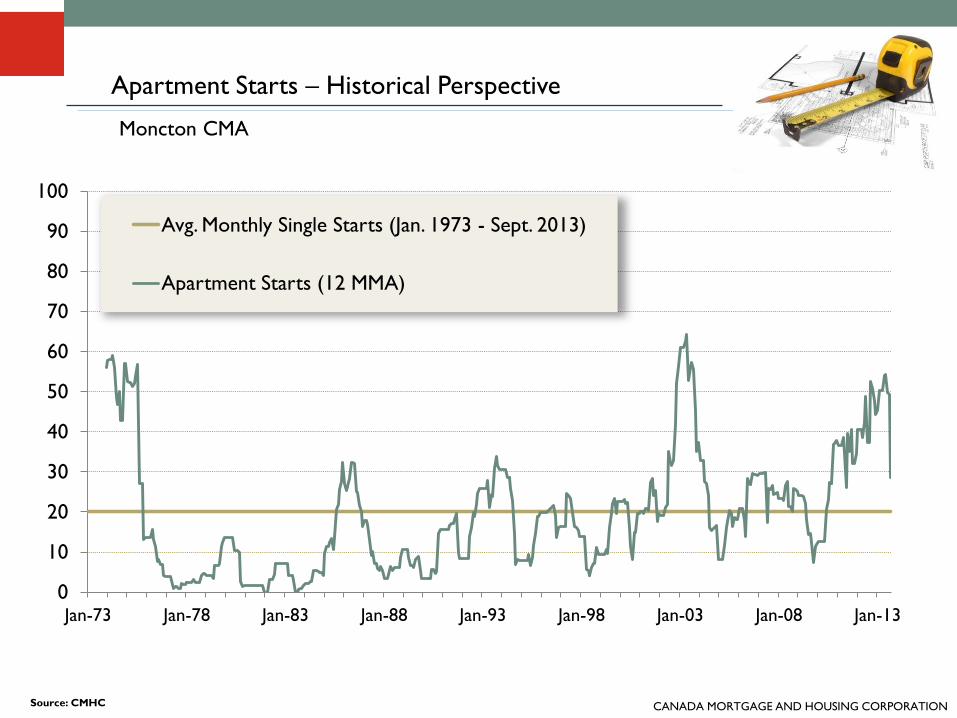
Avg. Monthly Single Starts (Jan. 1973 - Sept. 2013)
Apartment Starts (12 MMA)
Source: CMHC
Apartment Starts – Historical Perspective
Moncton CMA

CANADA MORTGAGE AND HOUSING CORPORATION
Apartment Starts as a % of Multiple Starts
Moncton CMA
75%78%
85%
68%
25%
38%43%
39% 38%
26%
48%51%
57%
64%
0%
20%
40%
60%
80%
100%
2000 2001 2002 2003 2004 2005 2006 2007 2008 2009 2010 2011 2012 2013
Source: CMHC
2000-2003 2004-2009 2010-2012
Apartments account for
most multiple starts
- Semi-detached < $150,000
- Mortgage payment comparable
to monthly rent
Semi-detached
units priced above
$150,000

CANADA MORTGAGE AND HOUSING CORPORATIONSource: CMHC
Rental Market
Moncton CMA
0
200
400
600
800
1,000
1995 1997 1999 2001 2003 2005 2007 2009 2011 2013
6.7%7.8%
0%
2%
4%
6%
8%
10%
1995 1997 1999 2001 2003 2005 2007 2009 2011 2013 F
Monthly Average
Under Construction
Jan. 2005 – Dec. 2010 Jan. 2011 – Sep. 2013
227 576
CANADA MORTGAGE AND HOUSING CORPORATION
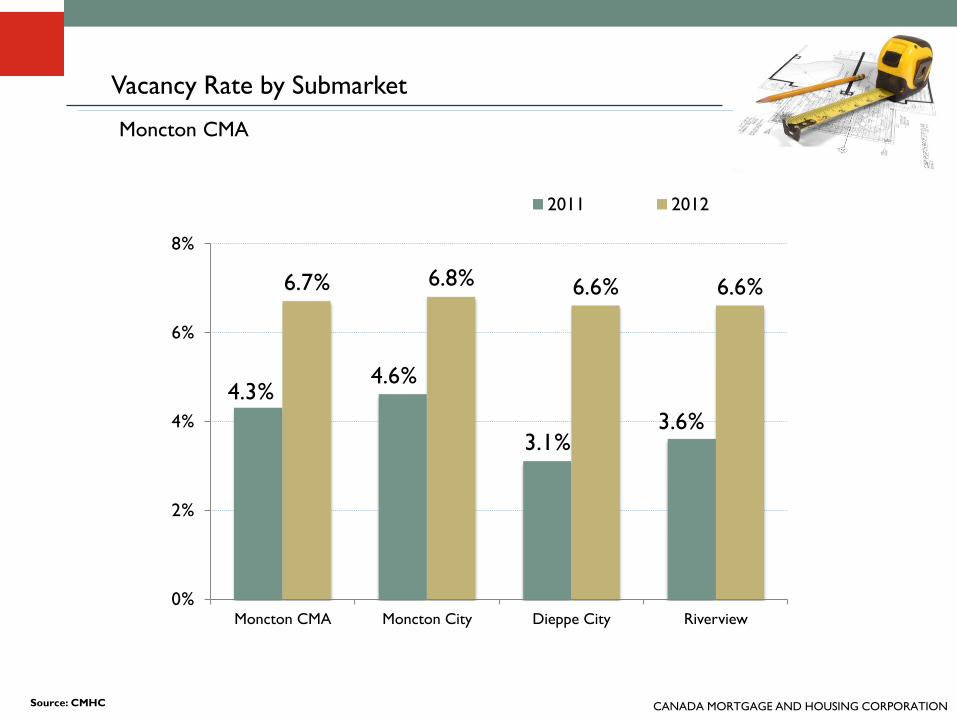
4.3%4.6%
3.1%3.6%
6.7% 6.8% 6.6% 6.6%
0%
2%
4%
6%
8%
Moncton CMA Moncton City Dieppe City Riverview
2011 2012
Source: CMHC
Vacancy Rate by Submarket
Moncton CMA
CANADA MORTGAGE AND HOUSING CORPORATION
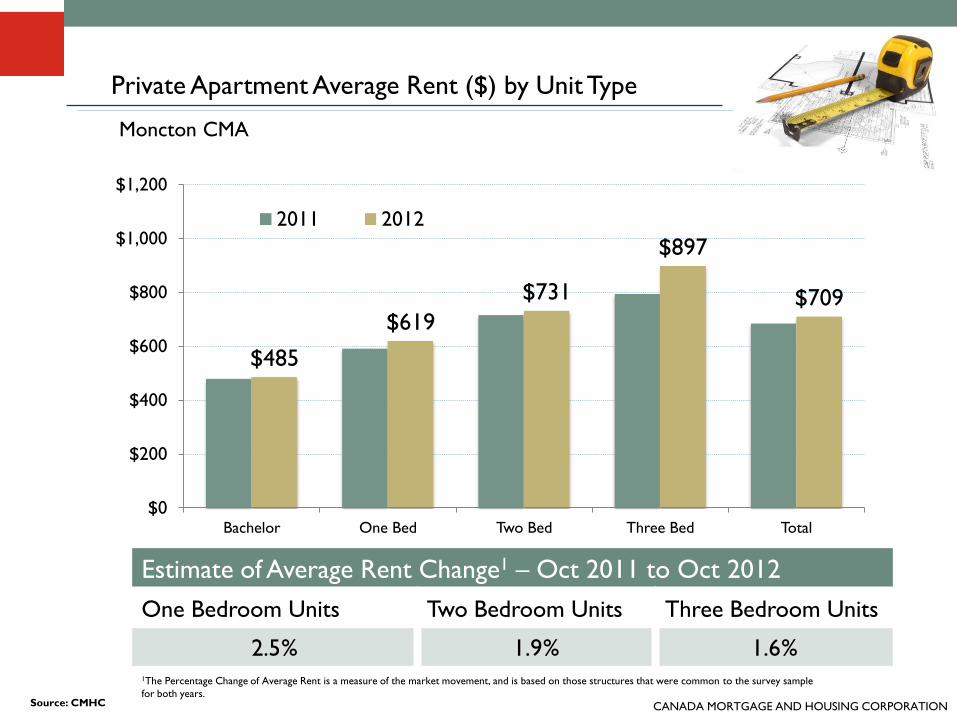
Private Apartment Average Rent ($) by Unit Type
Moncton CMA
$485
$619
$731
$897
$709
$0
$200
$400
$600
$800
$1,000
$1,200
Bachelor One Bed Two Bed Three Bed Total
2011 2012
1The Percentage Change of Average Rent is a measure of the market movement, and is based on those structures that were common to the survey sample
for both years.Source: CMHC
Estimate of Average Rent Change1 – Oct 2011 to Oct 2012
One Bedroom Units Two Bedroom Units Three Bedroom Units
2.5% 1.9% 1.6%
CANADA MORTGAGE AND HOUSING CORPORATION
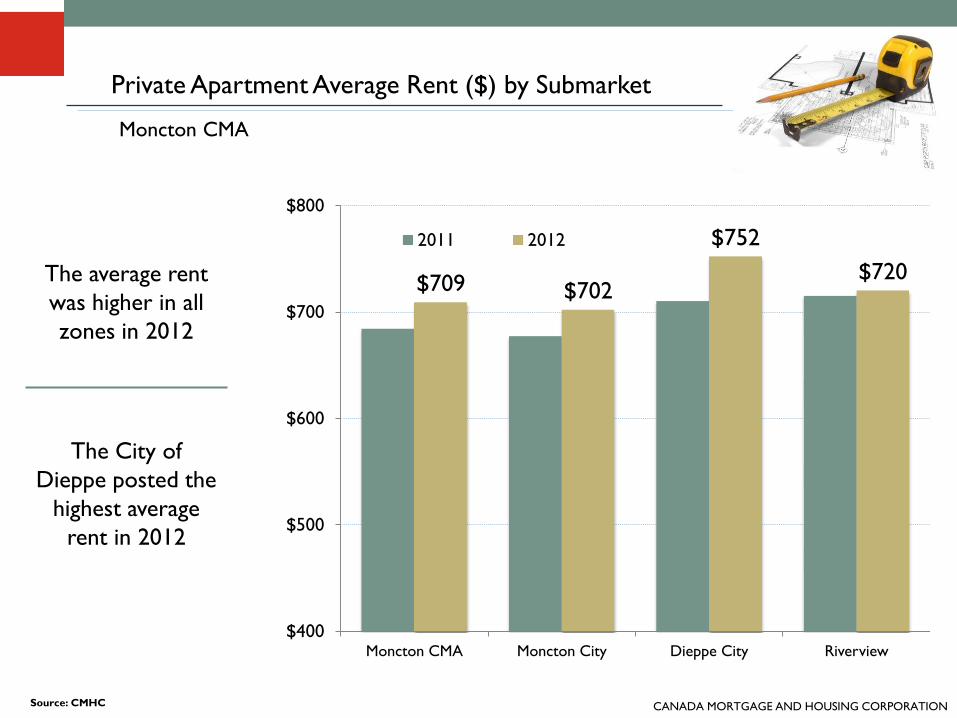
$709 $702
$752
$720
$400
$500
$600
$700
$800
Moncton CMA Moncton City Dieppe City Riverview
2011 2012
Source: CMHC
Private Apartment Average Rent ($) by Submarket
Moncton CMA
The average rent
was higher in all
zones in 2012
The City of
Dieppe posted the
highest average
rent in 2012

CANADA MORTGAGE AND HOUSING CORPORATION
2013/2014 Outlook
Rental Market
Moncton
CMA2012 2013F % Change 2014F
Vacancy Rate 6.7% 8.0% 1.3 pts 9.5%
Average
Rent (Two Bedroom)
$731 $745 + 2% $760
Source and Forecast: CMHC
Further increase in the vacancy rate expected in 2013
Expected rent increase in 2013 will range between 1.5% and 2.5%
CANADA MORTGAGE AND HOUSING CORPORATION
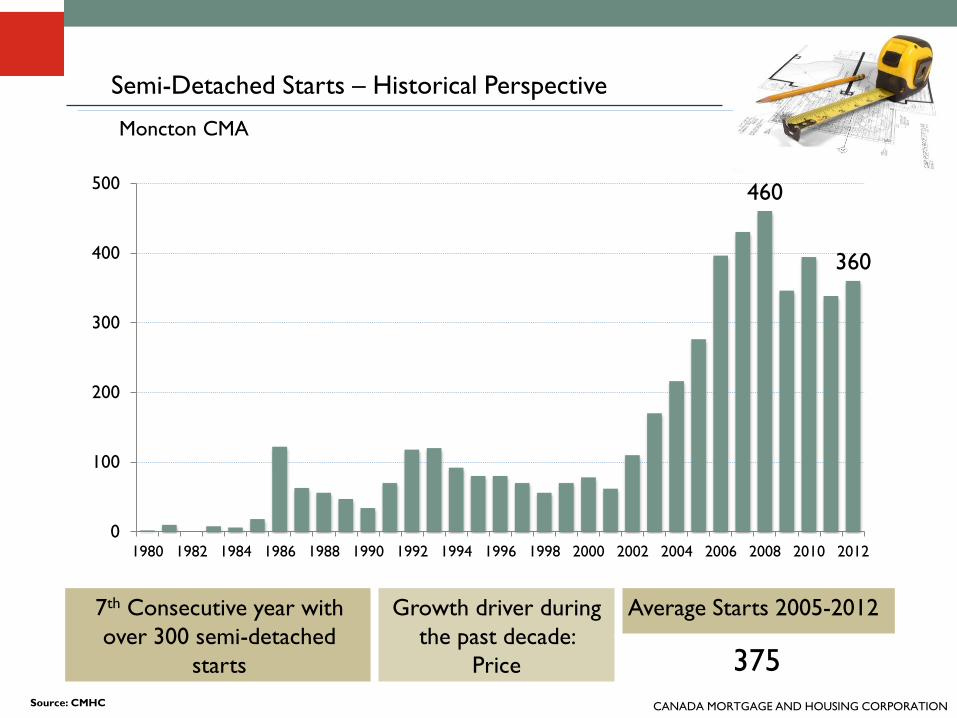
460
360
0
100
200
300
400
500
1980 1982 1984 1986 1988 1990 1992 1994 1996 1998 2000 2002 2004 2006 2008 2010 2012
Source: CMHC
Semi-Detached Starts – Historical Perspective
Moncton CMA
7th Consecutive year with
over 300 semi-detached
starts
Growth driver during
the past decade:
Price
Average Starts 2005-2012
375
CANADA MORTGAGE AND HOUSING CORPORATION
0
10
20
30
40
50
60
70
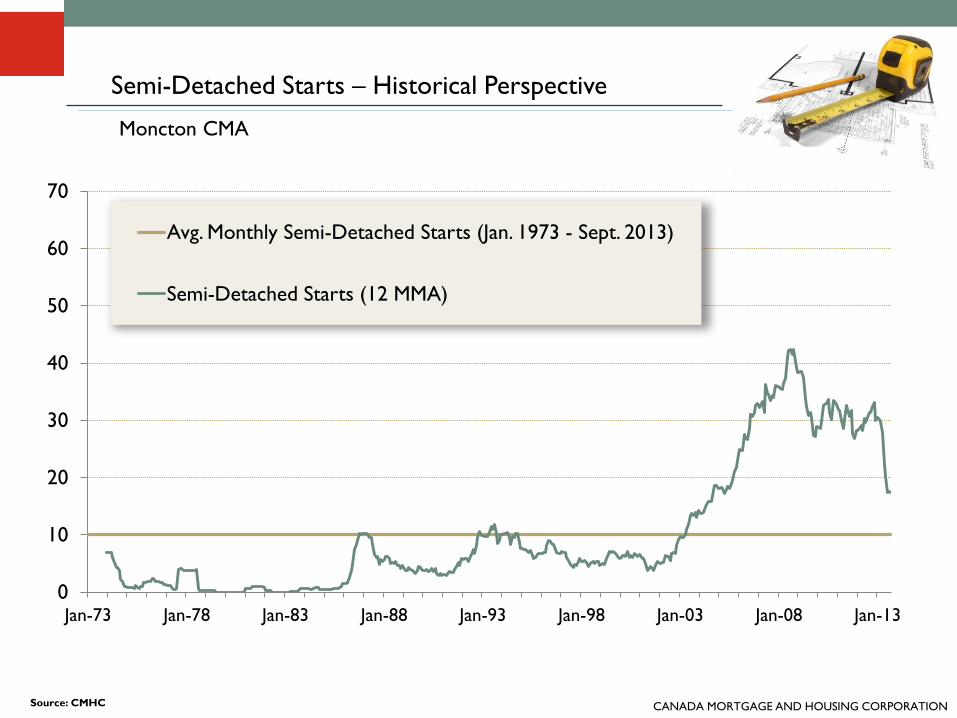
Jan-73 Jan-78 Jan-83 Jan-88 Jan-93 Jan-98 Jan-03 Jan-08 Jan-13
Avg. Monthly Semi-Detached Starts (Jan. 1973 - Sept. 2013)
Semi-Detached Starts (12 MMA)
Source: CMHC
Semi-Detached Starts – Historical Perspective
Moncton CMA
CANADA MORTGAGE AND HOUSING CORPORATION
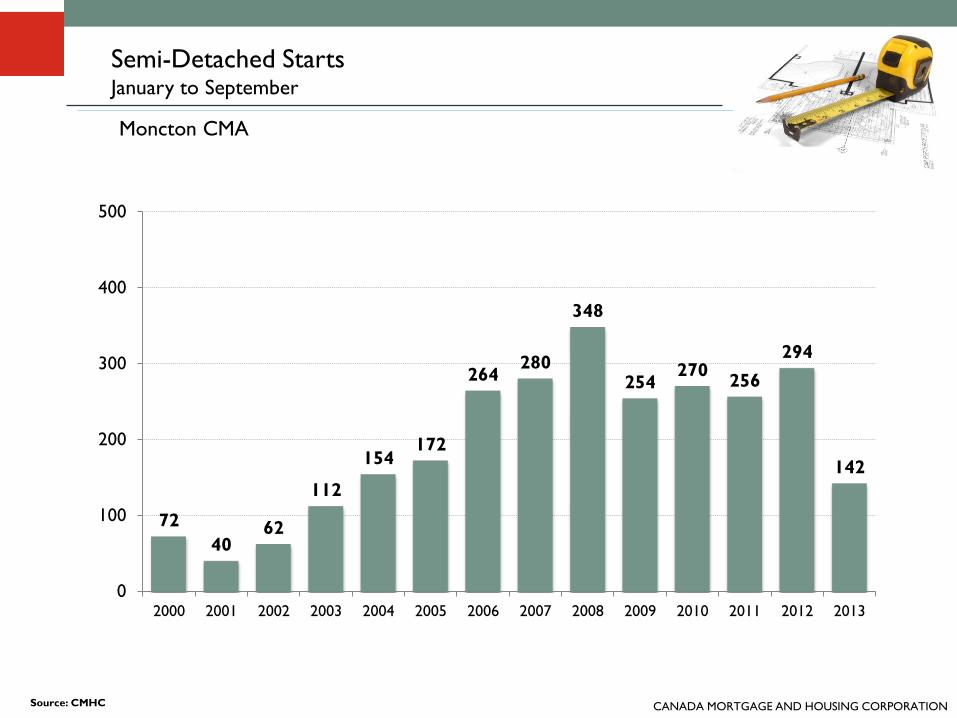
72
4062
112
154172
264280
348
254270
256
294
142
0
100
200
300
400
500
2000 2001 2002 2003 2004 2005 2006 2007 2008 2009 2010 2011 2012 2013
Source: CMHC
Semi-Detached StartsJanuary to September
Moncton CMA
CANADA MORTGAGE AND HOUSING CORPORATION
0
100
200
300
400
500
600
700
800
900
2000 2001 2002 2003 2004 2005 2006 2007 2008 2009 2010 2011 2012 2013
YTD
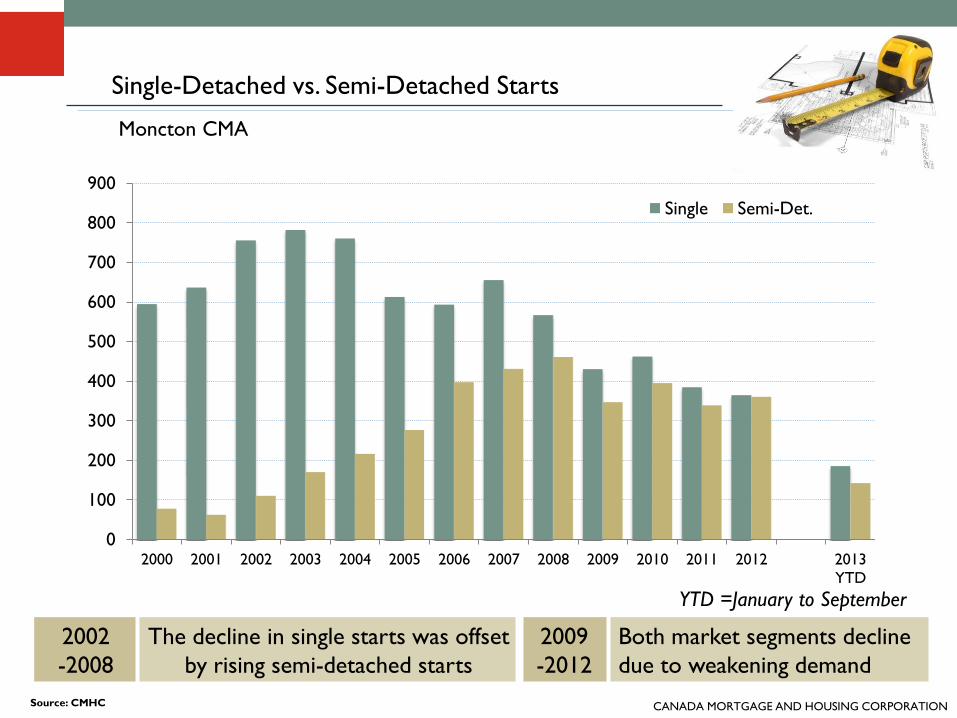
Single Semi-Det.
Single-Detached vs. Semi-Detached Starts
Moncton CMA
2002
-2008
The decline in single starts was offset
by rising semi-detached starts
2009
-2012
Both market segments decline
due to weakening demand
Source: CMHC
YTD =January to September
CANADA MORTGAGE AND HOUSING CORPORATION
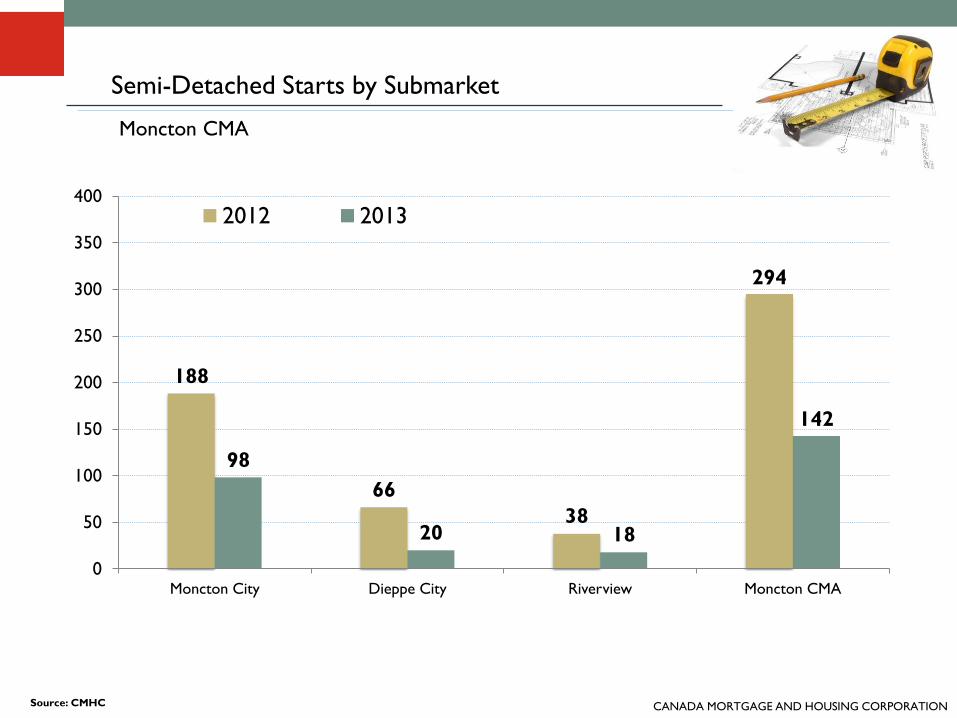
Semi-Detached Starts by Submarket
Moncton CMA
188
66
38
294
98
20 18
142
0
50
100
150
200
250
300
350
400
Moncton City Dieppe City Riverview Moncton CMA
2012 2013
Source: CMHC

CANADA MORTGAGE AND HOUSING CORPORATION
27%
73%
0%
20%
40%
60%
80%
100%
2005 2006 2007 2008 2009 2010 2011 2012 2013
YTD
< $150,000 > $150,000
Source: CMHC
Percentage of Absorbed Semi-Detached
Units by Price Range
Moncton CMA
2013 YTD = January to August

CANADA MORTGAGE AND HOUSING CORPORATION
26.8%
69.0%
4.2%
0%
20%
40%
60%
80%
100%
Less than
$150,000
$150,000 -
$200,000
$200,000
plus
Source: CMHC
Percentage of Absorbed Semi-Detached
Units by Price Range (January to July – 2013)
Moncton CMA
Semi-Detached
Unit
Two Bedroom
Unit
Monthly Carrying
CostAverage Rent
2008
$8461 $656
2013
$1,2082 $731
1Based on $120,000 fixed rate mortgage/25 year
amortization, 5 year fixed - posted rate 5.7% + property tax
2Based on $170,000 fixed rate mortgage/25 year
amortization, 5 year fixed - posted rate 5.2 % + property tax

CANADA MORTGAGE AND HOUSING CORPORATION
0
20
40
60
80
100
Unabsorbed Semi-Detached (12 MMA)
Absorbed Semi-Detached (12 MMA)
Semi-Detached Homes – Absorbed and
Unabsorbed Units (12 month moving average)
Moncton CMA
Source: CMHC
Supply of unabsorbed units trending upward in 2013
despite decreased starts due to reduced demand

CANADA MORTGAGE AND HOUSING CORPORATION
13%
16%
2%
0%
9%
0.3%
1%
6%
4%
8%
2%
6%
0.2%1%
0%
5%
10%
15%
20%
2000 2001 2002 2003 2004 2005 2006 2007 2008 2009 2010 2011 2012 2013
YTD
Source: CMHC
Condominium Starts as a Percentage
of Multiple Starts
Moncton CMA
Condominium starts
as a percentage of
multiple starts
remain low in 2013
In recent years,
condominium starts
have been mostly
row-type units
2013 YTD = January to August

CANADA MORTGAGE AND HOUSING CORPORATIONSource and Forecast: CMHC
Multiple Starts
Moncton CMA 2012 2013F % Change 2014F
Multiple
Starts933 650 - 30% 420
Significant increase in the rental inventory will put upward pressure
on the local vacancy rate leading to reduced apartment starts
Increased supply of new rental units and rising prices for new semi-
detached units will likely to result in fewer semi-detached starts
2013/2014 Outlook

CANADA MORTGAGE AND HOUSING CORPORATION
Multi-Residential/Rental Market
Resale Market
2013/2014 Outlook
Housing Market Drivers
New Home Market – Single
Family Homes
CANADA MORTGAGE AND HOUSING CORPORATION
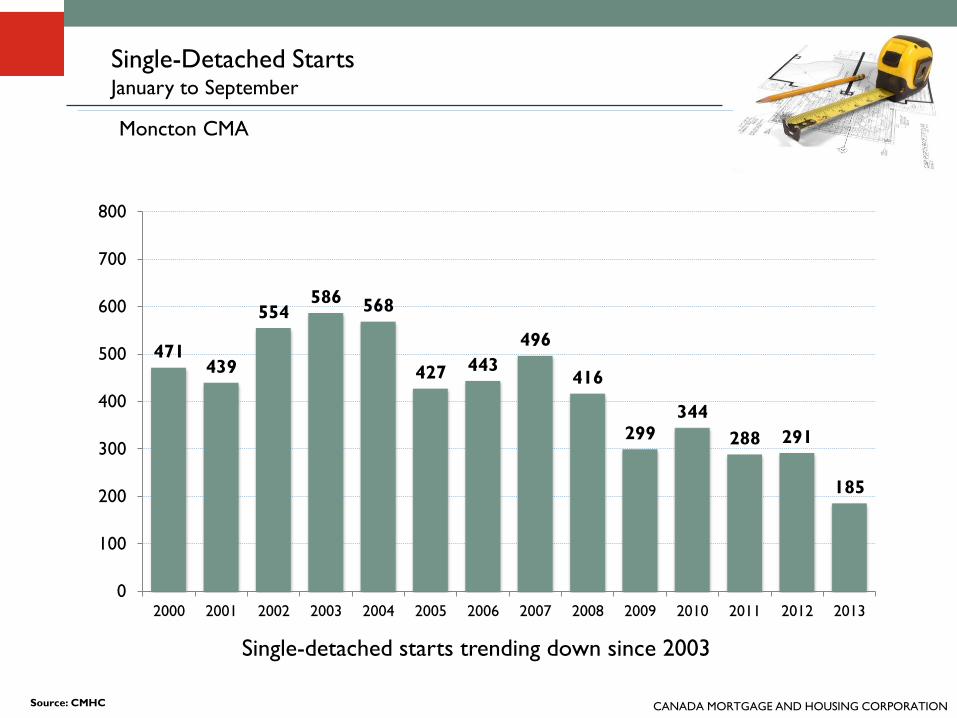
471439
554586 568
427 443
496
416
299344
288 291
185
0
100
200
300
400
500
600
700
800
2000 2001 2002 2003 2004 2005 2006 2007 2008 2009 2010 2011 2012 2013
Source: CMHC
Single-Detached StartsJanuary to September
Moncton CMA
Single-detached starts trending down since 2003
CANADA MORTGAGE AND HOUSING CORPORATION
0
10
20
30
40
50
60
70
80
90
100
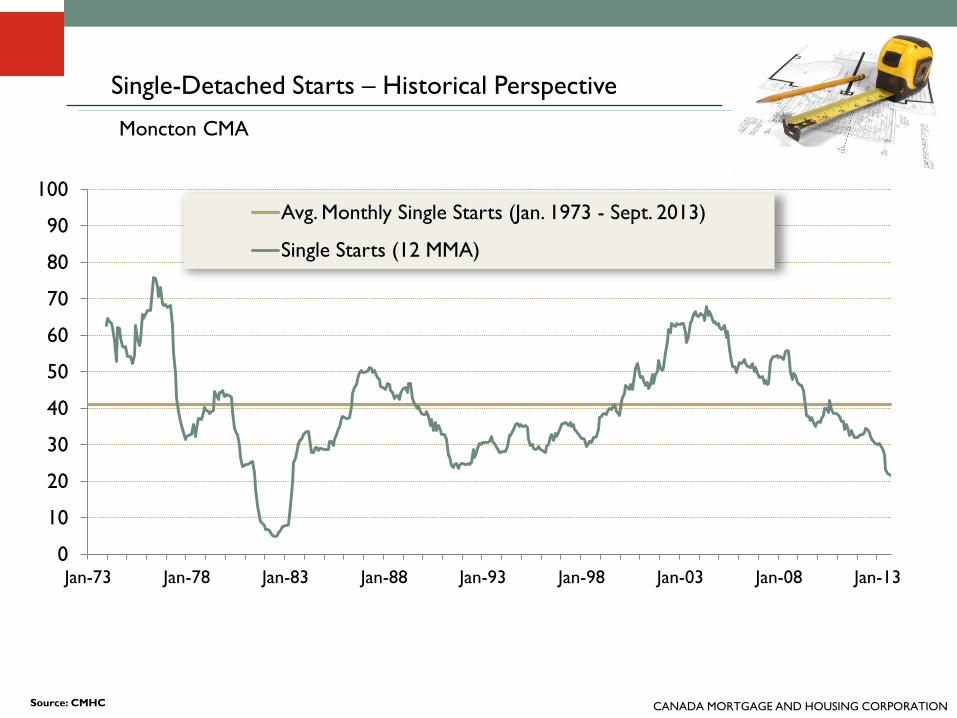
Jan-73 Jan-78 Jan-83 Jan-88 Jan-93 Jan-98 Jan-03 Jan-08 Jan-13
Avg. Monthly Single Starts (Jan. 1973 - Sept. 2013)
Single Starts (12 MMA)
Source: CMHC
Single-Detached Starts – Historical Perspective
Moncton CMA

CANADA MORTGAGE AND HOUSING CORPORATION
0
20
40
60
80
100
120
0
20
40
60
80
100
120
Single Starts (12 MMA) Unabsorbed (12 MMA)
Abso
rbed Inve
nto
ry
Unab
sorb
ed Inve
nto
ry
Single Starts and Unabsorbed Single-Detached Units
Moncton CMA
Source: CMHC
CANADA MORTGAGE AND HOUSING CORPORATION
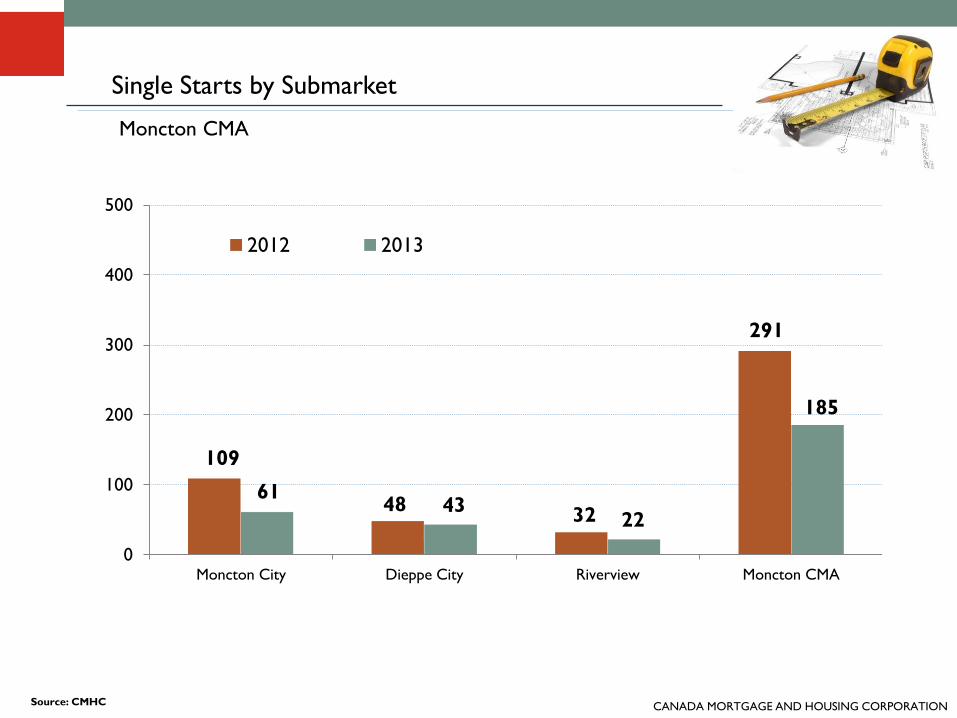
109
4832
291
6143
22
185
0
100
200
300
400
500
Moncton City Dieppe City Riverview Moncton CMA
2012 2013
Source: CMHC
Single Starts by Submarket
Moncton CMA
CANADA MORTGAGE AND HOUSING CORPORATION
$111,0
66
$136,3
66
$143,1
38
$148,0
96
$162,5
89
$168,8
83
$191,2
20
$208,6
53
$217,1
73
$226,9
21
$257,3
20
$276,7
30
$291,990
$322,910
$0
$50,000
$100,000
$150,000
$200,000
$250,000
$300,000
$350,000
2000 2001 2002 2003 2004 2005 2006 2007 2008 2009 2010 2011 2012 YTD
2013
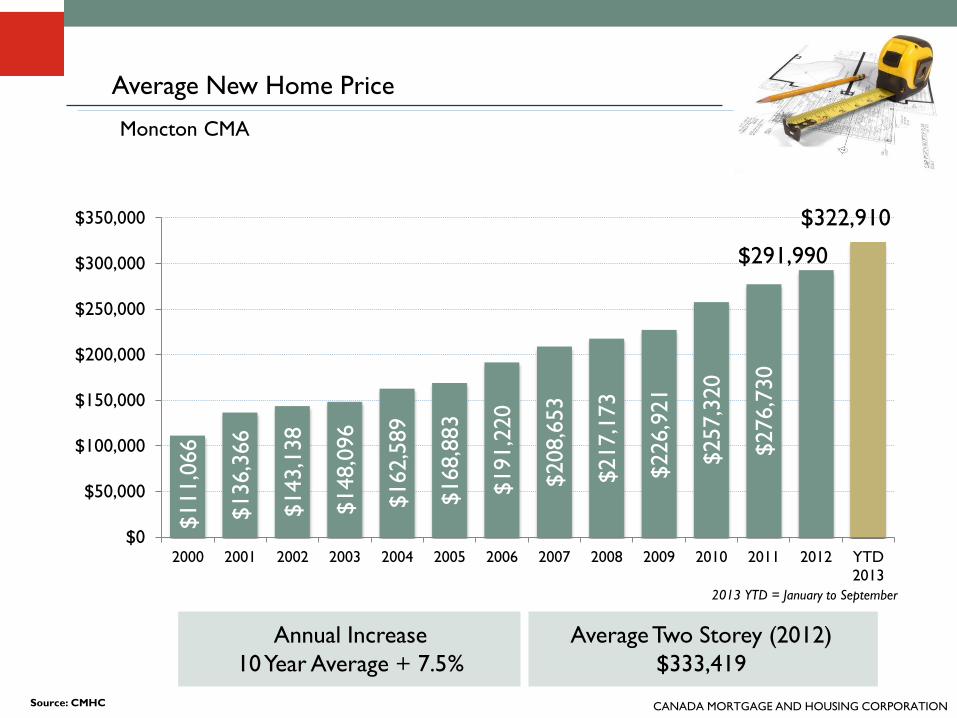
Average New Home Price
Moncton CMA
Source: CMHC
Annual Increase
10Year Average + 7.5%
Average Two Storey (2012)
$333,419
2013 YTD = January to September

CANADA MORTGAGE AND HOUSING CORPORATION
$322,910
$324,487
$267,304
$100,000
$150,000
$200,000
$250,000
$300,000
$350,000
2000 2002 2004 2006 2008 2010 2012
Moncton Saint John
Fredericton
Average New Home Price
Moncton CMA
Source: CMHC
2013
YTD
2013 YTD = January to September
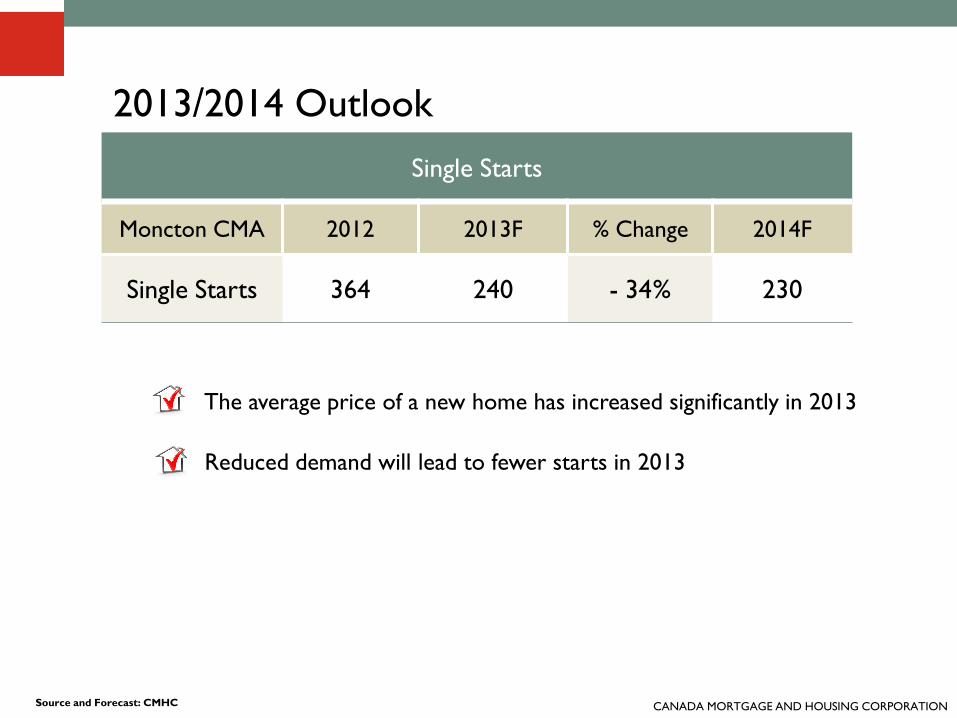
CANADA MORTGAGE AND HOUSING CORPORATIONSource and Forecast: CMHC
Single Starts
Moncton CMA 2012 2013F % Change 2014F
Single Starts 364 240 - 34% 230
The average price of a new home has increased significantly in 2013
Reduced demand will lead to fewer starts in 2013
2013/2014 Outlook

CANADA MORTGAGE AND HOUSING CORPORATION
Multi-Residential/Rental Market
Resale Market
2013/2014 Outlook
Housing Market Drivers
New Home Market – Single Family Homes
CANADA MORTGAGE AND HOUSING CORPORATION
0
50
100
150
200
250
300
350
400
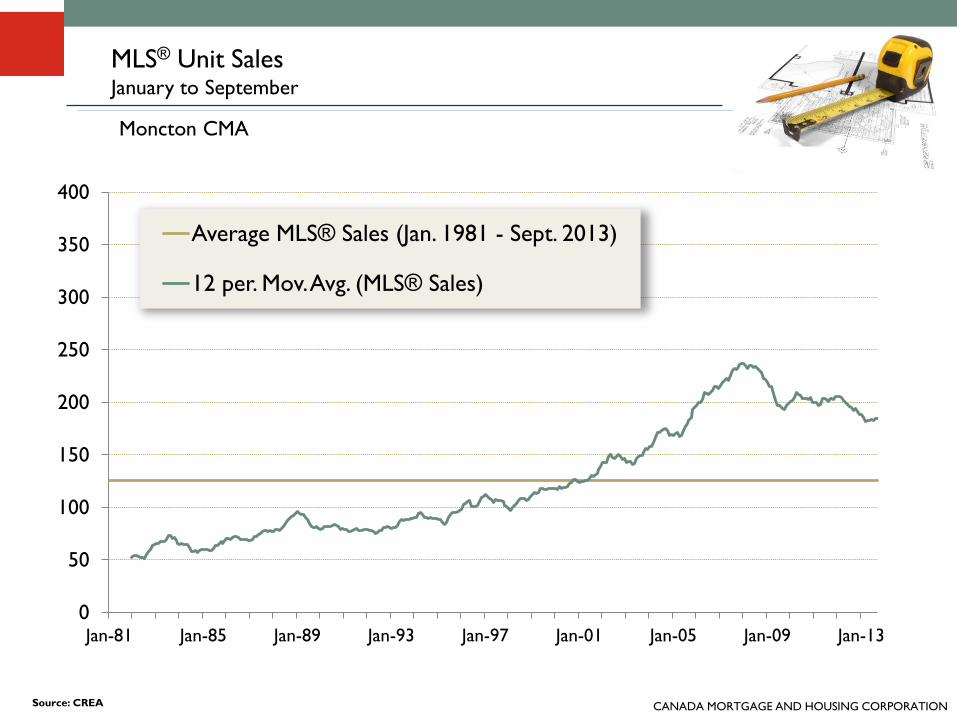
Jan-81 Jan-85 Jan-89 Jan-93 Jan-97 Jan-01 Jan-05 Jan-09 Jan-13
Average MLS® Sales (Jan. 1981 - Sept. 2013)
12 per. Mov. Avg. (MLS® Sales)
Source: CREA
MLS® Unit SalesJanuary to September
Moncton CMA

CANADA MORTGAGE AND HOUSING CORPORATION
0
500
1,000
1,500
2,000
2,500
3,000
2000 2001 2002 2003 2004 2005 2006 2007 2008 2009 2010 2011 2012 2013
MLS® Unit SalesJanuary to September
MLS® is a registered trademark of the Canadian Real Estate Association
Source: CREA
Greater Moncton
CANADA MORTGAGE AND HOUSING CORPORATION
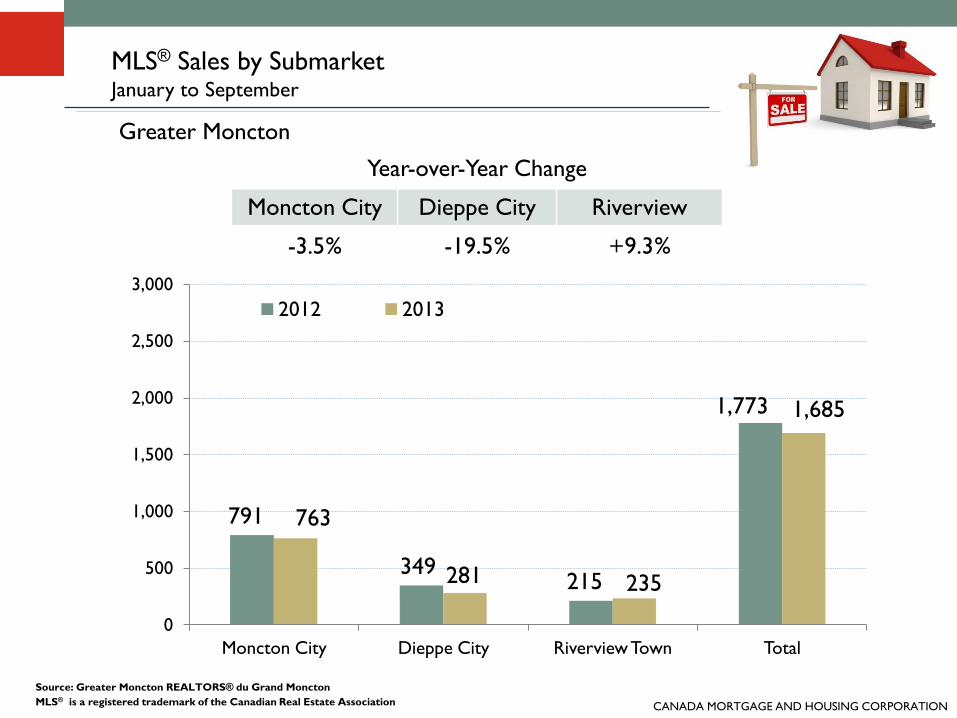
791
349215
1,773
763
281 235
1,685
0
500
1,000
1,500
2,000
2,500
3,000
Moncton City Dieppe City Riverview Town Total
2012 2013
MLS® is a registered trademark of the Canadian Real Estate Association
Source: Greater Moncton REALTORS® du Grand Moncton
MLS® Sales by SubmarketJanuary to September
Greater Moncton
Year-over-Year Change
Moncton City Dieppe City Riverview
-3.5% -19.5% +9.3%
CANADA MORTGAGE AND HOUSING CORPORATION
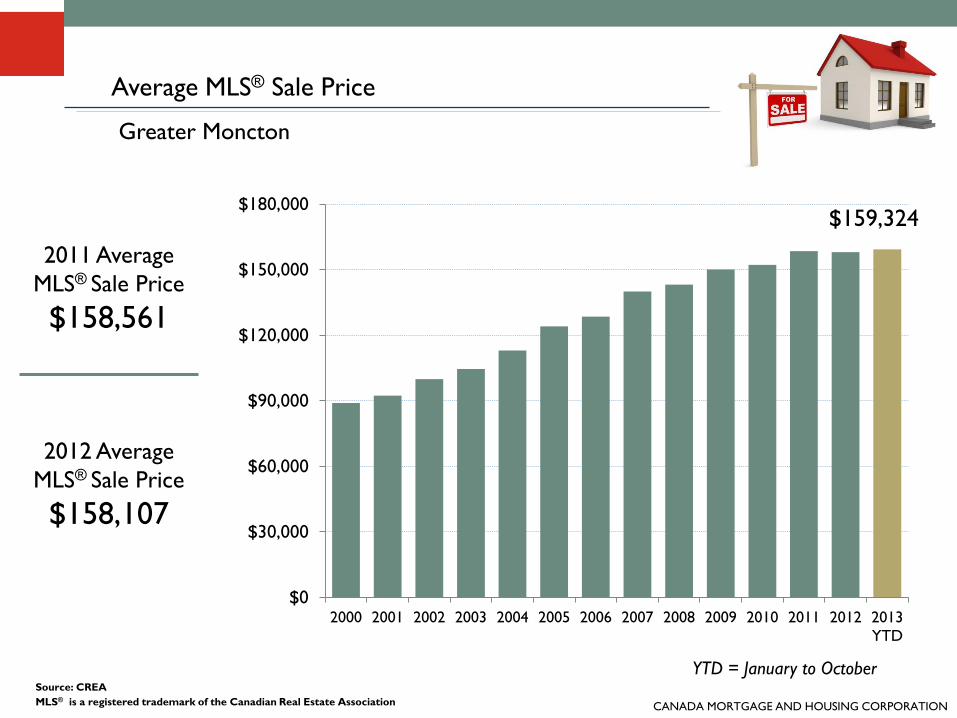
$159,324
$0
$30,000
$60,000
$90,000
$120,000
$150,000
$180,000
2000 2001 2002 2003 2004 2005 2006 2007 2008 2009 2010 2011 2012 2013
YTD
MLS® is a registered trademark of the Canadian Real Estate Association
Source: CREA
Average MLS® Sale Price
Greater Moncton
2011 Average
MLS® Sale Price
$158,561
2012 Average
MLS® Sale Price
$158,107
YTD = January to October
CANADA MORTGAGE AND HOUSING CORPORATION
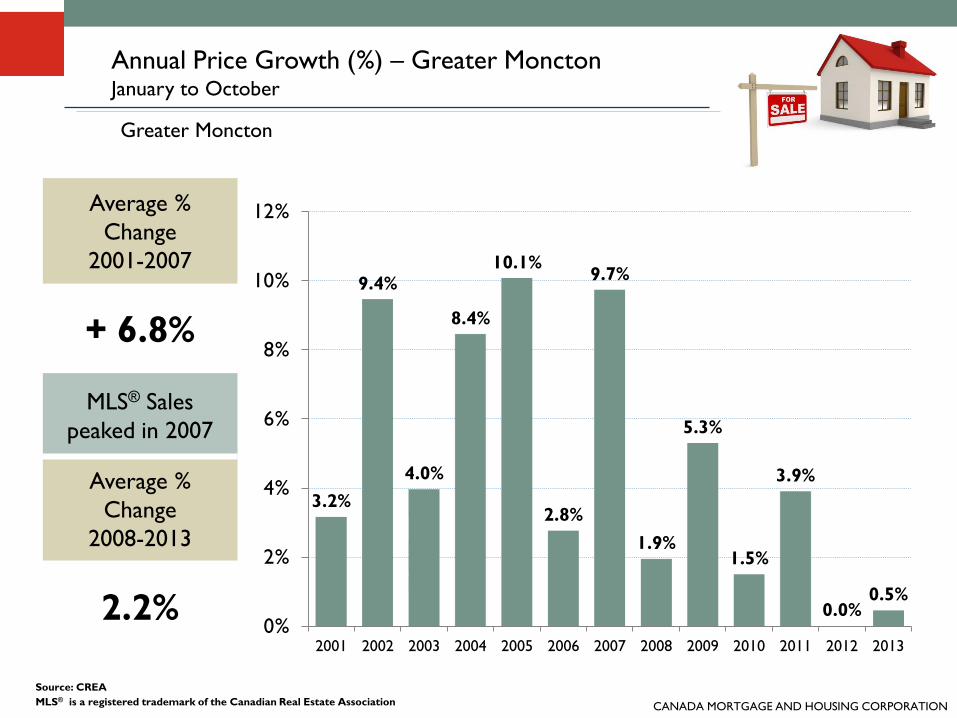
3.2%
9.4%
4.0%
8.4%
10.1%
2.8%
9.7%
1.9%
5.3%
1.5%
3.9%
0.0%0.5%
0%
2%
4%
6%
8%
10%
12%
2001 2002 2003 2004 2005 2006 2007 2008 2009 2010 2011 2012 2013
MLS® is a registered trademark of the Canadian Real Estate Association
Source: CREA
Annual Price Growth (%) – Greater MonctonJanuary to October
Greater Moncton
Average %
Change
2001-2007
+ 6.8%
MLS® Sales
peaked in 2007
Average %
Change
2008-2013
2.2%
CANADA MORTGAGE AND HOUSING CORPORATION
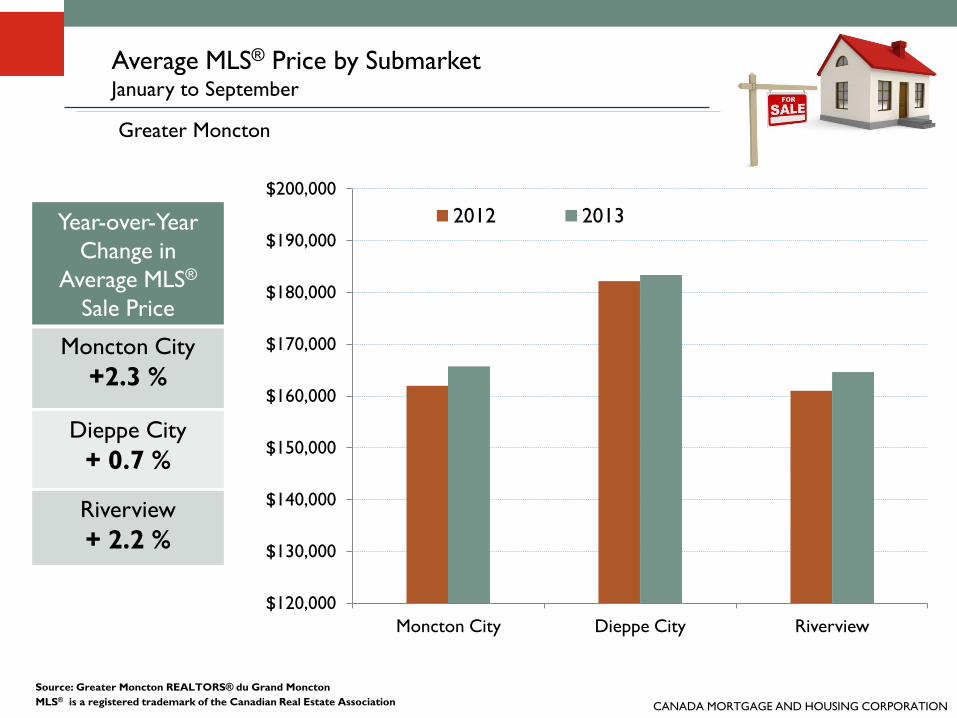
$120,000
$130,000
$140,000
$150,000
$160,000
$170,000
$180,000
$190,000
$200,000
Moncton City Dieppe City Riverview
2012 2013
Average MLS® Price by SubmarketJanuary to September
Greater Moncton
MLS® is a registered trademark of the Canadian Real Estate Association
Source: Greater Moncton REALTORS® du Grand Moncton
Year-over-Year
Change in
Average MLS®
Sale Price
Moncton City
+2.3 %
Dieppe City
+ 0.7 %
Riverview
+ 2.2 %

CANADA MORTGAGE AND HOUSING CORPORATION
0
500
1,000
1,500
2,000
2012 2013
MLS® Sales by Price RangeJanuary to September
Greater Moncton
MLS® is a registered trademark of the Canadian Real Estate Association
Source: Greater Moncton REALTORS® du Grand Moncton/CREA
50.1% 25.9% 11.7% 6.0% 4.9% 1.5%% Share of
Total Sales
CANADA MORTGAGE AND HOUSING CORPORATION
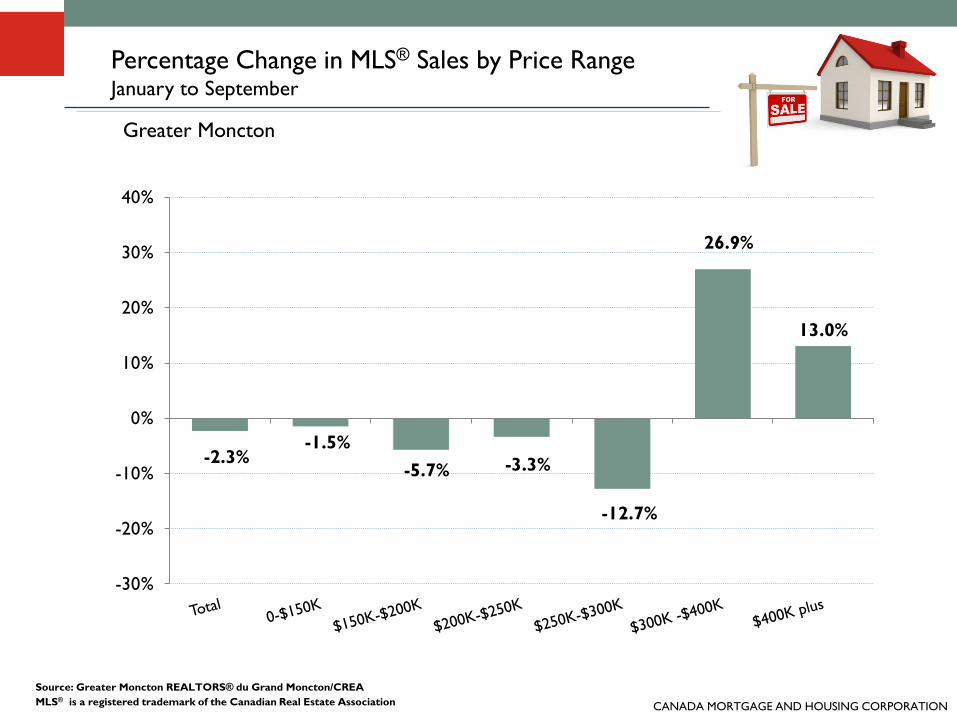
-2.3%-1.5%
-5.7% -3.3%
-12.7%
26.9%
13.0%
-30%
-20%
-10%
0%
10%
20%
30%
40%
Percentage Change in MLS® Sales by Price RangeJanuary to September
Greater Moncton
MLS® is a registered trademark of the Canadian Real Estate Association
Source: Greater Moncton REALTORS® du Grand Moncton/CREA
CANADA MORTGAGE AND HOUSING CORPORATIONMLS® is a registered trademark of the Canadian Real Estate Association
Source: CREA
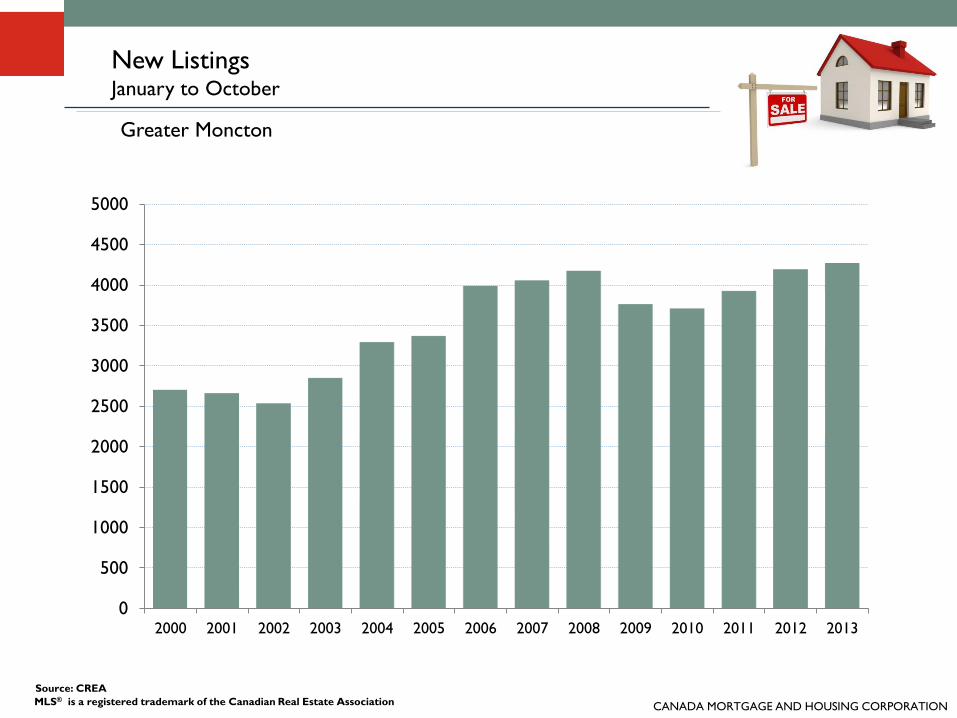
New ListingsJanuary to October
Greater Moncton
0
500
1000
1500
2000
2500
3000
3500
4000
4500
5000
2000 2001 2002 2003 2004 2005 2006 2007 2008 2009 2010 2011 2012 2013

CANADA MORTGAGE AND HOUSING CORPORATION
-1.6%
-4.7%
12.4%
15.5%
2.3%
18.4%
1.6%3.0%
-10.0%
-1.4%
5.9%6.8%
1.8%
-15%
-10%
-5%
0%
5%
10%
15%
20%
25%
2001 2002 2003 2004 2005 2006 2007 2008 2009 2010 2011 2012 2013
MLS® is a registered trademark of the Canadian Real Estate Association
Source: CREA
New Listings (% Change) – Greater MonctonJanuary to October
Greater Moncton

CANADA MORTGAGE AND HOUSING CORPORATION
0
20
40
60
80
100
120
2000 2001 2002 2003 2004 2005 2006 2007 2008 2009 2010 2011 2012 2103
YTD
Average Days on Market
Greater Moncton
MLS® is a registered trademark of the Canadian Real Estate Association
Source: Greater Moncton REALTORS® du Grand Moncton/CREA
YTD = January to September
CANADA MORTGAGE AND HOUSING CORPORATION
0%
20%
40%
60%
80%
100%
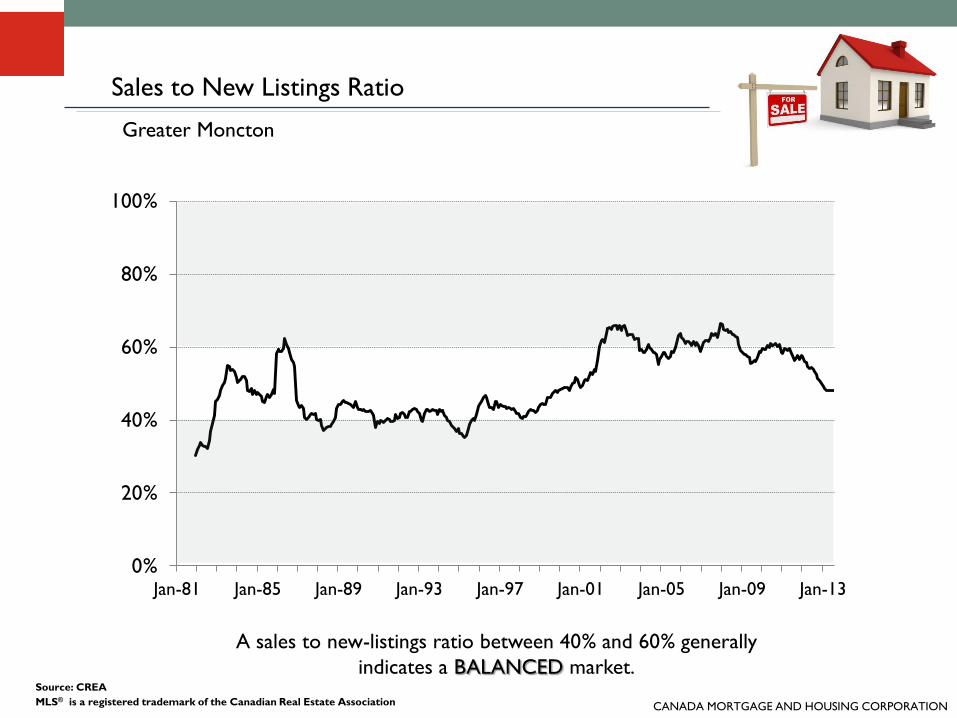
Jan-81 Jan-85 Jan-89 Jan-93 Jan-97 Jan-01 Jan-05 Jan-09 Jan-13
Sales to New Listings Ratio
Greater Moncton
A sales to new-listings ratio between 40% and 60% generally
indicates a BALANCED market.
MLS® is a registered trademark of the Canadian Real Estate Association
Source: CREA
CANADA MORTGAGE AND HOUSING CORPORATION
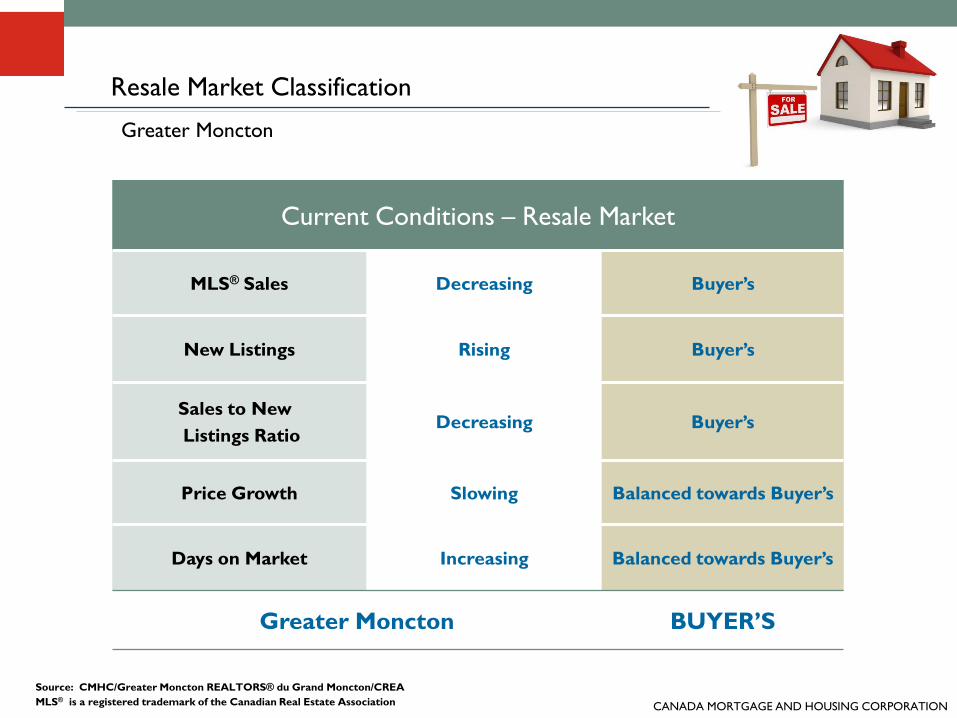
Current Conditions – Resale Market
MLS® Sales Decreasing Buyer’s
New Listings Rising Buyer’s
Sales to New
Listings RatioDecreasing Buyer’s
Price Growth Slowing Balanced towards Buyer’s
Days on Market Increasing Balanced towards Buyer’s
Greater Moncton BUYER’S
MLS® is a registered trademark of the Canadian Real Estate Association
Source: CMHC/Greater Moncton REALTORS® du Grand Moncton/CREA
Resale Market Classification
Greater Moncton

CANADA MORTGAGE AND HOUSING CORPORATION
Multi-Residential/Rental Market
Resale Market
2013/2014 Outlook
Housing Market Drivers
New Home Market – Single Family Homes

CANADA MORTGAGE AND HOUSING CORPORATION
Source : CMHC/CREA
2013 Outlook
Annual Transactions – New and Existing Home
Greater Moncton(Semi-detached + Row + Single-detached + MLS® Sales)
0
500
1,000
1,500
2,000
2,500
3,000
3,500
4,000
4,500
1980 1984 1988 1992 1996 2000 2004 2008 2012
1980-1989 1990-1999 2010-2012
1,273 1,632 3,121
MLS® is a registered trademark of the Canadian Real Estate Association

CANADA MORTGAGE AND HOUSING CORPORATION
2013/2014 Outlook
Forecast: CMHC
MLS® is a registered trademark of the Canadian Real Estate Association
Resale Market
Moncton
CMA2012 2013F
%
Change2014F
MLS® Sales 2,259 2,150 - 4.8% 2,050
Average
Price$158,106 $156,500 -1% $156,000
Moderate decline in existing homes sales expected in both 2013
and 2014
Source: Greater Moncton REALTORS® du Grand Moncton/CREA

CANADA MORTGAGE AND HOUSING CORPORATION
Residential Housing Starts
Moncton CMA 2012 2013F % Change 2014F
Total Housing
Starts1,297 890 -31% 650
Single Starts 364 240 -34% 230
Multiple
Starts933 650 -30 % 420
2013/2014 Outlook
Source and Forecast: CMHC

CANADA MORTGAGE AND HOUSING CORPORATION
Thank You
Questions?
www.cmhc.ca
or
Call Claude Gautreau
at (506) 851-2742