housing finance and inclusive growth in africa · pdf filehousing finance and inclusive growth...
TRANSCRIPT
HOUSING FINANCE and INCLUSIVE GROWTH in Africa
Benchmarking, Determinants and Effects1
Christian-Lambert Nguena2
The University of Yaounde II and the World Bank
Fulbert Tchana Tchana3
The World Bank
Albert G. Zeufack4
The World Bank
ARTICLE SUBMITTED FOR
African Economic Conference (AEC) 2015 on
“Addressing Poverty and Inequality in the Post 2015 Development Agenda”
Kinshasa, Democratic Republic of Congo, November 2-4, 2015
Abstract
Using a panel database of 48 Sub-Saharan African countries from 2000 to 2013, this paper analyses the structure of
housing finance in Africa, its determinants, and its impact on inclusive growth. Our empirical investigation finds that
market capitalization and urbanization are key positive determinants of housing finance while a post-conflict
environment is conductive for greater housing finance development. This result suggests that housing finance is
driven by demand and supply as any standard market. Besides, we find that housing finance development in Africa is
not yet an effective tool for inequality reduction, given that it remains at a very early stage. However, we show that
above a given threshold, housing finance could be efficient for inequality reduction. Finally, housing finance is
loosely positively related to greater economic development in Africa. All these findings suggest that policies to boost
housing finance development in Africa should be viewed as measures that would provide benefits in the medium to
long terms.
KEYWORDS: Housing Finance, Sub-Saharan Africa, inclusive growth, Shared prosperity.
JEL: G21, R1, O4.
1 The views expressed in this paper are not necessary those of the World Bank Group. The authors thank Simon
Walley for sharing its database. All errors and omissions are the authors’ sole responsibilities. 2 Research Fellow, Research in Applied Micro and Macroeconomics (REMA), [email protected]. & President,
African Association of Young Economists (AAYE), [email protected]. 3 Senior economist, The World Bank, [email protected]
4 Practice manager, The World Bank, [email protected]
2
I. Introduction
Sub-Saharan African countries (Africa) have experienced stable economic growth averaging 5 percent
over the past decade. However, growth has not been inclusive and poverty as well as unemployment have
remained very high. The challenge of inclusive growth is made even more daunting by unmanaged
urbanization that has led to millions leaving in sub-standard housing.
Africa has the highest growth rate of urbanization but the least developed housing finance in the world
(see World Bank, 2014). UN Habitat (2008) reports that 46 African cities are now larger than one million
people and that every day for the coming fifteen years, Africa’s cities will have to accommodate an extra
40,000 people. Over the next 25 years, more and more people will be added to the number of urban
dwellers in Africa. This implies a growth in the demand for housing that African countries will face and
the need to address this by developing a housing finance system. This new challenge is emerging in a
context of already widespread poverty and inequality in cities, with a lot of people living in slums without
adequate basic services.
However, the low capacity of the construction industry and the absence of a strong housing finance sector
are likely to exacerbate tensions on the housing market, leading to high rental rate and further widening
income inequality. Despite a positive trend, the share of mortgage to GDP remains extremely low in
Africa (3 percent) compared to 70 percent in developed countries. Africa’s mortgage markets are nascent
and small by international comparisons. However, according to data from Badev et al. (2013), the average
proportion of population who can afford the minimum income required for a prudent mortgage is 16
percent in Africa. So far, efforts of African governments, international partners, and financial institutions
have barely reduced the gap between housing demand and housing supply in Africa urban areas (with
housing demand higher that supply). As in other parts of the world, this gap is even more important for
low and moderate income households. In fact, currently most low and moderate income household in
Africa only have access to the unregulated informal housing sector. With the exception of South Africa,
formal sector housing programs (public and/or private) have mostly targeted middle and upper income
households in Africa.
Because of its importance, housing finance has generated at least three main strands in economic literature.
The first strand focusing on its determinants (see Badev et al., 2014; Egert and Mihaljek, 2007; Haibin
Zhu, 2006; and Buckley and Madhusudhan, 1984); the second on the channels with which it affects
inclusive growth (see Buckley, 1996 and Dubel, 2007); and the third on its impact on growth and shared
prosperity (see Hongyu et al., 2002 and Gutierrez et al., 2007). This literature has answered numerous
questions of interest on housing finance determinants but so far has not focused on specific characteristics
of SSA housing finance, such as its very low level of development. The literature still has to provide a
comprehensive analysis of the linkage between housing finance and shared prosperity especially in Africa.
Building on existing literature and to fill the gap, this paper answers the following questions: What is the
structure and typology of housing finance in Africa? What are the determinants of housing finance
development in Africa? What is the relationship between housing finance, growth and inequality in Africa?
Data investigation suggests that the housing finance sector is very weak in Africa. The ratio of mortgage
to GDP is less than 10 percent for almost all countries but South Africa and Namibia. Housing penetration
is also very low with no country posting more than 9 percent penetration rate and three out of four
countries with a rate lower than 5 percent. Also, the mortgage rate, the legal system and country’s GDP
per capita are correlated with housing finance in Africa. Countries with higher GDP per capita and low
3
mortgage interest rates enjoy greater housing finance. In turn, greater access to Africa housing finance is
positively related to GDP growth, inequality reduction, and human development indicators
Our econometric investigation provides important findings on each of our questions of interest. Regarding
the determinants, stock market capitalization and urban population growth rates are the strongest positive
determinants, while recovery from conflict is another determinant albeit less strong. In addition, some
variables seem to be hampering housing finance depending on the economic environment. These variables
are: the credit to the economy, which is a proxy of the development of the banking sector and trade
openness which may masque the low housing finance in oil exporting countries.
In addition, housing finance impacts positively on inequality reduction and inclusive growth. Firstly, there
is a threshold effect in the impact of housing finance depth on inequality; indeed a higher value of housing
finance depth is negatively and significantly correlated to inequality while a very low and very high value
presents a non-significant result. Secondly, our results suggest that an increase of 1 point of percentage
(pp) of housing finance depth could lead to an increase of 0.37 percent of GDP per capita growth. This
result confirms Hongyu et al. (2002), Erbas and Nofthaft (2002), Uy (2006) and Freire et al. (2006)
findings in other regions.
The remainder of this paper is organized as follows: Section 2 provides a literature review; section 3
presents the characteristics of housing finance policy in Africa and investigates the link between housing
finance and shared prosperity; section 4 provides an econometric analysis using a panel dataset we’ve
built and draw some policy implications; and section 6 concludes the paper.
II. Housing finance description, determinants, and inclusive growth effects: an
empirical literature review
The literature related to housing finance determinants and impact on inclusive growth is growing. The
literature has been mostly empirical and has focused less on specific issues facing the housing market in
Africa. In this section, we present the literature in three strands. The first rand strand reviews papers on
housing finance determinants, the second focuses on the channels used by housing finance to impact
growth and inequality and the third strand presents the impact of housing finance on growth and inequality
reduction. In each of these strands, we distinguish between theoretical and empirical findings as well as
SSA findings versus global findings.
2.1. Determinants of housing finance
The literature on the determinants of housing finance so far has been empirical and has not focus on
specific determinants of housing finance in SSA. This literature highlights three main determinants,
namely, the level of development proxied by GDP per capita, the stock market development as well as
informal finance. Most importantly it shows that government support or subsidy is not one of them.
Therefore, a specific study for Africa may be needed where GDP per capita is actually very low and
would certainly not make a difference.
Badev et al. (2014) using a new set of data on the depth and penetration of mortgage markets across
countries in the world found that: i) mortgage markets seem to develop only at relatively high levels of
GDP per capita; ii) policies associated with financial system development (such as price stability, the
efficiency of contractual and information frameworks, etc.) are also associated with mortgage market
development, including; iii) well-functioning insurance market and better capitalization of stock market
are strongly associated with mortgage market development. Moreover, Buckley and Madhusudhan (1984)

4
tested a model of the relationship between housing investment and GDP, anticipated inflation, changes in
inflation and the extent of capital deepening across several developing and transition countries. They
found that, holding all else constant countries with deeper financial markets invest relatively more in
housing.
Also, Haibin and Zhu, (2006), by analyzing the structure of housing finance markets and house prices in
selected Asian countries, have found evidence that in economies with more flexible housing finance
markets, house prices are more responsive to overall changes in market conditions, particularly equity
price movements. The main explanatory variables used were GDP, bank credit, equity prices, short-term
interest rates, consumer price index and exchange rate.
In addition, Besley et al. (1992) have shown that informal finance matter in long term finance by showing
that the allocative performance of Rotating Savings and Credit Associations (ROSCAS) is very high. The
result highlights the need to verify and check if it can be used as an alternative in the context of Africa
where this type of financial institution is very common. The fact that the formal housing finance system is
limited in SSA countries reinforces the necessity to investigate the alternative of informal housing finance
system.
Finally, many studies have shown that government involvement is not one of the determinants. For
example Badev et al. (2014) show that neither government subsidies, nor government support of housing
financing through State bank dedicated to housing finance has been proven to spur this sector. In fact,
many developing countries have had such banks for many decades, but their housing finance sector
remains tiny.
2.2. Channels used by housing finance to impact growth and inequality
In the literature, housing finance impacts economic growth by reducing the cost of capital, increasing
savings, increasing tax revenues, increasing investment on education, reducing vulnerability, and
increasing financial deepening. By reducing the cost of capital, housing finance can spur economic growth.
In fact, Dubel (2007) provides a model analyzing the relationship between housing finance and housing
affordability and show that a well-functioning housing finance reduces loan interest rates, which in turn
results in greater affordability of housing with a potential positive impact on economic growth.
By increasing savings housing finance can spur growth. According to Buckley (1996), many reasons
explain why improving housing finance may lead to increased savings in the economy. First, the return to
housing will likely provide positive returns. Second, housing provides the most secure collateral against
market fluctuations and a positive yield over the long-run. Third, housing prices are less volatile than
other asset prices. Fourth, the availability of housing improves labor mobility and therefore employment
potential. Finally, the availability of affordable housing finance may lead to increased savings as potential
homeowners save to make the required down payment and to maintain their asset. This saving will be the
engine of investment and therefore for economic growth and development.
By increasing tax revenues housing finance contributes to the development of public infrastructure and
ultimately of economic growth and reduction of inequality. Hangen and Northrup (2010) and Econsult
(2009) shows that activities related to housing has a positive impact on revenues of states and other local
governments in the United States. In the United States as well as in other countries, greater revenues to
local government often translate to better infrastructure for the population and ultimately to reduction of
inequality.
5
2.3. Housing finance, economic growth and reduction of inequality
Studies suggest that housing investment has an impact on economic growth and employment. For example,
Hongyu et al. (2002) find that compared to non-housing investment, housing investment has a stronger
short-run effect on economic growth. They also find that housing investment has a long run impact on
economic growth but not on non-housing investment. Chen and Zhu (2008) found that the relationship
between housing investment and economic growth in China is different depending on which provinces are
analyzed. Moreover, Erbas and Nothaft (2002) find that low income housing has a lower import
component in production and also higher labor intensity. This implies that construction of low income
housing will lead to greater employment and growth than the construction of middle or high income
housing. Tipple (1994) by verifying the links between employment and housing development shows that
investment in shelter is very effective for promoting employment, especially among lower-income groups;
some of the benefits to the economy tend to be inversely proportional to housing cost meaning that low
cost housing is more beneficial to the economy.
In addition, to the empirical analysis of the relationship between housing and economic growth, there are
some estimates of multiplier effects associated with construction in developing countries. For example,
Uy (2006) cites that for every 1 peso spent on housing activities in the Philippines, an additional 16.61
pesos are contributed to the GDP.
Meanwhile, housing finance has the potential to increase investment on education, hence reducing
vulnerability of the poor; it could also improve financial deepening and inclusion. This improvement of
financial deepening is critical for poverty reduction in SSA.
Housing finance could Increase investment on education and reduce vulnerability for the poor. Becker
(1975) and Atkinson (1975) studied the link between investment in human capital and wealth distribution.
An implication of these models is that income inequality will decrease as access to finance improves and
that housing improves homeowner’s borrowing capacity. Housing finance could lead to higher investment
in human capital. By improving housing affordability, housing finance may improve education
opportunities for the poor. Jacoby (1994) finds that lack of access to credit perpetuates poverty in Peru
because poor households can’t afford to provide their children with appropriate education. Jacoby and
Skoufias (1997) find that without access to finance, shocks to income cause poor families to discontinue
schooling for children; housing provides an asset that can be used to smooth shocks to income.
More inclusive housing financial system can improve poor and low-moderate income household’s access
to finance their housing. Consistent with this view, Malpezzi (1999) suggests shifting from a housing
finance perspective, where special circuits are used to mobilize short-term household deposits for long-
term mortgages, to a perspective where housing finance is integrated with broader capital markets. Singh
and Huang (2011) analyze data from Africa between 1992 and 2006 and find that financial deepening (as
measured in part by credit to the private sector as a percent of GDP) is associated with less poverty and
income disparities in African countries and that this is most important in early stages of financial
development. Stronger property rights strengthen this relationship. Beck, Demirguc-Kunt, and Levine
(2004) examine a broad cross country sample of 58 developing countries and find that financial
development (as measured by the ratio of financial intermediation to the private section to GDP) reduces
income inequality by disproportionately raising the incomes of the poor. Moreover, Singh and Huang
(2011) found that poverty is inversely related to financial deepening. In addition, financial deepening
reduces absolute levels of poverty but does not impact income inequality in a significant manner in
6
African countries. This suggests that various definitions should be examined to gain further insight into
the relationship between housing finance and poverty and to capture the impact on the absolute poor.
III. Stylized fact on housing finance in SSA
3.1. Data
In order to highlight the stylized facts and to undertake the econometric analysis, we examine a sample of
54 African countries with data from African Development Indicators (ADI), and the Financial
Development and Structure Database (FDSD), the Housing Finance Databases of the World Bank. The
database summary and description is present in the appendix. The analysis is limited to 2000-2012 to
ensure more up to date results. Housing market and finance policy data are from the newest Housing
Finance Databases of the World Bank.
3.2. Benchmarking the SSA housing market and finance policy: Typology and characteristics
Benchmarking the SSA housing market and finance policy along with a comparative approach is essential
to have a clear picture at the base of what have been done until now and what should been done. The first
sub-section present a general point on all SSA countries and the second sub-section, specific views based
on fundamental characteristics such as wealth, legal origins, political stability, regional context, and oil
resources.
SSA housing market and finance policy: A general point of view
Overall, there is a growing banking sector in Africa since the liberalization two decades ago.
Liberalization consisted for African government to approve new financial institutions legislation, and
institutionalised private banking system, ending in some cases the State monopoly in this sector. SSA
countries financial system is growing fast and becoming increasingly integrated into the global financial
systems. At the core of the system are banks, followed by pension funds. The regular Financial Sector
Assessment Program (FSAP) implemented in those countries generally confirmed that the banking system
is well capitalized, liquid, and profitable.
However, only few commercial banks clearly offer housing loans in the form of mortgages as a product
for their customers. The majority of banks in Africa finance house acquisitions, not from housing loans,
specifically but as investment, private and/or standard consumer loans. These latter products generally
have high interest rates with short repayment periods.
Some African countries have opted to establish specialized single-purpose nonbank mortgage lenders, or
―monoline‖ lenders, most notably, Kenya, which has housing finance companies; Nigeria, which has
primary mortgage institutions; and South Africa, which has financial service providers specializing in
mortgage lending. Typically, these institutions have a narrow banking license limiting their activities and,
in particular, restricting deposit collection. This means that they are usually reliant on wholesale funding
on the liability side of their balance sheets. These institutions are particularly vulnerable during crisis
period because their funding costs rose to a much greater extent relative to lenders with a deposit base.
The banking and the financial system in most of SSA countries remain underdeveloped compared to other
developing regions. In general, the ratio of private sector credit to GDP is less than 20 percent and
financial access is lower (There is only 1.0 total branch per 100.000 adult). The small size of national
markets, the low level of incomes and the weak creditor rights and judicial enforcement mechanisms
7
could be the reason of this situation. Moreover, there is a need to improve the development level of the
financial sector especially mortgage financing and the banking sector. However, there is good perspective
since gradual financial deepening is underway in most SSA countries (Montfort et al., 2013).
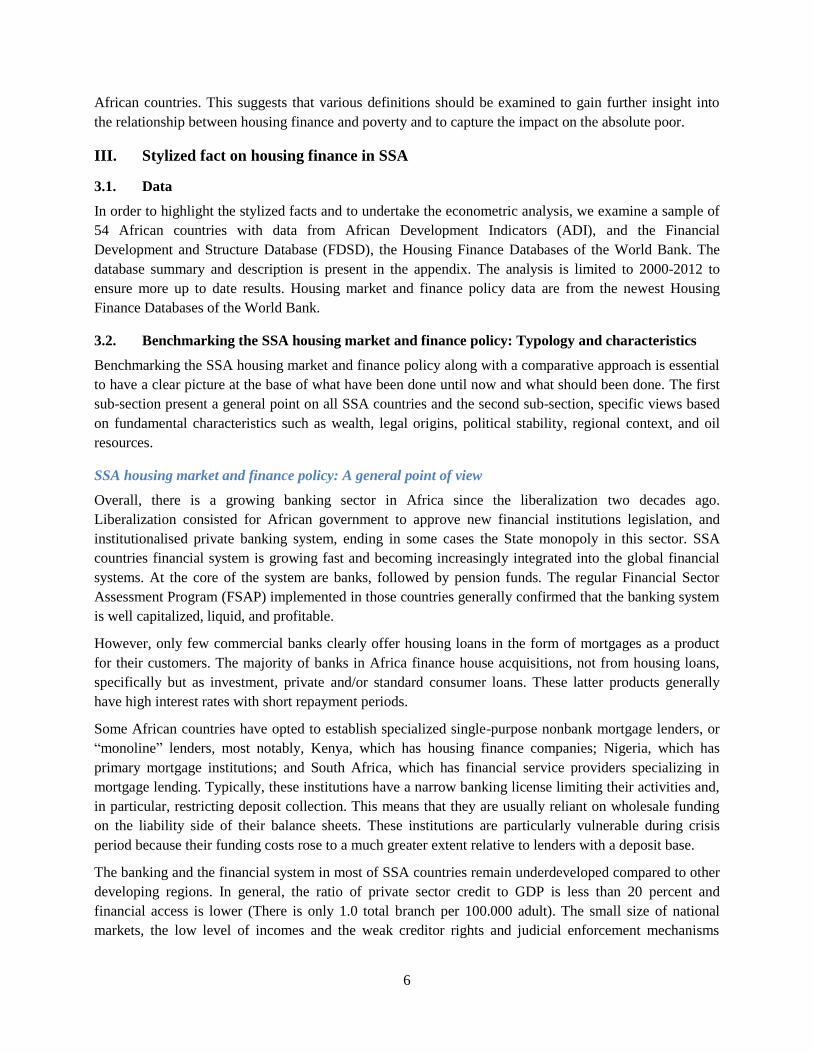
Although the mortgage market in Africa is still small by international standards, the sector is growing
gradually and is attracting more and more attention from policy makers. Positive growth is now observed
in some markets like Kenya and Uganda. For example Kenya's mortgage market grew by 37 percent in
2012, resulting in total up to 19,700 mortgages; while Uganda has shown signs of growth at the end of
December 2012, representing about 0.98 percent of GDP which higher than the previous performance.
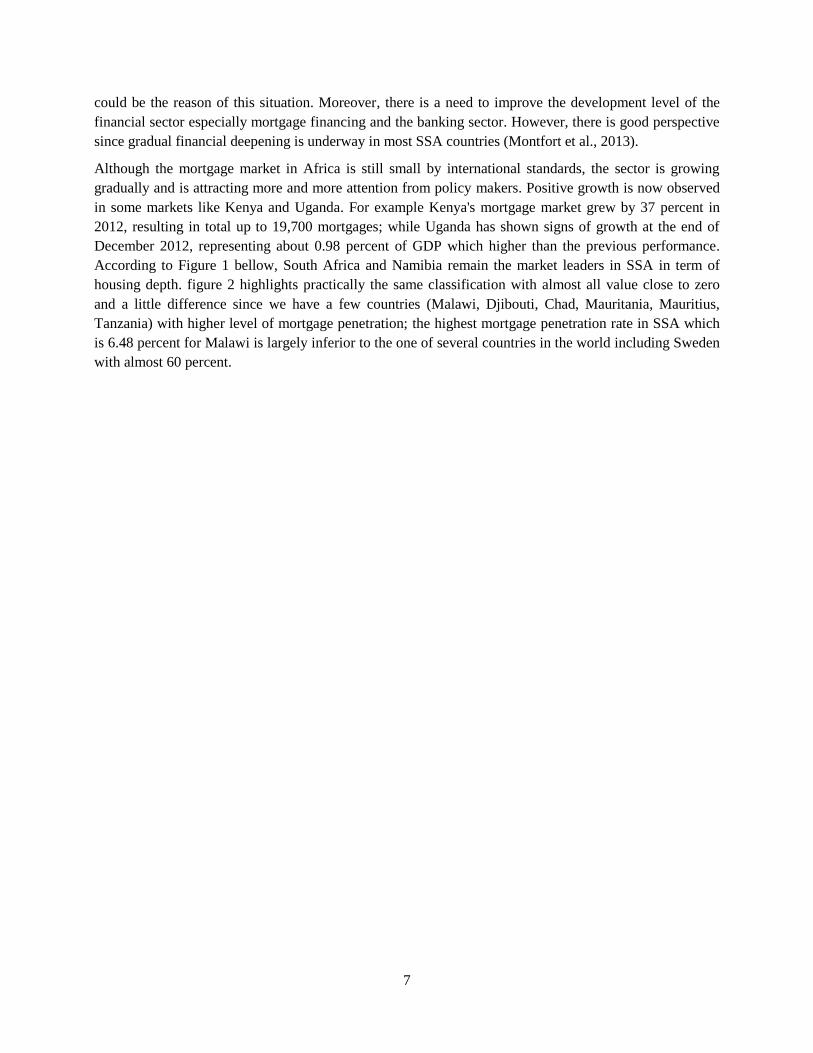
According to Figure 1 bellow, South Africa and Namibia remain the market leaders in SSA in term of
housing depth. figure 2 highlights practically the same classification with almost all value close to zero
and a little difference since we have a few countries (Malawi, Djibouti, Chad, Mauritania, Mauritius,
Tanzania) with higher level of mortgage penetration; the highest mortgage penetration rate in SSA which
is 6.48 percent for Malawi is largely inferior to the one of several countries in the world including Sweden
with almost 60 percent.
8
Figure 1: Comparative mortgages depth across SSA
countries (As a percentage of GDP for 2000-2010
observation periods).
Figure 2: Comparative mortgages penetration across SSA
countries (Housing loan penetration).
Note: Percentage of adult population with an outstanding loan to
purchase a home. Unlike mortgage depth indicator, the penetration index refers to any provider of housing loans, including regulated financial
institutions, microfinance institutions and other formal sources
Source: Authors calculation using the World Bank data base on
housing finance launched by Badev et al., 2014: ―Housing finance
across countries: New data and analysis‖, WPS6756
Source: Authors calculation using the Global Financial Inclusion
database (FINDEX) launched by Demirguc-Kunt, Asli and Leora
Klapper (2012), ―Measuring financial inclusion: the global Findex Database‖, World Bank Policy Research Working Paper 6025.
SSA is the region in the world where housing finance is the least developed. In fact, in SSA, many
countries have less than 1 percent mortgage depth or don’t have any mortgage market. Moreover, , its
most advanced countries such as South Africa (30.8 percent) and Namibia (20.0 percent) in terms of
mortgage market development, are far behind many countries in the world with deepen mortgage market
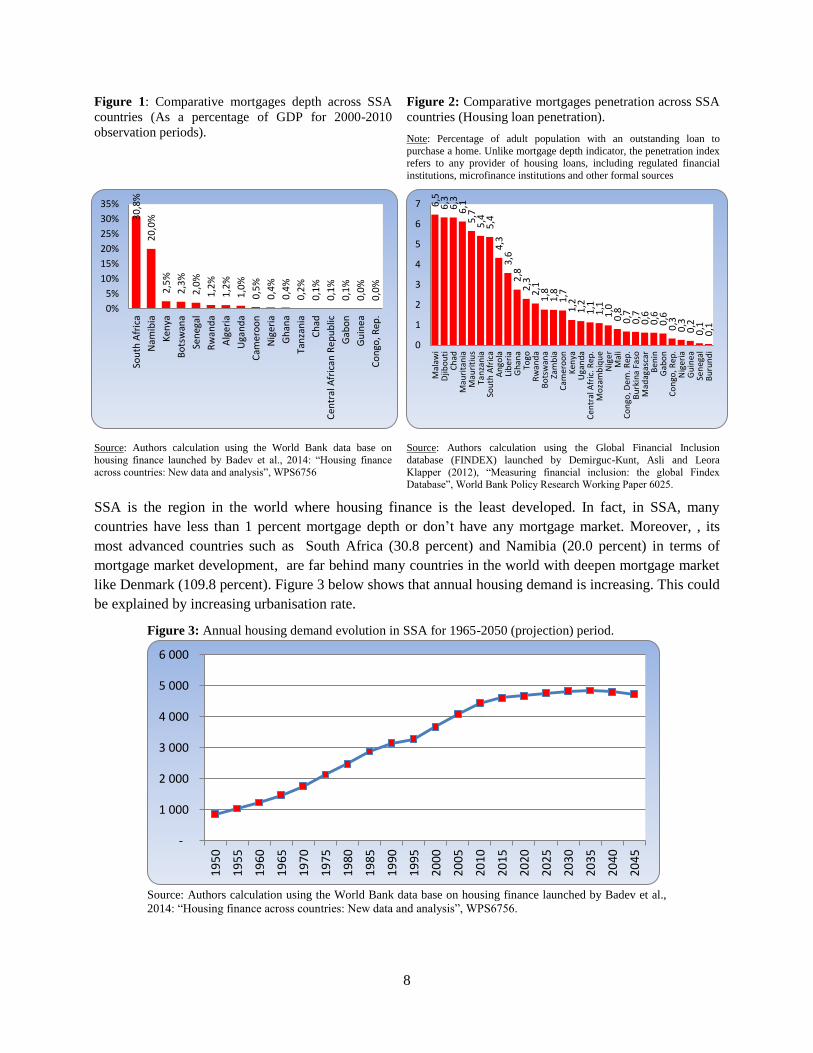
like Denmark (109.8 percent). Figure 3 below shows that annual housing demand is increasing. This could
be explained by increasing urbanisation rate.
Figure 3: Annual housing demand evolution in SSA for 1965-2050 (projection) period.
Source: Authors calculation using the World Bank data base on housing finance launched by Badev et al.,
2014: ―Housing finance across countries: New data and analysis‖, WPS6756.
6,5
6
,3
6,3
6
,1
5,7
5
,4
5,4
4
,3
3,6
2
,8
2,3
2
,1
1,8
1
,8
1,7
1
,2
1,2
1
,1
1,1
1
,0
0,8
0
,7
0,7
0
,6
0,6
0
,6
0,3
0
,3
0,2
0
,1
0,1
0
1
2
3
4
5
6
7
Mal
awi
Djib
ou
tiC
had
Mau
rita
nia
Mau
riti
us
Tan
zan
iaSo
uth
Afr
ica
An
gola
Lib
eria
Gh
ana
Togo
Rw
and
aB
ots
wan
aZa
mb
iaC
amer
oo
nK
enya
Uga
nd
aC
entr
al A
fric
. Rep
.M
oza
mb
iqu
eN
iger
Mal
iC
on
go, D
em. R
ep.
Bu
rkin
a Fa
soM
adag
asca
rB
enin
Gab
on
Co
ngo
, Rep
.N
iger
iaG
uin
eaSe
neg
alB
uru
nd
i
-
1 000
2 000
3 000
4 000
5 000
6 000
19
50
19
55
19
60
19
65
19
70
19
75
19
80
19
85
19
90
19
95
20
00
20
05
20
10
20
15
20
20
20
25
20
30
20
35
20
40
20
45
30
,8%
20
,0%
2,5
%
2,3
%
2,0
%
1,2
%
1,2
%
1,0
%
0,5
%
0,4
%
0,4
%
0,2
%
0,1
%
0,1
%
0,1
%
0,0
%
0,0
%
0%
5%
10%
15%
20%
25%
30%
35%
Sou
th A
fric
a
Nam
ibia
Ken
ya
Bo
tsw
ana
Sen
egal
Rw
and
a
Alg
eria
Uga
nd
a
Cam
ero
on
Nig
eria
Gh
ana
Tan
zan
ia
Ch
ad
Cen
tral
Afr
ican
Rep
ub
lic
Gab
on
Gu
ine
a
Co
ngo
, Rep
.
9
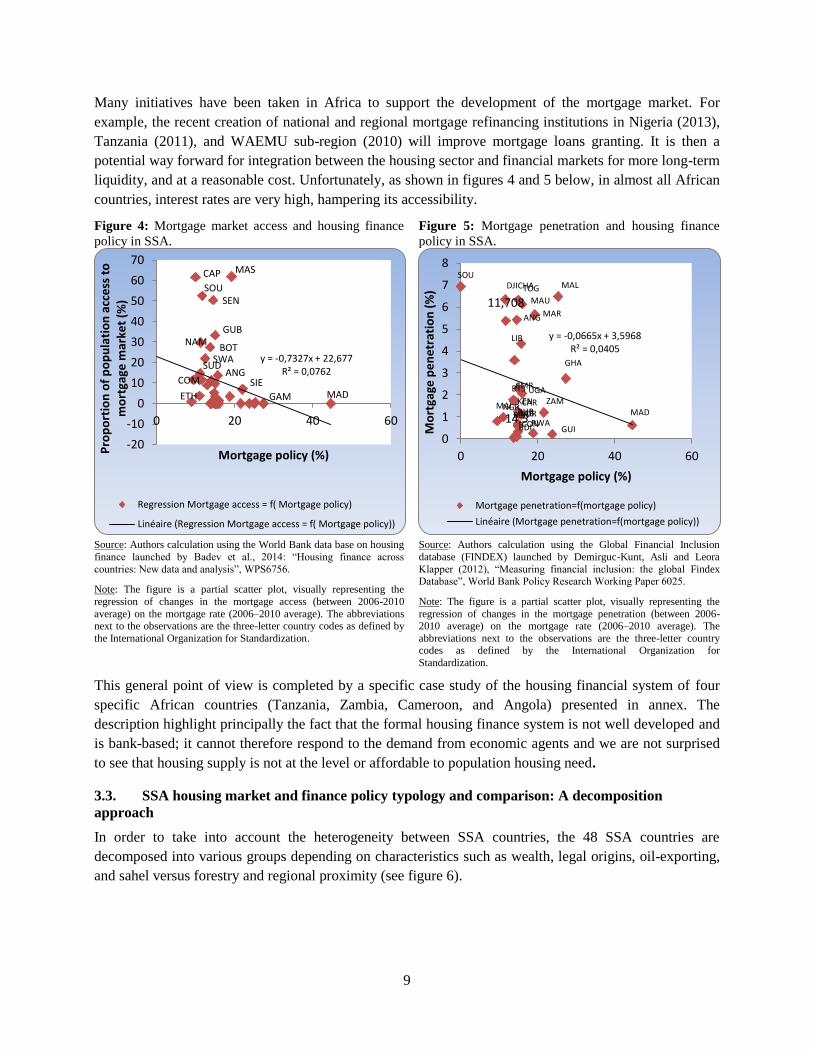
Many initiatives have been taken in Africa to support the development of the mortgage market. For
example, the recent creation of national and regional mortgage refinancing institutions in Nigeria (2013),
Tanzania (2011), and WAEMU sub-region (2010) will improve mortgage loans granting. It is then a
potential way forward for integration between the housing sector and financial markets for more long-term
liquidity, and at a reasonable cost. Unfortunately, as shown in figures 4 and 5 below, in almost all African
countries, interest rates are very high, hampering its accessibility.
Figure 4: Mortgage market access and housing finance
policy in SSA. Figure 5: Mortgage penetration and housing finance
policy in SSA.
Source: Authors calculation using the World Bank data base on housing
finance launched by Badev et al., 2014: ―Housing finance across
countries: New data and analysis‖, WPS6756.
Note: The figure is a partial scatter plot, visually representing the
regression of changes in the mortgage access (between 2006-2010
average) on the mortgage rate (2006–2010 average). The abbreviations next to the observations are the three-letter country codes as defined by
the International Organization for Standardization.
Source: Authors calculation using the Global Financial Inclusion
database (FINDEX) launched by Demirguc-Kunt, Asli and Leora
Klapper (2012), ―Measuring financial inclusion: the global Findex Database‖, World Bank Policy Research Working Paper 6025.
Note: The figure is a partial scatter plot, visually representing the
regression of changes in the mortgage penetration (between 2006-2010 average) on the mortgage rate (2006–2010 average). The
abbreviations next to the observations are the three-letter country codes as defined by the International Organization for
Standardization.
This general point of view is completed by a specific case study of the housing financial system of four
specific African countries (Tanzania, Zambia, Cameroon, and Angola) presented in annex. The
description highlight principally the fact that the formal housing finance system is not well developed and
is bank-based; it cannot therefore respond to the demand from economic agents and we are not surprised
to see that housing supply is not at the level or affordable to population housing need.
3.3. SSA housing market and finance policy typology and comparison: A decomposition
approach
In order to take into account the heterogeneity between SSA countries, the 48 SSA countries are
decomposed into various groups depending on characteristics such as wealth, legal origins, oil-exporting,
and sahel versus forestry and regional proximity (see figure 6).
ANG
BOT
CAP
ETH
GUB
GAM MAD
COM
MAS
NAM
SEN
SIE
SOU
SUD SWA y = -0,7327x + 22,677
R² = 0,0762
-20
-10
0
10
20
30
40
50
60
70
0 20 40 60
Pro
po
rtio
n o
f p
op
ula
tio
n a
cce
ss t
o
mo
rtga
ge m
arke
t (%
)
Mortgage policy (%)
Regression Mortgage access = f( Mortgage policy)
Linéaire (Regression Mortgage access = f( Mortgage policy))
ANG
BEN
BTS
BUR
BDI
CMR
CAR
CHA
CDR CON
DJI
GAB
GHA
GUI
KEN
LIB
MAD
MAL
MAI
MAU
MAR
NGR
RWA 14,5
SOU
11,708 TOG
UGA ZAM
y = -0,0665x + 3,5968 R² = 0,0405
0
1
2
3
4
5
6
7
8
0 20 40 60
Mo
rtga
ge p
en
etr
atio
n (
%)
Mortgage policy (%)
Mortgage penetration=f(mortgage policy)
Linéaire (Mortgage penetration=f(mortgage policy))
10
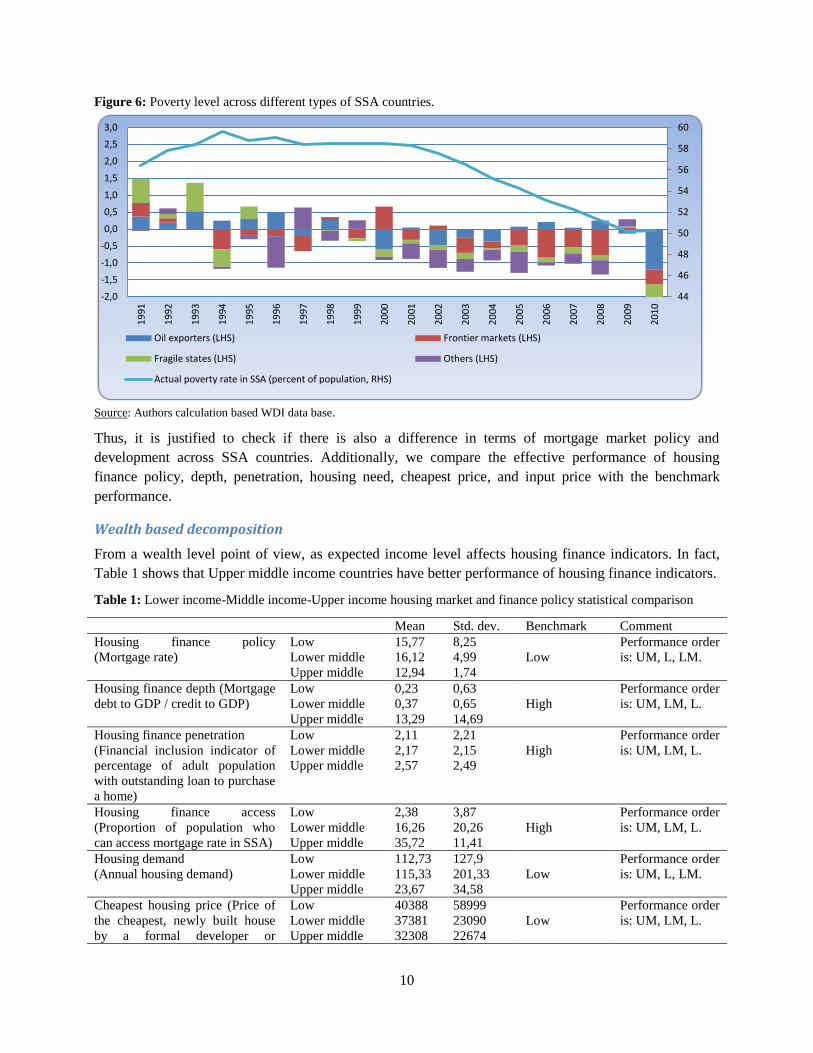
Figure 6: Poverty level across different types of SSA countries.
Source: Authors calculation based WDI data base.
Thus, it is justified to check if there is also a difference in terms of mortgage market policy and
development across SSA countries. Additionally, we compare the effective performance of housing
finance policy, depth, penetration, housing need, cheapest price, and input price with the benchmark
performance.
Wealth based decomposition
From a wealth level point of view, as expected income level affects housing finance indicators. In fact,
Table 1 shows that Upper middle income countries have better performance of housing finance indicators.
Table 1: Lower income-Middle income-Upper income housing market and finance policy statistical comparison
Mean Std. dev. Benchmark Comment
Housing finance policy
(Mortgage rate)
Low 15,77 8,25
Low
Performance order
is: UM, L, LM. Lower middle 16,12 4,99
Upper middle 12,94 1,74
Housing finance depth (Mortgage
debt to GDP / credit to GDP)
Low 0,23 0,63
High
Performance order
is: UM, LM, L. Lower middle 0,37 0,65
Upper middle 13,29 14,69
Housing finance penetration
(Financial inclusion indicator of
percentage of adult population
with outstanding loan to purchase
a home)
Low 2,11 2,21
High
Performance order
is: UM, LM, L. Lower middle 2,17 2,15
Upper middle 2,57 2,49
Housing finance access
(Proportion of population who
can access mortgage rate in SSA)
Low 2,38 3,87
High
Performance order
is: UM, LM, L. Lower middle 16,26 20,26
Upper middle 35,72 11,41
Housing demand
(Annual housing demand)
Low 112,73 127,9
Low
Performance order
is: UM, L, LM. Lower middle 115,33 201,33
Upper middle 23,67 34,58
Cheapest housing price (Price of
the cheapest, newly built house
by a formal developer or
Low 40388 58999
Low
Performance order
is: UM, LM, L. Lower middle 37381 23090
Upper middle 32308 22674
44
46
48
50
52
54
56
58
60
-2,0
-1,5
-1,0
-0,5
0,0
0,5
1,0
1,5
2,0
2,5
3,0
19
91
19
92
19
93
19
94
19
95
19
96
19
97
19
98
19
99
20
00
20
01
20
02
20
03
20
04
20
05
20
06
20
07
20
08
20
09
20
10
Oil exporters (LHS) Frontier markets (LHS)
Fragile states (LHS) Others (LHS)
Actual poverty rate in SSA (percent of population, RHS)

11
contractor)
Housing input price
(Cost of standard 50kg bag of
cement in US$)
Low 12,21 5,1
Low
Performance order
is: UM, LM, L. Lower middle 10,42 1,96
Upper middle 7,61 0,53 Source: Authors calculation based on a collection of data from a survey, the World Bank and Housing Finance in Africa
yearbooks 2010, 2011 and 2013. Available at: www.housingfinanceafrica.org (accessed: 08/09/2014).
Notes: All measures are in US$. The countries included in each group are: (1) Lower income countries: Guinea-Bissau, Guinea,
Sierra Leone, Liberia, Mali, Burkina Faso, Togo, Benin, Niger, Chad, Central African Rep., Dem. Rep. of Congo, Uganda, Kenya,
Ethiopia, Eritrea, Somalia, Tanzania, Mozambique, Zimbabwe, Madagascar, Comoros; (2) Lower middle income countries: Cape
Verde, Senegal, Mauritania, Ivory Coast, Ghana, Nigeria, Cameroon, Congo, Angola, Zambia, Lesotho; (3) Upper middle income
countries: Gabon; Namibia, Botswana, South Africa, Equatorial Guinea.
Legal origins based decomposition
It is important to check in an analytical and quantitative point of view if there is a significant difference of
the state of housing market and finance policy by taking into consideration the legal origins of countries.
The main legal origins in SSA considered are the French (code civil) and British (common law) systems.
Table 2 shows that countries with French based legal system perform better on mortgage rate policy while
countries with British based legal system perform better on Housing finance depth, housing finance
penetration, and housing finance access.
Table 2: French and British legal origin countries housing market and finance policy statistical comparison
Mean Std dev. Benchmark Comment
Housing finance policy
(Mortgage rate)
French
speaking
15,91 7,25
Low
French speaking countries
perform better than
English speaking countries English
speaking
16,16 6,3
Housing finance depth
(Mortgage debt to GDP /
Credit to GDP)
French
speaking
0,14 0,45
High
English speaking countries
perform better than French
speaking countries English
speaking
3,92 8,99
Housing finance penetration
(Financial inclusion indicator
of percentage of adult
population with outstanding
loan to purchase a home)
French
speaking
1,88 2,25
High
English speaking countries
perform better than French
speaking countries English
speaking
3,26 2,27
Housing finance access
(Proportion of population who
can access mortgage rate in
SSA)
French
speaking
10,38 16,45
High
English speaking countries
perform better than French
speaking countries English
speaking
10,96 17,58
Cheapest housing price (Price
of the cheapest, newly built
house by a formal developer
or contractor)
French
speaking
42560 58330
Low
Both tend to have the same
performance
English
speaking
43520 26039
Housing input price (Cost of
standard 50kg bag of cement
in US$)
French
speaking
12,29 5,3
Low
Both tend to have the same
performance
English
speaking
10,49 3,94
Source: Authors calculation based on a collection of data from a survey, the World Bank and Housing Finance in Africa
yearbooks 2010, 2011 and 2013. Available at: www.housingfinanceafrica.org (accessed: 08/09/2014).
Notes: All measures are in US$. The countries included in each group are: (1) French speaking countries: Angola, Benin, Burkina
Faso, Burundi, Cameroon, Cape Verde, Central African Rep., Chad, Comoros, Congo, Ivory Coast, Dem. Rep. of Congo, Djibouti,
Equatorial Guinea, Gabon, Guinea, Guinea-Bissau, Madagascar, Mali, Mauritania, Niger, Sao Tome & Principe, Senegal and
Togo; (2) English speaking countries: Botswana, Eritrea, Ethiopia, Gambia, Ghana, Kenya, Lesotho, Liberia, Malawi, Mauritius,
Mozambique, Namibia, Nigeria, Rwanda, Seychelles, Sierra Leone, Somalia, South Africa, Sudan, Swaziland, Tanzania, Uganda,
Zambia and Zimbabwe.
12
Other grouping
We found that oil-exporting countries have better performance in terms of housing finance than oil non-
exporting countries. The income level might be the better explanation of this situation. Besides, regional
proximity is relevant for housing finance performances. We found that ECCAS present best performances
in housing finance policy and demand; SADC have best performances in housing finance depth,
penetration and access; ECOWAS have best performances in housing price and input price. EAC presents
average performance in all housing finance characteristics.
3.4. Housing finance, inclusive growth, and inequality in SSA: a statistical analysis
Recent literature states that in the world in general and in Africa in particular, more urbanized countries
have lower inequality rate and that urbanization goes hand in hand with more prosperity (Fox and
Sohnesen, 2012; Christiansen, 2013; World Bank, 2013). The process of urbanization should be
accompanied by growth of affordable housing supply to respond to the consequent growing demand of
housing. The development of the housing finance system could be an excellent tool for this objective.
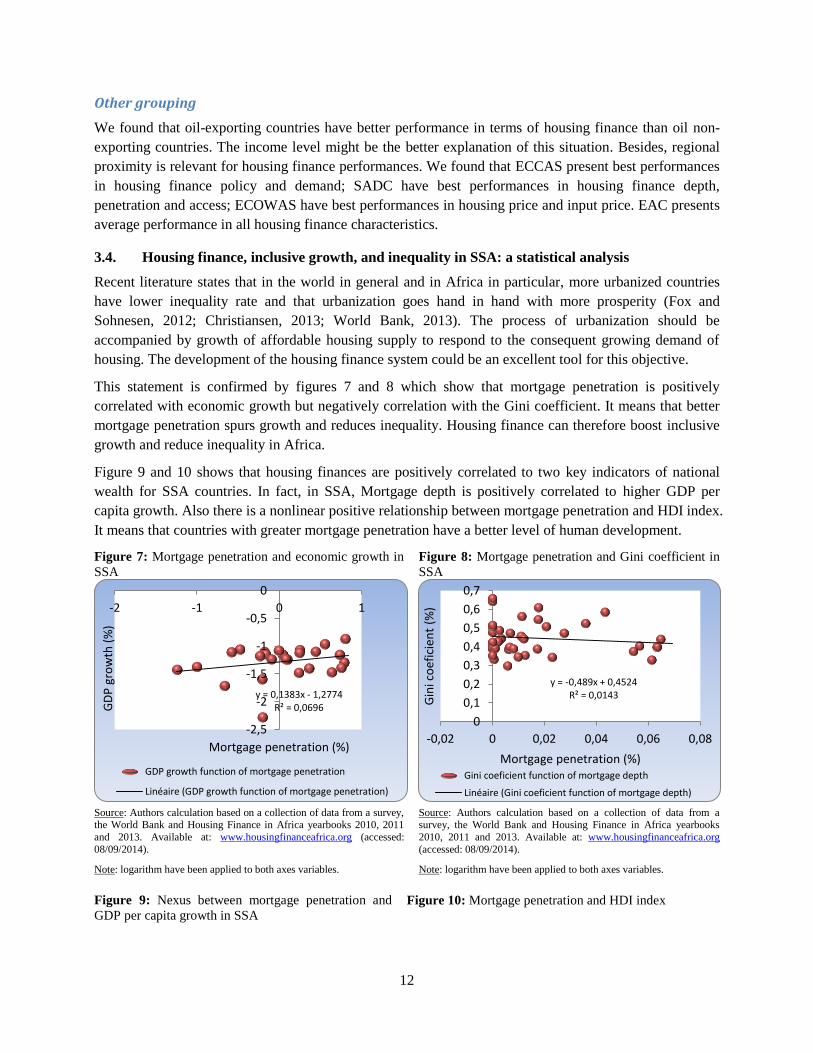
This statement is confirmed by figures 7 and 8 which show that mortgage penetration is positively
correlated with economic growth but negatively correlation with the Gini coefficient. It means that better
mortgage penetration spurs growth and reduces inequality. Housing finance can therefore boost inclusive
growth and reduce inequality in Africa.
Figure 9 and 10 shows that housing finances are positively correlated to two key indicators of national
wealth for SSA countries. In fact, in SSA, Mortgage depth is positively correlated to higher GDP per
capita growth. Also there is a nonlinear positive relationship between mortgage penetration and HDI index.
It means that countries with greater mortgage penetration have a better level of human development.
Figure 7: Mortgage penetration and economic growth in
SSA Figure 8: Mortgage penetration and Gini coefficient in
SSA
Source: Authors calculation based on a collection of data from a survey, the World Bank and Housing Finance in Africa yearbooks 2010, 2011
and 2013. Available at: www.housingfinanceafrica.org (accessed:
08/09/2014).
Note: logarithm have been applied to both axes variables.
Source: Authors calculation based on a collection of data from a survey, the World Bank and Housing Finance in Africa yearbooks
2010, 2011 and 2013. Available at: www.housingfinanceafrica.org
(accessed: 08/09/2014).
Note: logarithm have been applied to both axes variables. Figure 9: Nexus between mortgage penetration and
GDP per capita growth in SSA Figure 10: Mortgage penetration and HDI index
y = 0,1383x - 1,2774 R² = 0,0696
-2,5
-2
-1,5
-1
-0,5
0
-2 -1 0 1
GD
P g
row
th (
%)
Mortgage penetration (%)
GDP growth function of mortgage penetration
Linéaire (GDP growth function of mortgage penetration)
y = -0,489x + 0,4524 R² = 0,0143
0
0,1
0,2
0,3
0,4
0,5
0,6
0,7
-0,02 0 0,02 0,04 0,06 0,08
Gin
i co
efic
ien
t (%
)
Mortgage penetration (%) Gini coeficient function of mortgage depth
Linéaire (Gini coeficient function of mortgage depth)

13
Source: Authors calculation based on a collection of data
from a survey, the World Bank and Housing Finance in
Africa yearbooks 2010, 2011 and 2013. Available at:
www.housingfinanceafrica.org (accessed: 08/09/2014).
Source: Authors calculation based on a collection of data from a
survey, the World Bank and Housing Finance in Africa
yearbooks 2010, 2011 and 2013. Available at:
www.housingfinanceafrica.org (accessed: 08/09/2014).
NB: Logarithm have been applied to both axes variable.
Overall there is a positive link between housing finance and
shared prosperity and between housing finance and poverty
reduction.
In order to complete this exploratory, we have presented some selected SSA country housing finance
market typology in annexes. The case study focuses on four SSA countries from three different sub-
regions. These countries are Cameroon for central and West Africa, Angola for central Africa, Tanzania
for east Africa and Zambia for southern Africa
IV. Empirical investigation and analysis
4.1. Regression models specification
In order to answer the three questions of interest, three regression models are used.
The first empirical investigation is based on a theoretical model of microeconomic study of the banking
sector. Indeed, the SSA housing financial system is essentially constituted of banks and we think that a
coherent study of housing finance determinants must consider the banking system. For this purpose, the
theoretical model presented by Dehesa (2007) and replicated with modification by Nguena and Tsafack
(2014) is used and augmented by taking into account the housing finance stylized facts in Africa. The
model explains the theoretical link between financial deepening and factors related to sector banking and
real economy operation by focusing on the credit market since there is a small proportion of lending over
deposits and excess liquidity banks in Africa.
From this theoretical model, we derive a reduced form of our first log-log empirical model to assess
housing finance determinants; it is given by:
HFINit = + 1 MACAP it+ 2 Upopit+ 3 GDPPCit+4 GDPgrowthit+ Xit +it
Where:
y = 0,0091x + 0,0233 R² = 0,0275
-0,15
-0,1
-0,05
0
0,05
0,1
0,15
-1 0 1 2 3
GD
P p
er
cap
ita
gro
wth
(%
)
Mortgage depth (%)
Shared prosperity function of mortgage depth
Linéaire (Shared prosperity function of mortgage depth)
y = 0,0276x - 0,3351 R² = 0,0275
-0,5
-0,45
-0,4
-0,35
-0,3
-0,25
-0,2
-0,15
-0,1
-0,05
0
-2 -1 0 1
HD
I in
de
x (%
)
Mortgage penetration (%)
Poverty reduction function of Mortgage penetration
Linéaire (Poverty reduction function of Mortgage penetration)
14
1. HFIN is a housing finance indicator, MACAP a financial market indicator, Upop the ratio of urban
population to total population, GDPPC the GDP per capita which is an indicator of the level of
development of the country, GDP growth; and X is a set of control (see appendix for more detail).
2. are parameters, B a matrix of parameters, it the disturbance term; and the other variables are
defined in appendix.
The second model assesses the linkage between housing finance and economic growth. It is based on
theoretical argument developed in the literature review and specific finding about the SSA housing market
presented in section 3.
Starting by the theoretical economic growth model developed by Mankiw et al. (1992), we have defined
several variables including housing finance indicator which were assumed to impact the real block.
Theoretical predictions advocate that financial development (including housing finance development)
contributes directly to inclusive growth and inequality reduction: first, in a direct way through savings,
insurance services and access to credits that can enhance the productivity of assets the poor by allowing
them to invest in new technologies, or investing in education and health. Financial development can
improve opportunities for the poor to have access to formal finance (Jalilian and Kirkpatrick, 2001); there
is also a ―multiplier effect‖5 during and after housing construction through job creation. Second, financial
system enables the poor to access financial services, particularly credit and insurance risk, enhancing the
productive assets of the poor, by improving productivity and increasing the potential to achieve
sustainable gains (Jalilian and Kirkpatrick, 2001).
It is given by
( ) ( ) ( ) (2)
Where are parameters, it the disturbance term.
The set of control variables account for all relevant determinants of GDP per capita given by the
neoclassical growth theory such as labor, capital, etc. In addition it accounts for legal origin and regional
consideration highlighted in section 3.
The third model assesses the linkage between housing finance and inequality. It is based on theoretical
arguments developed in the literature review and specific findings about the SSA housing market
presented in section 3.
Housing finance can help reduce poverty through mainly economic growth and job creation. Additionally,
housing finance development can theoretically help reduce poverty through the market of labor (unleash
recruitment, reduce unemployment, increase household revenue through salaries and thus reduce poverty);
the market of goods and services (increase in household services and good consumption and thus reduce
poverty through household business revenue increase) and the housing market (reduction of housing price,
increase of household finance capacity and thus reduce poverty).
5 Multiplier Effects from Housing during Construction: the first impacts are the jobs and spending that occur when
the housing is constructed. Jobs created during this phase include the construction workers who are building the
structure as well as workers in their firms who support them, such as office managers, cost estimators, and
accountants. Multiplier Effects from Housing after Construction: after construction, housing is occupied and further
economic impacts occur. If the housing units are rented, rental payments contribute to the economic activity. The
household income of all housing residents contributes to the economic activity when households spend their
disposable income on items such as food, clothing, transportation, and health care.
15
As the financial system becomes healthier and more competitive, it may have more capacity and desire to
bear the high costs of small credits (Rajan and Zingales, 2003). For instance, in Latin America commercial
banks have begun to make pooled loans available to the poor, as microcredit institutions have been doing
(Mosley, 1999). Also, the evolution of informal credit, often the only source of borrowing for poor people,
is made easier by the growth of a formal financial system that provides informal institutions with
opportunities for profitable deposits. Moreover, access to credit enables the poor to smooth their
consumption, thus reducing their vulnerability to exogenous shocks and building human capital.
Following this presentation of the theoretical relation, we based our empirical model on the model
developed by Davis and Nieuwerburgh (2014) and Acemoglu (2009); he built a household centred partial
equilibrium model by considering of human capital investments with imperfect credit markets (as it is the
case in practically all the SSA region). Thus the third empirical model is given by:
( ) ( ) ( ) (4)
Where are parameters, the disturbance term; and INQ an inequality indicator
The set of control variables account for all relevant determinants of inequality given by the development
theory such as employment, education, gender inequality, etc. It also accounts for key findings highlighted
in section 3.
4.2. Estimation Strategy
The choice of panel data analysis gives us the advantage of having a reasonable size of sample and time
series data for analysis, which could not have been performed on each of the individual countries.
Additionally, the double dimension of panel data allows us to take simultaneously into account the
dynamic behavior and possible heterogeneity across countries, which is neither possible with time series
nor with cross-sectional data. We will consider both static and dynamic specification.
To estimate the static model specification, we carry specification and robustness check including
stationary and cointegration test; based on the result, we will apply either the FGLS (Feasible Generalized
Least Square) in case of presence of heteroscedasticity or XTPMG Stata command in case of non-
stationary problem. To estimate the model, we use the System Generalized Method-of-Moment (GMM)
estimator developed by Blundell and Bond (1998). The estimator combines two set of equations. The first
set includes first-differenced equations where the right-hand-side variables are instrumented by the levels
of the series lagged one period or more. The second set consists of the equations in levels with the right-
hand side variables being instrumented by lagged first of higher-order differences.
This estimator has several advantages.6 It takes into account country-specific effects, while addressing
issues associated with endogeneity, measurement errors, and omitted variables. By exploiting internal
instruments, the System GMM estimator removes the often hard task of identifying valid external
instruments consisting of variables that are correlated with the endogenous explanatory variable but not
with the error term of the equation.
The validity of these internal instruments (lagged variables in level and first differences) was not rejected.
As suggested by Arellano and Bond (1991), and Blundell and Bond (1998), a Sargan/Hansen test of over-
identifying restrictions and a serial correlation test were carried out. In both instances, the null hypothesis
could not be rejected (the instrumental variables are not correlated with the residual, and the errors exhibit
6 Bond, Hoeffler, and Temple (2001) offer a good overview on GMM estimation of empirical growth models.
16
no second-order serial correlation). In addition, to limit the risk of over-instrumentation, we keep the
number of instruments to the minimum by using as instrument only the first valid lagged value of the
right-hand side variables. We assume that financial variables are endogenous, therefore are instrumented
by their second lag value, while the other variables, treated as predetermined, are instrumented by their
first lag value.
We will also test the existence of threshold if necessary.
4.3. Results Analysis and discussion
We present below estimation results of the three models.
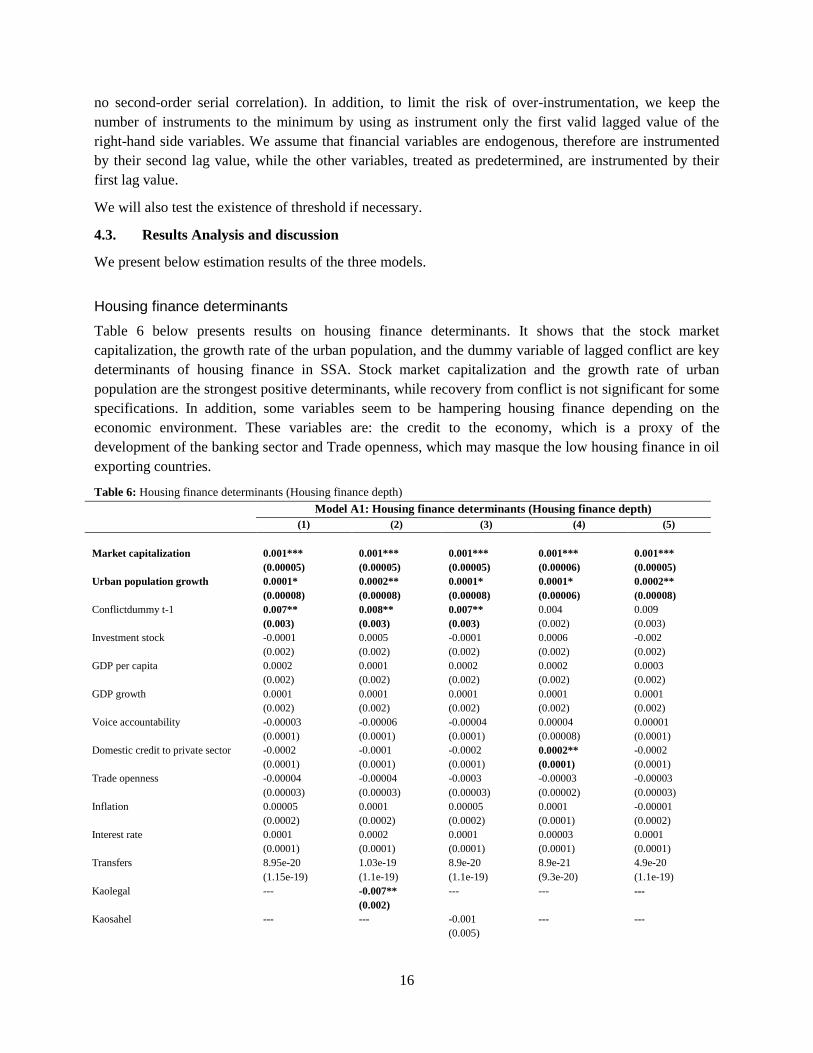
Housing finance determinants
Table 6 below presents results on housing finance determinants. It shows that the stock market
capitalization, the growth rate of the urban population, and the dummy variable of lagged conflict are key
determinants of housing finance in SSA. Stock market capitalization and the growth rate of urban
population are the strongest positive determinants, while recovery from conflict is not significant for some
specifications. In addition, some variables seem to be hampering housing finance depending on the
economic environment. These variables are: the credit to the economy, which is a proxy of the
development of the banking sector and Trade openness, which may masque the low housing finance in oil
exporting countries.
Table 6: Housing finance determinants (Housing finance depth) Model A1: Housing finance determinants (Housing finance depth)
(1) (2) (3) (4) (5)
Market capitalization 0.001*** 0.001*** 0.001*** 0.001*** 0.001***
(0.00005) (0.00005) (0.00005) (0.00006) (0.00005)
Urban population growth 0.0001* 0.0002** 0.0001* 0.0001* 0.0002**
(0.00008) (0.00008) (0.00008) (0.00006) (0.00008)
Conflictdummy t-1
0.007** 0.008** 0.007** 0.004 0.009
(0.003) (0.003) (0.003) (0.002) (0.003)
Investment stock -0.0001 0.0005 -0.0001 0.0006 -0.002
(0.002) (0.002) (0.002) (0.002) (0.002)
GDP per capita 0.0002 0.0001 0.0002 0.0002 0.0003
(0.002) (0.002) (0.002) (0.002) (0.002)
GDP growth 0.0001 0.0001 0.0001 0.0001 0.0001
(0.002) (0.002) (0.002) (0.002) (0.002)
Voice accountability -0.00003 -0.00006 -0.00004 0.00004 0.00001
(0.0001) (0.0001) (0.0001) (0.00008) (0.0001)
Domestic credit to private sector -0.0002 -0.0001 -0.0002 0.0002** -0.0002
(0.0001) (0.0001) (0.0001) (0.0001) (0.0001)
Trade openness -0.00004 -0.00004 -0.0003 -0.00003 -0.00003
(0.00003) (0.00003) (0.00003) (0.00002) (0.00003)
Inflation 0.00005 0.0001 0.00005 0.0001 -0.00001
(0.0002) (0.0002) (0.0002) (0.0001) (0.0002)
Interest rate 0.0001 0.0002 0.0001 0.00003 0.0001
(0.0001) (0.0001) (0.0001) (0.0001) (0.0001)
Transfers 8.95e-20 1.03e-19 8.9e-20 8.9e-21 4.9e-20
(1.15e-19) (1.1e-19) (1.1e-19) (9.3e-20) (1.1e-19)
Kaolegal --- -0.007** --- --- ---
(0.002)
Kaosahel --- --- -0.001 --- ---
(0.005)
17
Kaomac --- --- --- -0.0004*** ---
(0.00004)
Kaofcbf --- --- --- --- 0.003***
(0.0009)
Constant -0.004 -0.02 -0.005 -0.027 0.04
(0.063) (0.061) (0.062) (0.05) (0.062)
Countries 45 45 45 45 45
Observations 223 223 233 223 223
Source: Authors estimates
Note: Kaolegal (Financial openness*Legal-dummy: Legal based decomposition-); Kaosahel (Financial openness*Sahel-dummy: Sahel based
decomposition-); Kaowealth (Financial openness*Wealth-dummy: wealth based decomposition-); Kaotrop (Financial openness*Trade openness);
Kaomac (Financial openness*Market capitalization); Kaofbcf (Financial openness*Investment stock). *,**,***: significance levels of 10%, 5%
and 1% respectively. Values in bracket are standard errors.
The stock market capitalization is a key determinant of housing finance in SSA. In fact, it is significant in
all specifications of our empirical model. This result is coherent with the theoretical prediction and the
empirical finding of Badev et al. (2014) at a global level. As a matter of fact, financial and stock markets
are less developed in almost all African countries. A study by Beck et al. (2011) shows that more banking
and less stock market are the key features of the financial structure; this could be the reason why SSA has
a weak housing finance market since their financial structure is more bank-based than market-based.
Indeed, we can see that this financial structure failed to improve housing finance depth in SSA; this could
be explained by the fact that banking sector usually do not offer specific and acceptable housing loan,
which are generally long term loans. For almost all these countries, there are several government and
private banks but mortgage depth remains low, stable and mostly tends to decrease. Hence, policy makers
willing to boost housing finance in SSA countries should consider strongly strengthening the development
of stock market. Moreover, the credit to the private sector is either non-significant and negatively or
significant and positively correlated to housing finance. Another explanation is the fact that market is
characterized by direct deals and therefore high willingness to find and sign respectful contracts while
banking is characterized by indirect deals which have indeed several weaknesses such as asymmetric
information, adverse selection…etc. This ambiguous empirical result might mean that the assumption of
banking development as a catalyzer of housing finance should be relativized since it seems to be
detrimental. Indeed, we can see in the country case studies in annexed that, the African banking sector is
more developed than the financial sector; however, the region still has a low depth of housing finance.
Developing mortgage markets is an imperative in this context and should be encouraged by a clear State
policy.
In addition, the growth rate of urban population is instrumental to housing market development in SSA. In
table 6, the growth rate of urban population is a positive determinant of housing finance in all empirical
model specifications except one. This variable drives the demand of marketable housing in any country
and specifically in SSA countries. This result confirms the finding of Badev et al. (2014) at a global level
in the African context.
Furthermore, reconstruction after years of violent conflict is also a key determinant of housing finance. In
many empirical specifications, the dummy of lagged conflict is positively and significantly correlated to
greater housing finance in SSA. Two main rationales are behind this finding: i) conflicts generally
devastated housing and after the conflict there is a need to reconstruct, ii) people tend to consume all their
spending during conflict periods; at the end of the conflict they do not have enough saving to build houses
without financing, therefore their willingness to borrow increase.
18
Besides, inflation rate, interest rate, transfers from abroad, GDP growth and GDP per capita rate are
associated positively to housing finance, but they are not significant. Hence, inflation rate, interest rate,
transfers from abroad; GDP growth and GDP per capita rate are weak determinants of financial deepening.
These findings are the same as Egert and Mihaljek (2007) and Haibin Zhu (2006). However, trade
openness, domestic credit, and investment stock impact negatively on housing finance.
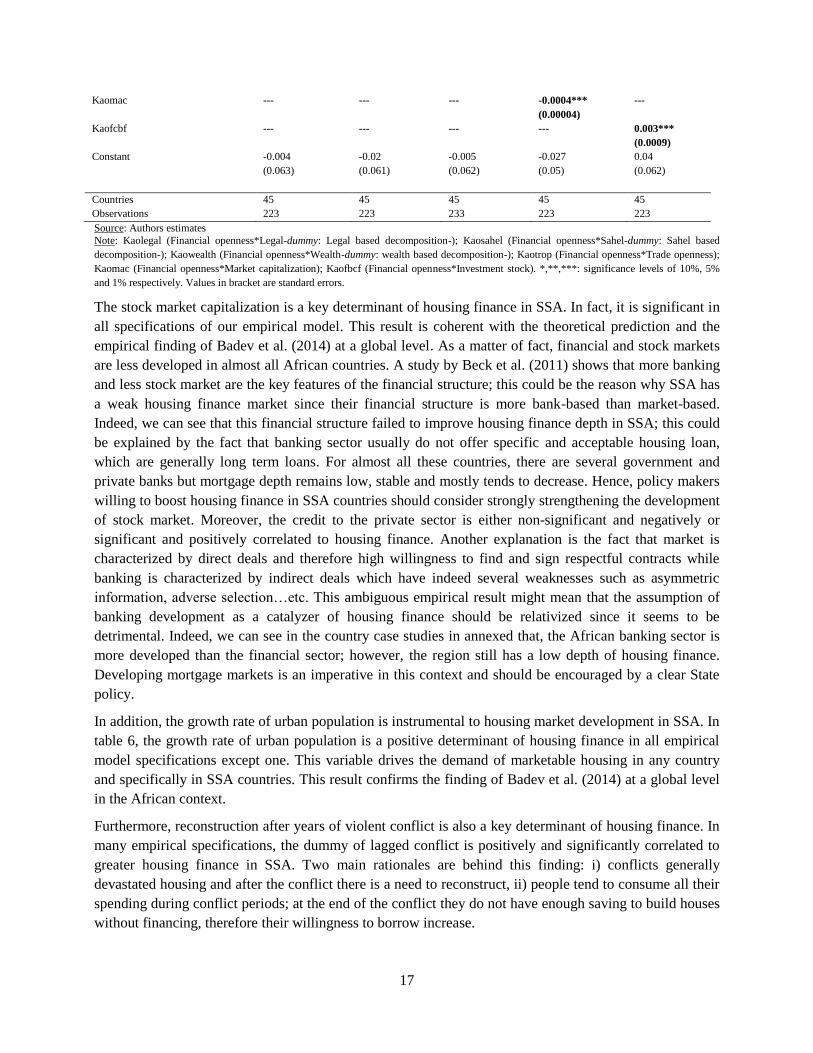
Besides the basic model and in subsequent regressions, we added one composed variable at a time. The
idea is to check the compounded effect of our previous context differentiation. We find that financial
openness combined with legal_dummy, investment stock, and market capitalization has a significant
impact while its combination with Sahel_dummy is non-significant. On the one hand, the combination of
legal_dummy and market capitalization impacts negatively on housing finance depth and on the other, the
combination with investment stock impacts positively.
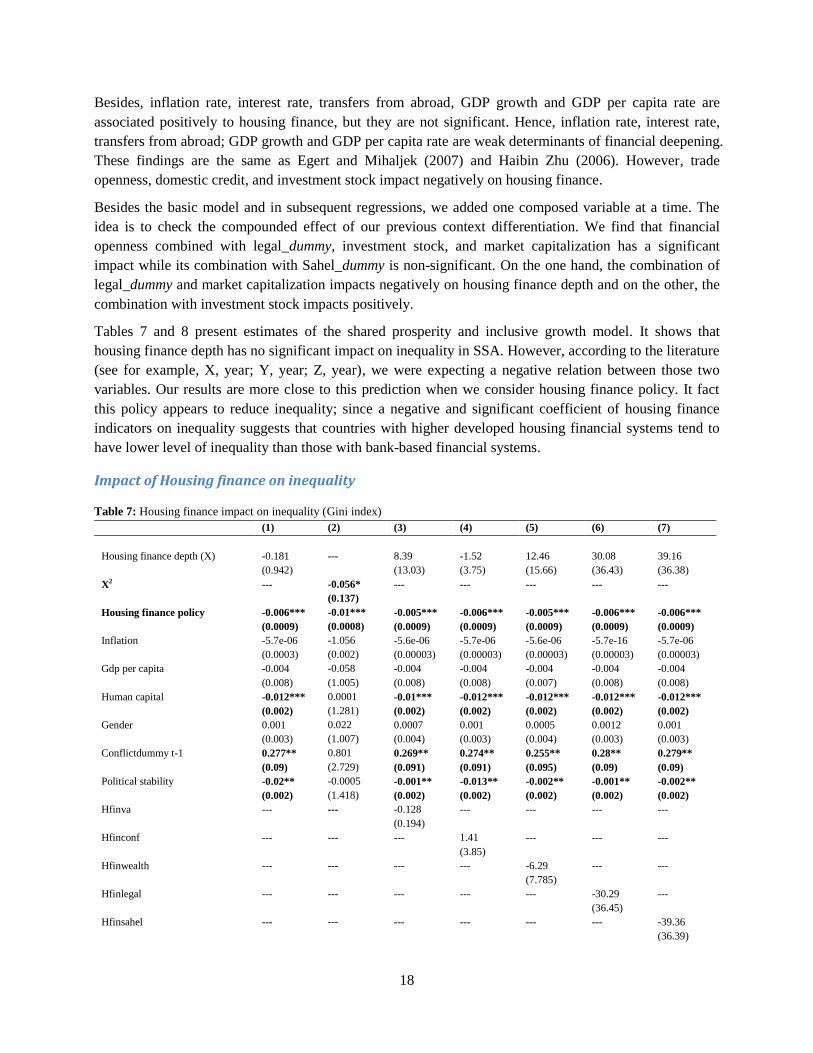
Tables 7 and 8 present estimates of the shared prosperity and inclusive growth model. It shows that
housing finance depth has no significant impact on inequality in SSA. However, according to the literature
(see for example, X, year; Y, year; Z, year), we were expecting a negative relation between those two
variables. Our results are more close to this prediction when we consider housing finance policy. It fact
this policy appears to reduce inequality; since a negative and significant coefficient of housing finance
indicators on inequality suggests that countries with higher developed housing financial systems tend to
have lower level of inequality than those with bank-based financial systems.
Impact of Housing finance on inequality
Table 7: Housing finance impact on inequality (Gini index) (1) (2) (3) (4) (5) (6) (7)
Housing finance depth (X) -0.181 --- 8.39 -1.52 12.46 30.08 39.16
(0.942) (13.03) (3.75) (15.66) (36.43) (36.38)
X2 --- -0.056* --- --- --- --- ---
(0.137)
Housing finance policy -0.006*** -0.01*** -0.005*** -0.006*** -0.005*** -0.006*** -0.006***
(0.0009) (0.0008) (0.0009) (0.0009) (0.0009) (0.0009) (0.0009)
Inflation -5.7e-06 -1.056 -5.6e-06 -5.7e-06 -5.6e-06 -5.7e-16 -5.7e-06
(0.0003) (0.002) (0.00003) (0.00003) (0.00003) (0.00003) (0.00003)
Gdp per capita -0.004 -0.058 -0.004 -0.004 -0.004 -0.004 -0.004
(0.008) (1.005) (0.008) (0.008) (0.007) (0.008) (0.008)
Human capital -0.012*** 0.0001 -0.01*** -0.012*** -0.012*** -0.012*** -0.012***
(0.002) (1.281) (0.002) (0.002) (0.002) (0.002) (0.002)
Gender 0.001 0.022 0.0007 0.001 0.0005 0.0012 0.001
(0.003) (1.007) (0.004) (0.003) (0.004) (0.003) (0.003)
Conflictdummy t-1 0.277** 0.801 0.269** 0.274** 0.255** 0.28** 0.279**
(0.09) (2.729) (0.091) (0.091) (0.095) (0.09) (0.09)
Political stability -0.02** -0.0005 -0.001** -0.013** -0.002** -0.001** -0.002**
(0.002) (1.418) (0.002) (0.002) (0.002) (0.002) (0.002)
Hfinva --- --- -0.128 --- --- --- ---
(0.194)
Hfinconf --- --- --- 1.41 --- --- ---
(3.85)
Hfinwealth --- --- --- --- -6.29 --- ---
(7.785)
Hfinlegal --- --- --- --- --- -30.29 ---
(36.45)
Hfinsahel --- --- --- --- --- --- -39.36
(36.39)
19
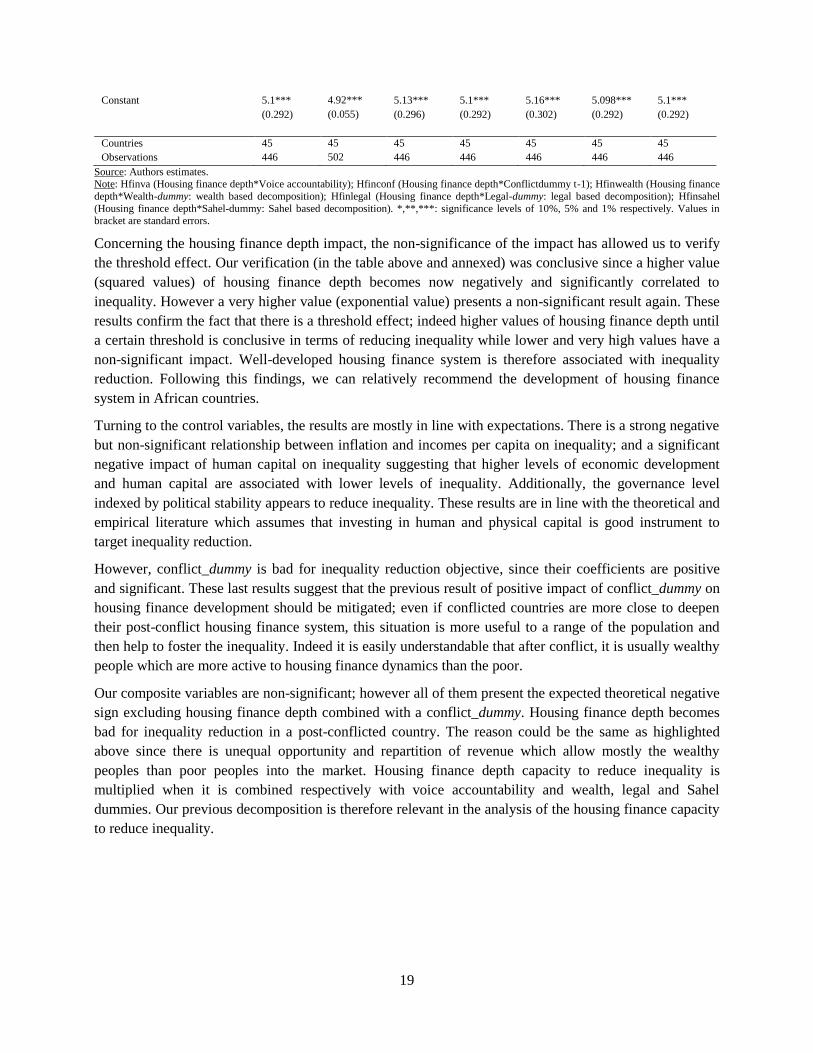
Constant 5.1*** 4.92*** 5.13*** 5.1*** 5.16*** 5.098*** 5.1***
(0.292) (0.055) (0.296) (0.292) (0.302) (0.292) (0.292)
Countries 45 45 45 45 45 45 45
Observations 446 502 446 446 446 446 446
Source: Authors estimates. Note: Hfinva (Housing finance depth*Voice accountability); Hfinconf (Housing finance depth*Conflictdummy t-1); Hfinwealth (Housing finance
depth*Wealth-dummy: wealth based decomposition); Hfinlegal (Housing finance depth*Legal-dummy: legal based decomposition); Hfinsahel
(Housing finance depth*Sahel-dummy: Sahel based decomposition). *,**,***: significance levels of 10%, 5% and 1% respectively. Values in bracket are standard errors.
Concerning the housing finance depth impact, the non-significance of the impact has allowed us to verify
the threshold effect. Our verification (in the table above and annexed) was conclusive since a higher value
(squared values) of housing finance depth becomes now negatively and significantly correlated to
inequality. However a very higher value (exponential value) presents a non-significant result again. These
results confirm the fact that there is a threshold effect; indeed higher values of housing finance depth until
a certain threshold is conclusive in terms of reducing inequality while lower and very high values have a
non-significant impact. Well-developed housing finance system is therefore associated with inequality
reduction. Following this findings, we can relatively recommend the development of housing finance
system in African countries.
Turning to the control variables, the results are mostly in line with expectations. There is a strong negative
but non-significant relationship between inflation and incomes per capita on inequality; and a significant
negative impact of human capital on inequality suggesting that higher levels of economic development
and human capital are associated with lower levels of inequality. Additionally, the governance level
indexed by political stability appears to reduce inequality. These results are in line with the theoretical and
empirical literature which assumes that investing in human and physical capital is good instrument to
target inequality reduction.
However, conflict_dummy is bad for inequality reduction objective, since their coefficients are positive
and significant. These last results suggest that the previous result of positive impact of conflict_dummy on
housing finance development should be mitigated; even if conflicted countries are more close to deepen
their post-conflict housing finance system, this situation is more useful to a range of the population and
then help to foster the inequality. Indeed it is easily understandable that after conflict, it is usually wealthy
people which are more active to housing finance dynamics than the poor.
Our composite variables are non-significant; however all of them present the expected theoretical negative
sign excluding housing finance depth combined with a conflict_dummy. Housing finance depth becomes
bad for inequality reduction in a post-conflicted country. The reason could be the same as highlighted
above since there is unequal opportunity and repartition of revenue which allow mostly the wealthy
peoples than poor peoples into the market. Housing finance depth capacity to reduce inequality is
multiplied when it is combined respectively with voice accountability and wealth, legal and Sahel
dummies. Our previous decomposition is therefore relevant in the analysis of the housing finance capacity
to reduce inequality.
20
Impact of Housing finance on inclusive growth
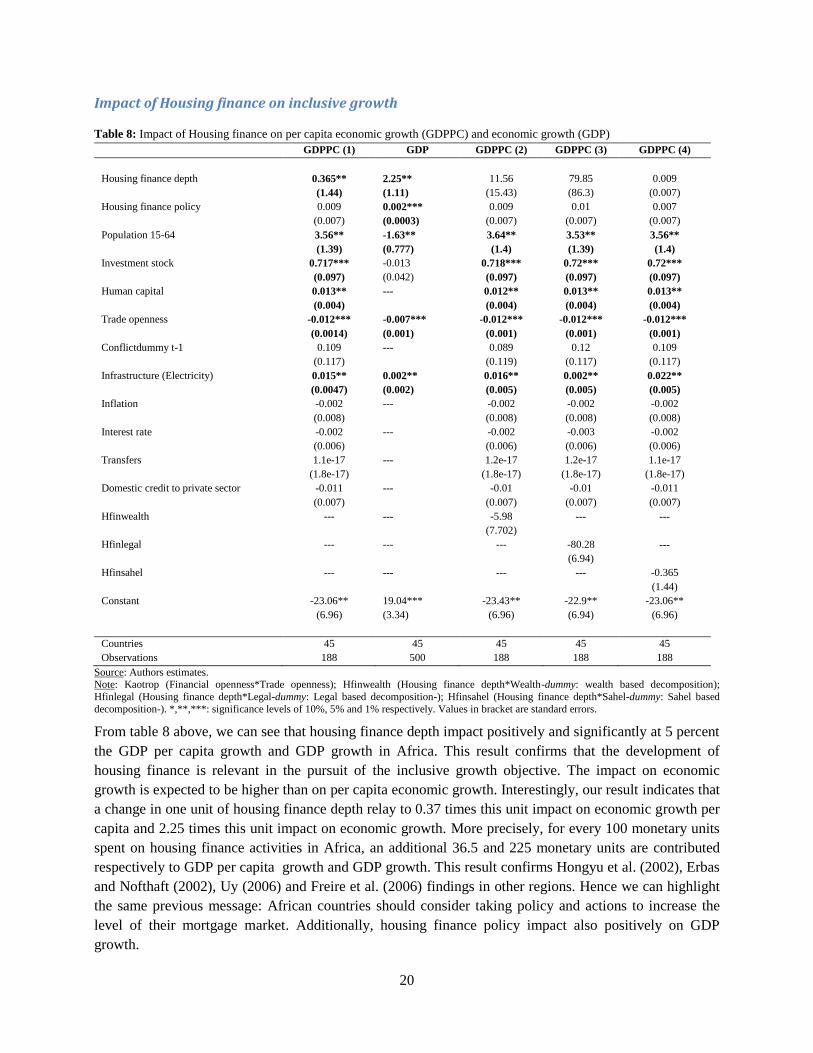
Table 8: Impact of Housing finance on per capita economic growth (GDPPC) and economic growth (GDP) GDPPC (1) GDP GDPPC (2) GDPPC (3) GDPPC (4)
Housing finance depth 0.365** 2.25** 11.56 79.85 0.009
(1.44) (1.11) (15.43) (86.3) (0.007)
Housing finance policy 0.009 0.002*** 0.009 0.01 0.007
(0.007) (0.0003) (0.007) (0.007) (0.007)
Population 15-64 3.56** -1.63** 3.64** 3.53** 3.56**
(1.39) (0.777) (1.4) (1.39) (1.4)
Investment stock 0.717*** -0.013 0.718*** 0.72*** 0.72***
(0.097) (0.042) (0.097) (0.097) (0.097)
Human capital 0.013** --- 0.012** 0.013** 0.013**
(0.004) (0.004) (0.004) (0.004)
Trade openness -0.012*** -0.007*** -0.012*** -0.012*** -0.012***
(0.0014) (0.001) (0.001) (0.001) (0.001)
Conflictdummy t-1 0.109 --- 0.089 0.12 0.109
(0.117) (0.119) (0.117) (0.117)
Infrastructure (Electricity) 0.015** 0.002** 0.016** 0.002** 0.022**
(0.0047) (0.002) (0.005) (0.005) (0.005)
Inflation -0.002 --- -0.002 -0.002 -0.002
(0.008) (0.008) (0.008) (0.008)
Interest rate -0.002 --- -0.002 -0.003 -0.002
(0.006) (0.006) (0.006) (0.006)
Transfers 1.1e-17 --- 1.2e-17 1.2e-17 1.1e-17
(1.8e-17) (1.8e-17) (1.8e-17) (1.8e-17)
Domestic credit to private sector -0.011 --- -0.01 -0.01 -0.011
(0.007) (0.007) (0.007) (0.007)
Hfinwealth --- --- -5.98 --- ---
(7.702)
Hfinlegal --- --- --- -80.28 ---
(6.94)
Hfinsahel --- --- --- --- -0.365
(1.44)
Constant -23.06** 19.04*** -23.43** -22.9** -23.06**
(6.96) (3.34) (6.96) (6.94) (6.96)
Countries 45 45 45 45 45
Observations 188 500 188 188 188
Source: Authors estimates. Note: Kaotrop (Financial openness*Trade openness); Hfinwealth (Housing finance depth*Wealth-dummy: wealth based decomposition);
Hfinlegal (Housing finance depth*Legal-dummy: Legal based decomposition-); Hfinsahel (Housing finance depth*Sahel-dummy: Sahel based
decomposition-). *,**,***: significance levels of 10%, 5% and 1% respectively. Values in bracket are standard errors.
From table 8 above, we can see that housing finance depth impact positively and significantly at 5 percent
the GDP per capita growth and GDP growth in Africa. This result confirms that the development of
housing finance is relevant in the pursuit of the inclusive growth objective. The impact on economic
growth is expected to be higher than on per capita economic growth. Interestingly, our result indicates that
a change in one unit of housing finance depth relay to 0.37 times this unit impact on economic growth per
capita and 2.25 times this unit impact on economic growth. More precisely, for every 100 monetary units
spent on housing finance activities in Africa, an additional 36.5 and 225 monetary units are contributed
respectively to GDP per capita growth and GDP growth. This result confirms Hongyu et al. (2002), Erbas
and Nofthaft (2002), Uy (2006) and Freire et al. (2006) findings in other regions. Hence we can highlight
the same previous message: African countries should consider taking policy and actions to increase the
level of their mortgage market. Additionally, housing finance policy impact also positively on GDP
growth.
21
In addition, working population (indexed by 15-64 year range of population), investment stock, human
capital and infrastructure are determinants of inclusive growth in Africa. These results are also in line with
previous literature on the subject. However, trade openness is negatively and significantly related to GDP
growth and GDP per capita growth. We can attribute these contradictory results to the proxy used to index
these variables.
The composite variables are all non-significant and are associated to a negative sign; without combining
them, we still have the same non-significant result. We are able then to conclude that our decomposition is
relevant but in the wrong way in terms of housing finance development impact on per capita economic
growth. The variable housing finance policy, transfers and conflict_dummy present the positive sign
predicted by the theory while the variables inflation, interest rate and domestic credit to private sector
present negative sign on the contrary of the theoretical predictions; the non-significance of these results
allows us not to go further in the explanation.
4.4. Robustness check
In order to make sure that our results are robust, we implemented additional estimations changing some
variables by their proxy, changing the specification and changing estimation method. By changing the
specification, we were guided by the maximization of the number of observation relative to the one of the
principal estimation. As we can see in annexed tables, our results are conclusive since we have the same
sign and signification variable as in the principal results discussed. By changing some variables with their
proxy, we were able to verify whether we have the same result independently to the fact that we use
different measure for the same variable. By changing estimation method from FGLS to GMM, we verify
the robustness of our main results. In addition, we used alternative measures of growth (GDP per capita
growth and GDP growth) and housing finance (Mortgage depth and Mortgage penetration) to verify the
quality of our results.
Table A4, A5, andA6 present results of our robustness check regression. The results are overall conclusive;
however by confronting table A4 in annex to previous table 6, the interpretation of conflict_dummy impact
should be relativized since its navigate between positive, negative or significant impact when we change
the housing finance index. So, the previous results of positive impact of conflict_dummy are plausible only
for housing finance depth and not housing finance penetration. Another difference to be highlighted is that
our combined variable become positively and significantly related to housing finance when the proxy is
housing finance penetration; we can therefore confirm that there is a little relative difference depending on
the variable we use to index housing finance even if results remain mostly similar, hence robust. The rest
of the variables remain with the same sign and significance independently of the change of housing
finance development proxy and the estimation method.
Comparing table A5 in annex to previous table 8, we see that by changing specification and dependent
variable, our results remain globally unchanged. However, labor becomes not significant. Additionally,
trade openness is negatively related to economic growth when we use FGLS estimation technic; however,
when we use GMM estimation method, trade openness impact positively and significantly economic
growth. Since results of economic growth are in its major part similar to the one of inclusive growth
equation, we can confirm the robustness of the impact of housing finance development on inclusive
growth.

22
Comparing table A6 in annex to table 7, results remain the same independently of the estimation method.
However, governance indexed by political stability present now alternative positive and negative
significant impact on inequality.
VI. Conclusion and policy implication
This paper uses a new database on mortgage depth and penetration across countries and panel data
econometric technics to investigate housing finance determinants and the potential of housing finance to
contribute to inclusive growth in Africa.
The paper starts by using a benchmarking exercise with a decomposition approach to describe and present
the typology of housing finance system in Africa. Mainly, the statistical analysis revealed that housing
finance performance are significantly different based on country characteristics decomposition;
additionally our explanatory analysis highlighted the fact that housing finance systems in Africa are
generally nascent and more bank-based than market-based.
Following these results, the paper undertook an econometric analysis which yields the following key
findings. Concerning Housing finance determinants, we found that the stock market capitalization and
urban growth are the main determinants of housing finance development in Africa. Housing finance policy
and human capital appears to be the main factor of inequality reduction. Finally, as determinant of
inclusive growth, we have detected housing finance depth, 15-64 age population, investment stock, and
human capital.
Overall, African governments in their pursuit of good performance in terms of inequality reduction and
inclusive growth should implement policy for housing finance market development. To develop their
mortgage market, this study suggests that they should focus on market capitalization and urban population
growth.
23
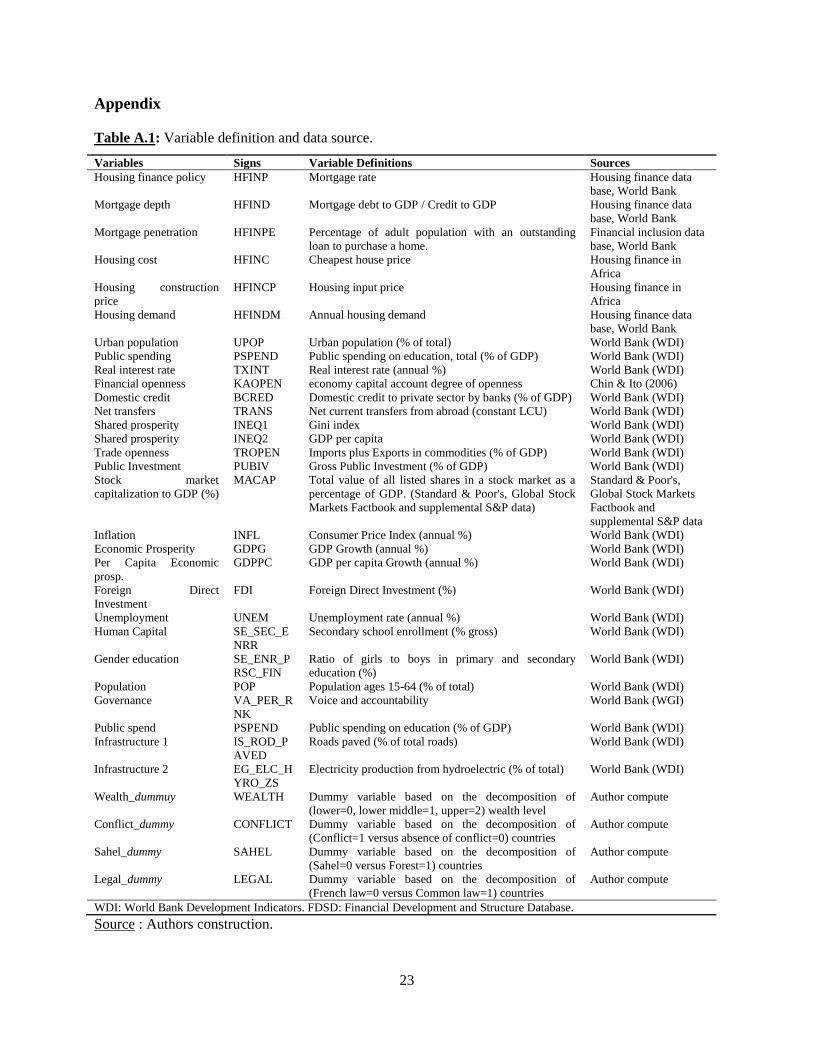
Appendix Table A.1: Variable definition and data source.
Variables Signs Variable Definitions Sources
Housing finance policy HFINP Mortgage rate Housing finance data
base, World Bank
Mortgage depth HFIND Mortgage debt to GDP / Credit to GDP Housing finance data
base, World Bank
Mortgage penetration HFINPE Percentage of adult population with an outstanding
loan to purchase a home.
Financial inclusion data
base, World Bank
Housing cost HFINC Cheapest house price Housing finance in
Africa
Housing construction
price
HFINCP Housing input price Housing finance in
Africa
Housing demand HFINDM Annual housing demand Housing finance data
base, World Bank
Urban population UPOP Urban population (% of total) World Bank (WDI)
Public spending PSPEND Public spending on education, total (% of GDP) World Bank (WDI)
Real interest rate TXINT Real interest rate (annual %) World Bank (WDI)
Financial openness KAOPEN economy capital account degree of openness Chin & Ito (2006)
Domestic credit BCRED Domestic credit to private sector by banks (% of GDP) World Bank (WDI)
Net transfers TRANS Net current transfers from abroad (constant LCU) World Bank (WDI)
Shared prosperity INEQ1 Gini index World Bank (WDI)
Shared prosperity INEQ2 GDP per capita World Bank (WDI)
Trade openness TROPEN Imports plus Exports in commodities (% of GDP) World Bank (WDI)
Public Investment PUBIV Gross Public Investment (% of GDP) World Bank (WDI)
Stock market
capitalization to GDP (%)
MACAP Total value of all listed shares in a stock market as a
percentage of GDP. (Standard & Poor's, Global Stock
Markets Factbook and supplemental S&P data)
Standard & Poor's,
Global Stock Markets
Factbook and
supplemental S&P data
Inflation INFL Consumer Price Index (annual %) World Bank (WDI)
Economic Prosperity GDPG GDP Growth (annual %) World Bank (WDI)
Per Capita Economic
prosp.
GDPPC GDP per capita Growth (annual %) World Bank (WDI)
Foreign Direct
Investment
FDI Foreign Direct Investment (%) World Bank (WDI)
Unemployment UNEM Unemployment rate (annual %) World Bank (WDI)
Human Capital SE_SEC_E
NRR
Secondary school enrollment (% gross) World Bank (WDI)
Gender education SE_ENR_P
RSC_FIN
Ratio of girls to boys in primary and secondary
education (%)
World Bank (WDI)
Population POP Population ages 15-64 (% of total) World Bank (WDI)
Governance VA_PER_R
NK
Voice and accountability World Bank (WGI)
Public spend PSPEND Public spending on education (% of GDP) World Bank (WDI)
Infrastructure 1 IS_ROD_P
AVED
Roads paved (% of total roads) World Bank (WDI)
Infrastructure 2 EG_ELC_H
YRO_ZS
Electricity production from hydroelectric (% of total)
World Bank (WDI)
Wealth_dummuy WEALTH Dummy variable based on the decomposition of
(lower=0, lower middle=1, upper=2) wealth level
Author compute
Conflict_dummy CONFLICT Dummy variable based on the decomposition of
(Conflict=1 versus absence of conflict=0) countries
Author compute
Sahel_dummy SAHEL Dummy variable based on the decomposition of
(Sahel=0 versus Forest=1) countries
Author compute
Legal_dummy LEGAL Dummy variable based on the decomposition of
(French law=0 versus Common law=1) countries
Author compute
WDI: World Bank Development Indicators. FDSD: Financial Development and Structure Database.
Source : Authors construction.

24
Table A.2: Mortgage depth data sources
Country Region No. of Obs Period Source
Botswana Sub-Saharan Africa 1 2009-2009 Other
Burkina Faso Sub-Saharan Africa 5 2006-2010 Central Bank
Burundi Sub-Saharan Africa 5 2007-2011 Central Bank of Burundi
Cameroon Sub-Saharan Africa 1 2005-2005 Other
Central African Republic Sub-Saharan Africa 1 2005-2005 Other
Chad Sub-Saharan Africa 1 2005-2005 Other
Congo, Rep. Sub-Saharan Africa 1 2005-2005 Other
Gabon Sub-Saharan Africa 1 2005-2005 Other
Ghana Sub-Saharan Africa 2 2006-2008 Other
Guinea Sub-Saharan Africa 1 2005-2005 Other
Kenya Sub-Saharan Africa 5 2006-2010 Other
Malawi Sub-Saharan Africa 2 2006-2007 Central Bank
Namibia Sub-Saharan Africa 1 2011-2011 Hofinet
Nigeria Sub-Saharan Africa 2 2006-2008 Other
Senegal Sub-Saharan Africa 1 2004-2004 Other
South Africa Sub-Saharan Africa 12 2000-2011 South African Reserve Bank
Tanzania Sub-Saharan Africa 1 2009-2009 World Bank Mission April 2009
Togo Sub-Saharan Africa 5 2006-2010 Other
Uganda Sub-Saharan Africa 2 2010-2011 Central Bank
Source: Authors construction based on Badev et al. (2014) database on housing finance.
Table A.3: Housing Loan Penetration by country (2011)
Country % Country % Country %
Angola 4.3 Rwanda 2.1 Kenya 1.2
Burundi 0.1 Sudan 6.4 Liberia 3.6
Benin 0.6 Senegal 0.1 Lesotho 0.8
Burkina Faso 0.7 Sierra Leone 0.5 Madagascar 0.6
Botswana 1.8 Somalia 6.9 Mali 0.8
Central African Republic 1.1 Chad 6.3 Mozambique 1.1
Cameroon 1.7 Togo 2.3 Mauritania 6.1
Congo, Rep. 0.3 Tanzania 5.4 Mauritius 5.7
Comoros 0.7 Uganda 1.2 Malawi 6.5
Djibouti 6.3 South Africa 5.4 Niger 1.0
Gabon 0.6 Congo, Dem. Rep. 0.7 Nigeria 0.3
Ghana 2.8 Zambia 1.8
Guinea 0.2 Zimbabwe 1.3
Source: Authors construction based on Badev et al. (2014) database on housing finance.

25
Table A.4: Housing finance determinants (Sensitivity and robustness check) Model A2: Housing finance determinants (Sensitivity and robustness check)
FGLS GMM
HFD HFP HFP HFP HFP HFD
Housing finance depth L1 --- --- --- --- 1.02* 0.131
(0.045) (0.086)
Market capitalization 0.001*** 0.03** 0.03*** 0.02 0.001*** 0.001***
(0.00003) (0.012) (0.013) (0.12) (0.00005) (0.0001)
Urban population growth 0.00008* -0.06* 0.06** -0.03* 0.0002** 0.001
(0.0005) (0.022) (0.023) (0.022) (0.00008) (0.002)
Conflictdummy t-1
0.004* -2.28* -3.42** -2.2* --- ---
(0.002) (1.12) (1.23) (1.15)
Investment stock 0.00009 1.22** 0.59 1.11** -0.002 -0.00003
(0.001) (0.479) (0.53) (0.504) (0.002) (0.01)
GDP per capita -1.0003*** -1.58*** -2.1*** -2.3*** 0.0003 0.0002
(0.002) (0.482) (0.51) (0.512) (0.002) (0.002)
GDP growth 2.15*** 2.37*** 2.18*** 2.5*** 0.0001 0.0001
(0.002) (0.459) (0.485) (0.487) (0.002) (0.002)
Political stability 0.08*** 0.1*** 0.1** 0.1*** 0.00001 -0.0001
(0.023) (0.025) (0.026) (0.026) (0.0001) (0.0004)
Domestic credit to private sector --- -0.035 -0.06* -0.035 -0.0002 0.0001
(0.028) (0.029) (0.028) (0.0001) (0.0006)
Trade openness --- -0.006 -0.01 -0.006 -0.00003 -0.00004
(0.01) (0.01) (0.01) (0.00003) (0.0001)
Inflation --- 0.19** 0.16** 0.18** -0.00001 0.0001
(0.06) (0.06) (0.063) (0.0002) (0.0003)
Interest rate --- 0.28*** 0.267*** 0.28*** 0.0001 0.0001
(0.04) (0.04) (0.04) (0.0001) (0.0003)
Transfers 9.1e-20 3.02e-17 2.14e-17 3e-17 4.9e-20 -5.4e-21
(9.8e-20) (3.4e-17) (3.33e-17) (3.4e-17) (1.1e-19) (1.3e-19)
Kaolegal --- 0.86** --- --- --- ---
(0.33)
Kaosahel --- --- 0.962** --- --- ---
(0.292)
Kaowealth --- --- --- 0.16 --- ---
(0.266)
Constant -0.105 -28.4** -0.913 -26.15* --- ---
(0.04) (14.9) (16.84) (15.41)
Auto na Na Na Na -1.06 -1.089
(0.255) (0.276)
Sargan OIR na Na Na Na 2.052 1.682
(0.307) (0.794)
Wald na Na na Na 12.48* 70.374***
(0.067) (0.000)
Countries 45 45 45 45 45 45
Observations 401 252 252 252 223 206
Source: Estimation result observation by the authors.
Note: HFD (Housing finance depth); HFP (Housing finance penetration); Kaolegal (Financial openness*Legal-dummy: Legal based
decomposition-); Kaosahel (Financial openness*Sahel-dummy: Sahel based decomposition-); Kaowealth (Financial openness*Wealth-dummy:
wealth based decomposition-); Kaotrop (Financial openness*Trade openness-); Kaomac (Financial openness*Market capitalization); Kaofbcf
(Financial openness*Investment stock). *,**,***: significance levels of 10%, 5% and 1% respectively. Values in bracket are standard errors.
Auto: Autocorrelation test. OIR: Overidentifying Restrictions test. The significance of bold values is twofold. 1) The significance of estimated
coefficients and the Wald statistics. 2) The failure to reject the null hypotheses of: a) no autocorrelation in the Auto tests and; b) the validity of the
instruments in the Sargan OIR test. P-values in brackets. AR(1): First Order Autoregression. AR(2): Second Order Autoregression.
Autoregression is on the Return variables.
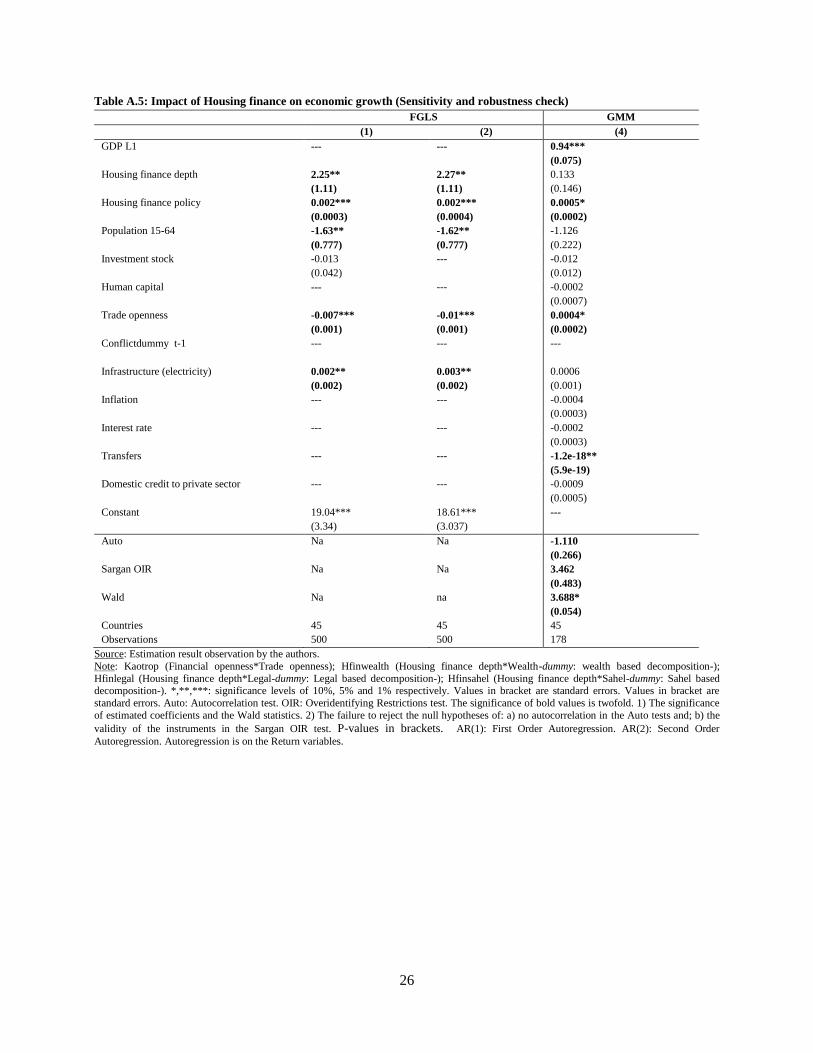
26
Table A.5: Impact of Housing finance on economic growth (Sensitivity and robustness check) FGLS GMM
(1) (2) (4)
GDP L1 --- --- 0.94***
(0.075)
Housing finance depth 2.25** 2.27** 0.133
(1.11) (1.11) (0.146)
Housing finance policy 0.002*** 0.002*** 0.0005*
(0.0003) (0.0004) (0.0002)
Population 15-64 -1.63** -1.62** -1.126
(0.777) (0.777) (0.222)
Investment stock -0.013 --- -0.012
(0.042) (0.012)
Human capital --- --- -0.0002
(0.0007)
Trade openness -0.007*** -0.01*** 0.0004*
(0.001) (0.001) (0.0002)
Conflictdummy t-1 --- --- ---
Infrastructure (electricity) 0.002** 0.003** 0.0006
(0.002) (0.002) (0.001)
Inflation --- --- -0.0004
(0.0003)
Interest rate --- --- -0.0002
(0.0003)
Transfers --- --- -1.2e-18**
(5.9e-19)
Domestic credit to private sector --- --- -0.0009
(0.0005)
Constant 19.04*** 18.61*** ---
(3.34) (3.037)
Auto Na Na -1.110
(0.266)
Sargan OIR Na Na 3.462
(0.483)
Wald Na na 3.688*
(0.054)
Countries 45 45 45
Observations 500 500 178
Source: Estimation result observation by the authors.
Note: Kaotrop (Financial openness*Trade openness); Hfinwealth (Housing finance depth*Wealth-dummy: wealth based decomposition-);
Hfinlegal (Housing finance depth*Legal-dummy: Legal based decomposition-); Hfinsahel (Housing finance depth*Sahel-dummy: Sahel based
decomposition-). *,**,***: significance levels of 10%, 5% and 1% respectively. Values in bracket are standard errors. Values in bracket are
standard errors. Auto: Autocorrelation test. OIR: Overidentifying Restrictions test. The significance of bold values is twofold. 1) The significance
of estimated coefficients and the Wald statistics. 2) The failure to reject the null hypotheses of: a) no autocorrelation in the Auto tests and; b) the
validity of the instruments in the Sargan OIR test. P-values in brackets. AR(1): First Order Autoregression. AR(2): Second Order
Autoregression. Autoregression is on the Return variables.
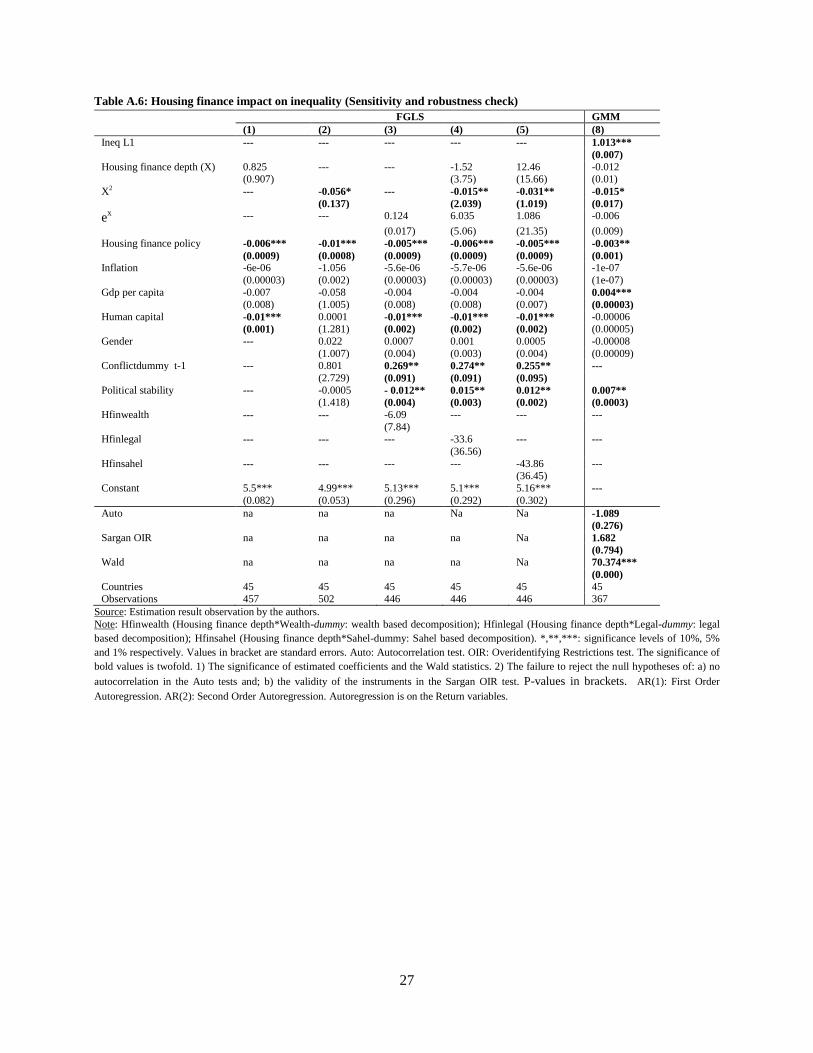
27
Table A.6: Housing finance impact on inequality (Sensitivity and robustness check) FGLS GMM
(1) (2) (3) (4) (5) (8)
Ineq L1 --- --- --- --- --- 1.013***
(0.007)
Housing finance depth (X) 0.825 --- --- -1.52 12.46 -0.012
(0.907) (3.75) (15.66) (0.01)
X2 --- -0.056* --- -0.015** -0.031** -0.015*
(0.137) (2.039) (1.019) (0.017)
ex --- --- 0.124 6.035 1.086 -0.006
(0.017) (5.06) (21.35) (0.009)
Housing finance policy -0.006*** -0.01*** -0.005*** -0.006*** -0.005*** -0.003**
(0.0009) (0.0008) (0.0009) (0.0009) (0.0009) (0.001)
Inflation -6e-06 -1.056 -5.6e-06 -5.7e-06 -5.6e-06 -1e-07
(0.00003) (0.002) (0.00003) (0.00003) (0.00003) (1e-07)
Gdp per capita -0.007 -0.058 -0.004 -0.004 -0.004 0.004***
(0.008) (1.005) (0.008) (0.008) (0.007) (0.00003)
Human capital -0.01*** 0.0001 -0.01*** -0.01*** -0.01*** -0.00006 (0.001) (1.281) (0.002) (0.002) (0.002) (0.00005)
Gender --- 0.022 0.0007 0.001 0.0005 -0.00008
(1.007) (0.004) (0.003) (0.004) (0.00009) Conflictdummy t-1 --- 0.801 0.269** 0.274** 0.255** ---
(2.729) (0.091) (0.091) (0.095)
Political stability --- -0.0005 - 0.012** 0.015** 0.012** 0.007**
(1.418) (0.004) (0.003) (0.002) (0.0003)
Hfinwealth --- --- -6.09 --- --- ---
(7.84) Hfinlegal --- --- --- -33.6 --- ---
(36.56)
Hfinsahel --- --- --- --- -43.86 --- (36.45)
Constant 5.5*** 4.99*** 5.13*** 5.1*** 5.16*** ---
(0.082) (0.053) (0.296) (0.292) (0.302)
Auto na na na Na Na -1.089
(0.276)
Sargan OIR na na na na Na 1.682
(0.794)
Wald na na na na Na 70.374***
(0.000)
Countries 45 45 45 45 45 45 Observations 457 502 446 446 446 367
Source: Estimation result observation by the authors.
Note: Hfinwealth (Housing finance depth*Wealth-dummy: wealth based decomposition); Hfinlegal (Housing finance depth*Legal-dummy: legal
based decomposition); Hfinsahel (Housing finance depth*Sahel-dummy: Sahel based decomposition). *,**,***: significance levels of 10%, 5%
and 1% respectively. Values in bracket are standard errors. Auto: Autocorrelation test. OIR: Overidentifying Restrictions test. The significance of
bold values is twofold. 1) The significance of estimated coefficients and the Wald statistics. 2) The failure to reject the null hypotheses of: a) no
autocorrelation in the Auto tests and; b) the validity of the instruments in the Sargan OIR test. P-values in brackets. AR(1): First Order
Autoregression. AR(2): Second Order Autoregression. Autoregression is on the Return variables.
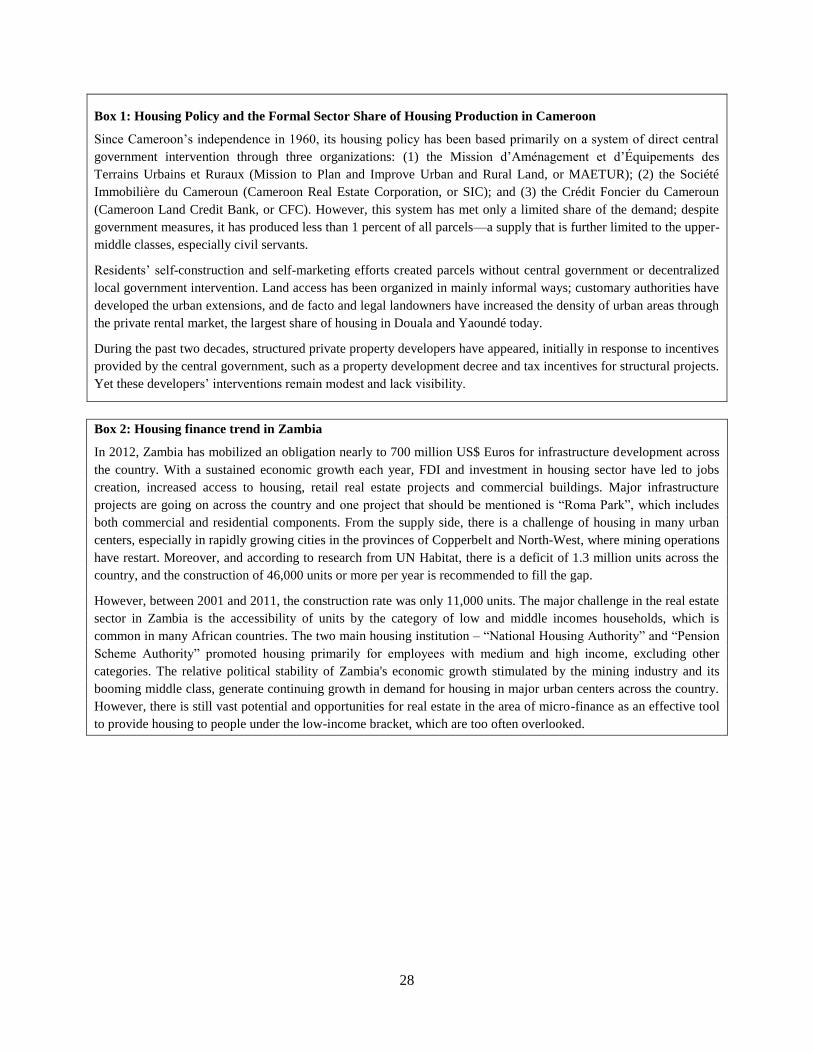
28
Box 1: Housing Policy and the Formal Sector Share of Housing Production in Cameroon
Since Cameroon’s independence in 1960, its housing policy has been based primarily on a system of direct central
government intervention through three organizations: (1) the Mission d’Aménagement et d’Équipements des
Terrains Urbains et Ruraux (Mission to Plan and Improve Urban and Rural Land, or MAETUR); (2) the Société
Immobilière du Cameroun (Cameroon Real Estate Corporation, or SIC); and (3) the Crédit Foncier du Cameroun
(Cameroon Land Credit Bank, or CFC). However, this system has met only a limited share of the demand; despite
government measures, it has produced less than 1 percent of all parcels—a supply that is further limited to the upper-
middle classes, especially civil servants.
Residents’ self-construction and self-marketing efforts created parcels without central government or decentralized
local government intervention. Land access has been organized in mainly informal ways; customary authorities have
developed the urban extensions, and de facto and legal landowners have increased the density of urban areas through
the private rental market, the largest share of housing in Douala and Yaoundé today.
During the past two decades, structured private property developers have appeared, initially in response to incentives
provided by the central government, such as a property development decree and tax incentives for structural projects.
Yet these developers’ interventions remain modest and lack visibility.
Box 2: Housing finance trend in Zambia
In 2012, Zambia has mobilized an obligation nearly to 700 million US$ Euros for infrastructure development across
the country. With a sustained economic growth each year, FDI and investment in housing sector have led to jobs
creation, increased access to housing, retail real estate projects and commercial buildings. Major infrastructure
projects are going on across the country and one project that should be mentioned is ―Roma Park‖, which includes
both commercial and residential components. From the supply side, there is a challenge of housing in many urban
centers, especially in rapidly growing cities in the provinces of Copperbelt and North-West, where mining operations
have restart. Moreover, and according to research from UN Habitat, there is a deficit of 1.3 million units across the
country, and the construction of 46,000 units or more per year is recommended to fill the gap.
However, between 2001 and 2011, the construction rate was only 11,000 units. The major challenge in the real estate
sector in Zambia is the accessibility of units by the category of low and middle incomes households, which is
common in many African countries. The two main housing institution – ―National Housing Authority‖ and ―Pension
Scheme Authority‖ promoted housing primarily for employees with medium and high income, excluding other
categories. The relative political stability of Zambia's economic growth stimulated by the mining industry and its
booming middle class, generate continuing growth in demand for housing in major urban centers across the country.
However, there is still vast potential and opportunities for real estate in the area of micro-finance as an effective tool
to provide housing to people under the low-income bracket, which are too often overlooked.
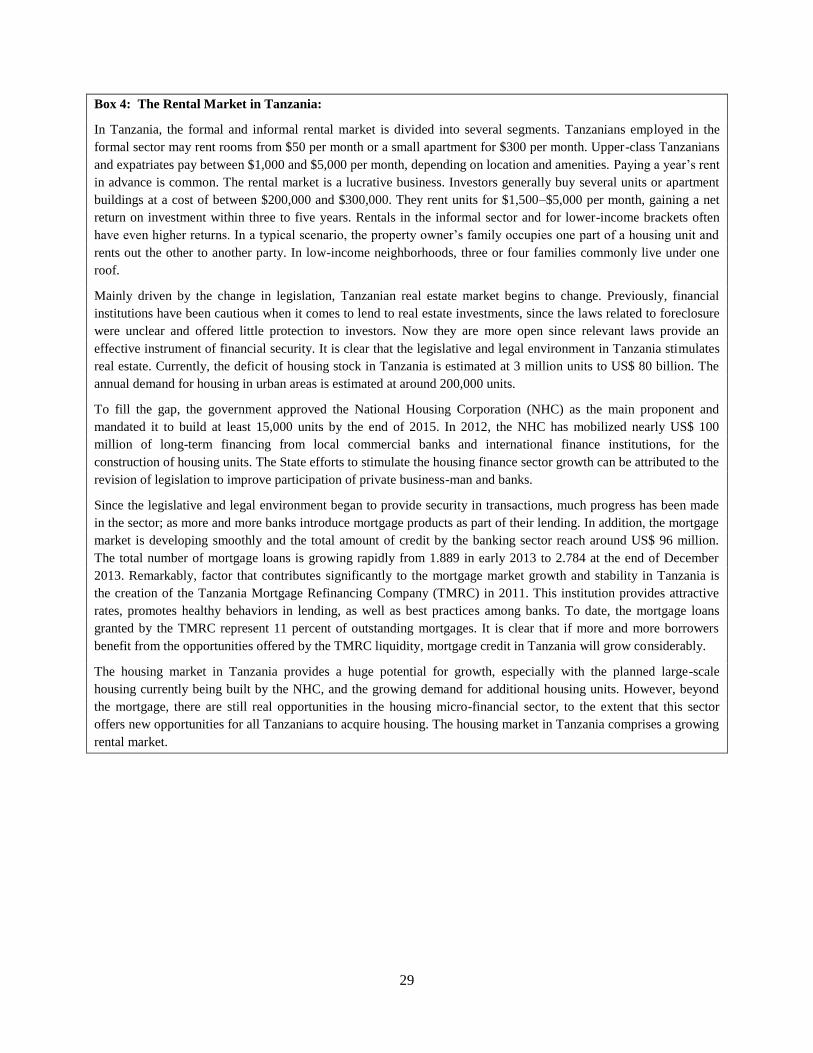
29
Box 4: The Rental Market in Tanzania:
In Tanzania, the formal and informal rental market is divided into several segments. Tanzanians employed in the
formal sector may rent rooms from $50 per month or a small apartment for $300 per month. Upper-class Tanzanians
and expatriates pay between $1,000 and $5,000 per month, depending on location and amenities. Paying a year’s rent
in advance is common. The rental market is a lucrative business. Investors generally buy several units or apartment
buildings at a cost of between $200,000 and $300,000. They rent units for $1,500–$5,000 per month, gaining a net
return on investment within three to five years. Rentals in the informal sector and for lower-income brackets often
have even higher returns. In a typical scenario, the property owner’s family occupies one part of a housing unit and
rents out the other to another party. In low-income neighborhoods, three or four families commonly live under one
roof.
Mainly driven by the change in legislation, Tanzanian real estate market begins to change. Previously, financial
institutions have been cautious when it comes to lend to real estate investments, since the laws related to foreclosure
were unclear and offered little protection to investors. Now they are more open since relevant laws provide an
effective instrument of financial security. It is clear that the legislative and legal environment in Tanzania stimulates
real estate. Currently, the deficit of housing stock in Tanzania is estimated at 3 million units to US$ 80 billion. The
annual demand for housing in urban areas is estimated at around 200,000 units.
To fill the gap, the government approved the National Housing Corporation (NHC) as the main proponent and
mandated it to build at least 15,000 units by the end of 2015. In 2012, the NHC has mobilized nearly US$ 100
million of long-term financing from local commercial banks and international finance institutions, for the
construction of housing units. The State efforts to stimulate the housing finance sector growth can be attributed to the
revision of legislation to improve participation of private business-man and banks.
Since the legislative and legal environment began to provide security in transactions, much progress has been made
in the sector; as more and more banks introduce mortgage products as part of their lending. In addition, the mortgage
market is developing smoothly and the total amount of credit by the banking sector reach around US$ 96 million.
The total number of mortgage loans is growing rapidly from 1.889 in early 2013 to 2.784 at the end of December
2013. Remarkably, factor that contributes significantly to the mortgage market growth and stability in Tanzania is
the creation of the Tanzania Mortgage Refinancing Company (TMRC) in 2011. This institution provides attractive
rates, promotes healthy behaviors in lending, as well as best practices among banks. To date, the mortgage loans
granted by the TMRC represent 11 percent of outstanding mortgages. It is clear that if more and more borrowers
benefit from the opportunities offered by the TMRC liquidity, mortgage credit in Tanzania will grow considerably.
The housing market in Tanzania provides a huge potential for growth, especially with the planned large-scale
housing currently being built by the NHC, and the growing demand for additional housing units. However, beyond
the mortgage, there are still real opportunities in the housing micro-financial sector, to the extent that this sector
offers new opportunities for all Tanzanians to acquire housing. The housing market in Tanzania comprises a growing
rental market.
30
Reference
Acemoglu, D. 2009, Introduction to Modern Economic Growth. Princeton University
Arellano, M., & Bond, S., (1991). ―Some tests of specification for panel data: Monte Carlo evidence and
an application to employment equations‖, The Review of Economic Studies, 58, pp. 277-297.
Atkinson, A. B., (1975), ―The Economics of Inequality‖ (Oxford: Clarendon Press).
Badev, Anton, Beck, Thorsten, Vado, Ligia and Simon Walley, 2014, ―Housing Finance Across Countries:
New Data and Analysis‖, World Bank.
Beck, Thorsten, Demirgüç-Kunt, Aslı, and Ross Levine, (2004), ―Finance, Inequality, and Poverty: Cross-
Country Evidence‖. NBER Working Paper No. 10979. Issued in December 2004.
Beck, Thorsten, Samuel Munzele Maimbo, Issa Faye, and Thouraya Triki. 2011. Financing Africa:
Through the Crisis and Beyond, World Bank, Washington, DC.
Becker, G. S., (1975), ―Human Capital‖, NBER and Columbia University Press, New York.
Besley T, Coate S, Lowry G. (1992). ―The economics of RoSCAs‖. Centre for International Studies,
Discussion Paper No. 149. Princeton University, NJ.
Blundell, R., & Bond, S., (1998). ―Initial conditions and moment restrictions in dynamic panel data
models‖, Journal of Econometrics, 87(1), pp.115-143.
Bond, S., Hoeffler, A., & Tample, J., (2001). ―GMM Estimation of Empirical Growth Models‖, University
of Oxford.
Buckley, R. and R. Madhusudhan, (1984), ―The Macroeconomics of Housing’s Role in the Economy: An
International Analysis‖, Presented to the American Real Estate and Urban Economics Association.
Buckley, Robert, (1996), ―Housing Finance in Developing Countries‖, (McMillan, London).
Chen, J. and A. Zhu, (2008), ―The Relationship Between Housing Investment and Economic Growth in
China: A Panel Analysis Using Quarterly Provincial Data‖, China National Social Science
Foundation Working Paper.
Christiansen et al. (2013), « Urbanization and poverty reduction-The role of rural diversification and
secondary towns », Policy Research Working Paper 6422;
Davis, M. A. and S. V. Nieuwerburgh, (2014), ―Housing, Finance and the Macroeconomy‖. NBER
Working Paper No. 20287. Issued in July 2014.
Dehesa, M. et al. (2007), ―Relative Price Stability, Creditor Rights, and Financial Deepening‖, IMF
Working paper, WP/07/139.
D bel, Hans-Joachim, (2007), ―Does Housing Finance Promote Economic and Social Development in
Emerging Markets?‖, Housing Finance Impact Study for International Finance Corporation.
Econsult Corporation, (2009), ―Potential Economic and Fiscal Impacts of a Pennsylvania Housing Trust
Fund‖, The Housing Alliance of Pennsylvania.
Egert, B. & Mihaljek, D., (2007). "Determinants of House Prices in Central and Eastern
Europe," Comparative Economic Studies, Palgrave Macmillan, vol. 49(3), pages 367-388,
September.
Erbas, S. and F. Nothaft, (2002), ―The Role of Affordable Mortgages in Improving Living Standards and
Stimulating Growth: A Survey of Selected MENA Countries‖, IMF Working Paper.

31
Fox and Sohnesen (2012), ―Household enterprises in Sub-saharan Africa – Why the =y matter for growth,
jobs and livelihoods‖. World Bank Policy Research Working Paper;
Freire, Mila, M. Gautier and O. Hassler, (2006), ―Review of Argentina’s Housing Sector: Options for
Affordable Housing Policy‖, World Bank Working Paper.
Guitierrez, C., et. al., (2007), ―Does Employment Generation Really Matter for Poverty Reduction?‖,
World Bank Policy Research Working Paper No. 4432,
Haibin Zhu, (2006), ―The structure of housing finance markets and house prices in Asia‖; BIS Quarterly
Review, December 2006
Hangen, Eric, and J. Northrup, (2010), ―Building Homes Rhode Island: An Analysis of Economic
Impacts‖, Housing Works RI.
Hongyu, Liu, Y. Park and Z. Siqi, (2002), ―The Interaction between Housing Investment and Economic
Growth in China‖, International Real Estate Review, 5: 1, p. 40 – 60.
Jacoby, Hanan and E. Skoufias, (1997), ―Risk, Financial Markets, and Human Capital‖, Review of
Economic Studies, Vol 64, 311-335.
Jacoby, Hanan, (1994), ―Borrowing Constraints and Progress through School: Evidence from Peru‖,
Review of Economics and Statistics, Vol. 76, 151-160.
Jalilian H, and Kirkpatrick C. (2001). ―Financial development and poverty reduction in developing
country‖, finance and development research program, working paper series. Papier n°30;
Malpezzi, Stephen, (1999), ―Economic Analysis of Housing Markets in Developing and Transition
Economies‖, Urbanization in Transforming Economies, p. 1791-1864.
Mankiw, N. G., Romer, D. et Weil, D. N. (1992), ―A contribution to the empirics of economic growth‖,
Quarterly Journal of Economics, Vol. 107, Issue 2, pp. 407-437;
Montfort M., Seok G. P., Masafumi, Y. (2013), ―Banking in Sub-Saharan Africa: the Macroeconomic
Context‖, European Investment Bank, January 201;
Rajan, R., and Zingales L., (2003), ―The Great Reversals: The Politics of Financial Development in the
20th Century,‖ Journal of Financial Economics, Vol. 69, pp. 5–50.
Singh, Raju and Y. Huang, (2011), ―Financial Deepening and Property Rights: Evidence from Sub-
Saharan Africa‖, IMF Working Paper No. 11/196.
Tipple, A. Graham, (1994), ―Employment from Housing: A Resource for Rapidly Growing Urban
Populations‖, Cities 11, No. 6, p. 373.
UN-HABITAT (United Nations Human Settlements Programme), (2008), ―The State of African Cities
2008: A Framework for Addressing Urban Challenges in Africa‖. Nairobi: UN-HABITAT.
Uy, Willie, (2006), ―Medium-Rise Housing: The Philippine Experience‖, Presentation Paper for the 5th
Asian Forum.
World Bank (2013), « Harnessing urbanization to end poverty and boost prosperity in Africa: An action
agenda for transformation», Africa Region Sustainable Development N°=81546, the World Bank.