housing california report - reconnecting america · housing california believes that state ......
TRANSCRIPT

Authors: Sharon Sprowls, Nathan Cataline, Judson Brown (Housing California) Editor: Karen C. Naungayan (Housing California)
I. Introduction
Proposition 1C, the Housing and Emergency Shelter Trust Fund Act of 2006, was passed by California voters in November 2006. Proposition 1C authorized the State to issue $2.85 billion in general obligation bonds to fund 13 different housing and development programs. Included among these were two new programs: the Transit-Oriented Development (TOD) Housing Program and the Infill Infrastructure Grant (IIG) Program. Housing California believes that state funding for housing programs like the TOD and IIG are critical for developing a variety of quality, affordable places to live for all Californians. The TOD and IIG are both forward-thinking programs, providing essential funding to support development and infrastructure projects that will create a range of homeownership and rental choices. The two programs also have the potential to support California Senate Bill 375 implementation, landmark legislation that connects transportation and land-use planning at the regional level, by supporting infrastructure and construction of a mix of housing choices near quality transportation options and amenities. As a leading partner in the drafting and passage of Proposition 1C, Housing California decided to conduct an evaluation of both the TOD and IIG programs. The goal of this evaluation is to assess how well these programs met the goals of increasing the supply of homes affordable to lower-income Californians and promoting effective transit-oriented and infill development. An interim report on the first round of program awards was issued in July 2009. This report completes the analysis of the program outcomes, following the second, and final, funding round of each program. Data for this report was collected through November 2010. It also includes recommendations for TOD program revisions if a new source of program funds becomes available in the future. Housing California wishes to thank the Ford Foundation for funding this evaluation.
II. Program Background
Senate Bill 1689 (Chapter 27, Statutes of 2006), which placed Proposition 1C on the ballot, established the Transit-Oriented (TOD) Development Implementation Program and general program guidelines. Senate Bill 86 (Chapter 179, Statutes of 2007) established the Infill Infrastructure Grant (IIG) Program in law and provided initial parameters for the program. The California Department of Housing and Community Development (HCD) administers the funds for both new programs. Building on legislative statutory requirements, HCD staff conducted an extensive input process with experts and stakeholders to develop detailed threshold and scoring criteria for the first funding round of each program. HCD issued Round 1 Notices of Funding Availability (NOFAs) in late 2007 and early 2008. Round 1 award recipients were announced in June 2008.
HOUSING CALIFORNIA : REPORT
Evaluation of California's Transit-Oriented Development (TOD) Housing and Infill Infrastructure
Grant (IIG) Programs
Because of the economic downturn and a desire to encourage more job creation in California, HCD consolidated planned Round 2 and Round 3 funding cycles into a single Round 2 for each of the programs. HCD drafted revised guidelines and provided opportunities for public input through workshops, meetings, and written comments before finalizing program guidelines for the Round 2 funds. NOFAs were issued in early 2009, with Round 2 award recipients announced in June 2009. The following are general descriptions of the two programs: (1) The Transit-Oriented Development (TOD) Housing Program — The TOD program provides a total of $271 million in grants and loans to local governments and developers. The purpose of the program is to both stimulate the production of housing near transit, including market rate and affordable units, as well as increase transit ridership. Funds may be used for housing development costs; infrastructure necessary to housing developments; capital improvements to enhance pedestrian or bicycle access from housing developments to the nearest transit station; and/or land acquisition by a redevelopment agency during the predevelopment period. (2) The Infill Infrastructure Grant (IIG) Program — The IIG program provides $730 million for infrastructure supporting urban infill housing development, including construction and/or improvement of streets and public transportation facilities, parks, water, and sewers. The IIG program had two application subcategories. One for individual developments, or “Qualified Infill Projects” (QIPs), the other for larger areas containing multiple housing developments, or “Qualified Infill Areas” (QIAs). A summary of the TOD and IIG programs’ Round 1 and Round 2 eligibility requirements and scoring system are included in Appendices A through E. In all, HCD made awards of nearly a billion dollars to 27 TOD and 93 infill infrastructure projects. Award descriptions may be found in Appendices F, G, H and I.
III. Evaluation Methodology
To conduct this evaluation, Housing California staff gathered detailed information from the grant applications, including the proposed projects’ location, cost, target populations, numbers of homes and bedrooms, density, affordability, proximity to transit and amenities, and other features in order to analyze scoring for both programs. Housing California organized two advisory committees of experts on transit-oriented and infill development from around the state, one after the first round of awards and one after the second round. TOD/IIG Advisory Committee members did not include participants who were actual or potential applicants for TOD or IIG funds. In addition, Housing California’s Land Use and Finance Working Group, which includes nonprofit developers, also provided feedback on our findings. For a complete list of Advisory Committee and working group members, refer to Appendix M. Both Advisory Committees discussed Round 1 and Round 2 program guidelines, award outcomes, and recommendations for program revisions. The Advisory Committee gave input on which aspects of the program to analyze, crafted potential alternate scoring systems to assess, and, after the Round 2, developed a set of recommendations for modifying the TOD program.
Page 2 EEEEvaluation of Cvaluation of Cvaluation of Cvaluation of California’s TOD alifornia’s TOD alifornia’s TOD alifornia’s TOD Housing and IIGHousing and IIGHousing and IIGHousing and IIG ProgramsProgramsProgramsPrograms

Finally, Housing California staff also met with HCD staff to review the draft final evaluation report. The next two sections of the evaluation present data collected by Housing California staff from HCD. This data is meant to show the performance and outcomes of both the TOD and IIG programs. The final section of the report provides recommendations based on program data and discussions with the Advisory Committee and Land Use and Finance Working Group. For a glossary of terms used in this report, refer to Appendix L.
Page 3 Evaluation of First Round Awards Under CA's TOD Housing and IIGEvaluation of First Round Awards Under CA's TOD Housing and IIGEvaluation of First Round Awards Under CA's TOD Housing and IIGEvaluation of First Round Awards Under CA's TOD Housing and IIG ProgramsProgramsProgramsPrograms
Page 3 EEEEvaluation of California’svaluation of California’svaluation of California’svaluation of California’s TOD Housing and IIGTOD Housing and IIGTOD Housing and IIGTOD Housing and IIG ProgramsProgramsProgramsPrograms

IV. Award Outcomes: Transit-Oriented Development (TOD) Housing Program
The California Department of Housing and Community Development (HCD) funded two rounds of Transit-Oriented Development (TOD) awards, granting a total of $271 million to 27 total projects statewide. With 119 submitted applications, there is a clear interest in TOD projects across the state. Of the funded projects, six received the full award of $17 million. In Round 2 of the TOD Program, HCD provided $19 million less in total funding and four fewer awards than Round 1. Round 2 also saw an increase in the number of partnerships between cities, nonprofits, and for-profits. The table below compares funding between Round 1 and Round 2, as well as totals from both rounds.
Table 1 - TOD Awards, Rounds 1 and 2
Round 1 awards
Round 2 awards
Total both rounds
Amount awarded $145
million $126
million $271
million
Number of awards
16 11 27
Awarded full $17 million
3 3 6
Partnerships
For-profit/Nonprofit
7 5 12
For-profit 5 -- 5
Nonprofit 4 3 7
City/For-profit -- 2 2
City/For-profit/Nonprofit
-- 2 2
Total applicant pool and
oversubscription
59 applications
for $548 million
60 applications
for $604 million
119 applications
for $1.1 billion
Purpose of the Program Over both rounds, more awards went toward rental-home development than toward infrastructure to support housing developments. Of the awards, a majority of funds for housing went towards new construction projects, with only three awards going towards rehabilitation. The rehabilitation projects were: • Downtown Los Angeles: A former single-room occupancy (SRO) hotel, developed into
affordable and market-rate lofts.
Page 4 EEEEvaluatiovaluatiovaluatiovaluation of California’sn of California’sn of California’sn of California’s TOD Housing and IIGTOD Housing and IIGTOD Housing and IIGTOD Housing and IIG ProgramsProgramsProgramsPrograms

• San Francisco: A mix of 174 affordable and market-rate studio apartments at the Golden Gate Avenue YMCA, located in the Tenderloin neighborhood.
• Los Angeles: Two old buildings converted into 123 affordable apartments in Los Angeles’ Chinatown.
The table below provides more detail on the award purposes and project types.
Table 2 - TOD Awards by Purpose and Type
Round 1 awards
Round 2 awards
Total both
rounds
Award Purpose
Rental-home development
8 6 14
Housing infrastructure
5 2 7
Rental homes & housing
infrastructure 3 3 6
Award Type
New construction 14 10 24
Rehabilitation/reuse 1 2 3
Geographic Distribution of Awards TOD project awards were divided between Northern and Southern California, with 52% of funded projects in Northern California and 48% of funded projects in Southern California. In addition, Round 1 required that at least one project in each of the following council-of-government areas receive an award: Sacramento, San Francisco Bay Area, Los Angeles, and San Diego. While all of the projects awarded met the eligibility threshold, if not for this requirement, some regions may have lost out. The table on the next page shows project location by region across the state.
Page 5 EEEEvaluation of California’svaluation of California’svaluation of California’svaluation of California’s TOD Housing and IIGTOD Housing and IIGTOD Housing and IIGTOD Housing and IIG ProgramsProgramsProgramsPrograms

Page 6 EEEEvaluation of California’svaluation of California’svaluation of California’svaluation of California’s TOD Housing and IIGTOD Housing and IIGTOD Housing and IIGTOD Housing and IIG ProgramsProgramsProgramsPrograms
Table 3 - TOD Awards by Region
Round 1
awards
Round 2
awards
Total both
rounds
Northern CA
San Francisco Bay Area awards
7 3 10
Sacramento awards
1 2 3
Total 8 5 13
Southern CA
Los Angeles region awards
6 4 10
San Diego awards
2 2 4
Total 8 7 14

TOD Project Details TOD projects varied between residential-only developments and mixed-use developments that included uses such as: childcare facilities, community centers, and retail space to commercial and office space, hotel, and entertainment uses. Eight projects were solely residential, but were located in areas with existing or planned businesses, community centers, office space, or other uses. Round 2 also showed greater variation in development’s parking supply. For example, two projects provided no residential parking, while two other projects provided more parking than average. The table below breaks down the transportation access, mix of uses, and parking outcomes from both rounds of the TOD program.
Table 4 - TOD Program Transit Access, Mix of Uses,
Parking
Round 1 awards
Round 2 awards
Total both
rounds
Mix of Uses
Mixed use 11 8 19
Residential only
5 3 8
Parking
Zero -- 2 2
From .1 to .8 spaces/home
5 2 7
1 space/home
6 2 8
From 1.1-1.4 spaces/home
4 4 8
1.5 spaces/home
-- 2 2
Page 7 EEEEvaluation of California’svaluation of California’svaluation of California’svaluation of California’s TOD Housing and IIGTOD Housing and IIGTOD Housing and IIGTOD Housing and IIG ProgramsProgramsProgramsPrograms

Transit-Supportive Land Uses HCD’s TOD program guidelines mandated that each project have at least 10 transit-supportive amenities and services nearby. Of the projects that received awards, nearby amenities included: � Nearby qualifying transit station, at least one restaurant, one café, and one school (ranging
from elementary school to private career college) = 22 projects � At least one hair-care salon and one health club or sport or recreation facility (usually a park) =
21 projects � A pharmacy = 19 projects � At least one grocery store, one place of worship (ranging from small to large), and at least one
medical/dental location (ranging from an individual dentist’s office to a full hospital) = 18 projects
� At least one bank/credit union and one laundry or dry-cleaning facility = 17 projects � At least one convenience store and a fire or police station = 16 projects � A child care facility = 15 projects
Housing Characteristics The TOD program helped fund an array of affordable and market-rate developments featuring both for-sale and rental homes. For example, there are two proposed mixed-income projects that include market-rate for-sale homes, while two other developments included for-sale homes targeted to low- and moderate-income homebuyers. Conversely, fifteen out of twenty-eight projects were completely affordable. The chart below details housing characteristics, including the number of ownership and rental developments and the percentage of affordable homes for both rounds of the program.
Table 5 - TOD Program Housing Characteristics
Round 1 awards
Round 2 awards
Total both
rounds
Home characteristics
Rental only
10 8 18
Rental and
ownership 6 3 9
Affordable % of total homes
100% Affordable
8 7 15
42-78% Affordable
-- 1 1
0-41% Affordable
6 3 9
EEEEvaluation of California’s TOD valuation of California’s TOD valuation of California’s TOD valuation of California’s TOD Housing and IIGHousing and IIGHousing and IIGHousing and IIG ProgramsProgramsProgramsPrograms
Page 8

Home Production and Affordability The following chart outlines the number of homes built and home affordability levels between Round 1 and Round 2. With less funding available, Round 2 helped produce fewer total homes and affordable homes, fewer bedrooms in affordable homes, and smaller homes overall. It also provided less money for developments targeting low-income households. However, Round 2 did have a greater percentage of total homes that were affordable, and more total homes were targeted for households earning extremely low and low incomes.
Table 6 - TOD Program Total Home Production by Income Level
Extremely Low
Income (ELI) 30%
AMI*
Very Low
Income (VLI) 50% AMI*
Low Income
80% AMI*
Market-rate
homes
Manager units
Total homes
Total affordable homes
Percent affordable
Total ELI & VLI homes
Percent of total
Round 1
230 1,004 608 1,739 12 3,593 1,842 51% 1,234 34%
Round 2
345 1,126 193 886 15 2,565 1,664 65% 1,471 57%
Total 575 2,130 801 2,625 27 6,158 3,506 57% 2,705 44%
*Area Median Income
Table 7 - TOD Program Production by Bedroom and Density
Total Bedrooms Density
Total
bedrooms
Total ELI/VLI
bedrooms
ELI/VLI as % of total bedrooms
Average homes/acre
Average parcel size
Round 1
6,163 2,239 36% 155.92 2.61
Round 2
3,837 2,177 57% 144.46 2.52
Overall 10,000 4,416 44% 150 2.57
Page 9 EEEEvaluation of California’s valuation of California’s valuation of California’s valuation of California’s TOD TOD TOD TOD Housing and IIGHousing and IIGHousing and IIGHousing and IIG ProgramsProgramsProgramsPrograms

Gentrification Impacts During the evaluation of the TOD program, Housing California’s Advisory Committee noted that TOD developments can have significant gentrification impacts on affordable neighborhoods near transit. In an effort to further examine the link between TOD investment and gentrification, Housing California staff and advisory committee members considered current research to explore the risk of gentrification for some of the TOD developments. This process is discussed in further detail in the "Recommendations" section (Section VII) in this report.
Home Production with Alternative TOD Scoring Criteria In Housing California’s first-round evaluation of the TOD program, staff recommended doubling the number of points awarded for including affordable homes within a development from 30 to 60. To see the impacts of scoring changes, we ran two different scenarios to compare how doubling points awarded for affordability might have impacted housing production. In addition to the original scoring system, we ran two additional scenarios: � Eliminating the allowed alternative of using the California Tax Credit Allocation Committee’s
(CTCAC) scoring system, and doubling the affordability points to a possible 60 points. � Keeping the 30 point maximum points awarded for affordability while eliminating the CTCAC
scoring option. These scenarios provide an idea of how scoring system changes might have affected Round 2 outcomes. However, alternate scenarios could only be calculated using actual applications that were submitted. It is not possible to determine how scoring differences might have affected who chose to apply for Round 2 funds. Since developers often self-score prior to applying for state funding, it is difficult to say how many people were deterred from applying because of the scoring system. As shown below, in all categories except homes for low-income households, the original Round 2 scoring yielded more homes than the other two scoring scenarios. Shaded cells indicate the highest number between the three scoring scenarios.
Conclusion The Transit-Oriented Development program funded a wide array of project types. Round 2 applicants include more partnerships between public, private, and nonprofit entities and awards resulted in more funding going toward low- and very–low-income households. The next section describes the Infill Infrastructure Grant (IIG) program and its outcomes.
Page 10 EEEEvaluation of California’svaluation of California’svaluation of California’svaluation of California’s TOD Housing and IIGTOD Housing and IIGTOD Housing and IIGTOD Housing and IIG ProgramsProgramsProgramsPrograms
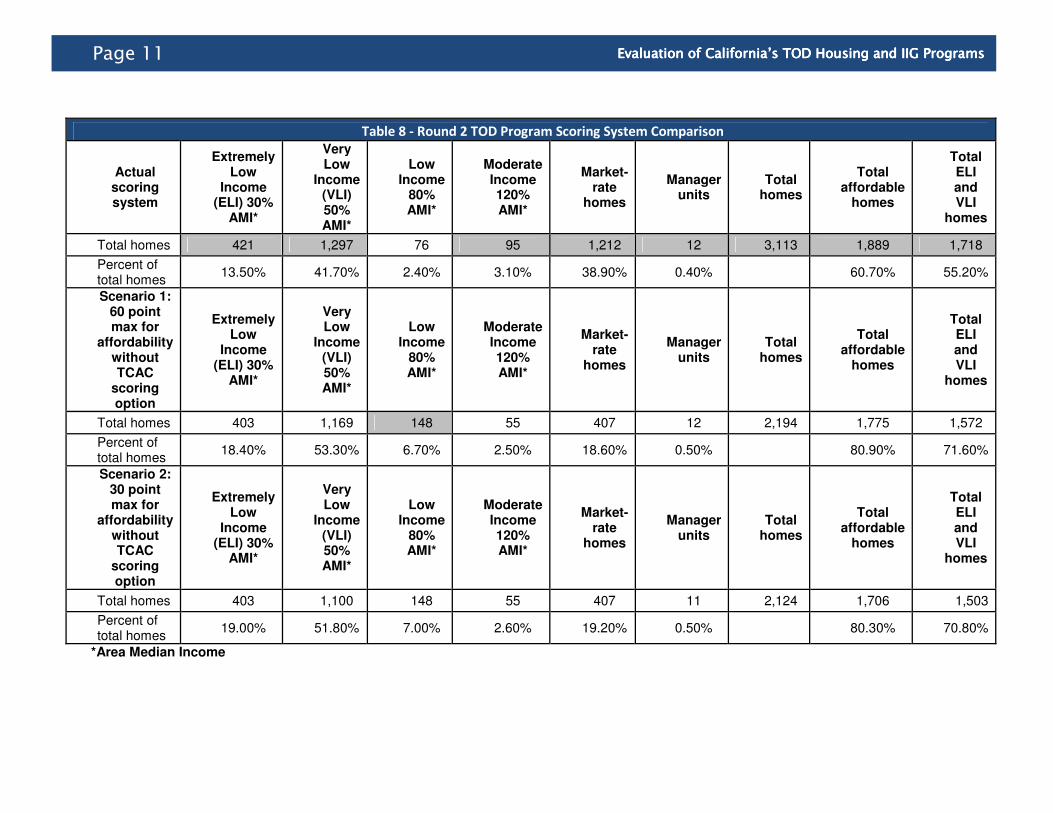
Table 8 - Round 2 TOD Program Scoring System Comparison
Actual scoring system
Extremely Low
Income (ELI) 30%
AMI*
Very Low
Income (VLI) 50% AMI*
Low Income
80% AMI*
Moderate Income 120% AMI*
Market-rate
homes
Manager units
Total homes
Total affordable
homes
Total ELI and VLI
homes
Total homes 421 1,297 76 95 1,212 12 3,113 1,889 1,718
Percent of total homes
13.50% 41.70% 2.40% 3.10% 38.90% 0.40% 60.70% 55.20%
Scenario 1: 60 point max for
affordability without TCAC
scoring option
Extremely Low
Income (ELI) 30%
AMI*
Very Low
Income (VLI) 50% AMI*
Low Income
80% AMI*
Moderate Income 120% AMI*
Market-rate
homes
Manager units
Total homes
Total affordable
homes
Total ELI and VLI
homes
Total homes 403 1,169 148 55 407 12 2,194 1,775 1,572
Percent of total homes
18.40% 53.30% 6.70% 2.50% 18.60% 0.50% 80.90% 71.60%
Scenario 2: 30 point max for
affordability without TCAC
scoring option
Extremely Low
Income (ELI) 30%
AMI*
Very Low
Income (VLI) 50% AMI*
Low Income
80% AMI*
Moderate Income 120% AMI*
Market-rate
homes
Manager units
Total homes
Total affordable
homes
Total ELI and VLI
homes
Total homes 403 1,100 148 55 407 11 2,124 1,706 1,503
Percent of total homes
19.00% 51.80% 7.00% 2.60% 19.20% 0.50% 80.30% 70.80%
*Area Median Income
Page 11 EEEEvaluation of California’s TOD valuation of California’s TOD valuation of California’s TOD valuation of California’s TOD Housing and IIGHousing and IIGHousing and IIGHousing and IIG ProgramsProgramsProgramsPrograms
V. Award Outcomes: Infill Infrastructure Grant (IIG) Program
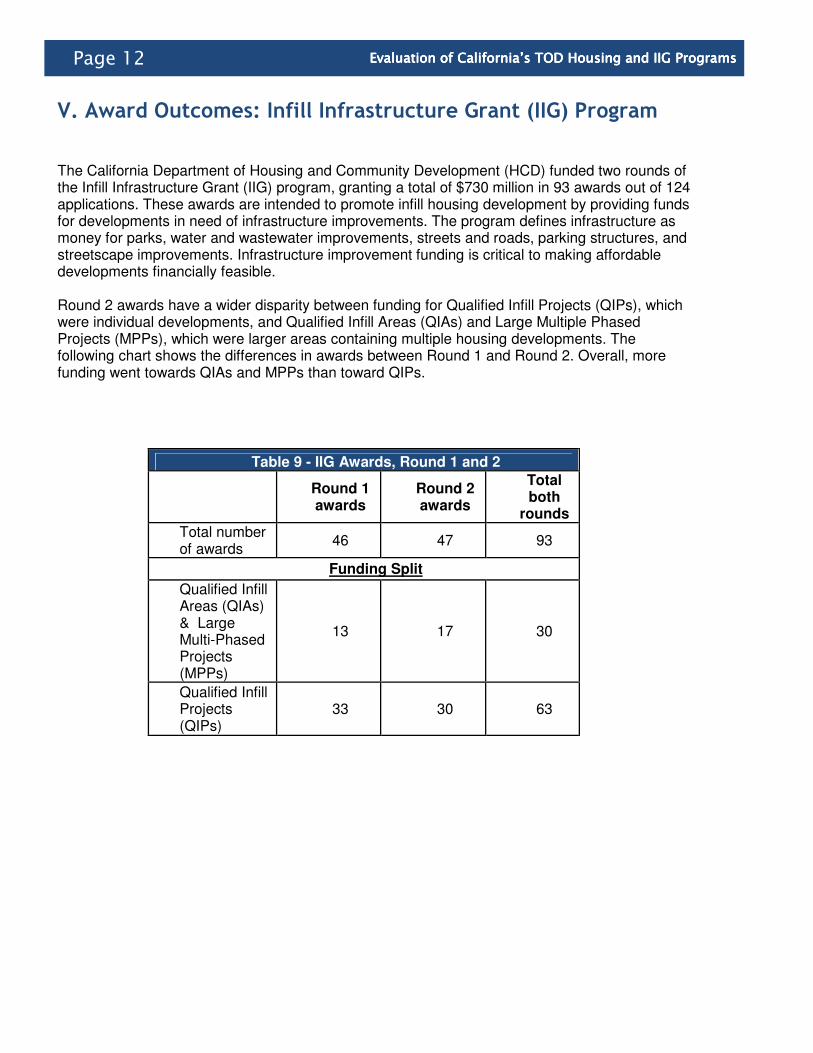
The California Department of Housing and Community Development (HCD) funded two rounds of the Infill Infrastructure Grant (IIG) program, granting a total of $730 million in 93 awards out of 124 applications. These awards are intended to promote infill housing development by providing funds for developments in need of infrastructure improvements. The program defines infrastructure as money for parks, water and wastewater improvements, streets and roads, parking structures, and streetscape improvements. Infrastructure improvement funding is critical to making affordable developments financially feasible. Round 2 awards have a wider disparity between funding for Qualified Infill Projects (QIPs), which were individual developments, and Qualified Infill Areas (QIAs) and Large Multiple Phased Projects (MPPs), which were larger areas containing multiple housing developments. The following chart shows the differences in awards between Round 1 and Round 2. Overall, more funding went towards QIAs and MPPs than toward QIPs.
Table 9 - IIG Awards, Round 1 and 2
Round 1 awards
Round 2 awards
Total both
rounds
Total number of awards
46 47 93
Funding Split
Qualified Infill Areas (QIAs) & Large Multi-Phased Projects (MPPs)
13 17 30
Qualified Infill Projects (QIPs)
33 30 63
Page 12 EEEEvaluation of California’s TODvaluation of California’s TODvaluation of California’s TODvaluation of California’s TOD Housing and IIGHousing and IIGHousing and IIGHousing and IIG ProgramsProgramsProgramsPrograms

Nonprofits led as applicants in both rounds, but Round 2 saw more partnerships between for-profits and cities and/or nonprofits.
Table 10- Partnerships
Lead Applicant
Round 1 awards
Round 2 awards
Total both
rounds
Nonprofit 17 14 31
For-profit 8 3 11
For-profit/Nonprofit
3 10 13
City or other public agency
6 5 11
City/Nonprofit 6 3 9
City/For-profit 5 11 16
City/For-profit/Nonprofit
1 1 2
Geographic Distribution of Awards Over both rounds, IIG project awards were divided between Northern and Southern California. The next two tables provide more detail on the geographic location of projects throughout the state.
Table 11 - IIG Awards by Geography
Area Round 1 awards Round 2 awards Total both rounds
QIAs/MPPs
Northern California awards
6 9 15
Southern California awards
6 7 13
Central Valley awards
1 1 2
QIPs
Northern California awards
15 13 28
Southern California awards
15 14 29
Central Valley awards
3 3 6
Page 13 EEEEvaluation ovaluation ovaluation ovaluation of California’s TOD f California’s TOD f California’s TOD f California’s TOD Housing and IIGHousing and IIGHousing and IIGHousing and IIG ProgramsProgramsProgramsPrograms

Table 12 - IIG Awards by Region
Northern CA Awards
Area Round
1 Round
2 Total
San Francisco Bay Area awards
14 18 32
Sacramento area
awards 4 4 8
Other area awards
3 - 3
Central Valley Awards
Bakersfield awards
- 1 1
Other area awards
4 4 8
Southern CA Awards
Los Angeles region awards
18 17 35
San Diego awards
3 3 6
Housing Characteristics The IIG program funds infrastructure for new housing and mixed-use developments. In both rounds, two-thirds of awards went towards rental-home infrastructure, while one-third supported a mix of rental and ownership or ownership-only projects. In Round 2 the only all-homeownership project was a self-help housing development, where future homeowners help build their own homes. Of the QIPs, only three projects were not entirely affordable in Round 1, compared to six projects in Round 2. Unlike QIPs, a majority of the QIAs and MPPs were mixed-income developments. The table on the next page provides more details on the type of construction, ownership, and percentage of affordable homes.
Page 15 EEEEvaluation of California’s TOD valuation of California’s TOD valuation of California’s TOD valuation of California’s TOD Housing and IIGHousing and IIGHousing and IIGHousing and IIG ProgramsProgramsProgramsPrograms
Page 14 EEEEvaluation of California’s TODvaluation of California’s TODvaluation of California’s TODvaluation of California’s TOD Housing and IIGHousing and IIGHousing and IIGHousing and IIG ProgramsProgramsProgramsPrograms

Home Production and Affordability Over both rounds of IIG funding, the program provided infrastructure support for more than 19,500 homes. Round 2 helped fund fewer market-rate and affordable-homeownership projects, as well as fewer affordable rentals than Round 1. This is likely explained by the fact that the average size of awarded QIA/MPP projects dropped by more than 100 homes. Conversely, the size of QIPs did not significantly change between Round 1 and Round 2. Below is a summary of home production from IIG Rounds 1 and 2, shading indicates the highest number when comparing Round 1 to Round 2:
Table 13 - IIG Awards, Total Home Production
Round 1 Number
of awards
% of all IIG funds
Total homes
Total market-
rate homes
Total affordable
homes
Affordable homes as % of total
homes
Total affordable
rentals
Ownership homes
affordable 80% AMI*
Ownership homes
affordable 120% AMI*
QIAs/MPPs 13 71% 6,992 4,724 2,258 32% 2,205 18 35
QIPs 33 29% 2,913 297 2,568 88% 2,458 45 65
Total 46 9,905 5,021 4,826 49% 4,663 63 100
Round 2 Number
of awards
% of all IIG funds
Total homes
Total market-
rate homes
Total affordable
homes
Affordable homes as % of total
homes
Total affordable
rentals
Affordable ownership
homes 80% AMI*
Affordable ownership
homes 120% AMI*
QIAs/MPPs 17 73% 7,029 4,525 2,504 36% 2,252 99 153
QIPs 30 27% 2,610 510 2,100 80% 2,078 22 0
Total 47 9,639 5,035 4,604 48% 4,330 121 153
Total both rounds
Number of
awards
% of all IIG funds
Total homes
Total market-
rate homes
Total affordable
homes
Affordable homes as % of total
homes
Total affordable
rentals
Affordable ownership
homes 80% AMI*
Affordable ownership
homes 120% AMI*
QIAs/MPPs 30 72% 14,021 9,249 4,762 34% 4,457 117 188
QIPs 63 28% 5,523 807 4,668 85% 4,536 67 65
Total 90 19,544 10,056 9,430 48% 8,993 184 253
*Area Median Income
Page 15 EEEEvaluation of California’s TOD valuation of California’s TOD valuation of California’s TOD valuation of California’s TOD Housing and IIGHousing and IIGHousing and IIGHousing and IIG PrograPrograPrograProgramsmsmsms
Total Bedrooms
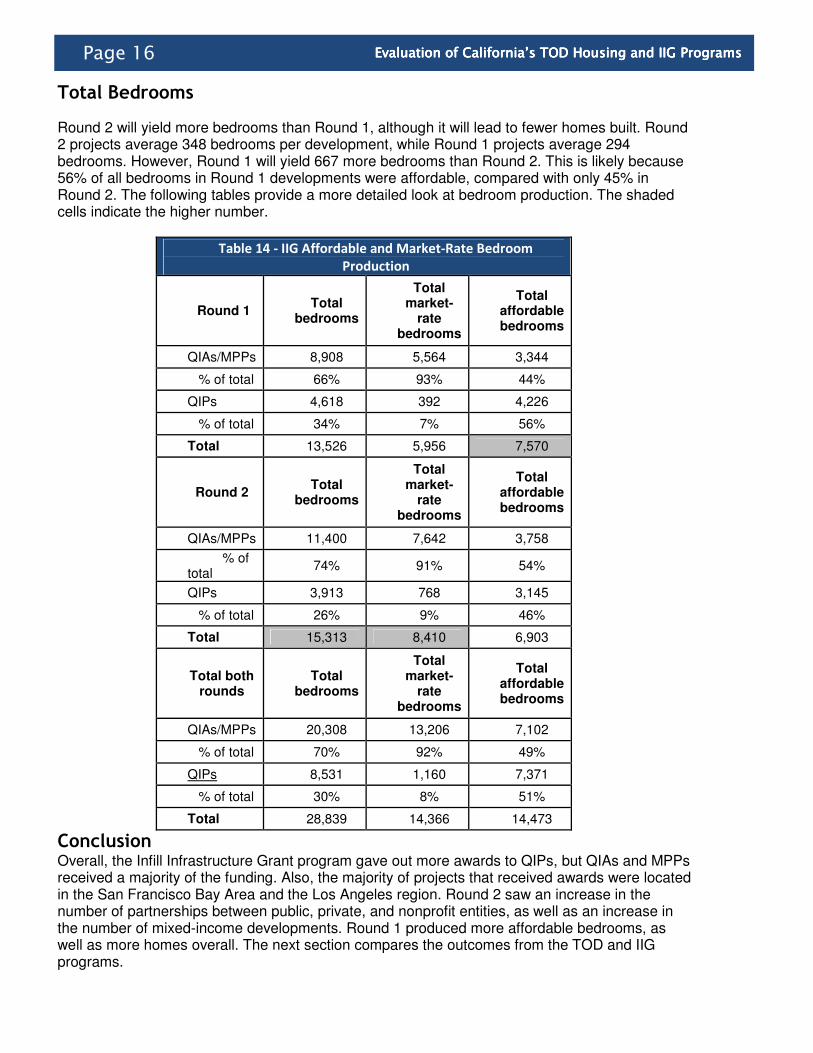
Round 2 will yield more bedrooms than Round 1, although it will lead to fewer homes built. Round 2 projects average 348 bedrooms per development, while Round 1 projects average 294 bedrooms. However, Round 1 will yield 667 more bedrooms than Round 2. This is likely because 56% of all bedrooms in Round 1 developments were affordable, compared with only 45% in Round 2. The following tables provide a more detailed look at bedroom production. The shaded cells indicate the higher number.
Table 14 - IIG Affordable and Market-Rate Bedroom
Production
Round 1 Total
bedrooms
Total market-
rate bedrooms
Total affordable bedrooms
QIAs/MPPs 8,908 5,564 3,344
% of total 66% 93% 44%
QIPs 4,618 392 4,226
% of total 34% 7% 56%
Total 13,526 5,956 7,570
Round 2 Total
bedrooms
Total market-
rate bedrooms
Total affordable bedrooms
QIAs/MPPs 11,400 7,642 3,758
% of total
74% 91% 54%
QIPs 3,913 768 3,145
% of total 26% 9% 46%
Total 15,313 8,410 6,903
Total both rounds
Total bedrooms
Total market-
rate bedrooms
Total affordable bedrooms
QIAs/MPPs 20,308 13,206 7,102
% of total 70% 92% 49%
QIPs 8,531 1,160 7,371
% of total 30% 8% 51%
Total 28,839 14,366 14,473
Conclusion Overall, the Infill Infrastructure Grant program gave out more awards to QIPs, but QIAs and MPPs received a majority of the funding. Also, the majority of projects that received awards were located in the San Francisco Bay Area and the Los Angeles region. Round 2 saw an increase in the number of partnerships between public, private, and nonprofit entities, as well as an increase in the number of mixed-income developments. Round 1 produced more affordable bedrooms, as well as more homes overall. The next section compares the outcomes from the TOD and IIG programs.
Page 16 EEEEvaluation of California’s TOD valuation of California’s TOD valuation of California’s TOD valuation of California’s TOD Housing and IIGHousing and IIGHousing and IIGHousing and IIG ProgramsProgramsProgramsPrograms

VI. Comparison of the Round 2 Transit-Oriented Development Program and Infill Infrastructure Grant Program Awards
Round 2 of the Infill Infrastructure Grant (IIG) program’s QIA/MPP grants will support more total homes at all income levels combined, as well as more homes for very–low-, low-, moderate and above-moderate income households. However, the QIP and Transit-Oriented Development (TOD) grants targeted a much higher percentage of funds to homes for extremely low- and very–low-income households. The following table shows the proposed income targeting for Round 2:
Table 15 - IIG and TOD Production by Income
Extremely Low
Income (ELI) 30%
AMI
Very Low
Income (VLI) 50% AMI
Low Income
80% AMI
Moderate Income 120% AMI
Market-rate
homes
Manager units
Total homes
Total affordable
homes
Total ELI and VLI
QIA/MPP Grants
Total homes
480 1,413 458 153 4,516 9 7,029 2,504 1,893
Percent of total homes
6.80% 20.10% 6.50% 2.20% 64.20% 0.10% 35.60% 26.90%
QIP Grants
Total homes
711 1,120 269 0 485 25 2,610 2,100 1,831
Percent of total homes
27.20% 42.90% 10.30% 0.00% 18.60% 1.00% 80.50% 70.20%
TOD Grants
Total homes
345 1,126 193 0 886 15 2,565 1,664 1,471
Percent of total homes
13.50% 43.90% 7.50% 0.00% 34.50% 0.60% 64.90% 57.30%
*Area Median Income
Page 17 Page 17 EEEEvaluation of California’s TODvaluation of California’s TODvaluation of California’s TODvaluation of California’s TOD Housing and IIGHousing and IIGHousing and IIGHousing and IIG ProgramsProgramsProgramsPrograms
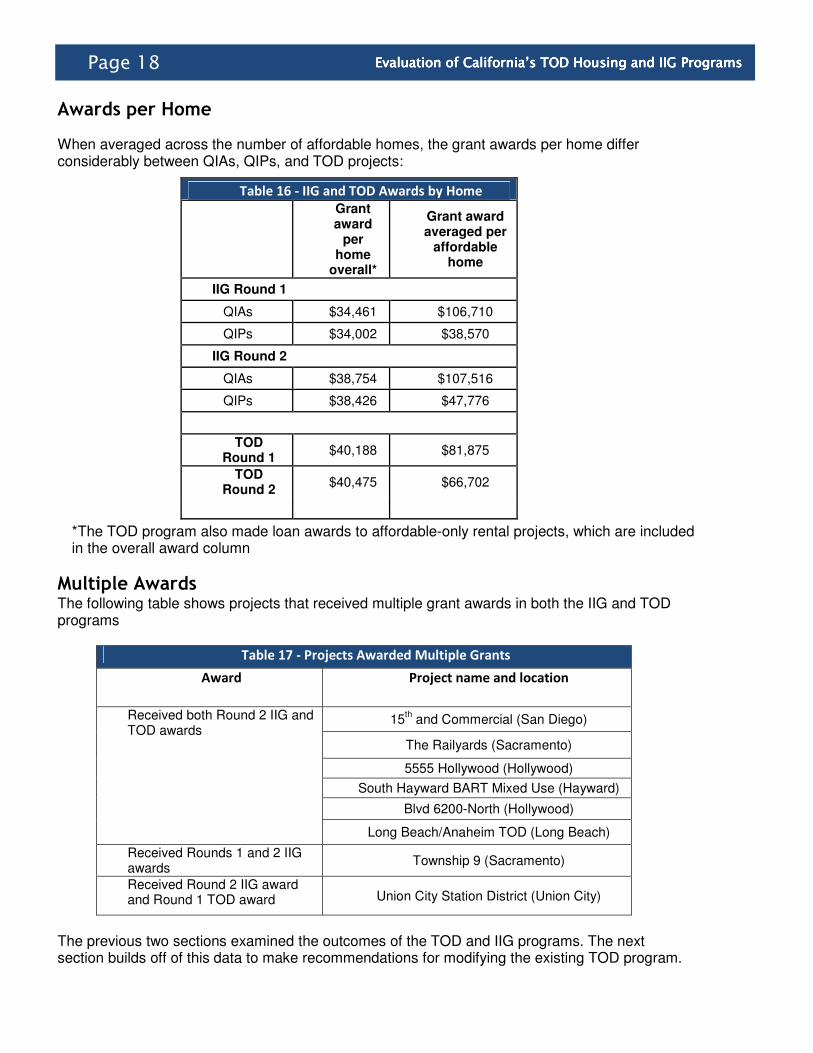
Awards per Home
When averaged across the number of affordable homes, the grant awards per home differ considerably between QIAs, QIPs, and TOD projects:
*The TOD program also made loan awards to affordable-only rental projects, which are included in the overall award column
Multiple Awards The following table shows projects that received multiple grant awards in both the IIG and TOD programs
Table 17 - Projects Awarded Multiple Grants
Award Project name and location
Received both Round 2 IIG and TOD awards
15th and Commercial (San Diego)
The Railyards (Sacramento)
5555 Hollywood (Hollywood)
South Hayward BART Mixed Use (Hayward)
Blvd 6200-North (Hollywood)
Long Beach/Anaheim TOD (Long Beach)
Received Rounds 1 and 2 IIG awards
Township 9 (Sacramento)
Received Round 2 IIG award and Round 1 TOD award Union City Station District (Union City)
The previous two sections examined the outcomes of the TOD and IIG programs. The next section builds off of this data to make recommendations for modifying the existing TOD program.
Table 16 - IIG and TOD Awards by Home
Grant award
per home
overall*
Grant award averaged per
affordable home
IIG Round 1
QIAs $34,461 $106,710
QIPs $34,002 $38,570
IIG Round 2
QIAs $38,754 $107,516
QIPs $38,426 $47,776
TOD Round 1
$40,188 $81,875
TOD Round 2
$40,475 $66,702
Page 18 EEEEvaluation of California’s TOD valuation of California’s TOD valuation of California’s TOD valuation of California’s TOD Housing and IIGHousing and IIGHousing and IIGHousing and IIG ProgramsProgramsProgramsPrograms

VII. Recommendations for Modifications to the Transit-Oriented Development Program The Transit-Oriented Development (TOD) program will lead to the production of 1,664 affordable homes and 2,565 total homes across the state of California. This success and the growing interest in transit-oriented development around the state and across the nation led us to develop a series of recommendations to guide future modifications to HCD’s TOD program. In some areas, our Advisory Committee made recommendations for specific changes to the eligibility and scoring criteria; in others they suggested that HCD and stakeholders examine evolving TOD-related research to develop new program criteria. The following is a summary of our Advisory Committee's discussions and our recommendations, with the recommended changes in bold. The first three categories are general recommendations, and the remaining 12 recommendations are specific to sections of the TOD application.
1. Catalyst Projects For the previous two rounds of funding, there has been a distinction between project types that fall into two categories: awards made to projects in areas that already feature TOD, and targeted investment for projects that can transformational to the project area. Because there is such a high need in California to build new affordable homes and preserve existing affordable homes in developed areas near quality transit, our Advisory Committee recommends adding the following goal to the statutory requirements: We recommend that the program fund projects that will serve as models of, or catalysts for, pedestrian-friendly, transit-supportive developments that preserve or add permanent affordable homes to amenity-rich areas near high-quality transit that provides good connectivity to education and jobs.
2. Gentrification/Displacement According to PolicyLink’s Equitable Development Tool Kit, land within a five to ten minute walk of a transit station sells for 20-25% more than land outside of that walking distance. Such increased land value places a burden on developers of affordable homes and can lead to displacement around transit stations. In addition to a high potential for gentrification, a 2009 study by AARP, Reconnecting America and the National Housing Trust found that a large percentage of HUD-assisted rentals in the Los Angeles and San Francisco Bay Area regions are located near quality transit, but a majority of these homes have expiring HUD contracts. This could severely impact the supply of affordable homes near transit in both regions. The first two rounds of HCD’s program guidelines have attempted to measure applications’ potential to displace residents. The guidelines specify that “if an application involved the demolition or rehabilitation of existing units affordable to lower income households, the Housing Development must include units with equal or greater affordability, equal to or greater than the number of the existing affordable units, except in cases where the rehabilitated units provide amenities such as bathrooms and kitchens not present in existing units in which case, the reduction may not result in more than 25% fewer units upon project completion.”
Page 19 EEEEvaluation of Californvaluation of Californvaluation of Californvaluation of California’s TOD ia’s TOD ia’s TOD ia’s TOD Housing and IIGHousing and IIGHousing and IIGHousing and IIG ProgramsProgramsProgramsPrograms

The current application process assesses the history of a project to see how it has impacted current and previous tenants. However, despite this review, a first-round TOD loan was awarded for the rehabilitation of a single-resident occupancy (SRO) hotel, whose low-income tenants had recently been cleared out by the previous building owner. The application process should further screen applicants to ensure that this type of displacement does not occur.
Based on our analysis, we feel that it is important to discuss and potentially address how state investment should be approached for projects that might reduce the net housing stock or encourage gentrification. Karen Chapple, Associate Professor of City and Regional Planning at UC Berkeley and Faculty Director of the Center for Community Innovation, has undertaken research on gentrification and authored Mapping Susceptibility to Gentrification: An Early Warning Toolkit. Based on this research, Professor Chapple concluded that census tracts that have gentrified meet four criteria. They:
(1) are in the central city; (2) were below 80% of area median income in the earlier of the last two 10-year censuses; (3) had increases in educational attainment beyond the regional average between the last two
10-year censuses; and (4) had increases in housing appreciation above the regional average between the last two
censuses. Chapple and her assistants drew on the toolkit to assess previous gentrification and gentrification risk for areas in which projects receiving TOD awards were located. Of 19 measures used in the toolkit to evaluate gentrification risk, Chapple selected five measures easily obtainable from the U.S. Census and/or American Community Survey for census tracts. These were:
(1) The percent of workers using transit is greater than the regional average. (2) The percentage of non-family households (e.g., occupants of single-room occupancies
(SROs); transitional housing; or households composed of one or more unrelated individuals, such as seniors, singles, or housemates) is greater than the regional average.
(3) The percentage of the building stock (rental or ownership) containing three or more units is greater than the regional average.
(4) The percentage of renter households is greater than the regional average. (5) The percentage of households paying more than 30% of their income for rent is greater
than the regional average. For each measure found to be greater than the regional average, Chapple assigned one point. Census tracts with a score of three or more points were considered at risk of gentrification. Based on these measures, Chapple found that five of the awarded projects were in census tracts that had already gentrified, and 22 were in tracts at risk (or further risk) of gentrification. See Appendix J for this analysis. Chapple points out that amenity variables are also key in causing gentrification, but these variables may not be as easy to calculate or document as the five criteria above, and would require further consideration.
Page 20 EEEEvaluation of California’s TOD valuation of California’s TOD valuation of California’s TOD valuation of California’s TOD Housing and IIGHousing and IIGHousing and IIGHousing and IIG ProgramsProgramsProgramsPrograms

In addition to Chapple’s work, Sarah Truehaft of PolicyLink composed a list of strategies that may help mitigate gentrification and displacement effects of TOD:
� Affordability of all or a majority of the homes in a TOD project. � An adopted housing affordability preservation plan (now beginning to be developed for
areas at risk). � An operating land-banking program for affordable homes near a quality transit station or
corridor. � An adopted mixed-income zoning policy for the area in which the project is located,
requiring that a percentage of all new rental or ownership homes built be affordable. � An adopted community-benefits agreement between community organizations, public
agencies, and the private developer that includes anti-displacement, affordability, local hiring, job training, or other elements to stabilize area residents and small businesses.
� Adopted local hiring/first-source hiring policies that set aside a portion of jobs generated by the development to local residents.
� Mitigation funds committed for small business disruption during the project construction period.
� Strategies in place to stabilize and attract small, neighborhood-serving businesses vulnerable to displacement (e.g., lease protections, small business assistance/commercial corridor program, zoning incentives).
� A local housing trust fund with local funds dedicated to the project area. � Documented funds committed to groups that work with tenants facing displacement.
A point “offset” system was discussed in which a project applicant would receive negative points for a project located in an area at risk of gentrification, potentially calculated using Chapple’s aforementioned five measures, but earn offsetting points for mitigation strategies in place, including a high percentage of home affordability in the TOD housing project. Our Advisory Committee was not certain how workable such a formula would be. Some affordable homebuilders stressed that mixed-income projects in their area are usually most feasible in central, high-rent locations, i.e., those likely at risk of gentrification. Advisors were, therefore, concerned that a scoring system for gentrification risk could disadvantage projects in Southern California. Because of these concerns, there was continuing interest in developing program provisions to address the impacts on home affordability and displacement that could result from state investment in TOD projects in areas at risk of gentrification that do not disadvantage any particular region.
We recommended that HCD continue to explore gentrification and equity impacts to ensure any new state TOD funds promote and maintain home affordability and availability near quality transit for households with low incomes. This focus is especially important in light of California Senate Bill 375 implementation, which could impact land and home prices. In addition, we recommend the next round of funding incorporate the following goals for any future state TOD housing program:
� Increase affordability near quality transit in higher-income neighborhoods. � Increase and maintain affordability and stabilize current residents living near quality
transit in areas at risk of gentrification. � Invest to improve high-poverty neighborhoods near transit. � Ensure that the program is competitive and shared geographically across the state.
Page 21 EEEEvaluation of California’s TODvaluation of California’s TODvaluation of California’s TODvaluation of California’s TOD Housing and IIGHousing and IIGHousing and IIGHousing and IIG ProgramsProgramsProgramsPrograms
We also suggest that HCD ask if proposed acquisition/rehabilitation projects were ever HUD or affordable-home projects. Additionally, we recommend that HCD strengthen its existing protections to prevent project sponsors from switching extremely low- or very–low-income homes for low-income and moderate homes after the application has been approved for an award. Finally, we strongly recommend that projects supported with state funds do not ultimately reduce the net housing stock of affordable homes, and that state funds encourage acquisition/ rehabilitation and preservation of existing affordable rentals near quality transit, many of which have HUD contracts expiring in the next five years.
3. Environmental Justice Applicants were required to include an Environmental Impact Statement, but not to highlight any of the findings. We recommended the program strengthen its existing requirements for applicants to identify siting near any properties with undesirable land uses, significant air emissions, or toxic contamination, so that the environmental justice impacts of applicant projects could be assessed.
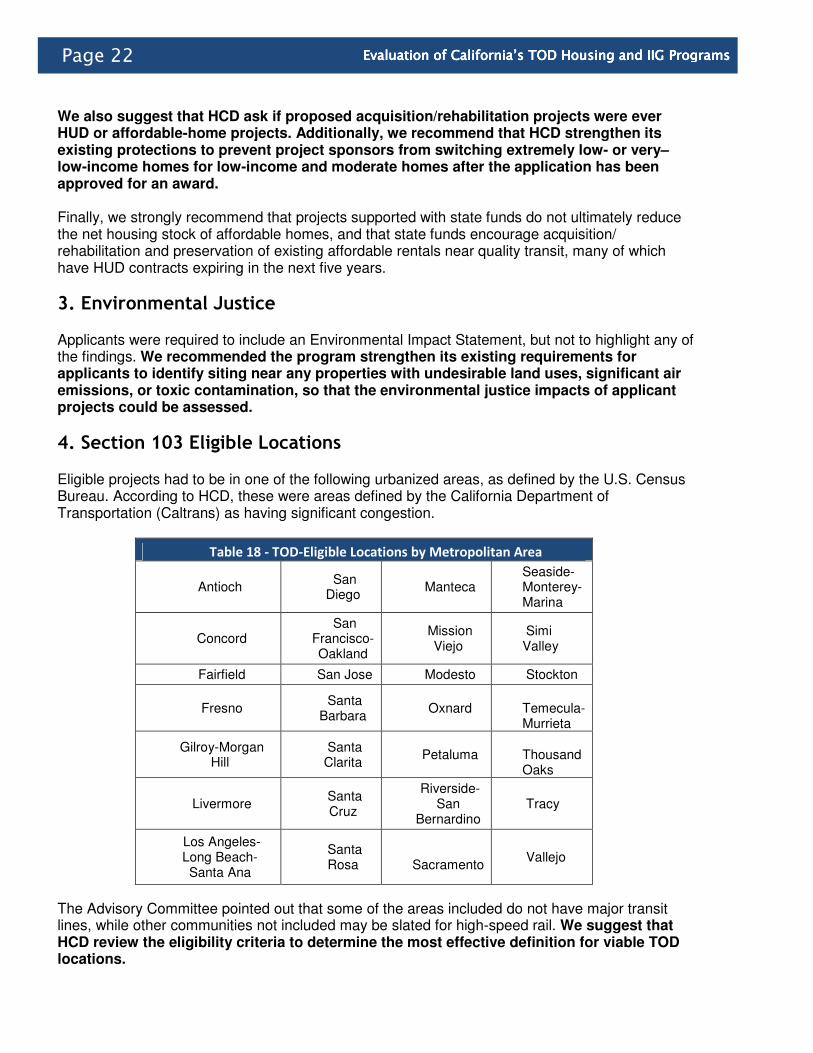
4. Section 103 Eligible Locations Eligible projects had to be in one of the following urbanized areas, as defined by the U.S. Census Bureau. According to HCD, these were areas defined by the California Department of Transportation (Caltrans) as having significant congestion.
Table 18 - TOD-Eligible Locations by Metropolitan Area
Antioch San Diego
Manteca Seaside-Monterey-Marina
Concord San
Francisco-Oakland
Mission Viejo
Simi Valley
Fairfield San Jose Modesto Stockton
Fresno Santa
Barbara Oxnard
Temecula-Murrieta
Gilroy-Morgan Hill
Santa Clarita
Petaluma Thousand Oaks
Livermore Santa Cruz
Riverside-San
Bernardino Tracy
Los Angeles-Long Beach-Santa Ana
Santa Rosa
Sacramento
Vallejo
The Advisory Committee pointed out that some of the areas included do not have major transit lines, while other communities not included may be slated for high-speed rail. We suggest that HCD review the eligibility criteria to determine the most effective definition for viable TOD locations.
Page 22 EEEEvaluation of California’s TODvaluation of California’s TODvaluation of California’s TODvaluation of California’s TOD Housing and IIGHousing and IIGHousing and IIGHousing and IIG ProgramsProgramsProgramsPrograms

5. Section 108(a)(1) Transit Frequency Round 2 awarded up to 30 points for “applications in which the best performing mode of transit serving the Qualified Transit Station has peak period headway frequency of twelve minutes or less. Scoring for all other applications will be determined by the best performing primary mode of transit demonstrating all day, on-time arrival/departure.”
Twelve-minute headways or on-time performance may not be the most accurate measure of transit quality. Many transportation agencies now use 15-minute headways as a quality measure. In areas with quality transit, the number of options available is more important than any individual headway. The point system also seemed somewhat inconsistent in rewarding 80% on-time performance with 20 points, but 79% on-time performance with 0 points, with no clear basis for that dividing line. Since siting projects near high-quality transit central to the TOD program, we recommend that the measures of transit be: (1) The level of service or availability of all public transit options serving the housing development
(within ½-mile for rail and ¼-mile for bus). This measure would include the service and frequency of heavy rail, light rail, bus rapid transit, bus, and ferry. This could build on the work of Caltrans, consultants such as Fehr and Peers, and other researchers to develop transit level of service or quality measures. This could also expand program competitiveness to areas with frequent high-capacity bus rapid transit or bus transit.
(2) The connectivity of the available transit to education and employment within a 30-minute travel
time (or perhaps 45 minutes in the case of suburban locations). The measure for quality transit should be defined as the ability to reach jobs or major destinations within a reasonable amount of transit time. Transit connectivity could be calculated with Transportation Demand Management (TDM) data, possibly with the assistance of the local council of governments.
We recommenced that HCD work with experts to develop a standard methodology for project applicants to use to calculate these two measures.
6. Section 108(a)(4) Transit Mode and Population Density
Section 108(a)(4) provided up to 55 points based on the existing population density within four miles of different types of transit. Appendix K shows the distribution of awarded projects by mode type and point score. HCD based this sliding scale on a 2007 study led by Professor Robert Cervero of UC Berkeley, as well as research conducted with Caltrans Division of Mass Transit, and a panel of other academic experts and practitioners. The study provided a literature summary of TOD and showed the usage of different types of transit systems.
Page 24 EEEEvavavavaluation of California’s TODluation of California’s TODluation of California’s TODluation of California’s TOD Housing and IIGHousing and IIGHousing and IIGHousing and IIG ProgramsProgramsProgramsPrograms
Page 23 EEEEvaluation of California’s TODvaluation of California’s TODvaluation of California’s TODvaluation of California’s TOD Housing and IIGHousing and IIGHousing and IIGHousing and IIG ProgramsProgramsProgramsPrograms

Advisors noted that light rail and bus rapid transit received the same, although the research is still evolving on usage differences; use may vary in different locations. According to Jerry Walters of Fehr and Peers, Caltrain has higher ridership than other more-suburban commuter lines in the state, due to a number of factors. However, in the TOD program guidelines it was scored the same as other commuter rail systems. Additionally, express bus service, which sometimes offers only morning and evening peak service, was scored better than some more-frequent commuter-rail services. Given that research in this area is still evolving, we recommended that HCD again work with technical experts and researchers in order to update this measure based on the latest findings on usage of different transit modes in relationship to surrounding housing and population density. We also suggest this scoring measure be incorporated into the transit quality and connectivity measures discussed above. Lastly, we suggest that if a population radius is used in any new measure, its calculation be modified for coastal areas where there is no population within certain directions.
7. Section 108(b)(1) and (b)(2) Location in an Area Designated for Infill or Transit-oriented Development
Under HCD’s first two rounds of program guidelines, applicants received up to 30 points if the proposed housing development was located in:
(1) An area designated for infill development through a regional plan policy adopted by the local council of governments – 20 points.
(2) An area designated for transit-oriented development in the applicable local general plan, specific plan, zoning ordinance, community plan, redevelopment plan, or transit village plan, or in an area regulated by, or included in land use policies, regional blueprint plans, other regional plans, development regulations or programs which promote transit-supportive residential and nonresidential uses within the Project area – 10 points.
Certain councils of governments (COGs) in the state have designated Transit Priority Areas or Smart Growth Incentive areas. However, since not all have done so, our Advisory Committee was not certain that project applicants in areas with certain regional infill policies should receive significantly more points than those in areas with supportive local plans or zoning ordinances. Our advisors generally felt that projects should be rewarded if the regional COG, the local government, or both, had a plan for infill or transit-oriented development that included the proposed TOD housing site. Thus, to reward both regional and local planning efforts, reflect SB 375’s new requirement for Metropolitan Planning Organizations (MPOs) to develop a Sustainable Communities Strategy, and reduce double-dipping on regional planning points, we recommend revising this section as follows:
The following point scores will be awarded to applications whose projects are located in:
(1) An area designated for infill or transit-oriented development in a regional plan adopted by the local council of governments, including a regional blueprint plan or Sustainable Communities Strategy – 10 points.
(2) An area designated for infill or transit-oriented development in the applicable local
general plan, a local specific plan, zoning ordinance, community plan, redevelopment plan, or transit village plan – 10 points.
Page 24 EEEEvaluation of California’s TODvaluation of California’s TODvaluation of California’s TODvaluation of California’s TOD Housing and IIGHousing and IIGHousing and IIGHousing and IIG ProgramsProgramsProgramsPrograms
8. Section 108(b)(3) Location in an Area Where There Is Coordinated Public and Private Investment
The first two rounds of TOD scoring gave 10 points to applications “where there is coordinated public and private investment in amounts sufficient to transform the area into a transit-oriented community, as evidenced by both of the following occurring within a half-mile radius of the Qualifying Transit Station:
(A) Expenditures or commitments of public funds during the ten years preceding the application due date on transit-oriented infrastructure or housing in the amount of at least $5 million; and
(B) The construction during the ten years preceding the application due date of privately owned transit-supportive uses with a gross floor area of at least 50,000 square feet (including developments under construction).”
Advisory Committee members suggested that $5 million spent on housing development and 50,000 square feet of retail might not be indicative of significant transformation of an area into a transit-oriented community. Instead, we recommended that HCD develop a specific measure by which project applicants could show the jurisdiction had a long-term commitment to layering and leveraging public and private investments to improve the area or neighborhood around the qualifying transit station or transit corridor.
9. Section 108(d) Transit-Supportive Land Use
Section 108(d) required applicants to identify and list in their application any of 25 specified “transit-supportive amenities and services” within a ½-mile of the Qualifying Transit Station. Ten distinct amenities and services received 15 points. The Advisory Committee first recommended that this measure be redefined to capture the area within ½-mile of the housing development, since it is the distance from where people live that determines whether they will walk to school, retail, recreation, entertainment, services, and other uses.
The Advisory Committee also sought to identify measures that would more-fully capture the defining characteristics of areas best suited for TOD. Different amenities have different values in promoting transit use and local walking trips. This measure should therefore assess whether or not the project area has a land-use mix and amenities that would specifically support transit and pedestrian trips, and reduce vehicle trips, rather than using a simple amenities checklist. Research and tools are evolving in this area. Such new research could provide more accurate measures of whether an area has a TOD-supportive land-use mix, design, and walkability than were available when the program first began. For example:
� Ongoing research and trip generation models may help to better pinpoint activity centers and amenities that are the best predictors of walking trips.
� A measure of retail jobs per household within ¼- to ½-mile of residences could be used as an amenity measure.
� In March 2007, Fehr and Peers developed several potentially useful criteria for AC Transit (in the East San Francisco Bay Area): an area density measure to assess if surrounding densities will support transit service, and a land-use mix tabulation to determine the extent of transit-compatible land uses near the project. They have since been working on a mixed-use development model.

� Walk Score (www.walkscore.com) is also evolving, and might in future be a more effective and simple way for project applicants to measure the walkability of the area in which they plan to develop.
Research and modeling is advancing on many of the elements that predict the success of TOD. We therefore recommended that HCD again consult with leading experts in the field at the point that program modifications are being considered to utilize the latest tools available to refine this scoring area. This would complement the measures in 108(e) that address the walkability of the path of travel between the housing development and the transit station. This effort could also take into account new data sources and/or assistance available to project applicants.
10. Section 108(e) The Extent to Which the Project Incorporates Walkable Corridor Features
Section 108(e) awarded points based on the extent to which the application demonstrates that specific features exist, or will exist upon project completion, in the primary walkable corridor between the housing development and the qualifying transit station. Five points were awarded for each of the following features:
(1) No more than 25% of the street blocks in the corridor exceed 500 feet in length. (2) The corridor is fully served by continuously paved, American Disabilities Act–compliant
sidewalks with a minimum width of 4 feet. (3) The corridor allows for safe pedestrian crossing of any arterials between the Housing
Development and the Transit Station and the corridor is adequately lighted to accommodate pedestrian use after dark.
(4) The Transit Station contains transit waiting facilities that are lighted and provide overhead shelter from outdoor elements.
(5) The Qualifying Transit Station has bicycle access and provides secure bicycle storage facilities, or the transit service allows bicycle conveyance on-board.
In the scoring system developed for AC Transit mentioned above, Fehr and Peers included two additional measures concerning walkability of the route to the transit station:
� Building setback and parking location, to reflect any setback and parking lot in front of the building that could create a barrier for pedestrians wishing to access transit services from the building.
� Whether building entrances provide entry from the sidewalk. We recommended that HCD consider adding Fehr and Peers two additional measures to 108(e) as walkable corridor measures between the housing development and public transit. Also, we recommend that walkability measures include the walkability of the neighborhood beyond the trip to the qualifying transit station, to include walking access to other transit services, including bus stops, or nearby amenities.
Page 25 EEEEvaluation of California’s TOD valuation of California’s TOD valuation of California’s TOD valuation of California’s TOD Housing and IIGHousing and IIGHousing and IIGHousing and IIG ProgramsProgramsProgramsPrograms

11. Section 108(f)(2) Transit Passes Section 108(f)(2) provided five points to applicants who provide residents with free transit passes or discounted passes priced at no more than half of the retail cost. The language read, “At least one transit pass shall be made available to each Restricted Unit for the term of the Program loan.” To implement this provision, HCD contracts require awardees to provide each household in an affordable unit a minimum of one, half-priced transit pass.
The five points awarded in this section can make the difference between receiving an award or not. One discounted transit pass per affordable household seemed minimal to our Advisory Committee for such a scoring advantage. HCD also did not require developers to provide transit passes to market-rate owners or renters, which seemed inequitable. Some of our advisors noted that long-term discount pass programs encourage transit use and enable low-income households to travel more frequently. However, some affordable homebuilders questioned whether they would be able to find the subsidy needed to cover a more-extensive transit-pass program, when it is already difficult for homebuilders to obtain all of the necessary financing and subsidies for affordable TODs to pencil out. For these reasons, we recommended deleting this scoring criteria.
12. Section 108(f)(3) and (f)(5) Shared Parking and Maximum Parking Spaces
Section 108(f)(3) awarded five points to “applications where the Housing Development provides parking that will be shared between different uses, such as parking that serves housing residents at night and retail customers by day.” While one residential-only project received an award, points for residential-only projects were more difficult to claim, as there were no on-site uses with which to share parking. Some advisers questioned whether HCD should advantage mixed-use over residential projects, or whether residential-only projects should be able to earn back these points in some fashion. We recommend changing the scoring to give these points to applications in which shared parking is not an option.
At the same time, Section 108(f)(5) specified that 10 points would be assigned to project applications that provide for no more than the following maximum parking spaces, excluding park-and-ride and transit station replacement parking.
Table 19 - TOD Maximum Parking Spaces
Project location
designation
Bedrooms per home
Maximum resident and guest parking spaces per home
Large city downtown
0-1 1
2+ 1.5
Urban center
0-1 1.25
2+ 1.75
All other areas
0-1 1.5
2+ 2
Page 27 EEEEvaluation of California’s TODvaluation of California’s TODvaluation of California’s TODvaluation of California’s TOD Housing and IIGHousing and IIGHousing and IIGHousing and IIG ProgramsProgramsProgramsPrograms

Parking supply has a significant impact on whether residents utilize transit or not. Advisors discussed the possibility of a sliding point scale for parking supply, since some projects contained no parking at all, while others offered the maximum number of spaces. However, some noted that local jurisdictions, not applicants, control parking standards for development projects. For AC Transit in the East San Francisco Bay Area, Fehr and Peers developed a different parking-supply measure, providing points based on the extent to which the project’s supply of parking is below, equal to, or greater than expected demand, based on rates published by the Urban Land Institute in their work on shared parking.
We recommended that HCD follow up with experts to determine the parking measure(s) that would best encourage a more-limited parking supply among TOD applicants to encourage residents’ transit usage and the efficient use of land for parking, while reflecting locational differences.
13. Section 108(k) Project Size In Round 2, Section 108(k) awarded
� 15 points to housing developments with 50–99 homes. � 20 points to those with 100–149 homes. � 25 points to developments with 150–199 homes. � 30 points to those with 200 or more homes.
Our Advisory Committee noted that projects along certain transit lines might not compete well because available parcels are too small for 50 apartments or condos. The Expo Line in Los Angeles is one example. We recommended that HCD add points for projects under 50 homes on small parcels that meet other TOD criteria. The program criteria also do not address differences in residential densities, which ranged from 32 homes per acre to 707 homes per acre. Projects also offered significant variations in the number of bedrooms per home, from studios to four bedrooms. Advisory Committee members noted the benefit of more people living near quality transit and of efficient use of available parcels. We therefore recommended adding scoring criteria and a point system to the TOD program to more fully capture residential density. This could also offset project-size point losses for small but very-dense projects. Advisors suggested devising the point scale based on the total number of bedrooms provided by the project divided by the acreage of the project, with more points provided to applicants with a higher number of bedrooms per acre. Such a point system should be designed — and likely tested with sample projects — to insure it takes into account the differences in the density and type of construction generally allowed by different jurisdictions.
14. Section 108(l) Economic Development Plan
Section 108(l) was added in Round 2 to read:
(1) 10 points shall be awarded to applications for Projects located in jurisdictions that have adopted a general plan economic development element.
Page 28 EEEEvaluation of California’s TOD valuation of California’s TOD valuation of California’s TOD valuation of California’s TOD Housing and IIGHousing and IIGHousing and IIGHousing and IIG ProgramsProgramsProgramsPrograms

(2) 5 points shall be awarded to applications for Projects located in jurisdictions that have integrated economic development strategies, are in a state-approved Enterprise Zone, or are in an eligible New Market Tax Credit census tract.
Our Advisory Committee noted that an economic development element may have little impact on where jobs are going, and could have little or nothing to do with transit service. Therefore, we recommend the transit connectivity measure to jobs and education, discussed above in section 108(a)(1) as a stronger way of assessing the employment linkage of the TOD project, and therefore recommended deleting 108(l) as a scoring measure.
15. Section 108(m) Economic Stimulus Funding
This section awarded points for obtaining a commitment or commitments of state or locally administered funds authorized under the 2009 federal economic stimulus package. We recommend deleting this section because it is unclear when and if there will be more federal stimulus funding.
VIII. Conclusion
Overall, both the Infill Infrastructure Grant Program and Transit-Oriented Development Program increased the supply of homes affordable to low-income Californians. Housing California commends the California Department of Housing and Community Development for its extraordinary work implementing these two new programs and looks forward to working closely on shaping future rounds of funding.
Page 29 EEEEvaluation of California’s TODvaluation of California’s TODvaluation of California’s TODvaluation of California’s TOD Housing and IIGHousing and IIGHousing and IIGHousing and IIG ProgramsProgramsProgramsPrograms

Round 1 Criteria
Transit-Oriented Development (TOD) Housing Program Department of Housing and Community Development (HCD)
For complete guidelines, see: http://www.hcd.ca.gov/fa/tod/TOD_Housing_Program_Guidelines.pdf
Key Threshold Requirements To be eligible, a housing development had to:
� Consist of new construction or substantial rehabilitation or conversion of non-residential structure(s) to residences, with at least 50 rental and/or homeownership housing units.
� Be located within one of 27 specified urbanized areas. � Be located within 1/4-mile of a Qualifying Transit Station (e.g., heavy or light rail station,
bus rapid transit station, bus transfer station, bus hub). � Restrict a minimum of 15% of the housing units to low- or very–low-income residents. � Have a density of at least 25–60 units/acre (based on location).
To be eligible, an infrastructure project had to provide substantial benefit to one such housing development, and include:
� Capital improvements required by a local government entity, transit agency, or special district as a condition for building the housing development; and/or
� Capital improvements that substantially enhance pedestrian or bicycle access between the housing development and the nearest transit station.
Applicant Scoring:
108(a) Extent will increase public transit ridership, minimize auto trips 110
(1) Peak period frequency of 12 minutes or less, or specified on-time performance.
20-30
(2) Specified travel time ratio: transit vs. auto. 15-20
(3) Electronic user information at transit station. 4
(4) Current schedules and maps posted at transit station. 1
(5) Population density within 4 mile radius of transit station. 19-55
108(b) Location in area designated for infill or TOD 40
(1) Designated for infill development through a COG regional plan policy 20 (2) In an area designated for TOD in one/more specified plans. 10 (3) Evidence of coordinated public/private investment. 10
108(c) Affordability 30
Percentage of rental or ownership homes to be developed that will be restricted to occupancy by various income groups.
.13-30
108(d) Transit-Supportive land use 15
At least 10 distinct transit-supportive amenities within ½ mile 15
Appendix A EEEEvaluation of California’svaluation of California’svaluation of California’svaluation of California’s TODTODTODTOD Housing andHousing andHousing andHousing and IIGIIGIIGIIG ProgramsProgramsProgramsPrograms

108(e) Extent project incorporates walkable corridor features 25
(1) No more than 25% of street blocks exceed 500’ in length 5
(2) Corridor fully served by continuous paved, ADA-compliant sidewalks 5
(3) Safe pedestrian crossing of any arterials between housing development and transit station.
5
(4) Station with waiting facilities with lighting and overhead shelter. 5
(5) Corridor is adequately lighted for pedestrians after dark 5
108(f) Parking 20
(1) Housing development parking is charged separately and covers costs 5
(2) Residents to receive at least one free/discounted transit pass for term of loan period.
4
(3) Shares parking between different uses. 2
(4) Dedicates parking spaces for car share vehicles. 2
(5) Meets specified maximum parking spaces for location and bedrooms. 7
108(g) Readiness 30
(1) Enforceable commitments for all construction period funding. 8
(2) Completion of draft or all environmental clearances. 4 or 7
(3) All necessary and discretionary land use approvals excluding building permits and other ministerial approvals.
8
(4) Has one of the following: developer has fee title ownership or long-term leasehold; local design review approval obtained or not required; or all deferred payment grants and subsidies committed as allowed by TCAC.
7
108(h) Leverage of permanent development funds over TOD funds > 100% 15
Permanent development funding as percent of requested program funds.
.75 points for each 10% increment over 100%
108(i) Developer past performance 30
(1) Large/similar infill developments by applicant in past five years. 10 each (2) Project is a joint development and developer has done a
successful one in the last five years 10
(3) Deductions for specified poor performance or non-performance -5 each (up to -50)
108(j) Community Support through a documented, inclusive process 15
108(k) Project Size 30
(1) 200 or more residential units 30
(2) 100-199 residential units 15
Maximum Points Possible 350
Appendix A EEEEvaluation of California’s TOD valuation of California’s TOD valuation of California’s TOD valuation of California’s TOD Housing and IIGHousing and IIGHousing and IIGHousing and IIG ProgramsProgramsProgramsPrograms

Round 2 Criteria
Transit-Oriented Development (TOD) Housing Program Department of Housing and Community Development (HCD)
For complete guidelines, see: http://hcd.ca.gov/fa/tod/SECOND_ROUND_TOD_HOUSING_PROGRAM_GUIDELINES_FINAL.pdf
Key Threshold Requirements To be eligible, a housing development must:
� Consist of new construction or substantial rehabilitation or conversion of non-residential structure(s) to residences, with at least 50 rental and/or homeownership housing units.
� Be located within one of 28 specified urbanized areas. � Be located within 1/4-mile of a Qualifying Transit Station (e.g., heavy or light rail station,
bus rapid transit station, bus transfer station, bus hub). � Restrict a minimum of 15% of the housing units to low- or very–low-income residents. � Have a density of at least 25–60 units/acre (based on location).
To be eligible, an infrastructure project must provide substantial benefit to one such housing development, and include:
� Capital improvements required by a local government entity, transit agency, or special district as a condition to development of the housing development; and/or
� Capital improvements that clearly and substantially enhance public pedestrian or bike access between the housing development(s) and the nearest transit station.
Applicant Scoring:
108(a) Extent will increase public transit ridership, minimize auto trips 90
(1) Peak period frequency of 12 minutes or less, or specified on-time performance.
30
(2) Electronic user information at transit station. 4
(3) Current schedules and maps posted at transit station. 1
(4) Population density within 4 mile radius of transit station. 19-55
108(b) Location in area designated for infill or TOD 40
(1) Designated for infill development through a COG regional plan policy 20 (2) In an area designated for TOD in one/more specified plans or
programs. 10
(3) Evidence of coordinated public/private investment. 10
108(c) Affordability 30
Percentage of rental or ownership homes to be developed that will be restricted to occupancy by various income groups.
.13-30
108(d) Transit-Supportive land use 15
At least 10 transit-supportive amenities within ½ mile. 15
Appendix B EEEEvaluation of California’s TODvaluation of California’s TODvaluation of California’s TODvaluation of California’s TOD Housing and IIGHousing and IIGHousing and IIGHousing and IIG ProgramsProgramsProgramsPrograms

108(e) Extent project incorporates walkable corridor features 25
(1) No more than 25% of street blocks exceed 500’ in length. 5
(2) Corridor fully served by continuous paved, ADA-compliant sidewalks. 5
(3) Safe pedestrian crossing of any arterials between housing and transit station, and corridor adequately lighted for pedestrians after dark.
5
(4) Station with waiting facilities with lighting and overhead shelter. 5
(5) Transit station has bicycle access and provides secure bike storage or transit agency allows bikes on board.
5
108(f) Parking 30
(1) Housing development parking is charged separately and covers costs. 5
(2) Residents to receive at least one free/discounted transit pass for term of loan period.
5
(3) Shares parking between different uses. 5
(4) Dedicates parking spaces for car share vehicles. 5
(5) Meets specified maximum parking spaces for location and bedrooms. 10
108(g) Readiness 30
(1) Enforceable commitments for all construction period funding. 8
(2) Completion of draft or all environmental clearances. 4 or 7
(3) All necessary discretionary land use approvals granted excluding design review.
8
(4) Has one of the following: developer has fee title ownership or long-term leasehold; local design review approval obtained or not required; or all deferred payment grants and subsidies committed as allowed by TCAC.
7
108(h) Leverage of permanent development funds over TOD funds > 100% 15
Permanent development funding as percent of requested program funds.
.75 points for each 10% increment over 100%
108(i) Developer past performance 30
(1) Large/similar infill developments by applicant in past five years. 10 each
(2) Project is a joint development and developer has done a successful one in the last five years
10
(3) Deductions for specified poor performance or non-performance -5 each (up to -50)
108(j) Community Support through a documented, inclusive process 15
Appendix B EEEEvaluation of California’s TODvaluation of California’s TODvaluation of California’s TODvaluation of California’s TOD Housing and IIGHousing and IIGHousing and IIGHousing and IIG ProgramsProgramsProgramsPrograms

108(k) Project Size 30
(1) 200 or more residential units 30
(2) 150 to 199 residential units 25
(3) 100-149 residential units 20
(4) 50 to 99 residential units 15
108(l) Adopted Economic Development Plan 10
(1) Jurisdiction with adopted general plan economic development element. 10 (2) Jurisdiction with integrated economic development strategies; in state-
approved Enterprise Zone; or in eligible New Market Tax Credit census tract. 5
108(m) Economic Stimulus Funding/Local Support 20
(1) Project with federal stimulus funds equaling at least 20% of HCD request. 20
(2) Project with federal stimulus funds equaling at least 15% of HCD request. 12
(3) Project with federal stimulus funds equaling at least 10% of HCD request. 8
Maximum Points Possible 350
Appendix B EEEEvaluation of California’s TODvaluation of California’s TODvaluation of California’s TODvaluation of California’s TOD Housing and IIGHousing and IIGHousing and IIGHousing and IIG ProgramsProgramsProgramsPrograms

Round 1 Criteria
Infill Infrastructure Grant (IIG) Program Department of Housing and Community Development (HCD)
For complete guidelines, see: http://www.hcd.ca.gov/fa/iig/IIG_Guidelines_022808.pdf
Key Threshold Requirements:
To be eligible, a capital improvement project had to be an integral part of, or necessary to facilitate, the development of a “Qualifying Infill Project” (QIP) or “Qualifying Infill Area” (QIA). The QIP or QIA must: � Be located within an urbanized area. � Be in a locality with an adopted Housing Element (required part of the city/county General
Plan) found by the state to be in substantial compliance with state Housing Element requirements.
� Develop a minimum of 15% of the housing units as affordable (no more than 60% of area median income for rentals, or 120% of area median income for ownership).
� Have average, minimum net densities above or equal to California’s Housing Element default densities for accommodating lower-income households (10–30 units/acre, depending on location).
� Be in an area designated for mixed-use or residential development. � Meet one of three definitions of “infill.” (See Appendix C for definitions.)
A QIA also had to include within its boundaries a QIP that does not contain more than 50% of the total housing units proposed for the QIA and that has received all land use entitlements or has a complete application pending before the appropriate jurisdiction A QIP had to be a discrete development with a common development scheme and common or related ownership and financing.
Applicant Scoring — Qualifying Infrastructure Area (QIA)
309(a) Readiness 30
(1) Adopted, certified, or draft program, master, or tiered EIR; or not less than 50% of QIA land area on sites that have been subject to Phase I Site Assessment within prior one year.
2-8
(2) All necessary and discretionary land use approvals granted for not less than 1/2 or1/3 of housing units proposed for development in QIA; QIA is subject to general, specific, redevelopment area, community or other area-specific plan, and housing is consistent with plan; or all approvals granted for Community Improvement Project (CIP) within QIA.
2-8
(3) Committed construction funding for residential units and/or CIP; documentation of interest or intent to fund CIP.
2-8
(4) Local support: City Council/Board of Supervisors letter of support; at least 50% of residential units on site(s) in housing element; or local funding commitment(s) for CIP for at least 25% of grant amount.
6
Appendix C EEEEvaluation of California’s TODvaluation of California’s TODvaluation of California’s TODvaluation of California’s TOD Housing and IIGHousing and IIGHousing and IIGHousing and IIG ProgramsProgramsProgramsPrograms

309(b) Affordability 30
Percentage of rental or ownership homes to be developed in the QIA that will be restricted to occupancy by various income groups.
1-30
309(c) Adjusted net density as percentage of required density 20
300% or more 20
250-299.9% 15
200-249.9% 10
150-199.9% 7.5
110-149.9% 5
Less than 110% 0
309(d) Access to Transit 20
Percentage of residential units in QIA within ½ mile walk of transit station or major transit stop, relative to total residential units in QIA
2 per each 10%
309(e) Proximity to specified amenities within QIA or ½ mile of QIA boundary 20
6 or more amenities per 10 acres 20
2 to 5 amenities per 10 acres 10
309(f) Consistency with COG Regional Blueprint or Growth Plan 10
Maximum Points Possible 130
Applicant Scoring — Qualifying Infill Project (QIP):
308(a) Readiness 30
(1) Completion of all necessary environmental clearances; issuance of public notice of availability of draft EIR, negative declaration, or environmental assessment, or Phase I/II Site Assessment within one year prior to application and approved remediation plan.
2-8
(2) All necessary discretionary land use approvals granted; or consistent with local plans, zoning ordinances and applications submitted for all necessary discretionary local land use approvals.
2-8
(3) Committed construction period funding for QIP and/or CIP. 4-8
(4) Local support – one of following: City Council/Board of Supervisors/Planning Department support letter; QIP is on site designated or identified in housing element; has all discretionary local land use approvals and local public funding commitments; or funding commitment(s) for CIP equaling at least 25% of requested grant amount.
6
Appendix C EEEEvaluation of California’s TOD valuation of California’s TOD valuation of California’s TOD valuation of California’s TOD Housing and IIGHousing and IIGHousing and IIGHousing and IIG ProgramsProgramsProgramsPrograms

308(b) Affordability 30
Percentage of rental or ownership homes to be developed in the QIA that will be restricted to occupancy by various income groups.
.13-30
308(c) Adjusted net density as percentage of required density 20
150% or more 20
140-149.9% 15
130-149.9% 10
120-129.9% 7.5
110-119.9% 5
below 110% 0
308(d) Access to Transit 20
(1) within ½ mile walk of transit station or major transit stop 20 (2) within 1mile walk of transit station or major transit stop 10
(e) Proximity to specified amenities 20
(1) Within ¼ or ½ mile of public park (½ mile or 1 mile for rural projects) 6 or 4
(2) Within 1 or 2 miles of locally recognized employment center with minimum 50 full-time employees (2 or 4 miles for rural area projects)
7 or 4
(3) Within 1 or 2 miles of locally recognized retail center with minimum 50 full-time employees (2 or 4 miles for rural area projects).
7 or 4
(4) If 50% of QIP residences have 2 or more bedrooms, is within ¼- or ½- mile of public school/community college (½-or 1-mile for rural areas).
7 or 4
(5) If project provides special needs, SRO or supportive housing, is within ½- or 1-mile of social service facility that serves residents of QIP.
7 or 4
(6) If project is senior housing, is within ¼ or ½ mile of senior center or senior service facility (½ mile or 1 mile for rural projects)
7 or 4
(f) Consistency with COG Regional Blueprint or Growth Plan 10
Maximum Points Possible 130
Appendix C EEEEvaluation of California’s TODvaluation of California’s TODvaluation of California’s TODvaluation of California’s TOD HousiHousiHousiHousing and IIGng and IIGng and IIGng and IIG ProgramsProgramsProgramsPrograms

Round 2 Criteria
Infill Infrastructure Grant (IIG) Program Department of Housing and Community Development (HCD)
For complete guidelines, see: http://hcd.ca.gov/fa/iig/Full_IIG_Guidelines_013009.pdf
Key Threshold Requirements
To be eligible, a capital improvement project (CIP) must be an integral part of, or necessary for, the development of a “Qualifying Infill Project” (QIP) or the housing designated in the application for a “Qualifying Infill Area” (QIA). The QIP or QIA must: � Be located in an urbanized area. � Be in a locality with an adopted Housing Element found by the state to be in substantial
compliance with state Housing Element requirements. � Include a minimum of 15% of the housing units as affordable (no more than 60% of area
median income for rentals, or 120% of area median income for ownership), excluding required replacement housing units.
� Include average, minimum net densities above or equal to California’s Housing Element default densities for accommodating lower-income households (10–30 units/acre, depending on location).
� Be in an area designed for mixed-use or residential development pursuant to one of four specified adopted plans.
� Meet one of three definitions of “infill.” (See Appendix C for definitions.)
A QIA must be a contiguous, coherent area treated as a discrete planning area, without extensions or satellite areas included solely to meet program requirements. A QIA must include within its boundaries a QIP that does not contain more than 50% of the total housing units proposed for the QIA and that has received all land use entitlements or has a complete application pending before the appropriate jurisdiction. A QIP must be a discrete development with all housing development components planned as one development. A QIP must also have a common, affiliated, or contractually related ownership and financing structure.
Appendix D EEEEvaluation of California’s TOD valuation of California’s TOD valuation of California’s TOD valuation of California’s TOD Housing and IIGHousing and IIGHousing and IIGHousing and IIG ProgramsProgramsProgramsPrograms

Applicant Scoring — Qualifying Infrastructure Area (QIA):
310(a) Readiness 90
(1) Adopted, certified, or draft program, master, or tiered EIR, or not less than 50% of QIA land area on sites that have been subject to Phase I Site Assessment within prior 1 year
5-25
(2) All necessary discretionary land use approvals granted for not less than 1/2 or1/3 of housing units proposed for development in QIA; QIA is subject to adopted general, specific, redevelopment area, community or similar area-specific plan, and housing is consistent with such plan; or all approvals granted for Community Improvement Project (CIP) within the QIA.
5-25
(3) Enforceable commitments for construction period funding for residential units and/or CIP; or letters of interest or intent to fund CIP
5-20
(4) Stimulus funding of at least 10-20% of requested grant amount; local funding commitment(s) for QIA and/or CIP of at least 15-25% of grant amount; at least 50% of homes on site(s) identified in housing element or Council/Board/Planning Director letter of support.
3-20
310(b) Affordability 60
Percentage of rental or ownership homes to be developed in the QIA that will be restricted to occupancy by various income groups.
2-60
310(c) Adjusted net density as percentage of required density 40
200% or more 40 175-199.9% 30
150-174.9% 20
125-149.9% 15
110-124.9% 10
Less than 110% 0
310(d) Access to Transit 20
Percentage of residential units in QIA within ½ mile walk of transit station or major transit stop, relative to total residential units in QIA
2 per each 10%
310(e) Proximity to amenities 20
Specified amenities (e.g., parks employment centers, retail centers, public schools/colleges, social services, senior centers) within QIA or within ½ mile of QIA boundary.
2- 4 each
310(f) Consistency with COG Regional Blueprint or Growth Plan 20
Maximum Points Possible 250
Appendix D EEEEvaluation of California’s TODvaluation of California’s TODvaluation of California’s TODvaluation of California’s TOD Housing and IIGHousing and IIGHousing and IIGHousing and IIG ProgramsProgramsProgramsPrograms

Applicant Scoring — Qualifying Infrastructure Project (QIP):
309(a) Readiness 90
(1) Completion of all necessary environmental clearances or mitigated negative declaration; public notice of draft EIR, negative declaration, or environmental assessment; or Phase I/II Site Assessment
5-25
(2) All necessary discretionary land use approvals; applications for approvals deemed complete; or consistent with local planning documents and zoning
5-25
(3) 50-95% of construction and/or permanent period funding commitments for CIP and QIP, with specified exceptions.
5-20
(4) Stimulus funding of at least 10-20% of requested grant amount; local funding commitment(s) for QIA and/or CIP of at least 15-25% of grant amount; QIP on site identified in housing element or Council/Board/Planning Director letter of support.
3-20
309(b) Affordability 60
Percentage of rental or ownership homes to be developed that will be restricted to occupancy by various income groups.
2-60
309(c) Adjusted net density as percentage of required density 40
150% or more 40 140-149.9% 30
130-139.9% 20
120-129.9% 15
110-119.9% 10
Less than 110% 0
309(d) Access to Transit 20
Within ½ mile walk of transit station or major transit stop with 6-12 departures as specified during peak AM and PM hours.
20
Within 1 mile walk of transit station or major transit stop with 6-12 departures as specified during peak AM and PM hours.
10
Within 1 mile walk of transit station or major transit stop in a rural area with at least 2 departures during both AM and PM peaks, or at least 4 departures during AM and PM peaks in a locality with population over 40,000 to 100,000.
5
Appendix D EEEEvaluation of California’s TODvaluation of California’s TODvaluation of California’s TODvaluation of California’s TOD Housing and IIGHousing and IIGHousing and IIGHousing and IIG ProgramsProgramsProgramsPrograms

309(e) Proximity to amenities 20
(A) within ¼ or ½ mile of public park (½ mile or 1 mile for rural projects) 6 or 4
(B) within 1 or 2 miles of locally recognized employment center with minimum 50 full-time employees (2 or 4 miles for rural area projects)
7 or 4
(C) within 1 or 2 miles of locally recognized retail center with minimum 50 full-time employees (2 or 4 miles for rural area projects)
7 or 4
(D) if 50% of QIP residences have 2 or more bedrooms, is within ¼ or ½ mile of public school or community college (½ mile or 1 mile for rural projects)
7 or 4
(E) if project provides special needs, SRO or supportive housing, is within ½ mile or 1 mile of social service facility that serves residents of QIP
7 or 4
(F) if project is senior housing, is within ¼ or ½ mile of senior center or senior service center (½ mile or 1 mile for rural projects)
7 or 4
309(f) Consistency with COG Regional Blueprint or Growth Plan 20
Maximum Points Possible 250
Appendix D EEEEvaluvaluvaluvaluation of California’s TODation of California’s TODation of California’s TODation of California’s TOD Housing and IIGHousing and IIGHousing and IIGHousing and IIG ProgramsProgramsProgramsPrograms

Infill Definition for "Qualified Infill Areas" (QIAs) or "Qualified Infill Projects" (QIPs) from page 7, http://www.hcd.ca.gov/fa/iig/IIG_Guidelines_022808.pdf
(6) Have any of the following:
(A) at least 75% of the area included within the Qualifying Infill Project or Qualifying Infill Area as previously improved (including areas where improvements have been demolished) or used for any use other than open space, agriculture, forestry, or mining waste storage; or (B) at least 75% of the perimeter of the Qualifying Infill Project or Qualifying Infill Area adjoining parcels that are developed with Urban Uses, or is separated from parcels that are developed with Urban Uses only by an improved public right-of-way. In calculating this percentage, perimeters bordering navigable bodies of water and improved parks shall not be included; or (C) the combination of at least 50% of the area included within the Qualifying Infill Project or Qualifying Infill Area as previously improved (including areas where improvements have been demolished) or used for any use other than open space, agriculture, forestry or mining waste storage, and at least 50% of the perimeter of the Qualifying Infill Project or Qualifying Infill Area adjoining parcels that are developed with Urban Uses, or is separated from parcels that are developed with Urban Uses only by an improved public right-of-way. In calculating this percentage, perimeters bordering navigable bodies of water and improved parks shall not be included.
Appendix E EEEEvaluation of California’s TODvaluation of California’s TODvaluation of California’s TODvaluation of California’s TOD Housing and IIGHousing and IIGHousing and IIGHousing and IIG ProgramsProgramsProgramsPrograms
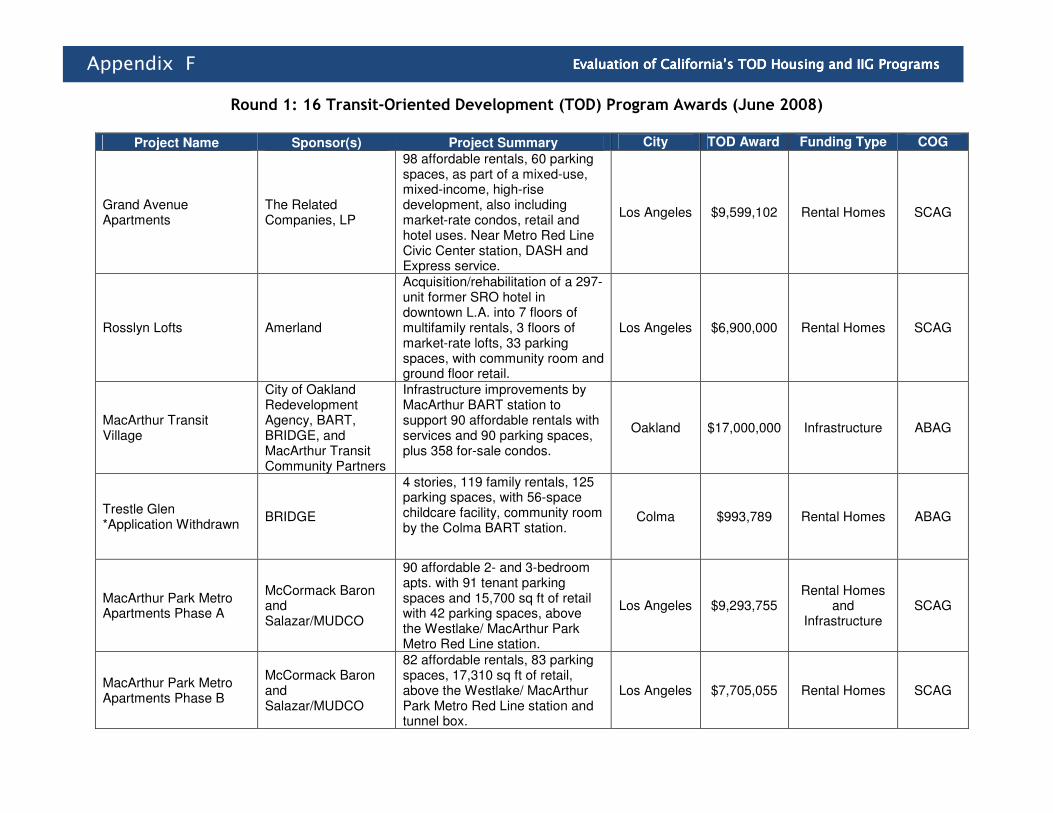
Round 1: 16 Transit-Oriented Development (TOD) Program Awards (June 2008)
Project Name Sponsor(s) Project Summary City TOD Award Funding Type COG
Grand Avenue Apartments
The Related Companies, LP
98 affordable rentals, 60 parking spaces, as part of a mixed-use, mixed-income, high-rise development, also including market-rate condos, retail and hotel uses. Near Metro Red Line Civic Center station, DASH and Express service.
Los Angeles $9,599,102 Rental Homes SCAG
Rosslyn Lofts Amerland
Acquisition/rehabilitation of a 297-unit former SRO hotel in downtown L.A. into 7 floors of multifamily rentals, 3 floors of market-rate lofts, 33 parking spaces, with community room and ground floor retail.
Los Angeles $6,900,000 Rental Homes SCAG
MacArthur Transit Village
City of Oakland Redevelopment Agency, BART, BRIDGE, and MacArthur Transit Community Partners
Infrastructure improvements by MacArthur BART station to support 90 affordable rentals with services and 90 parking spaces, plus 358 for-sale condos.
Oakland $17,000,000 Infrastructure ABAG
Trestle Glen *Application Withdrawn
BRIDGE
4 stories, 119 family rentals, 125 parking spaces, with 56-space childcare facility, community room by the Colma BART station.
Colma $993,789 Rental Homes ABAG
MacArthur Park Metro Apartments Phase A
McCormack Baron and Salazar/MUDCO
90 affordable 2- and 3-bedroom apts. with 91 tenant parking spaces and 15,700 sq ft of retail with 42 parking spaces, above the Westlake/ MacArthur Park Metro Red Line station.
Los Angeles $9,293,755 Rental Homes
and Infrastructure
SCAG
MacArthur Park Metro Apartments Phase B
McCormack Baron and Salazar/MUDCO
82 affordable rentals, 83 parking spaces, 17,310 sq ft of retail, above the Westlake/ MacArthur Park Metro Red Line station and tunnel box.
Los Angeles $7,705,055 Rental Homes SCAG
Appendix F EEEEvaluation of California’s TODvaluation of California’s TODvaluation of California’s TODvaluation of California’s TOD Housing and IIGHousing and IIGHousing and IIGHousing and IIG ProgramsProgramsProgramsPrograms

Project Name
Sponsor(s) Project Summary City TOD Award
Funding Type
COG
San Leandro Crossings City of San Leandro and BRIDGE
100 affordable multifamily rentals, 200 for-sale units, 390 parking spaces, with approx. 5,000 sq ft of retail/commercial space, a block from the San Leandro BART station.
San Leandro $12,000,000 Infrastructure ABAG
Lion Creek Crossing City of Oakland, Related Co., and EBALDC
72 affordable rentals, 72 parking spaces, near Coliseum BART station, AC Transit bus transfer station, and Amtrak Capital Corridor stop.
Oakland $7,527,592 Rental Homes
ABAG
Coliseum BART Station Transit Village
City of Oakland, Related Co., and EBALDC
28 for-sale homes, 100 market-rate rentals, plus from above Lion Creek Crossing's 72 affordable rentals and 72 parking spaces, near Coliseum BART station.
Oakland $8,485,000 Rental Homes
ABAG
Bonnie Brae Apartments American Communities
6 stories, 53 apartments, 53 parking spaces, community room with on-site classes, in Westlake community near Red Line Metro and 6th St. bus lines.
Los Angeles $4,633,933 Rental Homes
SCAG
Appendix F Appendix F EEEEvaluation of California’s TODvaluation of California’s TODvaluation of California’s TODvaluation of California’s TOD Housing and IIHousing and IIHousing and IIHousing and IIGGGG ProgramsProgramsProgramsPrograms

Project Name Sponsor(s) Project Summary City TOD Award Funding Type COG
Armstrong Place Senior Housing
BRIDGE
116 affordable senior apartments, 29 parking spaces, ground floor retail and community space, one block from the Caroll St. Station on MUNI’s Metro T-THIRD line.
San Francisco
$9,106,517 Rental Homes ABAG
Union City Intermodal Station District
Union City and Barry Swenson Builder
2 high-rise towers and 4 mid- rise buildings with 462 market-rate homes, 160 affordable rentals,
786 parking spaces, 33,617 sq ft of retail, 10,210 sq ft of business lofts, within 1/4 mile of Intermodal
station to be served by BART, passenger rail and bus. (Eventual proposed total of 1,200 homes on 9 acres, with 55,500 sq ft retail.)
Union City $7,637,102 Infrastructure ABAG
Ten Fifty B City of San Diego
and Affirmed Housing
23 stories, 226 affordable rentals, 3 manager units, 126 parking
spaces, located two blocks from City College Trolley Station.
San Diego $4,002,240 Infrastructure SANDAG
Commercial 22 City of San Diego
and BRIDGE
127 rentals for families at 30-60% AMI; 70 rentals for seniors at 30-50% AMI; 38 live-work lofts; for-
sale rowhouses; 333 parking spaces, with childcare,
commercial/retail and office space.
San Diego $17,000,000 Rental Homes
and Infrastructure
SANDAG
Chinatown Blossom Plaza
City of Los Angeles and Bond
Companies
53 affordable rentals, 209 market-rate rentals, 372 parking spaces (175 for public use), with 20,000
sq ft cultural plaza, 40,000 sq ft of retail, by Chinatown Metro Rail
Station.
Los Angeles $6,115,915 Rental Homes
and Infrastructure
SCAG
Appendix F EEEEvaluation of California’s TODvaluation of California’s TODvaluation of California’s TODvaluation of California’s TOD Housing and IIGHousing and IIGHousing and IIGHousing and IIG ProgramsProgramsProgramsPrograms
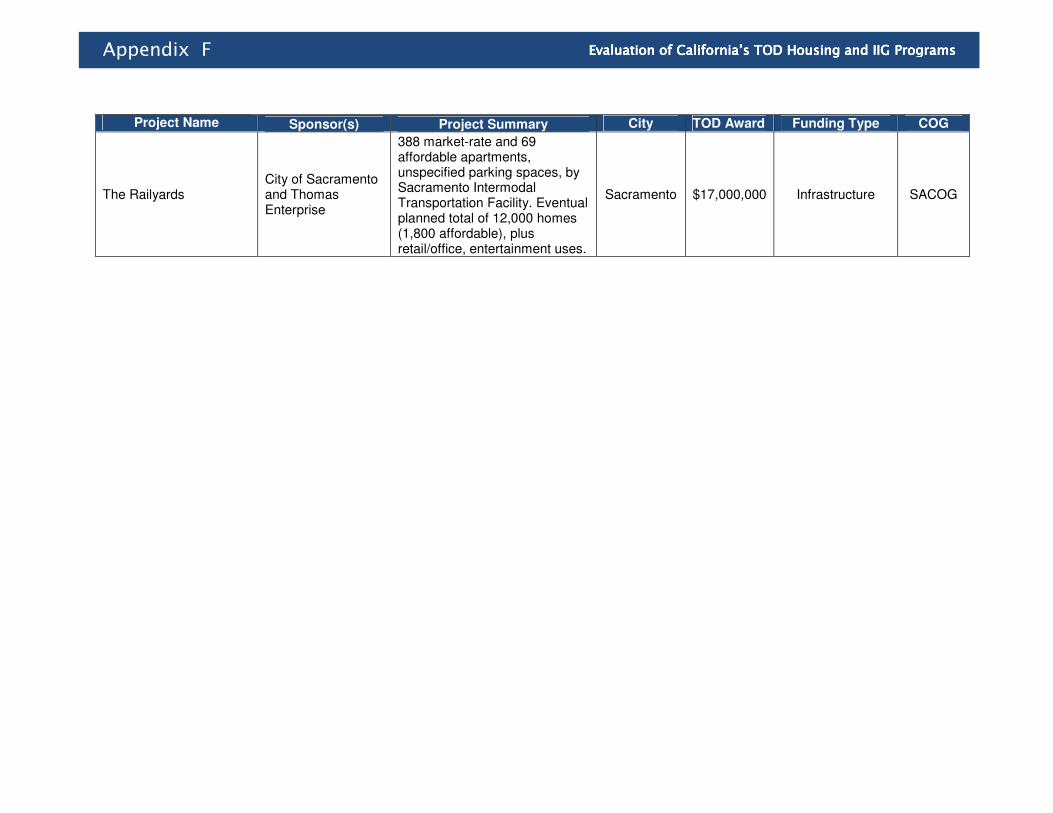
Project Name Sponsor(s) Project Summary City TOD Award Funding Type COG
The Railyards City of Sacramento and Thomas Enterprise
388 market-rate and 69 affordable apartments, unspecified parking spaces, by Sacramento Intermodal Transportation Facility. Eventual planned total of 12,000 homes (1,800 affordable), plus retail/office, entertainment uses.
Sacramento $17,000,000 Infrastructure SACOG
Appendix F EEEEvaluation of California’s TODvaluation of California’s TODvaluation of California’s TODvaluation of California’s TOD Housing and IIGHousing and IIGHousing and IIGHousing and IIG ProgramsProgramsProgramsPrograms

Round 2: 16 Transit-Oriented Development (TOD) Program Awards (June 2009)
Project Name Sponsor(s) Brief Project Description City
Qualifying Transit Mode/ Station
Total Award Funding Type
Golden Gate Avenue (Central YMCA)
Tenderloin Neighborhood Development Corp.
9 stories, 174 rehabilitated studio rentals, 0 parking spaces, at Golden Gate Avenue YMCA. Targeted to formerly homeless households, including those with HIV/AIDs, at 50% of AMI or less. In the Tenderloin District near retail, services, bus/light rail/ BART. Includes supportive services, child care and wellness centers, and neighborhood retail.
San Francisco
Heavy Rail: Civic Center
BART $17,000,000 Rental Housing
1000 Fourth Street Family Housing
Mercy Housing California, Mission Bay Development Corp & Mayor's Office of Housing, City and County of San Francisco
150 rentals targeted to families at 15%-50% of AMI, 58 parking spaces, 9000 sf of retail as part of planned 4th St. retail corridor, less than 1/4 mile from light rail station. Part of SF's Mission Bay South planned for 6,000 homes (28% affordable), 6 million sf of office, commercial, technology uses, UCSF research campus, 800K sf city/neighborhood retail, 500-room hotel, 49 acres of open space, public school, across from Mission Creek Park.
San Francisco
Light Rail: MUNI Fourth
and King $17,000,000
Rental Housing and Housing Infrastructure
Appendix G EEEEvaluation of California’s TOD valuation of California’s TOD valuation of California’s TOD valuation of California’s TOD Housing and IIGHousing and IIGHousing and IIGHousing and IIG ProgramsProgramsProgramsPrograms
Appendix G EEEEvaluation of California’s TODvaluation of California’s TODvaluation of California’s TODvaluation of California’s TOD Housing and IIGHousing and IIGHousing and IIGHousing and IIG ProgramsProgramsProgramsPrograms

Project Name Sponsor(s) Brief Project Description City
Qualifying Transit Mode/ Station
Total Award Funding Type
South Hayward BART Mixed Use - Family &
Senior
Eden Housing, Inc., Wittek Development, LLC & The Montana Property Group, LLC
Two buildings, 206 affordable rentals (125 for families at 20-50% of AMI, and 81 for seniors at 30-50% of AMI ), 204 parking spaces, above Safeway grocery store, across from South Hayward Bart Station.
Hayward
Heavy Rail: South
Hayward BART
$17,000,000 Rental Housing
Curtis Park Village City of Sacramento on Calvine & Elk Grove-Florin, LLC
131 market-rate ownership condos/townhomes, 90 affordable rentals targeted to seniors 55+ at 30-50% of AMI, 197 parking spaces. Part of 72-acre site planned for single- and multi-family and senior housing, with bridge connection to City College Light Rail Station, 60 parking spaces. Surrounded by Curtis Park neighborhoods on north and east, near neighborhood retail.
Sacramento Light Rail:
City College Station
$9,085,000 Housing
Infrastructure
Appendix G EEEEvaluation of California’s TODvaluation of California’s TODvaluation of California’s TODvaluation of California’s TOD Housing and IIGHousing and IIGHousing and IIGHousing and IIG ProgramsProgramsProgramsPrograms

Project Name Sponsor(s) Brief Project Description City
Qualifying Transit Mode/ Station
Total Award Funding Type
Blvd 6200 - North Foundation for
Affordable Housing V, Inc
4 buildings, 535 total rentals (108 targeted to families at 35-50% of AMI plus 18 live-work rentals);
70,649 sf commercial/ retail space, 585 resident/781 commercial
parking spaces, 7,000 sf pedestrian plaza, across the street from
Hollywood/Vine Metro Red Line Transit Station.
Hollywood
Heavy Rail: Hollywood/ Vine Red Line
$11,567,860 Rental Housing
5555 Hollywood
Meta Housing Corp., Western
Community Housing, Inc &
KD Housing Partners, Inc
5 stories, 120 rentals for seniors 55+ at 30% or 50% of AMI; 162 parking spaces, on-site senior programs, 6000 sf ground-floor
retail. In "Little Armenia" area, one block from Red Line station, within 1
mile of retail/services.
Los Angeles
Metro Red Line: Hollywood/ Western Station
$9,000,000 Rental Housing
Chinatown Metro Apts
Meta Housing Corp, Western
Community Housing Corp,
Value Housing II, LLC
Adaptive reuse of 1923 six-story and 1916 nine-story concrete
buildings into 123 rentals for seniors at 35-60% of AMI; zero parking
spaces. In LA's Chinatown neighborhood within 1/4 mile of light
rail, and 1 mile of retail and services.
Los Angeles
Light Rail: Chinatown Station
$3,614,848
Of larger request for
Rental Housing, Housing and
Transit Access Infrastructure, and Land Acq.
Long Beach & Anaheim TOD
Meta Housing Corp,, Western
Community Housing Inc., City
of Long Beach
5 buildings, 356 total homes: 170 condos with 40 for moderate-
income buyers, 119 market-rate senior rentals, and 67 rentals for
55+ at 30-60% of AMI; 388 parking spaces; on-site senior programs. In
downtown Long Beach near light rail, within 1 mile of shopping, medical services, employment centers, parks and recreation.
Long Beach
Light Rail: Anaheim Street Station
$3,614,848
Of larger request for
Rental Housing, Housing
Infrastructure, Homeownership
Appendix G EEEEvaluation of California’s TODvaluation of California’s TODvaluation of California’s TODvaluation of California’s TOD Housing and IIGHousing and IIGHousing and IIGHousing and IIG ProgramsProgramsProgramsPrograms
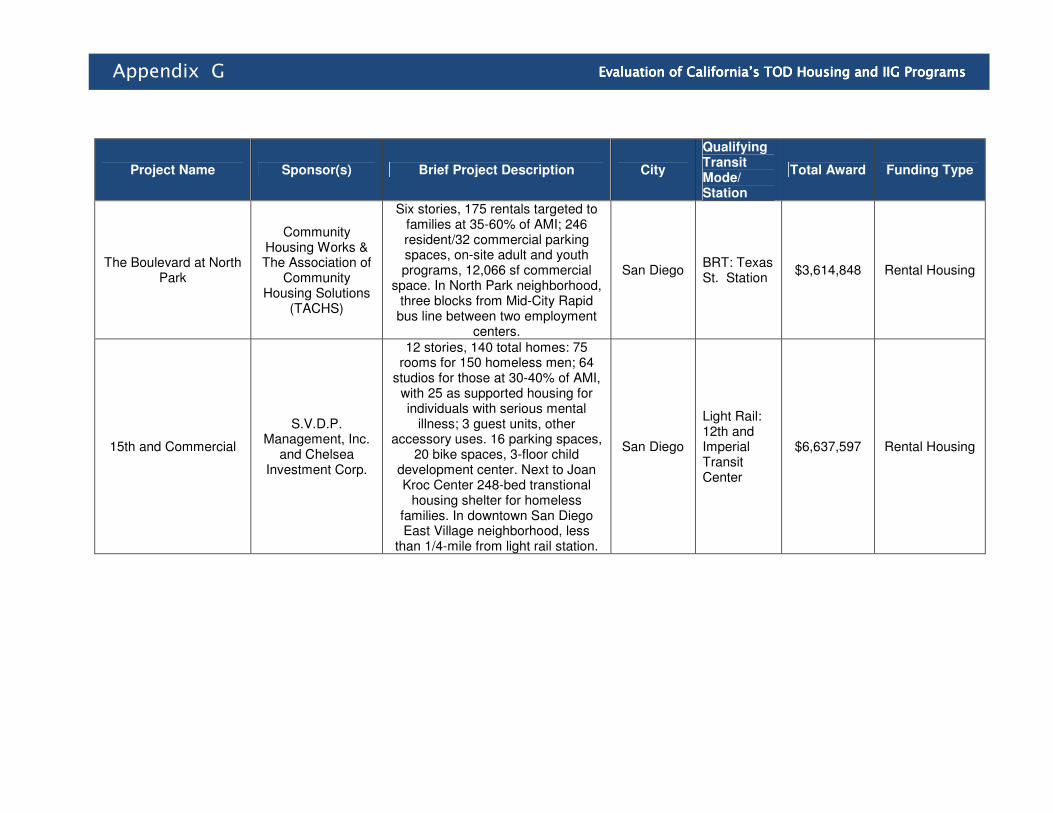
Project Name Sponsor(s) Brief Project Description City
Qualifying Transit Mode/ Station
Total Award Funding Type
The Boulevard at North Park
Community Housing Works & The Association of
Community Housing Solutions
(TACHS)
Six stories, 175 rentals targeted to families at 35-60% of AMI; 246 resident/32 commercial parking spaces, on-site adult and youth programs, 12,066 sf commercial
space. In North Park neighborhood, three blocks from Mid-City Rapid bus line between two employment
centers.
San Diego BRT: Texas St. Station
$3,614,848 Rental Housing
15th and Commercial
S.V.D.P. Management, Inc.
and Chelsea Investment Corp.
12 stories, 140 total homes: 75 rooms for 150 homeless men; 64
studios for those at 30-40% of AMI, with 25 as supported housing for individuals with serious mental
illness; 3 guest units, other accessory uses. 16 parking spaces,
20 bike spaces, 3-floor child development center. Next to Joan Kroc Center 248-bed transtional
housing shelter for homeless families. In downtown San Diego East Village neighborhood, less
than 1/4-mile from light rail station.
San Diego
Light Rail: 12th and Imperial Transit Center
$6,637,597 Rental Housing
Appendix G EEEEvaluation of California’s TODvaluation of California’s TODvaluation of California’s TODvaluation of California’s TOD Housing and IIGHousing and IIGHousing and IIGHousing and IIG ProgramsProgramsProgramsPrograms

Round 1: 46 Infill Infrastructure Grant (IIG) Program Awards (June 2008)
SOUTHERN CALIFORNIA
Project Name Sponsor(s) Project Summary City IIG Award Location Type Infrastructure Type
SEASONS at Compton
LINC Housing 84 permanent supportive rentals: 42 for limited income seniors; 41 for adults with developmental disabilities or adults caring for a dependent adult or child with developmental disabilities; 76 parking spaces; on-site services in partnership with South Central L.A. Regional Center, LEED construction, 1/10 mile from Metro bus stop, 2 miles from Blue Line light rail station.
Compton $3,169,934 So Cal QIP Site acquisition, open space and road improvements, water connections, sewer, street lighting, impact fees
El Monte Transit Village District
City of El Monte/ El Monte CRATV, LLC
First phase of Rio Paseo Village: 550 homes with 223 affordable (168 senior rentals, 55 for-sale condos) of total 1,850 planned homes, plus retail, office, entertainment uses, adjacent to the El Monte Transit Station (dedicated busway connecting to downtown LA).
El Monte
$26,543,000
So Cal
QIA/MPP
Compact, high capacity storm-water drainage, utility consolidation in accessible corridors, integrated walkways to enhance walkability and transit access.
Appendix H EEEEvaluation of California’s TOD valuation of California’s TOD valuation of California’s TOD valuation of California’s TOD Housing and IIGHousing and IIGHousing and IIGHousing and IIG ProgramsProgramsProgramsPrograms
Appendix H EEEEvaluation of California’s TODvaluation of California’s TODvaluation of California’s TODvaluation of California’s TOD HouHouHouHousing and IIGsing and IIGsing and IIGsing and IIG ProgramsProgramsProgramsPrograms

Project Name Sponsor(s) Project Summary City IIG Award Location Type Infrastructure Type
Westside II Cloudbreak Inglewood LLC
4 stories, 196 units of special needs housing for veterans with physical and mental disabilities, alcohol/drug issues, including 25% SRO units for low-income veterans. Support services by US Veterans Initiative. Adds 206 parking spaces. Joins Westside Residence Hall which already provides 315 rentals for veterans, 224 parking spaces.
Inglewood $7,500,000 So Cal QIP City-required parking to support previous 315 rentals.
Andalucia Heights
AMCAL Multi-Housing, Inc.
75 and 66 affordable rentals for large families, 91 affordable senior rentals, recreational rooms, on-site services, in Westlake area.
Los Angeles
$4,327,000 So Cal QIP 2 subterranean parking structures, sidewalk, street and alleyway improvements, utility undergrounding and connections, impact fees.
Boyle Hotel Apartments
East L.A. Community Corporation
Rehabilitation of 31 apts. In the historic Boyle Hotel, plus new 3-story building with 20 apts., 21 parking spaces, 4,100 sq ft of ground floor retail, across from the future MTA Gold Line stop at 1st St. and Boyle Ave.
Los Angeles
$1,000,000 So Cal QIP Parking structure for new apartment building, fire hydrant, driveway, trees, Storm-water Mitigation Plan requirements, impact fees.
China Town Blossom Plaza
China Town Blossom Plaza, LLC
53 affordable rentals, 209 market-rate rentals, 372 parking spaces (175 for public use), 20,000 sq ft cultural plaza, 40,000 sq ft of retail, by Chinatown Metro Rail Station.
Los Angeles
$10,114,080 Also received TOD award.
So Cal QIP Site preparation, curb, gutter, sidewalk, disposal of contaminated soils, residential parking structure, transit shelter, worker safety costs, security.
Appendix H EEEEvaluation of California’s TODvaluation of California’s TODvaluation of California’s TODvaluation of California’s TOD Housing and IIGHousing and IIGHousing and IIGHousing and IIG ProgramsProgramsProgramsPrograms

Project Name Sponsor(s) Project Summary City IIG Award Location Type Infrastructure Type
Figueroa Corridor LA Community Redevelopment Agency/ Figueroa Corridor Partnership/ South Park Business and Community BID
QIP: YWCA/Job Corps 200 affordable rentals with job training services. QIA: Morrison Hotel (85 affordable rentals), Pierce Bros Mortuary (60 affordable and market-rate rentals), CFRC (65 affordable rentals), Figueroa South (500 or more market-rate homes), major retail and office space, hotels, dining, entertainment, health club, plaza, near two subway lines, DASH, Metro buses, eventual Expo line.
Los Angeles
$30,000,000, including
$904,800 for parks.
So Cal QIA Figueroa, 11th St., MLK Jr. Blvd. and Washington Blvd. streetscape improvements, Venice Hope Recreation Center, Expo Park Sports Fields, Gilbert Lindsay Park, Freeway Cap Park.
Glassell Park L.A. Community Design Center with LA Unified School District (LAUSD)
Joint development across from Glassell Park Elementary School. Four stories, 50 family rentals, community room, 114 parking spaces (55 resident, 59 for district use), on .75 acres. LAUSD Early Education Center with 26 parking spaces on another .6 acres. Applying for LEED certification.
Los Angeles
$2,604,360 So Cal QIP 114-space subterranean parking structure, off-site improvements.
Las Margaritas East L.A. Community Corporation
42-unit scattered site project including 20 new affordable apartments, social services, subterranean garage with 21 spaces, within walking distance of future MTA Gold Line station at 1st and Soto. Other portion: 22 rehabilitated rentals.
Los Angeles
$911,040 So Cal QIP Residential underground parking garage.
Appendix H EEEEvaluation of California’s TODvaluation of California’s TODvaluation of California’s TODvaluation of California’s TOD Housing and IIGHousing and IIGHousing and IIGHousing and IIG ProgramsProgramsProgramsPrograms
Appendix H EEEEvaluation of California’s TOD valuation of California’s TOD valuation of California’s TOD valuation of California’s TOD Housing and IIGHousing and IIGHousing and IIGHousing and IIG ProgramsProgramsProgramsPrograms
Appendix H EEEEvvvvaluation of California’s TODaluation of California’s TODaluation of California’s TODaluation of California’s TOD Housing and IIGHousing and IIGHousing and IIGHousing and IIG ProgramsProgramsProgramsPrograms

Project Name Sponsor(s) Project Summary City IIG Award Location Type Infrastructure Type
Rosewood Gardens L.A. Housing Partnership Incorporated
54 affordable senior apartments, community room, on-site services, 27 underground parking spaces, LEED construction, in Wilshire Center-Koreatown area near transit.
Los Angeles
$1,985,272 So Cal QIP Undergrounding utilities, street trees and improvements, bike racks, lighting, parking spaces.
The Grand County of Los Angeles (JPA)/ Grand Avenue LA, LLC (affiliate of The Related Companies)
16-acre Civic Park as part of The Grand Phases I and II: mixed-use developments with market-rate condos, affordable apartments, retail, hotel. Eventual size for Phases 1–3: 2,060-2,660 units (20% affordable), 449,000–660,000 sq ft of retail/restaurant, 295-room hotel, 5,000+ parking spaces.
Los Angeles
$27,170,809 So Cal QIA 16-acre Civic Park.
105th and Normandie Seniors Project
National Community Renaissance of California (CORE)
62 senior apartments (including six special needs units) for at-risk homeless and chronically mentally ill seniors, with community room, social service office, 52 parking spaces, in West Athens-Westmont District.
Los Angeles
$1,033,418 So Cal QIP Underground utilities, Normandie Street improvements, street lights, dedication of existing alley.
3rd and Woods Family
National CORE 60 affordable multifamily rentals in East L.A., 120 parking spaces, community center, ground floor commercial, near bus transit center, 1/4 mile from two planned Gold Line stations.
Los Angeles
$2,695,000 So Cal QIP Residential parking structure hard and soft costs, curb and gutter, sidewalk and streetscape improvements.
Appendix H EEEEvaluation of California’s TODvaluation of California’s TODvaluation of California’s TODvaluation of California’s TOD Housing andHousing andHousing andHousing and IIGIIGIIGIIG ProgramsProgramsProgramsPrograms

Project Name Sponsor(s) Project Summary City IIG Award Location Type Infrastructure Type
Palmdale Transit Village
City of Palmdale, Community Development Associates (CDA)
156 affordable apts., 46 for-sale townhomes for low- and moderate-income first-time homebuyers, near Palmdale Transit Center. Part of larger Transit Village project, with projected 278 homes.
Palmdale $9,950,400 including
$144,500 for parks.
So Cal QIA Streets, sidewalks, streetscape, lighting, water lines, sewers, drainage, electrical lines, parks/open space, parking, property acquisition.
Perris Station Apartments
Perris Housing Investors, LP, TELACU Homes
Two stories of residential over one of parking, 84 apartments, 72 parking spaces, recreation center, retail/commercial space, by bus stop, multimodal bus hub, future Metro Link Station, near other commercial/retail.
Perris $3,843,360 So Cal QIP Residential parking structure.
Cuatro Vientos East Los Angeles Community Corporation
25 affordable apartments, a mix of 1-3 bedrooms, including public walkways and community space.
Los Angeles
$1,028,366 So Cal QIP Residential parking structure, storm water mitigation plan.
Ocean Breeze Apartments
Simpson Housing Solutions LLC and LINC Housing Corp.
20 affordable apartments for 55+, community space, above one level of retail, 16 underground parking spaces, within 1/4 mile of bus stop, park and grocery store.
Santa Monica
$997,120 So Cal QIP Site preparation, utilities, street improvements, tree mitigation, landscaping, parking structure.
Plaza Amistad Cabrillo Economic Development Corporation
150 family apartments, including 64 farmworker apartments, with community building, adjacent child care center, 336 parking spaces, 1/4 mile from downtown core.
Santa Paula
$4,106,000 So Cal QIP Water lines, sewer and storm drain systems, underground detention basin, open space, ped/bike system, underground electrical lines, parking structure.
Appendix H EEEEvaluation of California’s TOD valuation of California’s TOD valuation of California’s TOD valuation of California’s TOD Housing and IIGHousing and IIGHousing and IIGHousing and IIG ProgramsProgramsProgramsPrograms
Appendix H EEEEvaluation of California’s TODvaluation of California’s TODvaluation of California’s TODvaluation of California’s TOD Housing and IIGHousing and IIGHousing and IIGHousing and IIG ProgramsProgramsProgramsPrograms

Project Name
Sponsor(s) Project Summary City IIG Award Location Type Infrastructure Type
Citronica Lemon Grove Community Development Agency
Mixed-use downtown redevelopment project with 181 market-rate rentals, 57 affordable rentals, 1/2 mile from the Orange Grove Lemon Grove trolley stop.
Lemon Grove $4,800,000 including
$12,000 for parks
So Cal QIA Upgrade public utilities, reconstruct Lemon Grove freeway off-ramp, widen North Avenue.
Commercial and 22nd Street Mixed Use Project
COMM 22, LLC (BRIDGE EDC, Bronze Triangle CDC, MAAC Project)
127 family rentals for 30–60% AMI, 70 senior rental units for 30-50% AMI, 38 market-rate live-work lofts and 17 row-houses, 485 parking spaces, childcare, office and commercial/retail space.
San Diego $9,680,534 including
$117,500 for parks.
Also received TOD award.
So Cal QIA Demolition, excavation, UST cleanup, water, sewer, utility undergrounding, street and sidewalk improvements, 85 parking spaces.
Mobile Haven Senior Apartments
National Community Renaissance of CA (CORE)
61 senior rentals, 52 parking spaces, community/recreation room.
Escondido $650,959 So Cal QIP Juniper St. widening; Juniper St. and Washington Ave. improvements, Waverly Pl. reconstruction, water main loop and extension.
Crenshaw Mid-City Corridors Infill
CRA Los Angeles 60 units of senior housing, connecting it to transit stop at Coliseum St. and 30
th Street,
Los Angeles $14,677,920 So Cal QIA Pedestrian oriented improvements to light rail station, including sidewalks, irrigation, landscaping, and signage.
Appendix H EEEEvaluation of California’s TODvaluation of California’s TODvaluation of California’s TODvaluation of California’s TOD Housing and IIGHousing and IIGHousing and IIGHousing and IIG ProgramsProgramsProgramsPrograms
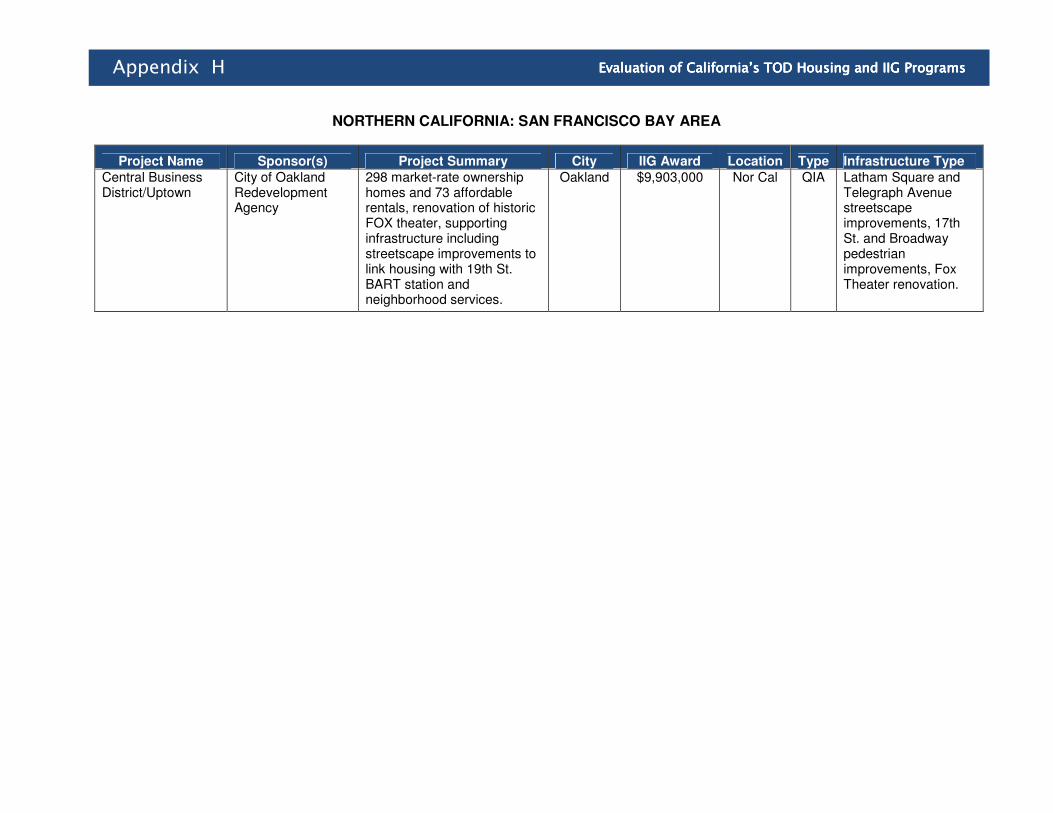
NORTHERN CALIFORNIA: SAN FRANCISCO BAY AREA
Project Name Sponsor(s) Project Summary City IIG Award Location Type Infrastructure Type
Central Business District/Uptown
City of Oakland Redevelopment Agency
298 market-rate ownership homes and 73 affordable rentals, renovation of historic FOX theater, supporting infrastructure including streetscape improvements to link housing with 19th St. BART station and neighborhood services.
Oakland $9,903,000 Nor Cal QIA Latham Square and Telegraph Avenue streetscape improvements, 17th St. and Broadway pedestrian improvements, Fox Theater renovation.
Appendix H EEEEvaluation of California’s TODvaluation of California’s TODvaluation of California’s TODvaluation of California’s TOD Housing and IIGHousing and IIGHousing and IIGHousing and IIG ProgramsProgramsProgramsPrograms
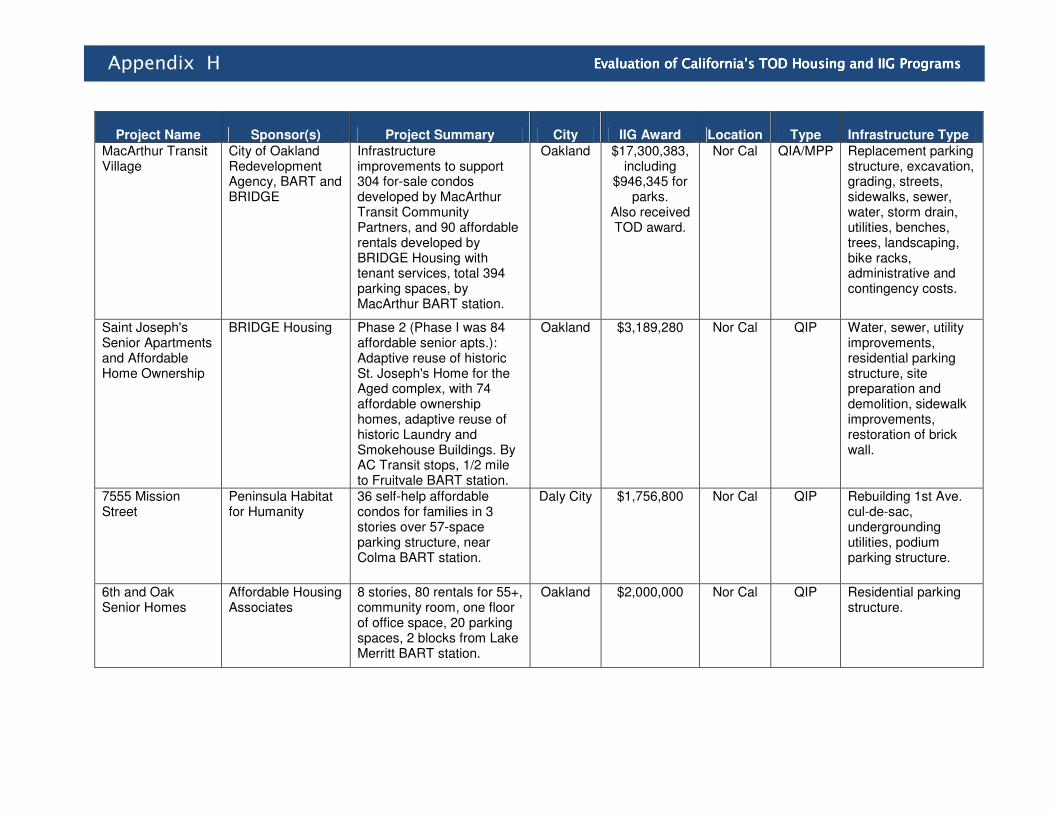
Project Name Sponsor(s) Project Summary City IIG Award Location Type Infrastructure Type
MacArthur Transit Village
City of Oakland Redevelopment Agency, BART and BRIDGE
Infrastructure improvements to support 304 for-sale condos developed by MacArthur Transit Community Partners, and 90 affordable rentals developed by BRIDGE Housing with tenant services, total 394 parking spaces, by MacArthur BART station.
Oakland $17,300,383, including
$946,345 for parks.
Also received TOD award.
Nor Cal QIA/MPP Replacement parking structure, excavation, grading, streets, sidewalks, sewer, water, storm drain, utilities, benches, trees, landscaping, bike racks, administrative and contingency costs.
Saint Joseph's Senior Apartments and Affordable Home Ownership
BRIDGE Housing Phase 2 (Phase I was 84 affordable senior apts.): Adaptive reuse of historic St. Joseph's Home for the Aged complex, with 74 affordable ownership homes, adaptive reuse of historic Laundry and Smokehouse Buildings. By AC Transit stops, 1/2 mile to Fruitvale BART station.
Oakland $3,189,280 Nor Cal QIP Water, sewer, utility improvements, residential parking structure, site preparation and demolition, sidewalk improvements, restoration of brick wall.
7555 Mission Street
Peninsula Habitat for Humanity
36 self-help affordable condos for families in 3 stories over 57-space parking structure, near Colma BART station.
Daly City $1,756,800 Nor Cal QIP Rebuilding 1st Ave. cul-de-sac, undergrounding utilities, podium parking structure.
6th and Oak Senior Homes
Affordable Housing Associates
8 stories, 80 rentals for 55+, community room, one floor of office space, 20 parking spaces, 2 blocks from Lake Merritt BART station.
Oakland $2,000,000 Nor Cal QIP Residential parking structure.
Appendix H EEEEvaluationvaluationvaluationvaluation of California’s TOD of California’s TOD of California’s TOD of California’s TOD Housing and IIGHousing and IIGHousing and IIGHousing and IIG ProgramsProgramsProgramsPrograms
Appendix H EEEEvaluation of California’s TODvaluation of California’s TODvaluation of California’s TODvaluation of California’s TOD Housing and IIGHousing and IIGHousing and IIGHousing and IIG ProgramsProgramsProgramsPrograms

Project Name Sponsor(s) Project Summary City IIG Award Location Type Infrastructure Type
Tassafaronga Village
Oakland Housing Authority
Redevelop 87 units of severely distressed public housing; 157 new rentals: 77 townhomes; 60 apts.; 20 loft units in rehabilitated former pasta factory, plus 22 for-sale townhomes (by East Bay Habitat for Humanity); near major AC Transit stops, one mile from Coliseum BART station.
Oakland $6,119,522 Nor Cal QIP Reduce contamination; improve streets, pathways, sidewalks, pedestrian and bike access, utilities, exterior lighting and security systems, meet storm-water requirements.
Geary Boulevard Senior Living and Health Center
BRIDGE Housing and City and County of San Francisco
Geary Blvd. Senior Living and Health Center, with 150 affordable senior apartments and an Institute on Aging health center, 6 stories, 30 resident and 37 health center parking spaces; on transit routes.
San Francisco
$3,244,650 Nor Cal QIP Geary Blvd. sidewalk, curb, gutter, paving, pedestrian improvements, utility connections and fees, waste water capacity fee, below-grade residential parking structure.
Belovida at Newbury Park
Core Affordable Hosing
Infrastructure for 178 affordable rentals for 55+, 164 parking spaces, within 25-acre master planned development (Newbury Park), about 1/2 mile from planned Berryessa BART station, 2 miles northeast of central business district.
San Jose $3,123,330 Nor Cal QIP Demolish part of one building; new streets, curbs, gutters, sidewalks, landscaping; street lights, hydrants; utilities; sewer, storm.
Fourth Street Apartments
First Community Housing
7 stories, 100 affordable multifamily rentals (35 for residents with developmental disabilities, services through San Andreas Regional Center), community room, above parking (110 spaces), two blocks from light rail.
San Jose $1,513,561 Nor Cal QIP Parking structure (100 of 110 spaces), stabilization of 120-year-old sewer pipe.
EEEEvaluation of California’s TOD valuation of California’s TOD valuation of California’s TOD valuation of California’s TOD Housing and IIGHousing and IIGHousing and IIGHousing and IIG ProgramsProgramsProgramsPrograms
Appendix H EEEEvaluation of California’s TODvaluation of California’s TODvaluation of California’s TODvaluation of California’s TOD Housing and IIGHousing and IIGHousing and IIGHousing and IIG ProProProProgramsgramsgramsgrams

Project Name Sponsor(s) Project Summary City IIG Award Location Type Infrastructure Type
Kings Crossing Charities Housing Development Corporation and City of San Jose
4 stories, 94 affordable apts., community space, 155 parking spaces. First residential portion of 25-acre Newbury Park community, with planned 800–1,300 homes, near future BART extension to San Jose in former light industrial area.
San Jose $4,495,840 Nor Cal QIP Subterranean parking garage.
3rd Street Residential Development
Global Premier Development and Foundation for Affordable Housing
3 stories, 37 family apartments, 65 parking spaces, recreation/computer center, sustainable building methods, in Artist's District adjacent to redevelopment area.
San Jose $1,688,000 Nor Cal QIP 37 of 65 parking spaces in subterranean parking garage for city-required 1.7 spaces/dwelling unit.
San Leandro Crossings
City of San Leandro, Westlake Development Partners, LLC and BRIDGE
Phase I: 86 affordable apartments, 102 parking spaces. Phase 2: 14 affordable apartments, 200 market-rate apartments, 290 parking spaces, 5,000 sq ft of retail space.
San Leandro
$12,460,120 Also received TOD award.
Nor Cal QIA Site preparation, landscaping, utility undergrounding, street lights, street improvements, replacement BART parking structure (325 spaces), transit facility improvement, park impact fees.
Peninsula Station Mid-Peninsula Housing Coalition and City and RDA of San Mateo
68 affordable family apartments, on-site services, 8,000 sq ft of commercial and community space, underground garage for 123 cars, 43 bikes; within walking distance of Caltrain station, two bus stops on major routes; part of "Grand Boulevard" plan.
San Mateo
$3,992,960 Nor Cal QIP Environmental remediation, water, sewer, street/road improvements, bike facilities, underground parking structure, utility improvements, drainage, site preparation, impact fees.
EEEEvaluation of California’s TOD valuation of California’s TOD valuation of California’s TOD valuation of California’s TOD Housing and IIGHousing and IIGHousing and IIGHousing and IIG ProgramsProgramsProgramsPrograms
Appendix H EEEEvaluation of California’s TODvaluation of California’s TODvaluation of California’s TODvaluation of California’s TOD Housing and IIGHousing and IIGHousing and IIGHousing and IIG ProgramsProgramsProgramsPrograms

NORTHERN CALIFORNIA: SACRAMENTO and OTHER AREAS
Project Name Sponsor(s) Project Summary City IIG Award Location Type Infrastructure Type
Broadway Lofts 1901 Broadway MRES, LLC and KOAR Development Group, LLC
3–5 stories, 109 rentals, live/work spaces, 139 residential parking spaces, ground floor retail, 80 commercial spaces, across from Broadway Light Rail station. LEED, part of Safe City Program.
Sacramento $4,406,480 Nor Cal QIP Building demolition, upgrade sewer/storm drains; utilities; curb, gutter, sidewalk; fiber optic line w/ RT station; relocate bus terminal, pedestrian crossing; street repairs; bike lockers/racks; video surveillance cameras; street lights, landscaping; hydrants.
The Railyards Thomas Enterprises
Mixed-Use TOD with 12,000 residences (1,800 affordable) on brownfield site near Sacramento Intermodal Transportation Facility served by Amtrak, RT light rail, and bus. 5 phases of rental housing on 5.8 acres: 456 market-rate, 96 affordable for large families, 101 affordable for seniors.
Sacramento $30,000,000 including
$848,000 for parks.
Also received TOD award
Nor Cal QIA/MPP
Extension of 5th Street, construction of Railyards Blvd. from 7th Street to Bercut with bicycle/ pedestrian facilities, utility piping, lighting, landscaping; design, engineering, permitting costs.
Triangle Development Area
City of West Sacramento
Infrastructure to support Triangle Area east of UP rail line and catalyze private development. This Triangle portion to include 731 homes (198 affordable), office space, neighborhood park, riverfront promenade, roadway improvements to support a Downtown/ Riverfront Streetcar.
West Sacramento
$23,081,360 including
$564,876 for parks.
Nor Cal QIA Reconstruction of Tower Bridge Gateway, 5th St. restriping, road reconstructions, bike/walkways, sewer, park improvements, rail removal, roadway improvements for anticipated Streetcar.
Appendix H EEEEvaluation of California’s TOD valuation of California’s TOD valuation of California’s TOD valuation of California’s TOD Housing and IIGHousing and IIGHousing and IIGHousing and IIG ProgramsProgramsProgramsPrograms
Appendix H EEEEvaluation of California’s TODvaluation of California’s TODvaluation of California’s TODvaluation of California’s TOD Housing and IIGHousing and IIGHousing and IIGHousing and IIG ProgramsProgramsProgramsPrograms

Project Name
Sponsor(s) Project Summary
City IIG Award Location Type Infrastructure Type
Township 9 PUD
City of Sacramento
QIA: 65-acre, mixed-use master planned neighborhood, with 2,350 residences. QIP: 5 stories, 139 affordable apts., 800,000 sq ft of office space, 150,000 sq ft of ground floor retail, 20 acres of open space, near proposed Downtown-Natomas-Airport light rail line station.
Sacramento $19,100,000 Nor Cal QIA Richards Blvd. frontage, N. 7th St., Parkway, Riverfront Dr. and Riverfront Park improvements, residential parking structure, street frontage, transit improvements.
Del Norte Point Apartments
TELACU Homes 3 stories, 73 large-family affordable apartments, 110 parking spaces, clubhouse, within 1/4 mile of school, can use local Dial-a-Ride for transit.
Crescent City $2,035,650 Nor Cal QIP Utility extensions, water line installation, street improvements at main entrance.
Kings Beach Housing Now
Placer County Redevelopment Agency and Domus Development
Scattered site mixed-use project with 74 rentals, 8,000 sq ft of commercial space, 126 parking spaces, LEED construction.
Kings Beach $3,314,400 Nor Cal QIP Utility connections, street improvements, garage parking, landscaping, transit linkages, On-site Best Management Practices.
Salinas Gateway Apartments
First Community Housing
4 stories, 52 affordable rental townhomes/ flats (25 targeted to families/individuals with developmental disabilities, 26 to those with chronic illness needing daily assistance); 2,770 sq ft of retail space, 40 parking spaces. By downtown bus transit, Greyhound Station, Amtrak regional rail hub.
Salinas $1,500,000 Nor Cal QIP Structured parking.
Windsor Redwoods
Town of Windsor Redevelopment and Burbank Housing Development Corp.
65 affordable multifamily rentals (8 proposed for farmworker families, 5 for persons with developmental disabilities), 112 parking spaces, park, retail, with green design elements, near Sonoma County Transit stops.
Windsor $2,519,409 Nor Cal QIP Storm drain facilities, internal private street construction/streetscape, resurfacing of portion of Old Redwood Hwy.
Appendix H EEEEvaluation of California’s TODvaluation of California’s TODvaluation of California’s TODvaluation of California’s TOD Housing and IIGHousing and IIGHousing and IIGHousing and IIG ProgramsProgramsProgramsPrograms

CENTRAL VALLEY
Project Name Sponsor(s) Project Summary City IIG Award Location Type Infrastructure Type
Fancher Creek Mixed-Use Residential Housing —Parking Structures
Francher Creek Properties, LLC
90-acre Fancher Creek Town Center: 558 homes and parking spaces, above lifestyle retail, movie theater, power center retail, office space, Civic Center with library, post office, police station, BRT station, daycare, plus lake, 8-mile walking trail. Part of larger 490-acre Fancher Creek project, with 1 million+ sq ft of business park, 1,000 single family homes, 120,000 sq ft of neighborhood retail.
Fresno $20,961,940, including
$383,100 for parks
Central Valley
QIA/MPP Widen Clovis Ave. to 6-lane divided road, utilities, above-ground water storage tank, water mains, sewer extension, storm drainage, lake for recharge/ drainage.
Magnolia Court Affirmed Housing Group
51 affordable senior apartments plus 1 manager unit, near school, former skating rink, carwash, and commercial lot and buildings.
Manteca
$1,788,800 Central Valley
QIP Street improvements, offsite water and sanitary sewer upgrades.
Villa Siena Apartments
Housing Alternatives Inc
3 stories, 70 affordable apartments, 93 parking spaces, office space, courtyard, within 1/4 mile of bus stop/transit center.
Porterville
$2,379,944 Central Valley
QIP Demolition, prep work, grading, utilities, surface improvements: paving, curb/gutter, sidewalks, street lights, striping.
Gleason Park Apartments
Mercy Housing and City of Stockton
93 affordable apartments in 2- and 3-story bldgs, community center with Head Start, across street from elementary school and Gleason Park. Part of redevelopment effort with 16 new single-family homes, new mixed-use development.
Stockton
$1,482,285 Central Valley
QIP American Street promenade to Park, reconstruction of Church and Stanislaus Streets, utility replacement, curb, gutter, sidewalk, street lights, bulbed curbs.
Appendix H EEEEvaluation of California’s TOD valuation of California’s TOD valuation of California’s TOD valuation of California’s TOD Housing and IIGHousing and IIGHousing and IIGHousing and IIG ProgramsProgramsProgramsPrograms
Appendix H EEEEvaluation of California’s TODvaluation of California’s TODvaluation of California’s TODvaluation of California’s TOD Housing and IIGHousing and IIGHousing and IIGHousing and IIG ProgramsProgramsProgramsPrograms

Round 2: 46 Infill Infrastructure Grant (IIG) Program Awards (June 2009)
NORTHERN CALIFORNIA: SAN FRANCISCO BAY AREA
Project Name Sponsor(s) Brief Project Description City Total
Award Type/Location Infrastructure Description
Ohlone Gardens
Resources for Community Development & City of El Cerrito RDA
57 total rentals including 46 targeted to households at 30-50% of AMI; residential training program for the visually impaired target population and a computer lab. One block from El Cerrito's San Pablo commercial corridor.
El Cerrito $2,860,000 QIP/Nor Cal
Environmental remediation, demolition of existing structures; site preparation; streetscape and sidewalk; podium parking structure.
Peralta Mixed-Use Senior Housing
Eden Housing, Inc.
98 apartments for seniors age 62+ at 20-35% of AMI, community facilities, senior supportive services and referrals, 0 parking spaces, one-half mile from the Centerville Business District.
Fremont $700,000 QIP/Nor Cal
Sewer, storm water extensions/construction; utility undergrounding; street improvements for widening of Peralta Blvd.; bike parking facility; streetscape improvements.
South Hayward BART Mixed-use
City of Hayward & City of Hayward RDA
5 stories, 788 total homes, including 204 rentals targeted to families and 80 for seniors at 30-50% of AMI; ground-floor supermarket and retail; within walking distance to multi-modal transit stations and shared car service; all within 1/2 mile of South Hayward BART station.
Hayward $30,000,000 MPP/Nor Cal
910-space BART replacement parking structure, offsite infrastructure; landscaping, utilities, pedestrian access and bus transfer facilities.
Appendix I EEEEvaluation of California’s TOD valuation of California’s TOD valuation of California’s TOD valuation of California’s TOD Housing and IIGHousing and IIGHousing and IIGHousing and IIG ProgramProgramProgramProgramssss
EEEEvaluation of California’s TOD valuation of California’s TOD valuation of California’s TOD valuation of California’s TOD Housing and IIGHousing and IIGHousing and IIGHousing and IIG ProgramsProgramsProgramsPrograms
Appendix I EEEEvaluation of California’s TODvaluation of California’s TODvaluation of California’s TODvaluation of California’s TOD Housing and IIGHousing and IIGHousing and IIGHousing and IIG ProgramsProgramsProgramsPrograms

Red Star
National Affordable Communities & Linc Housing
119 rentals targeted to seniors at 30-60% of AMI; community center with health & exercise programs, medical screenings, counseling; 60 parking spaces; less than 1/2 mile from West Oakland BART station, public park, retail.
Oakland $1,500,000 QIP/Nor Cal
Ground-level parking structure; soil remediation due to lead, mercury and hydrocarbons.
720 East 11th Street Apts.
Resources for Community Development
55 rentals targeting families at 30-55% of AMI; computer lab, community room, laundry facilities. Less than half-mile of public park, school, employment and retail centers.
Oakland $1,537,549 QIP/Nor Cal
55-space parking garage; underground utility lines.
Siena Court Senior Apartments
Domus Development & Redevelopment Agency of the City of Pittsburg
110 rentals targeted to seniors at 30-60% of AMI; 100 parking spaces with a "green" roof; 10,379 sf of retail, in Old Town Pittsburg.
Pittsburg $4,994,560 QIP/Nor Cal
Design, engineering and construction of two-level parking garage; utility service connections; street enhancements; public plaza
Hunters View
Hunters View Associates LP
740 total homes: 390 ownership, including 59 targeted to low-income homebuyers, 350 rentals targeted to families at 50% of AMI, near BART station and SF public transit
San Francisco
$30,000,000 MPP/Nor Cal
Infrastructure to be completely rebuilt; existing major utility systems will need to be demolished, replaced and brought up to current standards; all of the streets to be rebuilt; new streets will be added; streetscapes and site landscaping
333 Harrison Harrison Fremont LLC
308 total rentals, including 62 targeted to families at 30% of AMI, on-site gym, green roof deck, parking structure, in downtown San Francisco at Caltrans staging area of the Bay Bridge.
San Francisco
$11,559,600 MPP/Nor Cal
Demolition; excavation; surveying and grading, disposal of contaminated soils; new utilities.
Appendix I EEEEvaluation of California’s TODvaluation of California’s TODvaluation of California’s TODvaluation of California’s TOD Housing and IIGHousing and IIGHousing and IIGHousing and IIG ProgramsProgramsProgramsPrograms

5800 Third Street
SF Third Street Equity Partners LLC
223 total rentals, including 67 targeting families at 30% of AMI, near amenities, Muni station. In San Francisco's Bayview Hunters Point neighborhood.
San Francisco
$10,433,280 QIP/Nor Cal
Utilities; sidewalk, curb and gutter improvements; landscaping; parking garage.
2235 3rd Street Martin McNerney Properties, LLC
179 total rentals with 37 targeted to families at 30% of AMI, 157 parking spaces, on-site day care for the neighborhood. Adjacent to new Muni Third Street Light Rail Station.
San Francisco
$7,378,080 QIP/Nor Cal
Water, sewer and utility service improvements and relocation, 179 parking spaces; transit linkages; sidewalk and streetscape improvements
Arc Light Co. 178 Townsend
Properties, LLC
85 total rentals including 18 targeting families at 30% of AMI, 74 parking spaces. 1/2 block from Muni station in SF South of Market neighborhood adjacent to AT&T ballpark.
San Francisco
$3,561,360 QIP/Nor Cal
Water, sewer, utilities; parking; transit linkages including bicycle storage units; traffic mitigation devices; sidewalk and streetscape improvements
North San Pedro Residential Project
City of San Jose RDA & North San Pedro Townhomes LLC
Five-phase project to develop 610 homes, including 134 rentals targeted to families at 30-50% of AMI, with 45 to serve special needs populations. Within 1/2-mile of St. James light rail station, 3 parks.
San Jose $24,160,400 MPP/Nor Cal
Complete street reconstruction; demo of existing streets; new street improvements (gutter, curb, sidewalks, lighting); three new parks that will link the development sites
Rosemary Housing
1st and Rosemary Family Housing, L.P.
288 rentals targeted to families at 30-60% of AMI, including 104 for seniors, 256 parking spaces, pool, courtyards, open spaces, 1.5 miles north of downtown San Jose near light rail.
San Jose $12,382,972 MPP/Nor Cal
Podium parking garage; landscaping and irrigation, sidewalks and fences, street improvements and utility connections; North San Jose Traffic Impact Fee
Appendix I EEEEvaluation of California’s TODvaluation of California’s TODvaluation of California’s TODvaluation of California’s TOD Housing and IIGHousing and IIGHousing and IIGHousing and IIG ProgramsProgramsProgramsPrograms
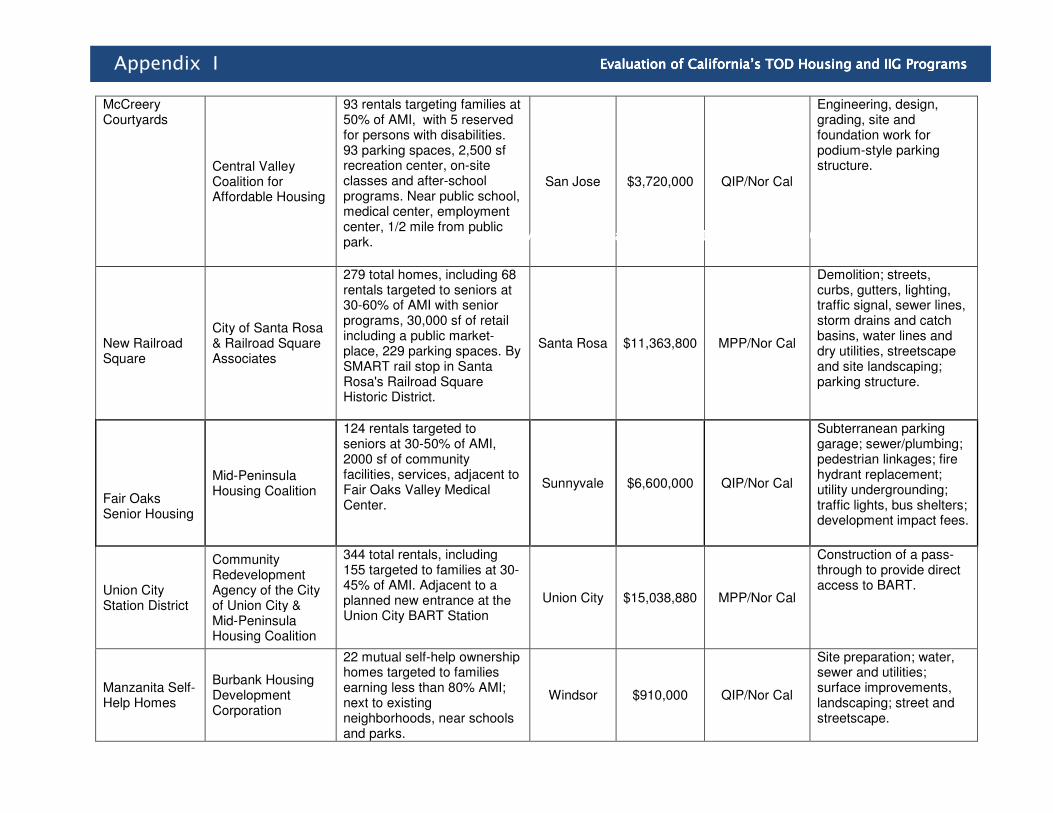
McCreery Courtyards
Central Valley Coalition for Affordable Housing
93 rentals targeting families at 50% of AMI, with 5 reserved for persons with disabilities. 93 parking spaces, 2,500 sf recreation center, on-site classes and after-school programs. Near public school, medical center, employment center, 1/2 mile from public park.
San Jose $3,720,000 QIP/Nor Cal
Engineering, design, grading, site and foundation work for podium-style parking structure.
New Railroad Square
City of Santa Rosa & Railroad Square Associates
279 total homes, including 68 rentals targeted to seniors at 30-60% of AMI with senior programs, 30,000 sf of retail including a public market-place, 229 parking spaces. By SMART rail stop in Santa Rosa's Railroad Square Historic District.
Santa Rosa $11,363,800 MPP/Nor Cal
Demolition; streets, curbs, gutters, lighting, traffic signal, sewer lines, storm drains and catch basins, water lines and dry utilities, streetscape and site landscaping; parking structure.
Fair Oaks Senior Housing
Mid-Peninsula Housing Coalition
124 rentals targeted to seniors at 30-50% of AMI, 2000 sf of community facilities, services, adjacent to Fair Oaks Valley Medical Center.
Sunnyvale $6,600,000 QIP/Nor Cal
Subterranean parking garage; sewer/plumbing; pedestrian linkages; fire hydrant replacement; utility undergrounding; traffic lights, bus shelters; development impact fees.
Union City Station District
Community Redevelopment Agency of the City of Union City & Mid-Peninsula Housing Coalition
344 total rentals, including 155 targeted to families at 30-45% of AMI. Adjacent to a planned new entrance at the Union City BART Station
Union City $15,038,880 MPP/Nor Cal
Construction of a pass-through to provide direct access to BART.
Manzanita Self-Help Homes
Burbank Housing Development Corporation
22 mutual self-help ownership homes targeted to families earning less than 80% AMI; next to existing neighborhoods, near schools and parks.
Windsor $910,000 QIP/Nor Cal
Site preparation; water, sewer and utilities; surface improvements, landscaping; street and streetscape.
EEEEvavavavaluation of California’s TOD luation of California’s TOD luation of California’s TOD luation of California’s TOD Housing and IIGHousing and IIGHousing and IIGHousing and IIG ProgramsProgramsProgramsPrograms
Appendix I EEEEvaluation of California’s TODvaluation of California’s TODvaluation of California’s TODvaluation of California’s TOD Housing and IIGHousing and IIGHousing and IIGHousing and IIG ProgramsProgramsProgramsPrograms

NORTHERN CALIFORNIA: SACRAMENTO AREA The Railyards
S Thomas Enterprises of Sacramento LLC
For Phase 1 with 141 rentals targeted to families at 30-60% of AMI, part of planned development of 11,000 total homes with 1,800 affordable rentals. Near proposed regional Sacramento Intermodal Transportation Facility with light rail, freight/passenger rail, and bus/taxi service.
Sacramento $20,000,000 MPP/Nor Cal
Access from each phase of housing to the Sacramento Valley Station; construction of streets, pedestrian plaza, and kiosk-style building linking the plaza to station boarding points.
Township 9 City of Sacramento
265 total rentals, including 90 targeted to families at 50% of AMI, in planned mixed use development within 1/2 mile of future light rail station.
Sacramento $10,900,000 QIA/Nor Cal
Site preparation, grading, excavation and soil import; sewer, water and storm drain, curb/gutter, sidewalk, paving and landscaping; street improvements and underground utilities
Parkside at City Center
Riverside Charitable Corporation
62 rentals targeting families at 60% of AMI with 4 accessible units, 62 parking spaces, community facilities. In West Sacramento's business district, part of the West Capital Streetscape Master Plan.
West Sacramento
$1,900,000 QIP/Nor Cal
Engineering, design, grading, site and foundation work for podium-style parking structure.
Capitol Lofts
Capitol Lofts-Sacramento, LLC & Capital Area Development Authority
122 rentals including 37 targeted to families at 30% of AMI, 1/4 mile from light rail, public park, State Capitol. Sacramento $4,946,080 QIP/Nor Cal
Sewer, water, storm improvements; surface improvements; landscaping infrastructure; multi-story parking garage.
Appendix I EEEEvaluation of California’s TOD valuation of California’s TOD valuation of California’s TOD valuation of California’s TOD Housing and IIGHousing and IIGHousing and IIGHousing and IIG ProgramsProgramsProgramsPrograms
Appendix I EEEEvaluation of California’s TODvaluation of California’s TODvaluation of California’s TODvaluation of California’s TOD Housing and IIGHousing and IIGHousing and IIGHousing and IIG ProgramsProgramsProgramsPrograms

SOUTHERN CALIFORNIA Mill Creek- Qualifying Infill Area
Bakersfield Redevelopment Agency
70 rentals targeted to households at 30-50% of AMI, 56 residential/34 public parking spaces, in downtown Bakersfield. Part of the Downtown Community Plan.
Bakersfield $10,847,200 QIA/So Cal
Park refurbishment and development; street improvements, curb and gutter, street trees, sidewalks, streetlights, landscaping, street resurfacing; parking structure.
Canyon Creek Thomas Safran and Associates
75 rentals for seniors from 30-60% of AMI, near health center, hospital, shopping center in Calabasas.
Calabasas $3,653,280 QIP/So Cal
Water/sewer lines; transportation, sidewalk, streetscape improvements; landscaping and lighting; environmental remediation.
Long Beach and Anaheim Transit Oriented Development
Meta Housing Corporation & City of Long Beach
5 buildings, 356 total homes: 170 condos with 40 for moderate- income buyers, 119 market-rate senior rentals, and 67 rentals for 55+ at 30-60% of AMI; 388 parking spaces; on-site senior programs. In downtown Long Beach near light rail, within 1 mile of shopping, medical services, employment centers, parks and recreation.
Long Beach $15,069,280 MPP/So Cal
Street and sidewalk improvements; bus pullout lane; underground parking; sewer, water, and drainage improvements; sidewalk repaving; underground utilities; streetscape enhancement.
Blvd 6200-North
Clarette Hollywood, LLC
535 total rentals, including 108 targeted to families at 30% or 60% AMI or below, on-site fitness/recreation, 535 parking spaces, across from the Hollywood/Vine Red Line Metro Station.
Los Angeles
$20,725,200 MPP/So Cal
Demolition; relocation/ expansion of utilities; street lighting, signage, and street tree relocation and replacement; sidewalk repairs; street, curb and cutter, storm drainage; structured parking
Appendix I EEEEvaluation of California’s TOD valuation of California’s TOD valuation of California’s TOD valuation of California’s TOD Housing and IIGHousing and IIGHousing and IIGHousing and IIG ProgramsProgramsProgramsPrograms
Appendix I EEEEvaluation of California’s TODvaluation of California’s TODvaluation of California’s TODvaluation of California’s TOD Housing and Housing and Housing and Housing and IIGIIGIIGIIG ProgramsProgramsProgramsPrograms

Taylor Yard Transit Village MPP
McCormack Baron Salazar, Inc.
430 total homes, including 69 rentals targeted to families and 107 targeted to seniors at 30-60% of AMI, 430 parking spaces, 29,400 sf of retail space, along the L.A. River.
Los Angeles
$15,094,990 MPP/So Cal
Water, sewer, laterals for individual parcels, underground storm water chambers, electrical wiring, telephone, data and irrigation systems.
5555 Hollywood
Meta Housing Corp.
5 stories, 120 rentals for seniors 55+ at 30% or 50% of AMI; 162 parking spaces, on-site senior programs, 6000 sf ground-floor retail. In "Little Armenia" area, one block from Red Line station, within 1 mile of retail/services.
Los Angeles
$5,000,000 QIP/So Cal
Semi-subterranean parking; site prep; sewer and storm drain improvements; sidewalks, parkway landscaping and street trees
Lorena Apartments
Global Premier Development & LINC Housing
112 rentals targeted to households at 30-60% of AMI; 243 parking spaces; near employment, retail, park elementary school and college.
Los Angeles
$5,000,000 QIP/So Cal
Construction of two-level subterranean parking structure; 60% of soil removal.
Seventh & Coronado Family Apartments
Los Angeles Housing Partnership, Inc.
68 rentals targeted to families at 30% - 60% AMI located in the Westlake Recovery Project Area; amenities will include underground parking, community room and learning center
Los Angeles
$3,886,267 QIP/So Cal
Relocation of street lights; street trees; underground parking; curb and gutter
Monticito Terraces
AMCAL Multi-Housing Inc.
69 rentals targeted to seniors at 30-60% of AMI; recreational/ educational programs, computer training, tax preparation classes, on-site basic health care, near public transportation, major health care facility and commercial outlets.
Los Angeles
$3,033,600 QIP/So Cal
Infrastructure including sewer, storm drain and water connections; sidewalks and new curb and gutters; streetlights; subterranean parking structure with 69 spaces
Appendix I EEEEvaluation of California’s TOD valuation of California’s TOD valuation of California’s TOD valuation of California’s TOD Housing and IIGHousing and IIGHousing and IIGHousing and IIG ProgramsProgramsProgramsPrograms
Appendix I EEEEvaluation of California’s valuation of California’s valuation of California’s valuation of California’s TOD TOD TOD TOD Housing and IIGHousing and IIGHousing and IIGHousing and IIG ProgramsProgramsProgramsPrograms
Appendix I EEEEvaluation of California’s TODvaluation of California’s TODvaluation of California’s TODvaluation of California’s TOD Housing and IIGHousing and IIGHousing and IIGHousing and IIG ProgramsProgramsProgramsPrograms

Mosaic Apartments
AMCAL Multi-Housing Inc. & Community Redevelopment Agency of the City of Los Angeles
56 rentals targeted to families at 30-60% AMI, computer training, job training, ESL classes, and health and nutrition programs. In dense commercial cooridor in L.A.'s Pico/Union area.
Los Angeles
$2,732,400 QIP/So Cal
Sewer, water; sidewalks; streetlights; subterranean parking structure; impact fees.
Sunrise Apartments
AMCAL Multi-Housing Inc. & Community Redevelopment Agency of the City of Los Angeles
46 rentals targeted to seniors at 30-50% of AMI, LifeSTEPS to provide on-site senior center with free senior social services programming for a minimum of 10 years. In dense commercial corridor in Southeast Los Angeles.
Los Angeles
$2,038,050 QIP/So Cal
Subterranean parking structure; alleyway improvements; utility connections and expansion; streetscape improvements; city impact fees.
Broadway Villas
AMCAL Multi-Housing Inc. & Community Redevelopment Agency of the City of Los Angeles
48 rentals targeted to seniors at 30-60% of AMI, 48 parking spaces, on-site senior center and community room. In Broadway/Manchester Recovery Redevelopment Project Area in south L.A.
Los Angeles
$1,894,280 QIP/So Cal
Subterranean parking structure; impact fees; soft costs
The Villas at Gower
A Community of Friends & PATH Ventures
53 rentals targeted to homeless households where one adult has a disability, 16 for homeless or at-risk of homelessness, at 30% of AMI; 59 parking spaces, community space, near bus and light rail lines, special needs clinic, employment and retail.
Los Angeles
$1,810,000 QIP/So Cal
Parking structure; offsite improvements including curb and gutter, sidewalk, street lights and trees; Disposition Agreement with RDA.
La Coruña Senior Apts.
La Coruna Senior Apts. LP
87 rentals for seniors at 30-60% of AMI, 52 parking spaces, educational services, community room, fitness center and computer room.
Panorama City
$3,944,897 QIP/So Cal
Subterranean parking structure; site prep; curb and gutter, sidewalks, parkway landscaping and street trees
Appendix I
Appendix I EEEEvaluation of California’s TODvaluation of California’s TODvaluation of California’s TODvaluation of California’s TOD Housing and IIGHousing and IIGHousing and IIGHousing and IIG ProgramsProgramsProgramsPrograms

Sherman Village
Sherman Village Apts. LP
73 rentals targeted to families at 30-60% of AMI; 73 parking spaces, within 1/2-mile of park, public school.
Reseda $3,569,960 QIP/So Cal
Semi-subterranean parking, site preparation, clearing, excavation, and grading; sewer and storm drain; sidewalks, parkway landscaping and street trees.
Ballpark Village Ballpark Village LLC
791 ownership homes with 34 targeted to low-income homebuyers; 134 rentals targeted to families at 30-60% of AMI, with 7 reserved for persons who are homeless, have HIV/AIDS or mental illness. In the Ballpark District of downtown San Diego's East Village.
San Diego $24,690,880 MPP/So Cal
Funding for 791 of required 1,188 parking spaces; environmental remediation
15th & Commercial
S.V.D.P. Management, Inc.
Mixed-use, 12 stories, 75 transitional rentals for formerly homeless individuals, 39 rentals for families at 30-40% of AMI, 25 rentals for tenants eligible under MHSA; less than 1/4-mile of 12th Street and Imperial Transit Center.
San Diego $3,089,027 QIP/So Cal
Demo of existing center; site preparation; enlarging utilities; street and curb/gutter/sidewalk perimeter improvements; subterranean garage; noise mitigation work.
Chinatown Yale/Ord Streets Pedestrian Linkage Project
CRA Los Angeles, Affirmed Housing
60 affordable units for 30-60% AMI in a 5 story structure.
Los Angeles
$3,400,000 QIP/So Cal Pedestrian walkway, landscaping, excavation, connect transit hub to housing.
National City
Related Companies, Community Housing Works
201 units of affordable housing in a TOD project near a trolley stop.
San Diego $11,238,516 MPP/ So Cal Open space preservation, parking stalls, improved pedestrian access
Appendix I
Appendix I EEEEvaluation of California’s TODvaluation of California’s TODvaluation of California’s TODvaluation of California’s TOD Housing and IIGHousing and IIGHousing and IIGHousing and IIG ProgramsProgramsProgramsPrograms

CENTRAL VALLEY
Dinuba Senior Apts.
Chelsea Investment Corporation & City of Dinuba
66 rentals for seniors at 30-50% of AMI, community facilities, in center of Dinuba.
Dinuba $2,400,000 QIP/Central
Valley
Alley reconstruction for walking access to Transit Hub & Dinuba Vocational Center; bus shelters; sewer, storm drainage and water systems; infrastructure, street improvements, curb & gutter, pedestrian walkway
Chinatown Lofts
Fresno Historic Chinatown, LLC & Redevelopment Agency of the City of Fresno
Mixed use, 68 rentals targeting families at 30-60% of AMI in a redevelopment area of Downtown Fresno.
Fresno $4,038,640 QIP/Central
Valley
Site preparation including ingress and egress ramps, lighting, sidewalks and landscaping.
Transit Village City of Fresno & ROEM Development
133 rentals for seniors at 30-60% of AMI, on-site arts and crafts, health/fitness and computer education. By planned state-of-the-art bus transfer station.
Fresno $3,006,433 QIP/Central
Valley
Impact fees, soft and hard costs for new bus transit center; public park landscaping and irrigation; sidewalk and fence; utility connections.
Lindsay Centennial Infill Project
City of Lindsay
282 total homes, including 79 rentals targeted to families at 50% of AMI, adjacent to health clinic, medical/dental offices, new community pool, renovated public park, golf course and wellness center in the urban core of Lindsay.
Lindsay $4,604,253 QIA/Central
Valley
Site preparation, utilities, streets, curb/gutter, sidewalks, landscaping, streetscape; development & rehabilitation of parks, open spaces.
Appendix I EEEEvaluation of California’s TODvaluation of California’s TODvaluation of California’s TODvaluation of California’s TOD Housing and IIGHousing and IIGHousing and IIGHousing and IIG ProgramsProgramsProgramsPrograms

Gentrification Risk Assessment (by Census Tract*) of TOD Awarded Project: Developed by Karen Chapple, UC Berkeley
TOD Award Round Project Name City
Already Gentrified
1990-2000*
Risk of Gentrification (5 = Highest
Risk)
RISK FACTOR 1:
% of workers taking transit > regional avg
RISK FACTOR 2:
% nonfamily households
> regional avg
RISK FACTOR 3:
% 3+ units in buildings
> regional avg
RISK FACTOR 4:
% renter occupancy
> regional avg
RISK FACTOR 5:
% rent-burdened
households > regional avg
1 Rosslyn Lofts Los Angeles
No 5 Yes Yes Yes Yes Yes
1 Ten - Fifty B San Diego No 5 Yes Yes Yes Yes Yes
1 MacArthur Park B
Los Angeles
No 5 Yes Yes Yes Yes Yes
1 MacArthur Transit Village
Oakland Yes 5 Yes Yes Yes Yes Yes
1 Bonnie Brae Apartments
Los Angeles
No 5 Yes Yes Yes Yes Yes
1 The Railyards Sacramento No 5 Yes Yes Yes Yes Yes
2 The Railyards Sacramento No 5 Yes Yes Yes Yes Yes
2 15th and Commercial
San Diego No 5 Yes Yes Yes Yes Yes
2 Golden Gate Avenue (Central YMCA)
San Francisco
Yes 5 Yes Yes Yes Yes Yes
2 5555 Hollywood Los Angeles
No 5 Yes Yes Yes Yes Yes
2 Blvd 6200 - North
Hollywood No 5 Yes Yes Yes Yes Yes
1 Grand Avenue Apartments
Los Angeles
Yes 4 No Yes Yes Yes Yes
1 Commercial 22 San Diego No 4 Yes Yes No Yes Yes
1 MacArthur Park Metro Apartments Phase A
Los Angeles
No 4 Yes Yes Yes Yes No
1 Coliseum BART Station Transit Village
Oakland No 4 No Yes Yes Yes Yes
*Census Tract: Census designation of an area that is smaller than a county **Tracts that have already gentrified are (1) in the central city; (2) have 1990-2000 increases in educational attainment beyond the regional average; (3) have 1990-2000 increases in housing appreciation above the regional average; and (4) started in 1990 below 80% of Area Median Income.
Appendix J EEEEvaluation of California’s TOD valuation of California’s TOD valuation of California’s TOD valuation of California’s TOD Housing and IIGHousing and IIGHousing and IIGHousing and IIG ProgramsProgramsProgramsPrograms
Appendix J EEEEvaluation of Californiavaluation of Californiavaluation of Californiavaluation of California’s TOD ’s TOD ’s TOD ’s TOD Housing and IIGHousing and IIGHousing and IIGHousing and IIG ProgramsProgramsProgramsPrograms
Appendix J EEEEvaluation of California’s TODvaluation of California’s TODvaluation of California’s TODvaluation of California’s TOD Housing and IIGHousing and IIGHousing and IIGHousing and IIG ProgramsProgramsProgramsPrograms

TOD Award Round Project Name City
Already Gentrified
1990-2000?*
Risk of Gentrification (5 = Highest
Risk)
RISK FACTOR 1:
% of workers taking transit > regional avg
RISK FACTOR 2:
% nonfamily households
> regional avg
RISK FACTOR 3:
% 3+ units in buildings
> regional avg
RISK FACTOR 4:
% renter occupancy
> regional avg
RISK FACTOR 5:
% rent-burdened
households > regional avg
1 Lion Creek Crossing
Oakland No 4 No Yes Yes Yes Yes
2 1000 Fourth Street Family Housing
San Francisco
No 4 No Yes Yes Yes Yes
2 Chinatown Metro Apts
Los Angeles
Yes 4 No Yes Yes Yes Yes
2 South Hayward BART Mixed Use - Family & Senior
Hayward No 4 No Yes Yes Yes Yes
2 Long Beach & Anaheim TOD
Long Beach No 4 No Yes Yes Yes Yes
1 San Leandro Crossings
San Leandro
No 3 No Yes Yes Yes No
1 Chinatown Blossom Plaza
Los Angeles
No 3 No Yes Yes Yes No
2 The Boulevard at North Park
San Diego No 3 No Yes Yes Yes No
1 Armstrong Place Senior Housing
San Francisco
Yes 2 No No No Yes Yes
1 Trestle Glen *App Withdrawn
Colma No 2 No Yes No No Yes
2 Curtis Park Village
Sacramento No 2 No Yes No Yes No
1 Union City Intermodal Station District
Union City No 1 No No No Yes No
*Tracts that have already gentrified are (1) in the central city; (2) have 1990-2000 increases in educational attainment beyond the regional average; (3) have 1990-2000 increases in housing appreciation above the regional average; and (4) started in 1990 below 80% of Area Median Income
Appendix K EEEEvaluation of California’s TOD valuation of California’s TOD valuation of California’s TOD valuation of California’s TOD Housing and IIGHousing and IIGHousing and IIGHousing and IIG ProgramsProgramsProgramsPrograms
Appendix J EEEEvaluation of California’s TODvaluation of California’s TODvaluation of California’s TODvaluation of California’s TOD Housing and IIGHousing and IIGHousing and IIGHousing and IIG ProgramsProgramsProgramsPrograms

Density Range Scoring Numbers in the shaded area are either the potential points (or, if listed with a development name, the actual points awarded)
for the specified "population per square mile of land area" and "transit mode."
Population per square mile of land area
0-1000
1001-2000
2001-3000
3001-4000 4001-5000 5001-6000
6001-8000 8001-10000 10000-13000
13,001+
Transit Mode
Heavy Rail (BART, METRO Red Line)
29 31 33 37 41 points: Union City
44 48 points: Coliseum BART Lion Creek Crossing
50 points: MacArthur Transit Village Trestle Glen 1000 Fourth St. Chinatown Metro Apts
53 55 points: Grand Avenue Rosslyn Lofts MacArthur Park A MacArthur Park B Bonnie Brae Golden Gate Ave. South Hayward BART Blvd. 6200 5555 Hollywood
Light Rail/ Bus Rapid Transit
21 22 23 27 points: The Railyards
31 35 38 points: Curtis Park Village 15th and Commercial
42 points: Long Beach/AnaheimTOD Comm 22 Ten Fifty B
46 50 points: Armstrong Place
Rapid Bus / Express Bus
20 20 20 22 24 26 28 30 33 36
Commuter Rail (Capitol Corridor, Caltrain, Metrolink, Surfliner, Coaster), Ferry, Non-Express Bus Hub
19 19 19 20 22 24 26 27 29 30
Appendix K EEEEvaluation of California’s TODvaluation of California’s TODvaluation of California’s TODvaluation of California’s TOD Housing and IIGHousing and IIGHousing and IIGHousing and IIG ProgramsProgramsProgramsPrograms

Glossary The following are definitions of terms used in this report: Affordable bedroom — A bedroom in an affordable home. Affordable home — A home that is affordable to households earning less than a certain area median income. When used generally, refers to homes affordable to households with incomes at or below 80–120% of the area median income. Also known as a “below–market-rate” home. Area median income (AMI) — The income level (in a defined area) at which half of the households earn more and half of the households earn less. Usually measured by county or metropolitan statistical area. Car sharing — A system in which people pay a fee that gives them access to a shared vehicle or pool of vehicles, usually parked in an easily accessible location. Extremely low income — A household with an income at or below 30% of the area median income. General Plan — The state-mandated, comprehensive, long-term plan for the physical development of a city, county, or city and county. Essentially a local government's "blueprint" for development. Headway or headway frequency — The time, usually expressed in minutes, between trips on the same transit route. Home — An apartment, loft, condominium, town-home, single-family home, or other form of construction that is intended as a residence. May be rental or ownership. Housing Element — One of seven required elements of a local government’s General Plan, which specifies how the jurisdiction will meet its existing and projected housing needs. Infill development — Development occurring in established areas that are already predominantly developed or urbanized. Infill development can occur on long-time vacant lots or on pieces of land with dilapidated buildings, or can involve changing the use of a property from a less to a more intensive use, such as a surface parking lot to family apartments. Infrastructure — The network of communications and utility services, such as roads, sewers, electricity, water, gas and telecommunications, needed to support an area that is developed. Low income — A household with an income at or below 80% of the area median income. Moderate income — A household with an income at or below 120% of the area median income. Market-rate — A rental or for-sale home for which a landlord or developer, at his/her own discretion, determines how much to charge. Also refers to homes with no restrictions in the deed that limit the amount that can be charged for rent or a mortgage. Mixed-use — A type of development that combines various uses, such as office, commercial, institutional, and residential, in a single building or on a single site. Single-room occupancy (SRO) hotel — Multiple-tenant building that generally houses individuals in single rooms with shared bathrooms and/or kitchens. Although many are former hotels, SROs are primarily rented as permanent residences. Transit-oriented development — A mixed-use residential or commercial area designed to maximize access to public transportation, and which often incorporates features to encourage transit ridership. A TOD neighborhood typically has a center with a train station, light rail station, tram stop, or high frequency bus hub or corridor surrounded by relatively high-density development. TODs generally are located within a radius of one-quarter to one-half mile from such a transit stop.
Appendix L EEEEvaluation of California’s TOD valuation of California’s TOD valuation of California’s TOD valuation of California’s TOD Housing and IIGHousing and IIGHousing and IIGHousing and IIG ProgramsProgramsProgramsPrograms

Transit-supportive amenities — Features that enhance and add to the value or desirability of a transit-oriented development, including stores, services, medical offices, libraries, parks, educational facilities, senior or youth programs, employment centers, etc. May also refer to features that facilitate pedestrian and bicycle travel to transit and other destinations, including sidewalks, lighting, benches, bike lanes, shade trees, crosswalks, and signals. Very-low income — A household with an income at or below 50% of the area median income.
Appendix L EEEEvaluation of California’s TOD valuation of California’s TOD valuation of California’s TOD valuation of California’s TOD Housing and IIGHousing and IIGHousing and IIGHousing and IIG ProgramsProgramsProgramsPrograms

Housing California would like to thank our advisors for their expertise and input to this evaluation: TOD/IIG Advisory Committee Members for Rounds 1 and 2
• Bob Allen and Vu-Bang Nguyen, Urban Habitat • Susan Baldwin, San Diego Association of Governments • Dena Belzer, Strategic Economics • Karen Chapple, UC Berkeley • James Corless, Metropolitan Transportation Commission • Jeff Hobson, TransForm • Shelley Poticha and Abigail Thorne-Lyman, Reconnecting America • Beth Steckler, ClimatePlan • Sarah Truehaft, PolicyLink
Land Use and Finance Working Group for Rounds 1 and 2 • Joan Burke, Loaves and Fishes • Tom Collishaw, Self-Help Enterprises • Cesar Covarrubias, Kennedy Commission • Elissa Dennis, Community Economics • Karen Flock, Cabrillo Economic Development Corporation • Michael Lane, Self-Help Enterprises • Felicity Lyons, California Coalition for Rural Housing • Nevada Merriman, Mid-Peninsula Housing Coalition • Tim O'Connell, Century Housing • Doris Payne-Camp, San Diego Housing Federation • Ben Phillips, Mercy Housing • Mike Rawson, California Affordable Housing Law Project • Shamus Roller, Sacramento Housing Alliance • Kalima Rose, PolicyLink • Matt Schwartz, California Housing Partnership Corporation • Tom Scott, San Diego Housing Federation • Joshua Simon, Northern California Community Loan Fund • Mona Tawatao, Legal Services of Northern California • Paul Zimmerman, Southern California Association of Non-Profit Housing
Appendix M EEEEvaluation of California’s TOD valuation of California’s TOD valuation of California’s TOD valuation of California’s TOD HHHHousing and IIGousing and IIGousing and IIGousing and IIG ProgramsProgramsProgramsPrograms