housing and land use - city of ashland
TRANSCRIPT

Normal Avenue Neighborhood Plan – Housing and Land Use Framework
Introduction
The purpose of the housing and land use framework is to illustrate alternatives for the concentration, density and types of land uses and housing. This framework and the included illustrative plans, builds on the work completed for mobility, greenway and open space, infrastructure and sustainable neighborhood frameworks. In addition, this framework is largely based on work completed by the city of Ashland for the buildable lands inventory and the housing needs analysis.
Existing Conditions
The Normal Avenue neighborhood is situated between East Main Street to the north and the railroad tracks to the south, Clay Street to the east and the Ashland Middle School to the west (Figure 1). Currently, the 94 acre area has a mix of Comprehensive Plan designations including single family residential and suburban residential, and is presently outside the City of Ashland (City) city limits but within the City Urban Growth Boundary (UGB).
This area constitutes the largest remaining area of residentially designated land that is suitable for medium‐ to high‐density development which remains largely vacant or redevelopable. The plan area contains 35 properties ranging in size between 0.38 acres up to 9.96 acres. There are 26 property
owners within the plan area with a number owning multiple parcels. Residential development in the plan area has historically been low density ‐ rural residential large lot single family homes ‐ consistent with Jackson County (County) zoning standards. Single family homes on large (up to 2 acre) lots are predominately located along East Main St, or in the south west corner of the plan area adjacent to Normal Ave.
Existing developments within the plan area include 21 Single family homes on individual lots and four religious institutions. Actively farmed properties include approximately seven acres with the remainder of the vacant lands
kept largely in a natural state.
Figure 1. Study Area
1

Land Uses Likely to be Developed in the Normal Avenue Area
This section explains the types of land uses likely to be in demand within the study area.
Housing. The most suitable land use of the Normal Avenue area is housing. Housing makes sense for the area because the population and number of households in Ashland are expected to grow in the coming decades. Despite the fact that housing construction continues to struggle in many areas, Ashland remains a popular location for retirees and families; the area is surrounded by residential neighborhoods and residential amenities such as schools, parks, commercial areas, and natural areas; the area is relatively close to employment centers including downtown Ashland. Finally, housing is supported by the City’s comprehensive plan designation and zoning; and housing is the preferred use by current residents of the area, based on a survey conducted by the City.
Because of Ashland’s position in the Greater Bear Creek Valley Regional Plan and the City and region’s commitment to focus on innovative land use strategies, rather than future “growth areas,” the long term planning and development of the Normal Avenue neighborhood takes on a greater significance toward meeting the community’s future housing needs.
Thus, from both policy and market perspectives, housing makes sense. As described in more detail below, a wide range of housing will be possible on the site, including single‐family, attached housing such as townhomes, apartments, senior, student, and affordable housing.
Retail. The Normal Avenue area is a weak location for retail. If any retail is built here at all, it will be on a small scale, such as a coffee shop or single restaurant. Such a small retail corner is possible, but not probable—for most landowners and developers, simply building housing will be easier and more profitable; whereas most retail uses are financially infeasible and will struggle to gain financing. This is a weak retail location because: traffic volumes through and by the area are low; most retail will gravitate towards more central locations on Ashland Avenue and Siskiyou Streets, where traffic volumes and visibility are much higher, and larger populations have access to retailers; and a number of barriers (train tracks, schools to the west, and streams) will prevent easy navigation to and through the site. Future residents should be able to meet most of their commercial needs at an existing grocery‐anchored center and other retail on Ashland Avenue, less than half a mile away.
Finally, several religious institutions have been built at the northern border of the area along North Main Street. These sites are probably the best commercial sites within the area (due to higher visibility and access), but will be unavailable for retail development, at least for the foreseeable future.
Office. Office space is highly unlikely to be in demand on the site. White collar employment growth, and therefore demand for office space, is slow in Ashland; demand for new office space is more likely to be developed in more central locations served by major arterial roads, and near existing employment hubs such as the downtown. An exception is Southern Oregon University, covered below.
Industrial. Ashland’s comprehensive plan calls for industrial development to take place in two other areas of the city that are not particularly close to the subject site. Industrial developers typically look for flat topography, large sites, low cost land, easy transportation access, and separation from residential land uses. The subject area has uneven topography (due to streams and wetlands) and is surrounded on most sides by housing.
Civic and institutional. Some types of development are not directly driven by private sector demand and development. These include civic uses (such as libraries, police stations, etc.), schools and higher educational facilities, and medical and hospital facilities. While these types of uses may be possible in
2

the study area, as of the writing of this memorandum, we have not been provided with any reason to believe that public agencies or institutions are strongly considering siting facilities in the area.
Religious institutions. There are four religious institutions already located within the subject area—a considerable number given its largely undeveloped nature. This pattern is typical in areas located within Urban Growth Boundaries (UGB) but outside of city boundaries, where development standards prohibit urban development, but allow churches and temples.
Local and National Demographic Trends
This section summarizes local and national demographic trends that are expected to affect housing demand in the Normal Avenue area. The information is drawn from the City’s Normal Avenue Existing Conditions Report, Housing Needs Analysis (HNA), and Ashland Buildable Lands Inventory (BLI), and from Leland Consulting Group’s own research and analysis.
Ashland’s population is expected to grow, albeit relatively slowly, in the coming two decades. Population and household growth drive demand for new housing; without growth, there will be no housing demand. Between 2010 and 2030, the BLI projects that the city’s population will grow by 3,256, or about 1,604 new households. This represents an average annual growth rate of 0.75 percent—about one half the growth rate of Jackson County as a whole (1.4 percent).
In theory, there is adequate land within the city’s current boundaries to accommodate the demand for new housing in the next two decades. Population projections anticipate up to 1,604 new housing units will be needed by the year 2030, while the BLI shows a current housing capacity within city limits of 1,883 new dwelling units.
Nationally, Millennials or “Echo Boomers” are a fast growing population group. Along with the Baby Boomers, the nation’s other large population group is the Millennials, now aged approximately 15 to 35. This group will be moving into their own housing in the coming decade and is expected to want relatively small, affordable rental units that are in diverse and walkable neighborhoods. While there was no growth in Ashland in this group in the past decade, if Ashland follows national trends, there should be future demand for this type of housing product.
Older segments of the population are growing fast, while other segments are growing slowly or not at all. As Figure 2 below shows, the number of Ashland residents 55 to 74 years of age increased significantly from 2000 to 2010. The city lost population in the 35 to 54 age group, while most other age groups remained about the same. While these dynamics are unique to Ashland, they also reflect the nationwide trend towards a much higher number of older Americans as the Baby Boomers, the largest generation, ages. Since Ashland, due to its climate and small‐town charm, is a popular retirement destination, the aging trend will be even more pronounced here (the city was named one of the top 25 retirement destinations nationally by CNN in 2010). Housing for seniors will be very much in demand and will be the biggest driver of Ashland’s overall housing market, since it is where the largest net change in population is occurring.
3
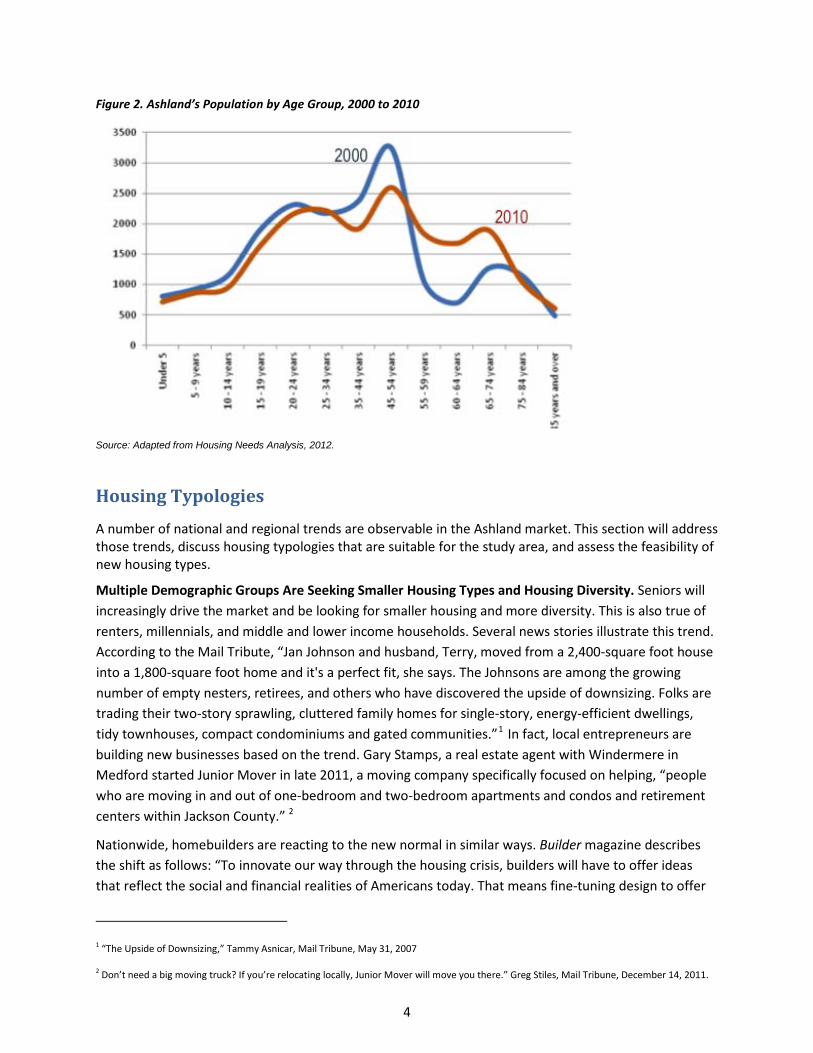
Figure 2. Ashland’s Population by Age Group, 2000 to 2010
Source: Adapted from Housing Needs Analysis, 2012.
Housing Typologies
A number of national and regional trends are observable in the Ashland market. This section will address those trends, discuss housing typologies that are suitable for the study area, and assess the feasibility of new housing types.
Multiple Demographic Groups Are Seeking Smaller Housing Types and Housing Diversity. Seniors will increasingly drive the market and be looking for smaller housing and more diversity. This is also true of renters, millennials, and middle and lower income households. Several news stories illustrate this trend. According to the Mail Tribute, “Jan Johnson and husband, Terry, moved from a 2,400‐square foot house into a 1,800‐square foot home and it's a perfect fit, she says. The Johnsons are among the growing number of empty nesters, retirees, and others who have discovered the upside of downsizing. Folks are trading their two‐story sprawling, cluttered family homes for single‐story, energy‐efficient dwellings, tidy townhouses, compact condominiums and gated communities.”1 In fact, local entrepreneurs are building new businesses based on the trend. Gary Stamps, a real estate agent with Windermere in Medford started Junior Mover in late 2011, a moving company specifically focused on helping, “people who are moving in and out of one‐bedroom and two‐bedroom apartments and condos and retirement centers within Jackson County.” 2
Nationwide, homebuilders are reacting to the new normal in similar ways. Builder magazine describes the shift as follows: “To innovate our way through the housing crisis, builders will have to offer ideas that reflect the social and financial realities of Americans today. That means fine‐tuning design to offer
1 “The Upside of Downsizing,” Tammy Asnicar, Mail Tribune, May 31, 2007
2 Don’t need a big moving truck? If you’re relocating locally, Junior Mover will move you there.” Greg Stiles, Mail Tribune, December 14, 2011.
4

more choices—in this case smartly downsizing to meet a mutually beneficial price point, while still preserving the sense of space that suburban buyers expect.”3
Figure 3, below, shows the changing supply and demand for housing types nationwide. Like many markets, the housing market changes, and will often not change quickly enough to satisfy new demand. Such is often the case during slow economic times, when new housing product is not being developed. Such circumstances emphasize the importance of master planning the Normal Avenue and other areas. In so doing, the community, City leaders, and development experts can develop a plan which may facilitate a transition from the previous market to the new. Developers and investors reduce their risks by developing a product that has been successful for them in the past. What the data and national trends suggest is that the demand for the previous product (conventional lots with detached single family homes) is diminishing.
Figure 3. Demand in 2035 for Residential Units in the largest four metropolitan areas, compared to supply for 2010
Despite the changing demand, between 2001 and 2011, 80 percent of the permits issued in Ashland were for detached single‐family homes. This is notable since it is the same decade during which the senior population was expanding. Therefore, the evidence suggests that, for the moment at least, older Ashland residents are still choosing single‐family homes over smaller, lower maintenance dwellings such as townhouses and condominiums. This may be partly the result of a lack of alternative housing typologies that better satisfy the needs of Ashland households, but may not yet be developed.
There are more renters in Ashland compared to the county and state. About half (51 percent) of Ashland residents own homes, while the other half (49 percent) rent. This home‐ownership rate is much lower than the county (63.3 percent) and state (63.8 percent) rates. This is probably due to the high number of college students (at Southern Oregon University), and the high cost of housing in Ashland. Yet between 2001 and 2011, only 20 percent of the permits issued in Ashland were for attached housing. Assuming that rental housing is not prohibited by regulation or the market, we expect a reversion to the
3 Architect Michael L. Woodley, “Halving it all,” Cheryl Weber. Builder, September 2012
5

mean. As much as 35 percent or more of all housing in the coming decades could be for rental housing, based on county, state, and national averages.
Ashland’s housing is expensive compared to local incomes. A major theme of the HNA is that the cost of housing in Ashland has been quite high, even during the recession, and is unaffordable to a large share of Ashland’s residents. For example, in 2011, after four years of decreasing home sale prices, the average sales price was approximately $285,000, which is only affordable to 23.8 percent of the population earning more than $75,000 per year. The average home price in Ashland in 2007, at the peak of the housing boom, was $438,750. This suggests several forces that may be impacting Ashland’s housing market:
• Wealth is coming in to Ashland via retirees and others relocating to the city, rather than being generated through jobs locally.
• The effective land supply may be lower than the supply calculated by the BLI. If land supply was as adequate and elastic as suggested by the BLI, housing prices should be more affordable to a larger segment of the population. Therefore, it is possible that a significant amount of land is being kept out of the buildable supply because it is still in use (for example, as yard space), controlled by absentee owners, or owners are holding out for higher prices in the future.
• Many who work in Ashland may be choosing to live in Medford or elsewhere in Jackson County to take advantage of lower home prices.
In any event, the HNA and BLI studies show a significant need for housing that is affordable to middle and lower income households (with annual incomes of $75,000 and below). While public policy may dictate a goal to provide housing for households of all incomes in Ashland, higher income households will tend to out bid lower income households for houses and land in the absence of clear and effective public sector actions and incentives.
Comparable Developments
In this section, we will share data and anecdotes related to somewhat recently constructed housing types, both in Ashland and elsewhere. This section provides further indication that there are national trends (e.g. aging) and local context (lack of affordable homes, higher rates of renters) which contribute to a changing housing demand in the Normal Avenue Neighborhood.
Several developments in Ashland and elsewhere in Jackson County illustrate the demand for senior housing, and the range of housing that seniors are looking for. Two notable projects are Twin Creeks in Central Point, and Mountain Meadows in Ashland. Twin Creeks is a large new community (230+ acres) that earned its builder, Vision Homes, the Oregon Small Builder of the Year Award in 2007. As shown in Table 1, the community plan calls for a range of housing (including single family, cottages, townhomes, and multistory apartments) as well carefully designed park space and planned retail within a new urbanist street network. Stacked and attached housing types comprise 62 percent of all housing. Only a third of all housing is expected to be single family.
Table 1. Planned Housing Mix, Twin Creeks Community
6

Housing Type Dus %Single Family 460 33%ADUs (Cottages) 82 6%Row Homes 162 12%Apartments or Condos 700 50%Total 1,404 100%
Mountain Meadows is another retirement community located just minutes away from the Normal Avenue Area. It occupies a similar landscape to Normal Avenue in that it is surrounded by some farms and open space, streams, and very close to I‐5. Like Twin Creeks, Mountain Meadows contains a mix of detached and attached housing (clustered housing and apartments) within a new urbanist inspired street network.
Neither community’s plan should necessarily be transferred directly to Normal Avenue, however, the attributes of these and other housing projects reflect some of the key features that seniors will be looking for in housing going forward. First, they will seek more diversity in terms of size and scale, with many opting for smaller attached living spaces and lower maintenance living. Second, they are seeking a community that offers opportunities to walk, access retail and services, and connect with people within and outside of their age group.
Cottage Courtyards
An increasingly successful housing product for developers in the Northwest is Cottage Courtyards or Pocket Neighborhoods. This housing type has been especially profitable in markets where affordable, safe, and secure homes are difficult to attain for first homebuyers, and seniors who wish to downsize.
Small one to two story cottages ranging from as little as 500 to 1,200 sq. ft. are gathered around common greens, courtyards, or carless greenways (as depicted in Figure 4). These common greens function as scommon open spaces. In turn, the individual private lots are very small, sometimes little bigger than thehouse with modest yards. This type of developmrequires less infrastructure than standard housindevelopments since roads are replaced by small common greens. Auto access is either from a rear alleyway behind each cottage, or a grouped parking court or row of garages within close walking distance of each cottages.
hared
ent g
Additional community amenities are often added to the common space, such as a community building, an outdoor fireplace, benches, and gardens.
Cottage Green development has been introduced in urban as well as suburban and rural markets to resounding Figure 4 Examples of Cottage Greens
7

success, especially in the Seattle and Puget Sound region. The Cottage Company has integrated such housing developments in various jurisdictions throughout the Puget Sound. Seabrook on the Washington Coast (designed by Laurence Qamar, Town Planning Corp.) has also transitioned during the 2008‐2012 recession to Cottage Courtyard housing as a strategy to weather the national housing downturn. This has enabled the developer to reduce infrastructure costs, reduce purchase prices, and meet a growing market demand for smaller affordable homes for young families, singles, seniors, and couples.
The developers of Seabrook (Figure 5) on the Washington Coast report, “Our sweet spot house price range is from Upper 200's to middle 400's these days. We use an upgrade system to let people feel like they get the best base value and then decide to upgrade within their comfort ranges.” Some of the most successful cottages have been 16’ x 26’, two stories, and two bedrooms. The sites are just large enough to allow an optional ground floor bedroom addition as an upgrade.
Figure 5 Seabrook Recent Development
Local proposals for development within the study area
As a more local example, in 2010 and 2011, preliminary plans were submitted to the City for development of the Calvary Baptist church site. The plan was for the "Ashland Village Apartments"
8

which included 183 apartment units on a 10 acre parcel. Though the developers have not yet proceeded with a formal application for development of the Apartments, it does provide some evidence that financiers, designers and developers are proposing new housing types in Ashland and even within the Normal Avenue Neighborhood study area. The Ashland Village Apartments plan anticipated annexation into the City at a multi‐family zoning density and would have utilized density transfers – essentially transferring the development potential from floodplains and Water Resource Protection zones into the buildable land on site. With 32 affordable units – the related density bonuses were also used to increase the capacity of the site. There were 5 buildings proposed, a community building/ club house and four apartment buildings at 42, 77, 24, and 40 units).
The units in the Apartment building were smaller than the surrounding houses and smaller than other developments in Ashland. Many, 135, were three bedroom units intended for young families who cannot afford a detached single family home. There were also 24 studio units, a housing type not found within or near the study area. The three bedroom units were to range between 1250 and 1448 square feet. The two bedroom units were 899 square feet; and the studios only 486.
Another preliminary development proposal (pre‐application)l was submitted to the City for lands within the study area back in 2003‐2004. This concept plan included a total of 240 units including townhomes, detached single family houses, and condominiums. The plan included garages off of alleys and other features to enable a higher density design. There were affordable units included yielding the designers a density bonus. The plan included 51 single family houses, 95 townhouses, and 94 condominiums.
In conclusion, there should be demand for a wide range of housing in Ashland in the coming two decades, though the overall number of units in demand will be relatively modest (about 80 dwelling units per year). New residents will demand housing in each of the categories listed below. This list, and the housing mixes described later, respond to both policy and market considerations. They are intended to meet both the needs of Ashland’s current and future residents, and the development community’s need to build financially viable products. The types of housing in demand in the area are:
• Seniors should be looking for a range of housing types, including single‐family homes, townhouses, cottage housing, and larger facilities that combine healthcare with housing such as assisted living.
• Single‐family homes should continue to be in demand from seniors, families, and others, based on demonstrated historic demand in Ashland.
• Millennials and university students will seek out affordable rental apartments and urban living options. However, most university housing will probably be accommodated on campus.
• Affordable housing options, particularly small‐lot single‐family homes, attached housing, and apartments will be in high demand if they can be made available.
• Live‐work housing is possible, but should be very limited. Developers have found that live‐work residents prefer main streets and arterials with relatively high pedestrian or auto volumes, and visibility, and it is not evident that any streets in this area will have these qualities.
Assuming supportive zoning, most of these housing types will be in demand within the Normal Avenue area. An exception is higher density, mixed‐use mid‐rise housing for Millennials, who would likely prefer to live closer to the collection of restaurants, retail, and activity in downtown Ashland.
Figure 6 below shows all of the housing types discussed here. A large green check mark indicates that the housing type is definitely suitable for the Normal Avenue area; a smaller check mark indicates the type is somewhat suitable, but should be built in limited quantities.
9

Figure 6. Housing Types and Suitability for Normal Avenue Area
Single FamilyLarge Lot• 3 - 6 du/acre• (> 5,000 sf lots)
Single FamilySmall Lot• 8 -12 du/acre • (< 5,000 sf lots)
Cottage Housing• 10 – 20 du/acre
Townhomes• 10 - 25 du/acre
Garden Apartments• 20 – 35 du/acre
Mixed-Use Mid-Rise• 40- 80 du/acre
10

Senior Housing• Density
varies
Affordable Housing• Density
varies
Student/Faculty Housing• Density
varies
LiveWork• Typically a
part of a larger development
Buildable Lands and Development Projection
As Table 2 shows, the City of Ashland calculates that there are a total of 94 acres of land in the Normal Avenue area, of which 38.7 acres are undevelopable and 55.3 acres, or 59 percent of the total, are buildable. This ratio of net buildable to gross is slightly lower than typical, but reasonable given the amount of wetlands, streams, and already developed properties in the area, as well as the right‐of‐way and parks that will need to be added as the area is developed. This information and other tables below rely on the City’s BLI and Existing Conditions reports.
Leland Consulting Group’s buildable lands evaluation was completed in order to provide a second look or “reality check” on the assessment already completed by the City. In general, this analysis confirms the earlier work.
Table 2. Gross and Net Buildable Areas
Area Acres PercentGross Area 94.0 100%Less Unbuildable
Streams and WetlandsDeveloped PropertiesUnbuildable PropertiesROWParksSubtotal 38.7 41%
Net Buildable 55.3 59%
Source: City of Ashland.
11

The two different types of zoning in the area are Single Family Residential, which allows housing development between 4.5 and 6.0 dwelling units per acre, and Suburban Residential, which allows between 7.2 and 9.0 dwelling units per acre. However density bonuses are available for affordable housing (up to 35%), energy efficiency (15%), major recreation facilities (10%) and common open space (10%) with a cumulative maximum of a 60% increase in base density. As a result the maximum density on the site under the existing designations could range from 7.2 to 11.5 units per acre. Therefore, the density of development realized in the area can, and probably will, vary from property to property based on the approach of each property owner, developer, and architect. This analysis assumes that the current zoning remains as is. Obviously, if the area was rezoned to allow lower or higher density housing, the amount of housing that could be built could change dramatically.
This analysis assumes that, while the development styles and densities on individual properties will vary, an average density will be realized across all properties of similar zoning. This average is calculated as half way between the lowest density allowed by code, and the highest density allowed with the affordability bonus, rounded to the nearest whole number. The average also happens to be the same as the highest density allowed without the affordability bonus.
Table 4 shows the number of properties by zoning and the total number of dwelling units that could be accommodated at full build out, assuming a 100 percent “development rate” (i.e., all vacant and partially vacant properties are redeveloped). Partially vacant properties are those that are currently occupied by housing (large lot estates and rural single‐family homes) and religious institutions, but still have area that could be redeveloped (yards, natural areas, farmland, parking lots, storage, etc.). Under this scenario, 428 dwelling units could be built in the Normal Avenue area.
Table 4. Number of Properties and Dwelling Units
Zoning and Number of Buildable Average Dev. DwellingDevelompent Status Properties Area Density Rate UnitsSingle Family Residential 15 22.6 134
Vacant 3 9.8 6.0 100% 58 Partially Vacant 9 12.8 6.0 100% 76 Developed 3 - - - -
Suburban Residential 20 32.8 294 Vacant 7 17.9 9.0 100% 161 Partially Vacant 9 14.9 9.0 100% 133 Developed 3 - - - - Undevelopable 1 - - - -
Total 35 55.3 428
12

Source: City of Ashland, and Leland Consulting Group.
If some properties do not redevelop completely, however, less housing would get built. For example, if only 60 percent of the partially vacant properties are developed, the area would accommodate 345 housing units. It is probably realistic to assume that, during the planning timeframe for this project (the next 20 years), not all of the partially vacant land will develop, and that therefore, the total amount of housing that could be built is somewhere between 345 and 428 units. This is very much in line with the City’s forecast of 346 dwelling units.
In making long‐term forecasts, some public agencies have found it useful to think in terms of a “range” rather than “point” forecasts; for example, the range between about 340 and 430 dwelling units. A range forecast acknowledges that it is very difficult to predict precisely what will take place over the long term, but easier to be confident about a range of outcomes. Further, a range forecast recognizes that various public and private actions (for example, connecting an improved Normal Avenue through this site, or incentives for redevelopment) affect outcomes. If the City wants to reach one end of the range, it can pursue different strategies. Portland’s Metro government, for example, used range forecasts in its recent UBG expansion planning work.
The amount of buildable lands and pattern of future development will be explored further as this planning process proceeds, especially during the charrette, where planners and stakeholders will design transportation networks, parks, and conceptual building lot layouts.
Based on these build out assumptions, the Normal Avenue area would capture between 22 and 27 percent of all of Ashland’s housing demand during the next 20 years. (The BLI projects demand for 1,604 new dwelling units in Ashland during this time.)
Housing Mix
Residential communities today take many shapes. In past decades, new suburban neighborhoods were relatively homogenous areas made up of small variations on a single housing model. Today, in response to a much greater diversity of households (seniors, more singles, couples and single‐parent households, etc.) and housing preferences, new residential communities offer a diversity of housing types. Orenco Station, an award winning residential community in Hillsboro, Oregon, is a good example. It now includes single‐family homes, attached homes, townhouses, apartments, condos, and mixed‐use buildings ranging in density from four to 40 units per acre. Portions of the Orenco Station community feature single family houses, on moderately sized lots, in a somewhat conventional pattern. Elsewhere, two, three, and four story apartments are available. Before the planning for Orenco, neither Hillsboro nor any nearby cities had a master planned area with such a mix and diversity of housing types. In order to construct the mix, the zoning ordinance required amendment, allowing for skinny streets, slight setbacks, alley loaded garages, and other accommodations.
In the Normal Avenue area, the City of Ashland can achieve its goals for housing diversity and accommodating a growing population by allowing a range of housing types. Table 5 shows one way that a range of housing types could be accommodated. (Note that for the sake of simplicity this table only considers the area zoned Suburban Residential.)Table 5. Illustrative Housing Mix (Suburban Residential Area Only)
13

Housing Type Percent Dev. Total
Low High Model of Area Area UnitsSingle Family - Large Lot 3 6 6 12% 3.9 23 Single Family - Small Lot 8 12 8 54% 17.7 141 Cottage 10 20 10 20% 6.6 65 Townhomes 10 25 12 10% 3.3 39 Garden Apartments 20 35 20 4% 1.3 26 Mixed Use Mid Rise 40 80 60 0% - - Total 100% 32.8 294 Average Density for all Housing Types 9.0
Density
Source: Leland Consulting Group.
The average density of the area under this build out scenario is nine dwelling units per acre—the same as the recently‐built neighborhood (adjacent to the study area and south of Creek Drive) that includes only single‐family homes. This is just one illustrative example of how a range of housing types can be accommodated at Normal Avenue. This scenario assumes a predominance of single family units, and results in a low number of total units compared with the identified goals of the City’s growth management strategies.
Affordability
As discussed above and in the City’s Draft Housing Needs Analysis, housing in Ashland is not affordable to many of its residents. The City should consider a range of strategies in order to increase housing affordability, including:
• Keeping the existing density bonus for affordable units in place, and the requirements that it be utilized for newly annexed areas.
• Consider using the City’s Community Development Block Grant (CDBG) and Housing Trust Fund programs to incentivize affordable housing development in the study area.
• Annex land that is now in the UGB to the City. The Normal Avenue area is such an opportunity. • Consider rezoning some land that is now Single Family Residential or Suburban Residential to a
residential zone that allows somewhat more density and housing diversity. Many neighborhoods built in the early 20th century include single‐family home areas of 12 or more units to the acre, and multifamily structures that are considerably denser. Again, this increases housing supply and will decrease cost.
• Look for strategic areas where allowed density can be increased to 15, 20, or 30 units per acre. These should be areas with good access to commercial services, jobs, and multimodal transit; otherwise, they become “pods” of density that are disconnected from the rest of the city and generate more traffic than is necessary. There may be some areas within the Normal Avenue area where increased density could be allowed.
• Make sure parking requirements are reasonable, especially for medium and high‐density projects. For example, a senior couple living in a townhome development often has only one car. Requiring two spaces may increase land acquisition or building costs unnecessarily. When there is not a compelling reason to do otherwise, consider letting the market decide how much parking is right.
• Look for ways to redevelop infill sites in the city by offering development incentives such as lower impacts fees (system development charges) for infill development, tax abatement for
14

achieving certain outcomes, or helping property owners to evaluate and remediate brownfield. The City already waives system development charges for new affordable housing developments. And for affordable units planned which exceed the required numbers of affordable units, Community Development and engineering fees are waived (see City of Ashland Resolution 2006‐13. Though the study area, there will not be brownfield redevelopment, and much of the area will be entirely redeveloped. But there may be opportunities for modest infill among the large lot residences which remain.
• Partner with local affordable homebuilders and Community Development Corporations (CDCs) to build affordable housing. These organizations should be very knowledgeable about developing and managing affordable housing that takes advantage of public and private funding sources such as CDBG, HOME Investment Partnership, Low Income Housing Tax Credits (LIHTC), funding from state agencies such as the Department of Human Services (DHS), HUD sources, and others.
15

Development Scenarios
Based on the information and data presented above and the work completed in the other Frameworks, the consultant team created two development scenarios for the study area. These scenarios are meant to illustrate the type of development that could occur on the site based on the consultant team’s preliminary research. The first development scenario illustrates development that is allowed under the existing Comprehensive Plan designations for the site, Suburban Residential and Single Family Residential. The second scenario was constructed using higher density Comprehensive Plan designations than are currently assigned to the parcels in the study area. These Comprehensive Plan designations Croman Mill – Neighborhood Central (CR‐NC), North Mountain Central (NM‐C) and North Mountain – Multi‐family (NM‐MF) are found in other areas of the City and are used as an example of how existing City requirements could be applied to the Normal Avenue Neighborhood. This exercise is meant to show how different densities might be developed on the site and should be only used to exhibit what is possible on the site.
While the two development scenarios are on similar block patterns, the types of units developed under each would be much different. For the higher density alternative the development might include garden style apartments and townhomes while the lower density alternative would include a higher proportion of single family homes. However, many would be on smaller lots; and there would also be some townhomes and duplexes.
Development Scenario Process
We started with a layout for blocks and lots that are compatible with typical Ashland detached single dwelling neighborhoods, consisting of 50 by 100 foot lots. The street layout roughly responds to the Mobility Framework and Greenway and Openspace Frameworks. However, gross density requirements were used to assess total build out, which was then checked against the draft concepts for lot layout.
There are two development scenarios articulated below. The first is based on the existing City Comprehensive Plan designations. However, other assumptions have also been made regarding annexation, density bonuses, etc. These assumptions are described below. The second scenario includes a more vibrant mix of units and higher densities.
Infill housing types were applied to the 50 x 100 foot lot module, referring to the Housing Types Analysis described above, and those housing types identified as being most feasible for this area of Ashland, according to the following:
• Center: 4 units per lot, with housing types ranging from higher intensity townhomes and garden apartments.
• General: 2‐4 units per lot, with housing types ranging from lower intensity townhomes, cottage housing, small lot single dwellings and duplexes.
• Edge: 1‐2 units per lot, with housing types ranging from single dwellings, duplexes and single dwellings with attached or detached accessory dwelling units.
The Comprehensive Plan Alternative applies the average units identified in the Housing Types Report, at 9 dwelling units per acre for Suburban Residential areas, and 6 dwelling units for Single Dwelling Residential areas (see Unit Counts Table ‐ Alternative A Comp Plan). The City has a number of ways for density bonuses to be achieved by developers. Section 18.88.040 of the City code describes a number of incentives and a maximum density bonus of 60%. Bonuses are available for common open space, energy efficiency, and for the provision of affordable units. Ashland requires a percentage of units be affordable
16

for annexations to be approved. Because of the likelihood of annexation prior to development, the required bonus density allocated for affordable housing units will likely increase the density of the study area. For all residential annexations, a plan shall be provided demonstrating that the development of the entire property will ultimately occur at a minimum density of 90% of the base density for the zone, unless reductions in the total number of units is necessary to accommodate significant natural features, access limitations, etc. Based on development data gathered by the City, developments of this sort could be expected to increase the density from the bases allowed from 15% to 25%. For the purposes of scenario planning, an average of 20% bonus was assumed.
As shown in the table, this Alternative yields 312 units. The High Density Residential Comprehensive Plan Alternative applies residential designations from Croman Mill and North Mountain Neighborhood Overlays. Using CM‐NC, NM‐C and NM‐MF designations, unit counts approximately matched up with the modular infill approach detailed for the Alternative above. As shown in the table (Alternative B Comp Plan High Density Residential), this Alternative yields 657 units. Dwelling units per acre were converted to units per lot for these calculations.
Alternative A –Comprehensive Plan designations in Study Area
17

Alternative A – Existing Comprehensive Plan
Suburban | 9 du/acre Single Family | 6 du/acre
• Assumed 20% density bonus, • Mix of duplexes and other types on both Suburban and Single Family designated lots.) • Based on Gross (buildable) acreage including roads and open space, excluding water
resource protection zones of 69 acres total
Block Units, Suburban Zone Units, Single Family Zone Total Units
A 20
B 14
C 10 7
D 17
E 7
F 15 5
G 3 15
H 26
I 25
J 15
K 22
L 17
M
SUBTOTAL 157 61 218
Optional lots
U 37
W 16
X 10
Y 20
Z 11
SUBTOTAL 37 57 94
TOTAL UNITS, ALL LOTS 312
18

Alternative B – Higher Density Residential (Lot lines are for illustrative purposes only)
19

Alternative B – Higher Density Residential
Center | per CM‐NC @ 3.44 units per 5,000 sf lot General | per NM‐C @ 2.30 units per 5,000 sf lot Edge | per NM‐MF @ 1.38 units per 5,000 sf lot
ALTERNATIVE B
Block Lots, Center Lots, General Lots, Edge Total Lots
A 16
B 11
C 14
D 14
E 6
F 4 10 2
G 4 10
H 8 13
I 6 14
J 5 7
K 18
L 12 2
M
SUBTOTAL 83 82 11 176
Units Total units
units 286 189 15 489
Optional lots
V 7
W 13
X 8
Y 16
Z 9
SUBTOTAL 46 7
Units on optional lots Total units on optional blocks
units 158 10 168
TOTAL UNITS, ALL LOTS 657
20

21
Scenario Analysis
Scenario A describes a mix of housing types, with a large proportion of detached single‐family houses, mixed with duplexes and a few townhomes. While fairly dense and efficient, it would not meet the City’s stated goal of helping to accommodate 20 years of new growth within the existing Ashland urban growth boundary, consistent with The City of Ashland’s commitment to the Greater Bear Creek Regional Plan. Scenario B, which mixes both multi‐family and single family development types creates a higher overall density and higher number of units which would more closely align with the City’s growth goals.