household water and electricity monitor …mtn.sun.ac.za/files/2014/04/utilitymonitor_muller.pdf ·...
TRANSCRIPT

HOUSEHOLD WATER AND ELECTRICITY MONITOR AND CONTROL WITH CELLULAR
COMMUNICATIONS AND WEB INTERFACE
R.I. MÜLLER
DEPARTMENT OF MECHANICAL AND MECHATRONIC ENGINEERING
25 OCTOBER 2013
© 2013 Fakulteit Ingenieurswese, Universiteit Stellenbosch

Household water and electricity
monitor and control with cellular
communications and web interface
Final Report
R.I. Müller
Supervisor: Dr M.J. Booysen
Department of Mechanical and Mechatronic Engineering
Stellenbosch University
2013

i
EXECUTIVE SUMMARY
Title of Project
Household water and electricity monitor and control with cellular communications and web interface
Objectives
Design and build a system to remotely monitor and control the water and electricity supply of a household through the Trintel SMART web platform by means of cellular communications.
Which aspects of the project are new / unique?
Combine the monitor and control of household water supply with that of the electricity supply in one system on a web platform. Investigate new sensory and control technology, focussing on integration. Design and manufacture a cost effective and reasonably accurate water flow meter.
What are the findings?
The combined system performs the required functions and as such proves the concept to be feasible and economically worth further research and development of the idea. The custom designed flow meter performs better than expected, but there is still ample room for improvement of the entire system.
What value do the results have?
The results will assist in determining whether the idea can be deemed lucrative or not. Also, it gives further insight into the functioning of the SMART platform.
If more than one student is involved, what is each one’s contribution?
N/A
Which aspects of the project will carry on after completion?
Similar services provided through the SMART platform will keep on running, while Trintel continuously test and improve the web platform. A decision may be made for further research into this project or to start testing it with a sample group of customers.
What are the expected advantages of continuation?
To optimise everyday water and electricity usage and by doing so saving resources and promoting sustainable living while setting the trend for cutting edge wireless solutions.
What arrangements have been made to expedite continuation?
Sufficient proof of successful tests is needed for the project to be considered for continuation. Marketability and sustainability tests by Trintel must have desired outcomes for such a service to the general public to be considered.

ii
OUTCOME ASSESSMENT
ECSA Exit Level Outcomes Assessed in this Module
Outcome Addressed in sections
1. Problem solving:
2, 4, 7, Appendix E Demonstrate competence to identify, assess, formulate and solve convergent and divergent engineering problems creatively and innovatively.
2. Application of scientific and engineering knowledge:
5.1, 5.3, 5.5 Demonstrate competence to apply knowledge of mathematics, basic science and engineering sciences from first principles to solve engineering problems.
3. Engineering Design:
5.3, 5.5, 5.6, Appendix H
Demonstrate competence to perform creative, procedural and non-procedural design and synthesis of components, systems, engineering works, products or processes.
5. Engineering methods, skills and tools, including Information Technology:
5.1, 5.3, 5.5, 6 Demonstrate competence to use appropriate engineering methods, skills and tools, including those based on information technology.
6. Professional and technical communication: Project Proposal, Progress Report, Final
Report, Oral Presentations, Project
Poster
Demonstrate competence to communicate effectively, both orally and in writing, with engineering audiences and the community at large.
8. Individual, team and multi-disciplinary working:
3, 5.3.2, 7, 8 Demonstrate competence to work effectively as an individual, in teams and in multi-disciplinary environments.
9. Independent learning ability: 3, 5.3.2, 5.2, 6,
References Demonstrate competence to engage in independent learning through well-developed learning skills.

iii
Department of Mechanical and Mechatronic Engineering
Stellenbosch University
Plagiarism Declaration
I know that plagiarism is wrong.
Plagiarism is to use another's work (even if it is summarised, translated or
rephrased) and pretend that it is one's own.
This assignment is my own work.
Each contribution to and quotation (e.g. "cut and paste") in this assignment from
the work(s) of other people has been explicitly attributed, and has been cited and
referenced. In addition to being explicitly attributed, all quotations are enclosed in
inverted commas, and long quotations are additionally in indented paragraphs.
I have not allowed, and will not allow, anyone to use my work (in paper, graphics,
electronic, verbal or any other format) with the intention of passing it off as
his/her own work.
I know that a mark of zero may be awarded to assignments with plagiarism and
also that no opportunity be given to submit an improved assignment.
I know that students involved in plagiarism will be reported to the Registrar
and/or the Central Disciplinary Committee.
Name: ........................................................
Student no: ........................................................
Signature: ........................................................
Date: ........................................................

iv
ACKNOWLEDGEMENTS
The author thanks Dr Thinus Booysen for his guidance and mentorship throughout the year as supervisor for this project.
Both Trintel and MTN are thanked for their financial backing of this project. The help and guidance received from all Trintel personnel is greatly appreciated.
The personnel of EEW, especially W. Croukamp are thanked for their patience and hard work during the manufacturing of the flow meter.
Finally, thanks also go out to the personnel of both the Process and the Mechanical and Mechatronic Engineering Departments’ technical divisions, especially A. Petersen and C. Zietsman for their assistance during testing.

v
TABLE OF CONTENTS
Page
List of figures ......................................................................................................... viii
List of tables ............................................................................................................. x
List of symbols......................................................................................................... xi
List of acronyms ..................................................................................................... xii
1. Introduction .................................................................................................... 1
2. Objectives ....................................................................................................... 3
3. Project Activities ............................................................................................. 4
3.1. Research ............................................................................................. 4
3.2. Flow Meter Design .............................................................................. 4
3.3. Concept Decision ................................................................................ 4
3.4. Hardware Procurement ...................................................................... 4
3.5. Software Development ....................................................................... 4
3.6. Training ............................................................................................... 5
3.7. Integration .......................................................................................... 5
3.8. Testing ................................................................................................ 5
3.9. Final Report ........................................................................................ 5
4. Literature Overview ........................................................................................ 6
5. Hardware ........................................................................................................ 7
5.1. Microcontroller ................................................................................... 8
5.1.1. Research ............................................................................. 8
5.1.2. Coding ................................................................................ 9
5.2. Modem ............................................................................................. 12
5.2.1. AirLink GL6110 ................................................................. 13
5.2.2. AT Commands .................................................................. 15
5.3. Flow Meter ....................................................................................... 15
5.3.1. Research ........................................................................... 16
5.3.2. Design ............................................................................... 16
5.3.3. Manufacturing.................................................................. 24

vi
5.3.4. Assembly .......................................................................... 25
5.3.5. Testing .............................................................................. 25
5.4. Solenoid Valve .................................................................................. 32
5.4.1. Research ........................................................................... 32
5.4.2. Testing .............................................................................. 32
5.5. Power Meter ..................................................................................... 33
5.5.1. Research ........................................................................... 33
5.5.2. Design ............................................................................... 34
5.5.3. Assembly .......................................................................... 36
5.5.4. Testing .............................................................................. 37
5.6. Relays ................................................................................................ 39
5.6.1. Research ........................................................................... 40
5.6.2. Design ............................................................................... 41
5.6.3. Assembly .......................................................................... 41
5.6.4. Testing .............................................................................. 42
6. SMART .......................................................................................................... 43
6.1. Overview ........................................................................................... 43
6.2. Design ............................................................................................... 43
7. Integrated System ........................................................................................ 45
7.1. Final Test ........................................................................................... 45
7.2. Considerations .................................................................................. 46
8. Conclusion .................................................................................................... 48
8.1. Findings ............................................................................................. 48
8.2. Recommendations ............................................................................ 48
8.3. Closing Remarks ................................................................................ 48
References ............................................................................................................. 50
Appendix A : Techno-economic Analysis ................................................................ 52
A.1. Budget ............................................................................................... 52
A.2. Planning ............................................................................................ 52
A.3. Technical Impact ............................................................................... 53

vii
A.4. Return on Investment ....................................................................... 54
A.5. Potential for commercialisation ....................................................... 54
Appendix B : Costs of Components Used ............................................................... 55
Appendix C : Estimated Costs Per Activity ............................................................. 56
Appendix D : Actual Costs Per Activity ................................................................... 57
Appendix E : Gantt Chart ........................................................................................ 58
Appendix F : Risk Analysis and Safety Procedures ................................................. 59
F.1. Thermo-fluids Laboratory ................................................................. 59
F.2. Electronics Laboratory ...................................................................... 60
Appendix G : Orifice Flow Rate Calculator.............................................................. 62
Appendix H : Flow Meter Test Data........................................................................ 63

viii
LIST OF FIGURES
Page
Figure 1: System diagram ........................................................................................ 7
Figure 2: a) Atmel Xmega32A4U MCU. b) Arduino Uno. c) Arduino Mega 2560. ... 9
Figure 3: RS-232 level converter (MAX232 driver IC) ............................................ 10
Figure 4: Sierra Wireless Airlink GL6110 modem .................................................. 14
Figure 5: Format of AT commands between modem and SMART ........................ 15
Figure 6: Obstruction flow meters. a) Orifice flow meter. b) Venturi flow meter (Engineering Toolbox, 2013) .................................................................................. 18
Figure 7: Discharge coefficient behaviour (ISO) and trend line fit ........................ 20
Figure 8: Flow meter design in Inventor. a) Isometric view. b) Exploded view. ... 24
Figure 9: Lathing of flow meter flanges in EEW ..................................................... 24
Figure 10: Assembled custom orifice flow meter .................................................. 25
Figure 11: Flow meter test setup. a) Lab setup. b) Setup piping diagram. ........... 26
Figure 12: Test setup components. a) Flow meter. b) EH Promag 10 flow meter display. c) Computer setup, MCU and flow meter connection. ............................ 26
Figure 13: Endress+Hauser Promag 10P. a) Physical appearance. b) Electromagnetic measuring principle. (Endress+Hauser, 2010)............................ 27
Figure 14: Differential pressure vs. flow rate ........................................................ 30
Figure 15: VOUT vs. differential pressure ................................................................ 30
Figure 16: Flow rate reading accuracy ................................................................... 30
Figure 17: Calculated & measured flow rate vs. differential pressure .................. 31
Figure 18: Solenoid valve ....................................................................................... 32
Figure 19: Current transformer appearance and operation (Electronics-Tutorials.ws, 2013) ................................................................................................. 34
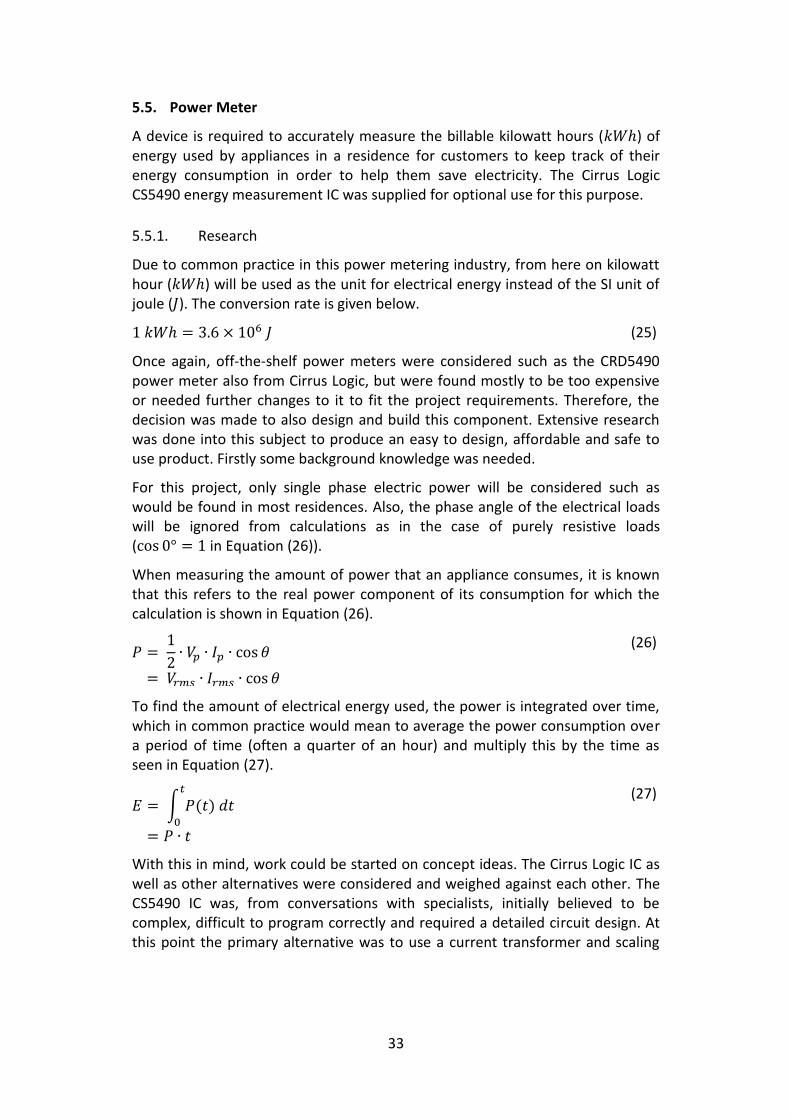
Figure 20: CS5490 Power meter circuit diagram (Cirrus Logic, 2013) ................... 36
Figure 21: Power meter circuit board .................................................................... 36
Figure 22: Power meter assembled ....................................................................... 39
Figure 23: Finder 36-series PCB relay and pin layout ............................................ 40

ix
Figure 24: Relay circuit board. a) Construction of circuit board on PCB with thicker tracks. b) Completed circuit board. ........................................................... 41
Figure 25: Extract from relay testing video ........................................................... 42
Figure 26: SMART Sight dashboard ....................................................................... 44
Figure 27: Integrated system test setup ................................................................ 46
Figure 28: a) Flow meter test setup. b) System test setup. ................................... 60
Figure 29: Assembled power meter ...................................................................... 61

x
LIST OF TABLES
Page
Table 1: Arduino Mega 2560 key specifications (Arduino, 2013) ............................ 8
Table 2: HomeMeter asset model elements ......................................................... 14
Table 3: Residential water use information........................................................... 17
Table 4: Freescale MPX5100 selected characteristics (Freescale, 2010) .............. 22
Table 5: ACE9000 ISP key features (Itron, 2013) ................................................... 39

xi
LIST OF SYMBOLS
Diameter ratio [-]
Differential pressure [Pa]
Error [-]
Phase angle [°]
Dynamic viscosity of the fluid [Pa·s]
Density of fluid [kg/m3]
Arduino analogue pin reading [-]
Cross sectional area [m2]
Scaling factor [-]
Discharge coefficient [-]
Orifice (throat) diameter [m]
Pipe inside diameter [m]
Energy [J]
Current [A]
Electric real power [W]
Volume flow rate of fluid [m3/s]
Reynolds number referred to [-]
Time [s]
Turndown ratio [-]
Mean axial velocity of fluid in pipe [m/s]
Voltage [V]
Volume [m3]

xii
LIST OF ACRONYMS
ASME American Society of Mechanical Engineers
AT Attention
CO Change-over
CT Current transformer
DIL Dual in-line
E&E Electric and Electronic
EEW Electric Electronic Workshop
GSM Global System for Mobile Communications
I/O Input / Output
IC Integrated circuit
IDE Integrated Development Environment
ISO International Organisation for Standardisation
ISP Integrated Single-phase Prepayment meter
M2M Machine to machine
MCU Microcontroller unit
NC Normally-closed
NO Normally-open
PCB Printed circuit board
SI International system of units of measurement
SMART Trintel online wireless telemetry solution
SOIC Small-outline integrated circuit
SPDT Single pole double throw
TTL Transistor-transistor logic
UART Universal Asynchronous Receiver/Transmitter

1
1. INTRODUCTION
Recent advances in technology have resulted in multi-functional devices, such as laptops, tablets, cell phones, etc., being ubiquitous and pervasive. These devices are already able to control most aspects of our lives. Concurrently, the global population is growing while natural resources are withering, increasing the already intense need to save and convert to a sustainable way of living. To help provide for this growing global need for centralised control and optimisation, this project aims to enable the end-client to monitor and control their household water and electricity supply on a web-based platform through cellular communications.
The project originated partly from a South African company, called Trintel, which specializes in providing wireless and M2M (machine-to-machine) solutions to customers through its self-developed SMART platform. They are currently in the testing phase of a similar project where customers have their household hot water cylinders (called geysers in South Africa) connected to several sensors and controlling devices which, through serial and cellular communications, provide real-time access to the SMART platform. From here, the user can log on from any location to monitor and control the state of their hot water (Booysen, et al., 2013). This type of functionality will become invaluable in the near future.
The idea for the project stemmed from the collaboration between the student supervisor, Dr M.J. Booysen, and Trintel. It builds on current projects from Trintel using the SMART platform. The project is funded by MTN with the possibility of a grant from Eskom to further investigate the energy saving capabilities of such a system. The Department of Mechanical and Mechatronic Engineering, in conjunction with the Department of Electrical and Electronic Engineering, gave the student access to wide ranging expertise that was used in this project. A dedicated project team ensured that the necessary amount of time and effort were spent on the project to deliver the results on time.
The project delivered favourable results with clear evidence to substantiate further research and possibly development of this system. As a whole, the system performed the required functions, giving users access to an online platform from where the residential water flow rate and volume usage as well as electrical power load and energy consumption of certain appliances could be monitored and controlled. A custom flow meter was designed, manufactured and tested to use with this system. A power meter was built and tested to perform power and energy calculations using the voltage and current measurements made by it. Relays were used to switch appliances on and off, including a valve to open or shut water flow. Finally, the whole system was integrated with a microcontroller and set up to communicate with the web platform through a cellular modem. The reader may access this dashboard by

2
logging into SMART Sight by using the username and password of “house” (URL: http://smart.trintel.co.za/core/accounts/login/?next=/).
This report serves as the final and complete documentation of the work done on Mr R.I. Müller’s final year project for the Mechatronic Project 488 module. The purpose of this report is to inform the reader of all work done on this project up to date. The report is set out in a similar manner to which the project was approached. Firstly, the project is focused on as a whole, concentrating on the end goals or objectives to get a broad overview of what had to be done. These objectives are used to divide the project into certain guideline activities. A short literature overview of the project whole is given. The project is then further divided into components or sub-assemblies, including all notable hardware components as well the SMART platform, each to be discussed in depth. Finally, the integrated system results are discussed, conclusions are made and recommendations are given on the possible continuation of the project.

3
2. OBJECTIVES
Project objectives were formulated; some fixed according to Trintel’s and some to MTN’s requirements, and are listed below. Also see Figure 1 for the system diagram setting out the scope and different components of the project visually.
The main objective is to design and develop an electronic unit to:
2.1. Measure power consumption in a household’s distribution board by any means deemed viable.
2.2. Interface with any suitable water flow meter, commercially of-the-shelf or custom-built, to measure water supply into the house.
2.3. Interface with relays to control the electricity supply.
2.4. Interface with a valve to control the water supply.
2.5. Interface with a cellular modem, supplied by Trintel & MTN, using a simple serial interface, to allow remote monitoring and control through the SMART platform.
After completion of the electronic unit with all its integrated parts:
2.6. Develop an asset model for the modem connected to the unit on the Trintel SMART platform, containing a user interface with the necessary outputs and controls to perform the main function of monitor and control.

4
3. PROJECT ACTIVITIES
The execution of the project was divided into the activities described in this section. Costs and time allocations of the different activities are also provided separately in Appendix B and Appendix E. Also, a techno-economic analysis of the project is given in Appendix A.
3.1. Research
Research was done on the different aspects of this project to ensure exact knowledge of concepts and components being used. This also ensures the use of the most up to date technologies and methods. Research includes literature study, obtaining expert opinions and gathering information from any other sources. The findings are documented in the Literature Overview section as well as in the corresponding sections of each major component.
3.2. Flow Meter Design
After an early decision to design and build a custom flow meter, it was realized that this activity would have to be early in the process to ensure the manufactured part is delivered on time for integration and testing to begin. Thus, using the obtained research and previous course knowledge, an effective and reliable water flow meter was designed, suited to the requirements of this project.
3.3. Concept Decision
Finalising the concept involved reviewing the flow meter design as well as all other proposed components to be used and their capabilities. Mechanical aspects such as housing, placement and the safety of the system in a home were considered. Possible alternative concepts were investigated to ensure optimal layout and function. A final decision was made on all parts to be used, and the final design of the flow meter approved. Trintel was also consulted at this stage about these decisions and its feasibility.
3.4. Hardware Procurement
This activity involved handing in flow meter designs for manufacturing by the EEW (Electric Electronic Workshop) and supervising this process. Also, the necessary components and equipment were reserved from the engineering faculty if available and, finally, all additionally required components were bought from selected manufacturers or retailers.
3.5. Software Development
During this activity the controller and modem were programmed to interface with each other, the peripheral devices (flow meter, power meter, valve and

5
relay) and with the SMART platform. Work on the SMART asset model, and the creating of a powerful but easy to use user interface, was initiated here.
3.6. Training
Training was completed within the assigned time period (see Appendix E). An introduction to this project was received at the Trintel office in Cape Town and training was completed in the E&E department of the Engineering faculty. It involved an introduction to the SMART platform and different software packages relevant to the project at hand. Training was also received in programming and setup of serial communication between a controller and modem as well as cellular communications between a modem and the web platform and finally the graphical user interface of SMART Sight. This training served as the basis of the knowledge that was applied throughout this project and was also critical to fully understand the scope and capabilities of SMART.
3.7. Integration
This activity involved bringing the hardware and software together by building the whole system as well as integrating the different devices on a software level. The SMART asset model was completed and modem communication with the platform was set up. Some software tests were performed here to ensure all major problems are resolved before the start of physical testing.
3.8. Testing
Finally, this activity was started by ensuring all components are functioning and can be connected. Here the newly developed system was installed at a test site to begin live testing. Data was gathered on SMART and any irregularities or errors that arose were improved upon or corrected. Tests were performed for certain extreme cases for the system to detect and act upon. Also, a watchful eye was kept on the physical state of components during operation. All results were recorded and discussed in the following activity to determine the actual success of the project.
3.9. Final Report
The final stage of the project was to combine everything done during this project into this comprehensive, but easy to read report. All results obtained are discussed and objective conclusions were made, commenting on the measure of success of the project. To conclude, recommendations are made on the continuation and potential future of the project.

6
4. LITERATURE OVERVIEW
The project background was researched and is discussed here. This includes a brief discussion of the feasibility of such a project as well as the possible benefits tied to the successful implementation of a system such as the one described in the Introduction. Each component of the system was also separately researched and is discussed in separate sections.
The interest and need for wireless solutions are everywhere. An increasing number of products are being produced to provide multi-functional control to the user from anywhere. For example, a South African company Touch Home Automation provides a product and service that allows clients to control a cluster of different aspects in their homes, such as lighting, comfort, entertainment, security; even food reserves can be monitored and replenished, all part of an integrated system which can be manipulated from a tablet or fixed touch screen monitor within the home (Touch Home Automation, 2011).
Cell phones and tablets have, in a very short time, been shaped into essential parts of the average person’s life, giving them control over their communication, daily planning, entertainment, news, banking, and so much more. These products all help people to optimize their way of living, enhancing, to a certain degree, a sense of self-empowerment.
At the same time people are still wasting unimaginable amounts of resources, such as water and fossil fuels, which the planet does not have much to lose of anymore. Therefore another trending topic is sustainable living and conserving the available resources.
The proposed system addresses these aspects of multi-functionality and sustainability, while also introducing the following benefits: Firstly, because the system enables easy and fast access to the control parameters, consumers are likely to assume this newfound position of control to affect savings. Giving people the more tangible ability to save on their own usage, not only helps them to save money, but also creates a sense of responsibility to make that difference. On the practical side, this system can provide early warnings of faults or malfunctions, rather than finding out there is a leaking geyser or pipe months later on a bill, when much of the damage has already been done. The inherent mobility also gives the customer the ease to budget for a certain usage and continuously ensure that they stay within those set limits, rather than blindly consuming water and electricity with the bill acting as delayed feedback.
It is believed that this type of service is inevitable – it is only a question of who recognizes and acts on the opportunity first. Therefore, this project provides the chance to be on the forefront of technology and development.

7
5. HARDWARE
All hardware that was used for this project is summarised in Appendix B, along with the retailers and costs of each part. Most of these parts were procured by the student with the exception of certain parts that were supplied by either the supervisor or by Trintel. In this chapter a comprehensive description is supplied of all major hardware components describing the component choice, its use and the work done around it. Tests are discussed for sensing and controlling devices is to ensure that each component is functioning individually when connected to the MCU. At this point it is also relevant to consider the whole system to understand how each component fits into the whole. For this reason, a system diagram is supplied in Figure 1 below.
MCU
FlowMeter
Valve
SMART
User
RS-232
UART
Water fixtures
Water main
GSM
Information flow
Power supply
Water flow
High-voltage circuit
Information flow
Power supply
Water flow
High-voltage circuit
PowerMeter
ElectricitySupply (220VAC)
Relays
Modem
Wate
r
Electricity
Internet
System
Figure 1: System diagram

8
5.1. Microcontroller
The microcontroller unit (MCU) serves as the centre of operations for this system. All measurement and control devices should be connected to it. It must also be able to communicate with the cellular modem, discussed in section 5.2. Initially, a microcontroller for this project was supplied by Trintel (see Figure 2a). A decision was made later in the project to use a simpler microcontroller.
5.1.1. Research
The Atmel AVR microcontroller board was initially chosen because of its flexibility as well as the learning opportunity of building and coding such a device from the ground up. However, it was realized that the time and effort of the setup and coding of this MCU does not justify the same end result that could much easier be achieved with the Arduino Uno, shown in Figure 2b. A quick study had to be conducted to ensure that this MCU would be able to provide in all of the requirements of this project.
The Uno provided more than the required specifications in all areas but one. This was not discovered until the interface with the final component, the power meter, was finalised. The MCU needed at least two dedicated serial ports (UARTs) for communication with the modem and the power meter. The Uno only has one such port. Also, the fact that the one serial port is also connected to the USB port, normally a useful debugging feature, caused some trouble when testing the power meter. This left no other choice than to upgrade from the Uno to the Arduino Mega 2560 (seen in Figure 2c), which features four serial ports. The information in Table 1 is a summary of the key specifications of the Mega provided by Arduino.
Table 1: Arduino Mega 2560 key specifications (Arduino, 2013)
Specification Value
Processor Atmel ATmega2560
Operating Voltage 5V
Input Voltage (recommended) 7-12V
Digital I/O Pins 54 (of which 15 provide 8-bit PWM output)
UARTs 4 (special function digital I/O pins)
Analogue pins 16 (10-bit ADC resolution)
DC Current per I/O Pin 40 mA
DC Current for 3.3V Pin 50 mA
Flash Memory 256 KB of which 8 KB used by bootloader
SRAM 8 KB
EEPROM 4 KB
Clock Speed 16 MHz

9
Figure 2: a) Atmel Xmega32A4U MCU. b) Arduino Uno. c) Arduino Mega 2560.
The Mega is also based on an Atmel product and power requirements are almost identical to the other two MCUs. A maximum of 9 out of the 54 digital I/O pins will be used for the 5 relays, the control valve (also controlled through a relay) and serial communication between the MCU and the modem and between the MCU and the power meter. Also, only one out of 16 analogue pins is necessary for the flow meter. Therefore, is clear that the upgrade to the Mega caused some redundancy. The positive side of this is that it leaves a lot of space for adding extra components later on, such as a temperature sensor near the flow meter housing etc. The DC current per I/O pin is one value to check against each component that requires current to operate, such as the relays or the valve that involves high voltages. Memory is more than sufficient for the small amount of data to be stored before it is transmitted to the SMART platform periodically. Based on this information and especially the fact that Arduino has its own open source, user friendly software (Arduino IDE) to use with their MCU’s, the decision to change the MCU to the Arduino Mega can certainly be justified.
5.1.2. Coding
This stage forms part of the Software Development activity discussed above in section 3.6. During this activity the controller was programmed to interface with the modem as well as with the peripheral devices (flow meter, valve, electricity meter and relays).
Coding for the MCU was done with the Arduino IDE (Integrated Development Environment), which is easy to use and, due to its open source nature, has a world of example code for innumerable different applications available to the general public.
One useful feature of the Arduino Mega is that in normal operation after it is programmed, its USB connection also acts as a USB-to-serial converter with one of the serial ports connected to it. So when connected to a PC via USB, it not only powers the MCU, but also when opening the Serial Monitor in the Arduino software program on the PC, all serial port 0 communication can be observed
a) b) c)

10
and data can also be sent back. This feature was used extensively during debugging and for testing of components.
All of the code that will now be discussed can be found in the accompanying Project File with added explanatory comments. It should be noted that when uploading the code to the MCU, ideally, all other components must be disconnected from the MCU. After the upload is complete, the USB cable from the computer may be disconnected and the components connected to the MCU. Finally, the MCU can be powered be the supplied adapter for this project.
Modem
Firstly, communication between the MCU and modem must be established. The MCU serial ports consist of digital I/O pins defined as RX and TX pins. These pins support simple serial or TTL (transistor-transistor logic) communication. However, as seen in section 6.2. below, the modem’s communication is via RS-232 (Recommended Standard 232), which uses different voltage levels for serial communication. Therefore a direct connection between the two devices is not possible. Instead a level converter was obtained from the Electric & Electronic (E&E) Lab of the E&E Department. It consists of a RS-232 port adapter as well as a RS-232 driver IC and circuitry as seen in Figure 3. With this module and the user friendly Arduino IDE, coding could continue as if simple serial communication was still being used.
As explained in section 5.2., modem operations are controlled via the AT command language. The code for sending and receiving data strings to and from the modem as well as the handling of unsolicited incoming strings can be seen in was compiled and can be found in the project file.
Figure 3: RS-232 level converter (MAX232 driver IC)
Flow meter
The functioning of the custom-built orifice flow meter is discussed in section 5.3.2. Coding for the flow meter consisted of reading the changing voltage level ( ) at the analogue pin (A0) connected to the flow meter and converting this into a differential pressure value. These calculations can be seen in Equations (1) and (2. The differential pressure value is converted into a flow rate value which is
11
also explained in section 5.3.2. The flow rate is calculated every 100 milliseconds and averaged over two seconds to achieve a filtered flow rate value. The filtered flow rate is used to keep track of the cumulative volume of water, using Equation (4).
(1)
(
)
(2)
∑
(3)
∑(
)
(4)
The flow rate and volume values ( and ) are first converted to
from floating point values to integer values before they are periodically uploaded as strings (see previous section about coding for sending data strings) to the modem. The frequency of these sending operations can be set to any required rate. For presentation purposes it is set to send values every 30 seconds.
Additionally, a check is set in place to check the current flow rate against the last flow rate value that was sent to the modem. If the current flow rate has increased to a certain degree from the last sent value, the new flow rate and volume value will be sent to the modem. Also, in Figure 26 on page 44, a “Flow Rate High Setting” control can be seen on the online dashboard. This user input value is used as a threshold for a warning message (alarm) to be sent to the user via text message or email, informing him/her of the current high flow rate.
Power meter
The power meter is also discussed in depth in section 5.5. The coding for the power meter consisted of a setup sequence, reading of the power IC registers and calculating the power and energy values to send up to the modem. Communication between the power meter and the MCU is via serial port 3 at a speed of 600 baud, unlike the normal 9600 baud at which all other serial communication is maintained.
The setup code is composed of a number of commands to set registers of the power IC in order to enable continuous conversion, i.e. to continuously update registers with the current measured voltage ( ) and current ( ) values, but also to enable the Energy Pulse Generation function (output energy pulses to power IC DO pin) to use if necessary. The voltage and current values are read from the serial port as three consecutive bytes each, with the least significant bit (LSB) first. Bitwise operations are performed on these bytes to convert them into the required floating point numbers. The readings are expressed as ratios

12
(between 0 and 1) of the maximum readable values. The maximum current was chosen to be 10 A based upon the maximum rated current of the relays to be used in the same circuit as the power meter as well as the choice of burden resistors for the power meter. The voltage was assumed to be a near constant of 230 VAC in South African residences. These ratio readings are then scaled and any offset values in the registers at zero conditions are corrected to attain the final and values as in Equations (5) and (6). These values are used to calculate the power (Watt) and energy (kilowatt-hour) values as in Equations (7) and (8). The cumulative energy is calculated in a similar fashion to that of the volume water in Equation (4) above, by taking the power readings every five seconds and integrating it over time.
(5)
(6)
(7)
∑(
)
(8)
The power and energy values are also converted to integers before it can be periodically sent to the modem. The sending operations are also set to be performed every 30 seconds.
Similar checks and warnings messages as with the water flow rate are in place for the power values.
Relays
Relay operation is discussed in section 5.6. Programming for the relays involved simply setting the digital I/O pin connected to the required relay as either high (1) or low (0) to switch it on or off. All relays are started in the inactive state. This could cause the switching circuit to be either on or off, depending on whether it is connected to the relay normally-closed (NC) or normally-open (NO) contacts. For this project it was decided to connect all circuits to the NO contacts (explained in section 5.6.). Therefore, circuits are off at restart or reboot. User commands to switch circuits on or off are received via the modem and all changes are tracked to periodically send relay states back up to the modem. This is done to confirm that relays are still in the states are accurately reflected on the SMART Sight dashboard. Relay states and commands are sent and received as Boolean data, meaning values can only be true (1) or false (0).
5.2. Modem
The modem is the connection between the hardware components and the virtual or online components of this project. It facilitates communication between the MCU and the SMART platform.

13
5.2.1. AirLink GL6110
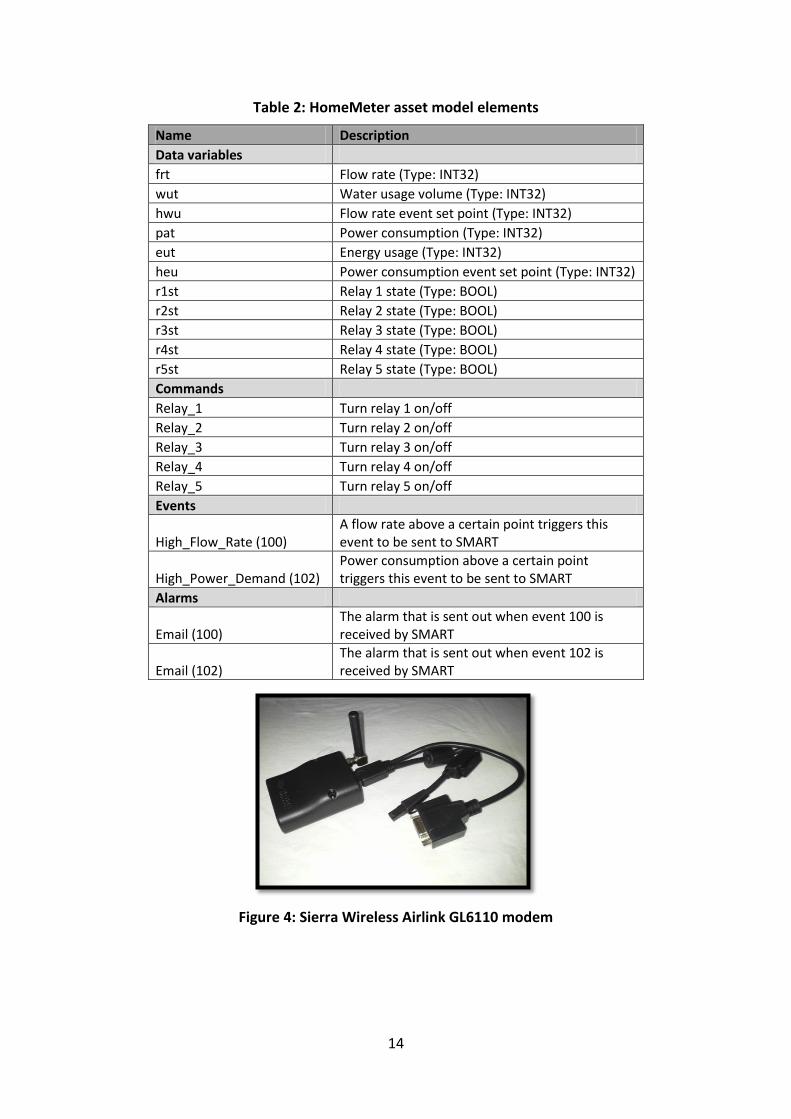
As a result of the change in MCU, a change in modem was also affected. Initially the Sierra Wireless AirLink Fastrack Xtend modem would have been used for its convenient connection to the Atmel Xmega32A4U MCU (see Figure 2a), connecting directly onto the modem on-board connection slot. With the Arduino Mega, that is no longer an option, therefore it was decided to rather use the smaller, lighter and cheaper Sierra Wireless AirLink GL6110 with the same network capabilities, but connecting to the MCU via its RS-232 cable seen in Figure 4.
The Airlink GL6110 is a data modem that can provide cellular connectivity to essentially any device. It is especially suited for M2M purposes and supports an AT command driven TCP/IP stack (discussed below). Wireless data communication is done via GSM, which is a cellular network. It has an easily accessible SIM card slot. GSM area coverage is extremely wide due to the quality of service provided by of mobile operators such as MTN. This attribute further accentuates the mobility and ease of access of this system. As stated, device communication with this modem is through RS-232, which would also be in the form of AT commands. The modem is uploaded with custom firmware, designed by Trintel, for the handling of these AT commands specifically aimed at its use with SMART. The GL6110 is powered by a power adapter plugged into a normal wall socket.
Sierra Wireless also provides the AirVantage Management Service as part of the package, which allows remote diagnosis of, and software updates to the modem. The AirVantage Configuration Tool software further allows the user to set up an asset model for devices connected to the modem, with associated data variables, commands, events and alarms to be recognised by the modem when communicating with the device and a M2M platform such as SMART. This asset model is uploaded to a server from where it can be linked to SMART via the AirVantage Operating Portal so that SMART can recognise and communicate with each linked asset or modem. The modem can have multiple assets linked to it.
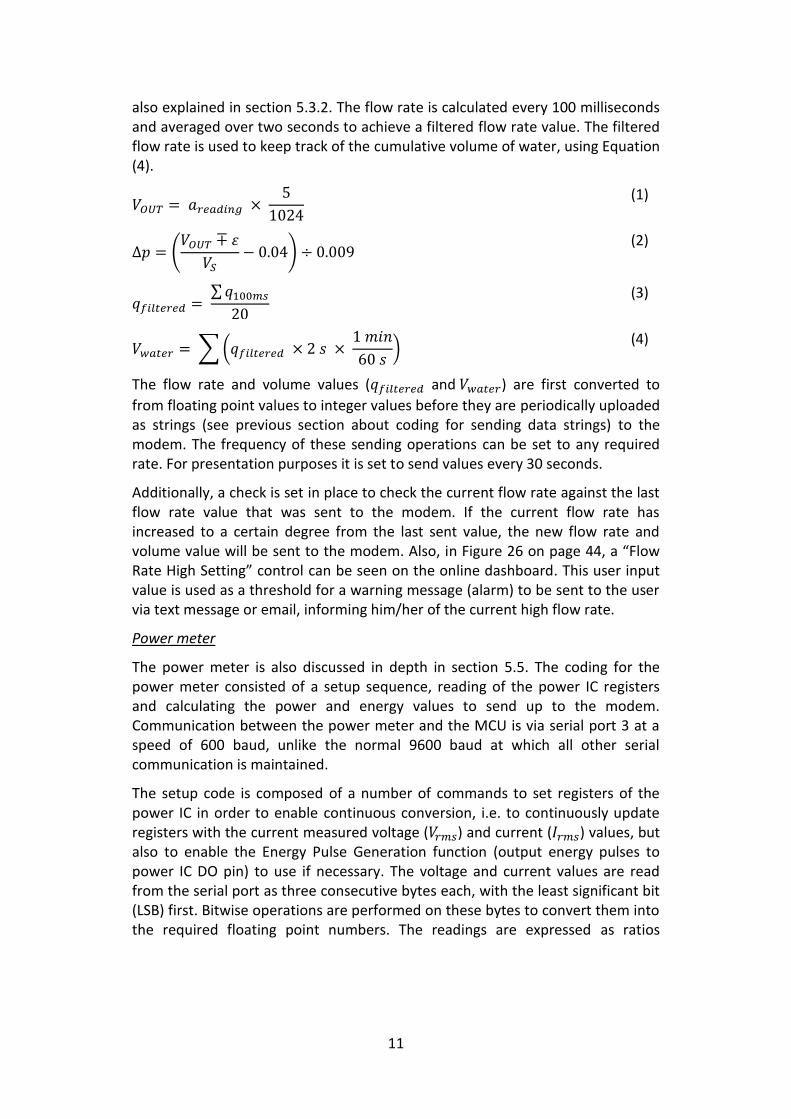
For this project one asset model, “HomeMeter”, was set up for the entire system. The different elements of this model can be seen in Table 2.
14
Table 2: HomeMeter asset model elements
Name Description
Data variables
frt Flow rate (Type: INT32)
wut Water usage volume (Type: INT32)
hwu Flow rate event set point (Type: INT32)
pat Power consumption (Type: INT32)
eut Energy usage (Type: INT32)
heu Power consumption event set point (Type: INT32)
r1st Relay 1 state (Type: BOOL)
r2st Relay 2 state (Type: BOOL)
r3st Relay 3 state (Type: BOOL)
r4st Relay 4 state (Type: BOOL)
r5st Relay 5 state (Type: BOOL)
Commands
Relay_1 Turn relay 1 on/off
Relay_2 Turn relay 2 on/off
Relay_3 Turn relay 3 on/off
Relay_4 Turn relay 4 on/off
Relay_5 Turn relay 5 on/off
Events
High_Flow_Rate (100) A flow rate above a certain point triggers this event to be sent to SMART
High_Power_Demand (102) Power consumption above a certain point triggers this event to be sent to SMART
Alarms
Email (100) The alarm that is sent out when event 100 is received by SMART
Email (102) The alarm that is sent out when event 102 is received by SMART
Figure 4: Sierra Wireless Airlink GL6110 modem
15
5.2.2. AT Commands
AT commands are ASCII encoded messages or strings, developed as a command language specifically for modem operations. When sending these commands to a modem, the modem is called to attention, hence the AT. Commands always start with an “AT” and end a carriage return (CR). Responses start and end with a carriage return and line feed (CRLF). When commands are executed successfully “OK” is sent as response, otherwise some form of “ERROR” will be sent. Unsolicited responses can also be transmitted, as in the case when the modem receives incoming data. These start with “+AT”, but do not end with “OK”.
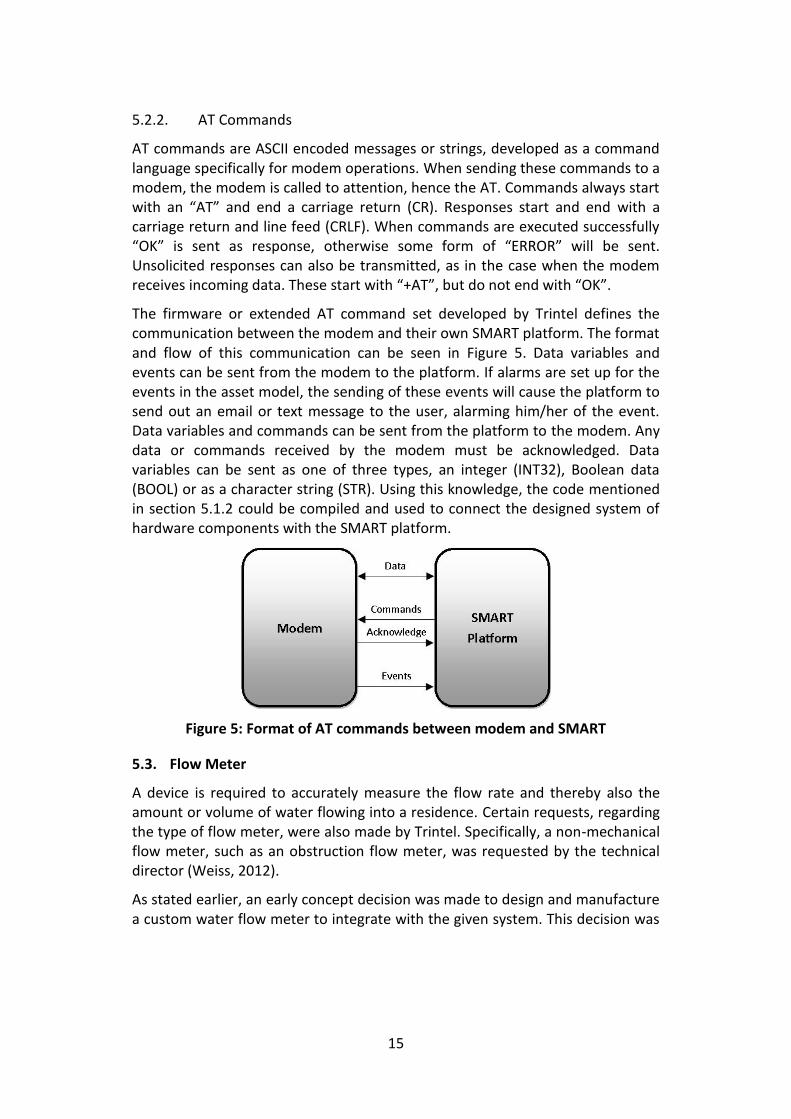
The firmware or extended AT command set developed by Trintel defines the communication between the modem and their own SMART platform. The format and flow of this communication can be seen in Figure 5. Data variables and events can be sent from the modem to the platform. If alarms are set up for the events in the asset model, the sending of these events will cause the platform to send out an email or text message to the user, alarming him/her of the event. Data variables and commands can be sent from the platform to the modem. Any data or commands received by the modem must be acknowledged. Data variables can be sent as one of three types, an integer (INT32), Boolean data (BOOL) or as a character string (STR). Using this knowledge, the code mentioned in section 5.1.2 could be compiled and used to connect the designed system of hardware components with the SMART platform.
Figure 5: Format of AT commands between modem and SMART
5.3. Flow Meter
A device is required to accurately measure the flow rate and thereby also the amount or volume of water flowing into a residence. Certain requests, regarding the type of flow meter, were also made by Trintel. Specifically, a non-mechanical flow meter, such as an obstruction flow meter, was requested by the technical director (Weiss, 2012).
As stated earlier, an early concept decision was made to design and manufacture a custom water flow meter to integrate with the given system. This decision was

16
based on financial factors, custom suited needs as well as for academic reasons of gaining additional knowledge into this field of study.
5.3.1. Research
A flow meter is an instrument used to measure, in this case, the volumetric flow rate ( ) of the substance (water) flowing through it.
Off-the-shelf products in the required range of this project tended to be expensive and rarely adhered to all of the requirements simultaneously such as the flow medium, size, measurement range, ability to integrate with a microcontroller etc. For example, one suitable off-the-shelf product can be seen in Figure 13 in section 5.3.5 below, the EH Promag 10P. However, the price of approximately R25 000 for this product falls completely outside of the budget and the affordability objective of this project.
It should be noted at this point that due to the typical flow rates that are encountered within the scope of this project, litres per minute ( ) will from here on be used as the unit of volumetric flow rate instead of the typical SI unit of cubic meters per second ( ). The conversion rate is given below.
(9)
5.3.2. Design
To ensure the appropriate process is followed, Omega (Omega Engineering Inc., 2013) has the following advice:
“The basis of good flow meter selection is a clear understanding of the requirements of the particular application.”
The local municipality was contacted to ascertain the exact pipe size, static pressure and approximate flow rates that are observed in local residential buildings. This information is summarised in Table 3. With this information a type of flow meter could be decided on.
17
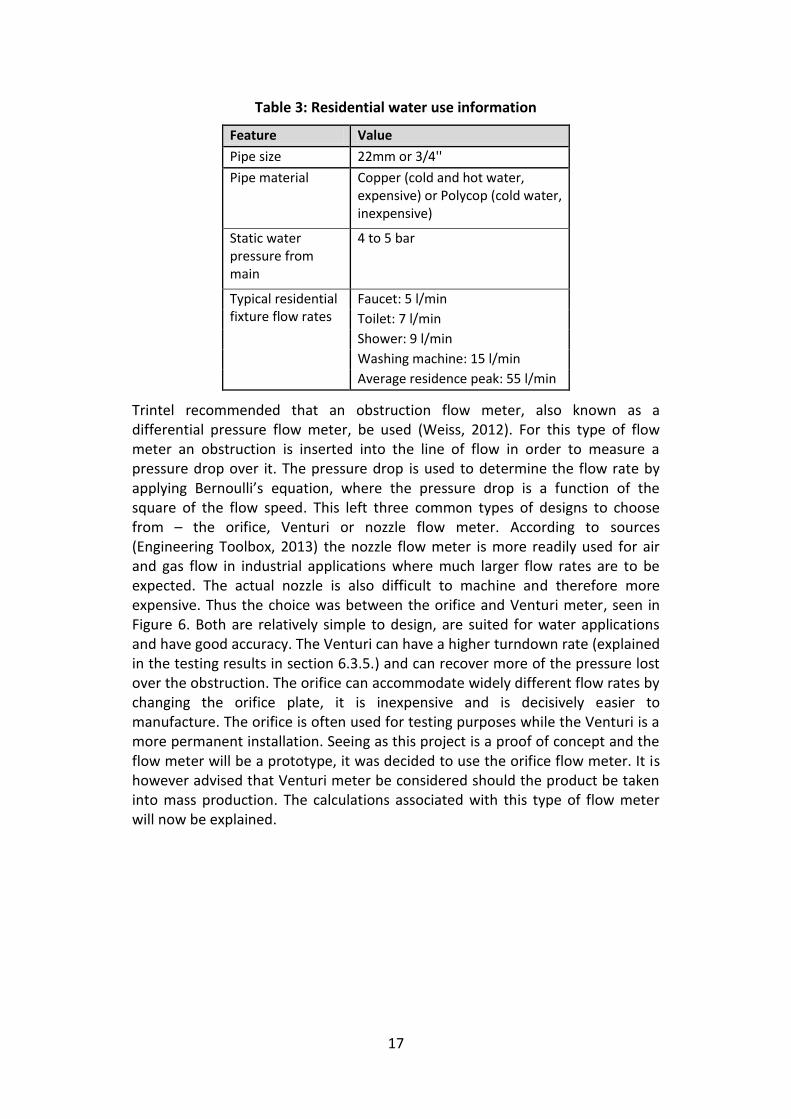
Table 3: Residential water use information
Feature Value
Pipe size 22mm or 3/4''
Pipe material Copper (cold and hot water, expensive) or Polycop (cold water, inexpensive)
Static water pressure from main
4 to 5 bar
Typical residential fixture flow rates
Faucet: 5 l/min
Toilet: 7 l/min
Shower: 9 l/min
Washing machine: 15 l/min
Average residence peak: 55 l/min
Trintel recommended that an obstruction flow meter, also known as a differential pressure flow meter, be used (Weiss, 2012). For this type of flow meter an obstruction is inserted into the line of flow in order to measure a pressure drop over it. The pressure drop is used to determine the flow rate by applying Bernoulli’s equation, where the pressure drop is a function of the square of the flow speed. This left three common types of designs to choose from – the orifice, Venturi or nozzle flow meter. According to sources (Engineering Toolbox, 2013) the nozzle flow meter is more readily used for air and gas flow in industrial applications where much larger flow rates are to be expected. The actual nozzle is also difficult to machine and therefore more expensive. Thus the choice was between the orifice and Venturi meter, seen in Figure 6. Both are relatively simple to design, are suited for water applications and have good accuracy. The Venturi can have a higher turndown rate (explained in the testing results in section 6.3.5.) and can recover more of the pressure lost over the obstruction. The orifice can accommodate widely different flow rates by changing the orifice plate, it is inexpensive and is decisively easier to manufacture. The orifice is often used for testing purposes while the Venturi is a more permanent installation. Seeing as this project is a proof of concept and the flow meter will be a prototype, it was decided to use the orifice flow meter. It is however advised that Venturi meter be considered should the product be taken into mass production. The calculations associated with this type of flow meter will now be explained.

18
Figure 6: Obstruction flow meters. a) Orifice flow meter. b) Venturi flow meter (Engineering Toolbox, 2013)
Initial calculations, to convert the differential pressure readings to flow rate, using ISO standards (ISO 5167-2, 2003), provided undesirable results. Therefore a second set of standards, ASME MFC-14M 2001, were also used to compare with the above mentioned standards. For these calculations both the flow rate and the Reynolds number of the fluid are unknown variables. The Reynolds number is a dimensionless quantity which describes different flow regimes within the fluid flow of which the extreme cases are laminar and turbulent flow. Therefore Microsoft Excel was used to construct a custom flow rate calculator to perform the iterative calculations to get the flow rate while balancing the Reynolds number. The calculator for both standards is shown in Appendix G. The equations used in the calculator are summarised below.
A determining factor in orifice plate design is the β-ratio (defined in Equation (10)). A smaller ratio means a larger pressure drop across the plate for a given flow rate (thus easier detection), but also a larger permanent pressure loss down the line. For this design the pipe inner diameter ( ) is fixed at 22mm (see Table 3). Therefore, to vary the β-ratio, orifice diameter ( ) must be varied. The flow rate calculator was used to determine the final β-ratio and with it the orifice diameter. Initially, a β-ratio of 0.7 was used in the following equations.
(10)
Both the pipe and orifice (throat) cross sectional area are determined respectively.
(11)
(12)
The discharge coefficient for ISO and ASME standards can then be determined.
a) b)

19
(
)
( (
)
)
(
)
( (
)
)
(
(
)
)
(
)
(13)
( ) √
√
(14)
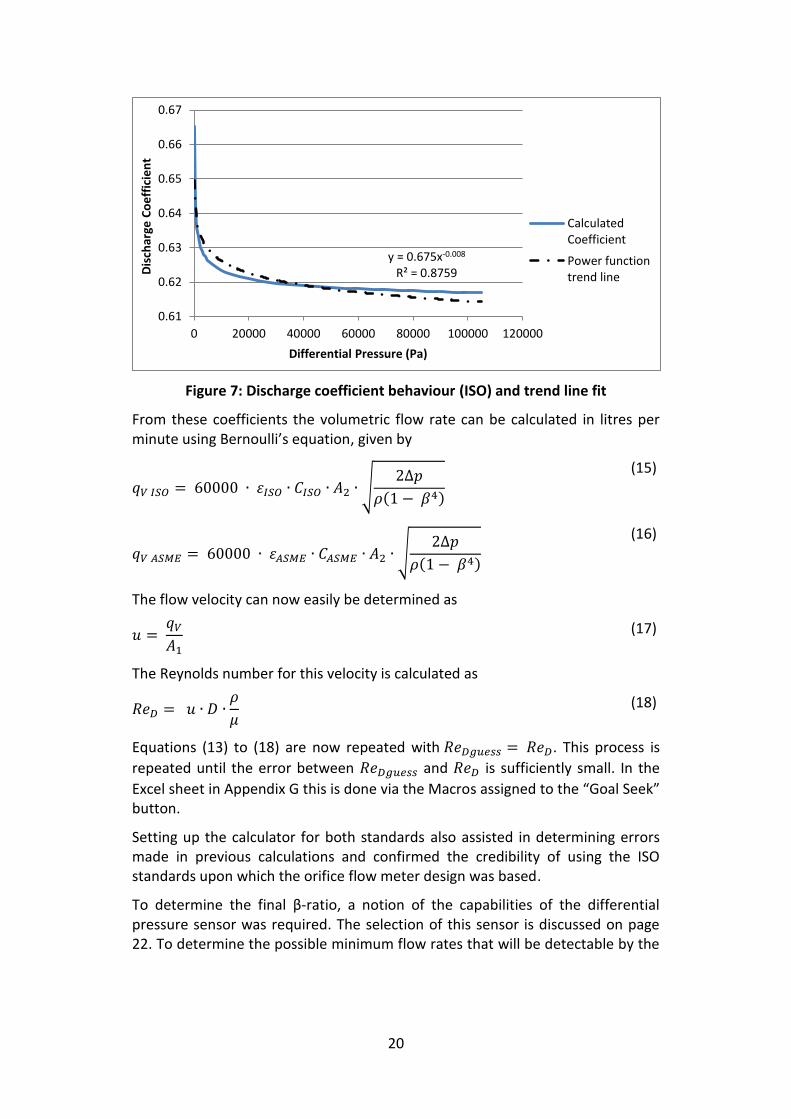
The behaviour of for different pressure values can be seen in Figure 7. A power function trend line was fitted to this curve in order to predict for coding purposes. However, this proved to be unnecessary by achieving acceptable results with .
20
Figure 7: Discharge coefficient behaviour (ISO) and trend line fit
From these coefficients the volumetric flow rate can be calculated in litres per minute using Bernoulli’s equation, given by
√
(15)
√
(16)
The flow velocity can now easily be determined as
(17)
The Reynolds number for this velocity is calculated as
(18)
Equations (13) to (18) are now repeated with . This process is
repeated until the error between and is sufficiently small. In the
Excel sheet in Appendix G this is done via the Macros assigned to the “Goal Seek” button.
Setting up the calculator for both standards also assisted in determining errors made in previous calculations and confirmed the credibility of using the ISO standards upon which the orifice flow meter design was based.
To determine the final β-ratio, a notion of the capabilities of the differential pressure sensor was required. The selection of this sensor is discussed on page 22. To determine the possible minimum flow rates that will be detectable by the
y = 0.675x-0.008 R² = 0.8759
0.61
0.62
0.63
0.64
0.65
0.66
0.67
0 20000 40000 60000 80000 100000 120000
Dis
char
ge C
oe
ffic
ien
t
Differential Pressure (Pa)
CalculatedCoefficient
Power functiontrend line

21
flow meter as well as the maximum flow rate, an inquiry was made into the pressure operating ranges of the different sensors. By varying the differential pressure in the flow rate calculator between the minimum detectable pressures of the different sensors as well as varying the orifice diameter it was possible to decide on an acceptable combination. For this combination to work, the orifice diameter had to be chosen as small as possible, which is 12.5 mm according to the standards (ISO 5167-2, 2003). This diameter relates to a β-ratio of 0.57.
The actual focus of this part of the project is to keep track of water usage. Therefore the volume water that passes through a pipe can be calculated using Equation (19). The MCU is used to perform this calculation and to store the cumulated value. Therefore, this equation is adjusted and used in section 5.1.2 in the coding of the MCU.
∫
(19)
To finalise the flow meter concept design, the pressure sensor had to be selected. The difference in pressure between the two sides of the orifice plate acts as a proxy for the flow. Therefore, a commercially available differential pressure sensor had to be chosen.
To choose this sensor it was necessary to know the approximate differential pressure that would correspond to a certain flow rate as well as the upper and lower limits of differential pressure to account for. Therefore, at this point, the flow rate equation discussed above had to be determined.
It was determined by using the calculator from Appendix G, that for an estimated maximum flow rate of for a residence and with parameters as stated thus far, a maximum differential pressure of no more than or 1.1 bar could be expected. Also from Table 3, it could be determined that to detect a completely open faucet running ( ), a minimum differential pressure of could be expected. This was used to search for a suitable, but also affordable differential pressure sensor with a high enough sensitivity to detect the minimum pressure difference and a suitable pressure range for the maximum expected pressure difference to fall within.
The Freescale MPX5100DP, seen in the illustration in Table 4, was selected. This is a piezoresistive pressure sensor, meaning that the eventual differential pressure output is a function of the electrical resistivity of a semiconductor. The semiconductor serves as a strain gauge in a diaphragm form within the sensor casing between two enclosures at different pressures. The difference in pressure causes the semiconductor to deform to one side, affecting the resistivity which is translated into an output voltage signal. This voltage is directly proportional to the differential pressure. The output signal ranges from 0.2 to 4.7 VDC (see Table 4).

22
The minimum pressure difference that can be detected can be calculated by considering the sensor sensitivity ( ) as well as the resolution of the analogue to digital converter of the MCU analogue input pins to which it will be connected (see Table 1). The 10-bit resolution means that pin input values between 0 and 5 VDC will be converted into integer values between 0 and 1023.
(
)
(20)
This value can be seen in Appendix G to relate to volume flow rate of , which would enable the system to detect a sufficiently small change in water usage.
A comprehensive test of this sensor on its own was performed to determine its functionality with the MCU and to confirm its measurement accuracy especially with a long cable for transmission of data for the likely possibility that the flow meter might be situated at a distance from the MCU in a residence. This test was documented and discussed in the Progress Report of this project, but its inclusion in this document was considered to be redundant.
Table 4: Freescale MPX5100 selected characteristics (Freescale, 2010)
Illustration Characteristic Symbol Value Unit
Pressure range POP 0 to 100 kPa
Supply voltage VS 5 VDC
Minimum Pressure Offset VOFF 0.2 VDC
Full Scale Output VFSO 4.7 VDC
Full Scale Span VFSS 4.5 VDC
Accuracy - ±2.5 %VFSS
Sensitivity V/P 45 mV/kPa
The physical design of the flow meter was completed using the Autodesk Inventor Professional 2011 software. An isometric and exploded view of the design assembly in Inventor can be seen in Figure 8 and design drawings can be found in the Project File. Dimensional details of intricate parts such as the orifice plate, pressure taps and flange insides were determined to strictly adhere to the regulations set out in the relevant ISO standards (ISO 5167-2, 2003). The design was further based on ease of use and finding the most inexpensive way to manufacture such a device with the tools available at the EEW while still adhering to all the necessary requirements and regulations.
Designing the flow meter with the flanges, orifice plate and tubing all as separate parts makes this a highly modular design. This makes it possible to access all parts of the flow meter. It also makes it easy to switch out the orifice plate for

23
another with different properties for testing purposes or accessing the pressure sensor to check for faults. The drawback of this is the need for the visible tubing which also makes the flow meter more susceptible to damage. Therefore, the flow meter will need a protective housing if used outside.
The design stage was an iterative process with drawings being amended after discussions with the head technician at EEW until all parties were satisfied that the latest version of the design was the most efficient design for manufacture, while also keeping aesthetics in mind. For instance, because of the relatively low flow rates that will be dealt with, it was decided, after reconsideration, to design the orifice plate with the smallest possible β-ratio in order to get the maximum possible pressure drop across the plate. This decreases the required sensitivity of the differential pressure sensor, but also increases the permanent pressure loss further down the water supply system. This sacrifice was deemed acceptable for the prototype stage, as the focus was mainly on measuring the flow rate. Also, the sensor housing was initially designed to be on top of the downstream flange, but to decrease material and to increase manufacturability it was decided to sink the housing into the flange as shown in the drawings. After all changes were made, the finished drawings were handed in to EEW for manufacturing.
It should be noted that this is only a prototype to help prove a concept and there is ample room for improvement on this design. Considerations for future designs should include removing more of the Acetal around the bolt heads to effectively decrease the bolt size and length and with it the diameter of the flanges, thereby decreasing material costs. Also, as the proper orifice properties were decided on after testing, future versions might have fewer parts by machining the orifice directly into the Acetal (or other material). This would mean having only one “flange” part instead of two flanges, an orifice plate, two O-ring seals and four bolts and washers, further lowering material and manufacturing costs. It would also open up new possibilities for the sensor casing shape and position, possibly removing the need for the visible tubing. Alternatively, as stated earlier, the Venturi should also be considered for its own advantages.

24
Figure 8: Flow meter design in Inventor. a) Isometric view. b) Exploded view.
5.3.3. Manufacturing
The manufacturing process was completed by the technicians at EEW under the leadership of Mr Croukamp. It was considered to use Perspex as the main material for the flanges for its transparency when polished (aesthetic and presentation purposes). However, with its brittle properties it was decided to rather use Acetal which is easier to machine and also less expensive, but still hard and durable enough to endure the given operating conditions. The process was closely followed by the student and can be seen in Figure 9. Work on the flow meter amounted up to approximately two full days of work and R 4 800 of labour costs (Croukamp, 2013). Other costs associated with the flow meter are included in Appendix A.
Figure 9: Lathing of flow meter flanges in EEW
a) b)

25
5.3.4. Assembly
Owing to the modular design, assembly of the finished flow meter could be completed within minutes. Due to the compact design and limited space, it is advised to take note of the order of assembly when inserting the sensor into its housing. The Festo tubing cut to precise equal lengths, seen to the left in Figure 10, had to be heated in warm water before being pushed through the holes of the housing and over the ports of the sensor. After this the cable could be inserted into its hole in the housing and the wires from the cable could be attached to the sensor. Only three of the four wires are necessary and are attached via connectors, obtained from the E&E lab, to the VOUT, VGROUND and VCC pins of the sensor. Finally, the sensor was screwed down into the housing (see Figure 12a) and the housing lid screwed onto the top of the housing.
Figure 10: Assembled custom orifice flow meter
5.3.5. Testing
Testing of the flow meter was conducted in the thermo-fluids laboratory in the Mechanical and Mechatronic department of the Engineering faculty under the guidance of Mr Cobus Zietsman. The function of this testing was to calibrate the flow meter against a trusted and accurate off-the-shelf flow meter and also to determine its accuracy and the limits of its use. A detailed experiment design report has also been compiled for the purpose of testing the flow meter extensively (Müller, 2013).
Test Setup
The setup and components can be observed in Figure 11 and Figure 12. The orifice flow meter was installed with at least (pipe inside diameter) upstream and downstream straight length of Polycop pipe (see the left of Figure 11a) to ensure swirl-free, fully developed pipe flow at the orifice plate (ISO 5167-2, 2003). The valves upstream and downstream of the flow meters help to remove any air between them before any readings are taken. A reducer

26
was necessary after the upstream valve to take the pipe size down from the 1" upstream laboratory valve to the ¾" pipe used with the orifice flow meter. A larger hose (approximately 1") is clamped over the downstream pipe from the orifice flow meter leading to the upstream side of the off-the-shelf flow meter. From its downstream side another hose leads to the downstream valve. Also, there is a static pressure gauge included in the system as shown in Figure 11b which is out of sight in Figure 11a.
Figure 11: Flow meter test setup. a) Lab setup. b) Setup piping diagram.
Figure 12: Test setup components. a) Flow meter. b) EH Promag 10 flow meter display. c) Computer setup, MCU and flow meter connection.
Components
All components associated with the orifice flow meter have already been discussed earlier.
The only other component of note for this test is the off-the-shelf flow meter that was used to calibrate the orifice flow meter. The Ender+Heuser Promag 10P, supplied by the Thermo-fluids department and seen in Figure 13a, was used for this purpose. This product functions as an electromagnetic flow measuring system often used in chemical or process applications. Its measuring principle is described below (Endress+Hauser, 2010) and can be seen in Figure 13b.
a) b)
b) a) c)

27
“Following Faraday's law of magnetic induction (B), a voltage is induced (Ue) in a conductor moving through a magnetic field. In the electromagnetic measuring principle, the flowing medium is the moving conductor. The voltage induced is proportional to the flow velocity (v) and is supplied to the amplifier by means of two measuring electrodes. The flow volume is calculated by means of the pipe cross-sectional area. The DC magnetic field is created through a switched direct current (I) of alternating polarity.”
The Promag is accurate to ±0.5% for flow rates up to 9600 m3/h (160 kl/min), 130°C and a static pressure of 40 bar, which are all completely outside the boundary parameters of this test and therefore more than sufficient. This flow meter has a signal output option as well as a digital display seen in Figure 12b. It was decided to use the digital display together with digital display readings (on the computer) from the orifice flow meter and record data by hand on an Excel sheet. This proved to be more than sufficient within the scope of this test.
Figure 13: Endress+Hauser Promag 10P. a) Physical appearance. b) Electromagnetic measuring principle. (Endress+Hauser, 2010)
Procedure
With all the components connected and in place the testing could be initiated. The Promag is switched on. A serial monitor (Tera Term) is used on the computer connected to the MCU to visually see processed output from the MCU. The circulating pump is switched on with both valves closed. The downstream valve is then opened completely. Next, the upstream valve is slowly opened to a point and the system is allowed to flush all possible air bubbles out of the piping. The upstream valve is one again closed. From here data recording can commence by controlling the upstream valve, allowing settling time and taking readings from the Promag digital display as well as from the serial monitor.
a) b)

28
Data was recorded using, once again, Microsoft Excel. An extract of the actual recorded data can be seen in Appendix H. For each required flow rate, minimum and maximum readings were taken. The filtered flow rate is also explained in the Microcontroller section above. Concurrently with this procedure graphs such as the one in Figure 17 were plotted. This graphical information was used to adjust the equations used to account for system errors and offsets. This calibration process was repeated until the graph in Figure 17 was achieved which shows the custom flow meter readings following the Promag readings to acceptable degree.
Results
Notable results are shown in the form of graphs in Figure 14 to Figure 17. The graph in Figure 14 is an illustration of the initial measured differential pressure for the known flow rates as well as the offset corrected curve. This offset correction was achieved by adjusting in Equation (2) so that (see Table 4) for zero differential pressure. The result is shown in Figure 15.
Figure 16 shows the accuracy of flow rate readings, calculated as in Equations (21) to (23).
(21)
(22)
(23)
It should be noted that the orifice flow meter performed better than expected. As seen in Figure 17, apart from minor inconsistencies in pressure readings, the considerably less expensive orifice flow meter, compared to the Promag, was able to make surprisingly accurate readings. Also in Figure 17, when this graph is plotted for flow rates of 0 to , the three different lines become indistinguishable from each other.
The turndown ratio of a flow meter is an indication of its range of operation within a specified accuracy and repeatability. The typical orifice flow meter is expected to have a turndown ratio of less than 5:1 (Engineering Toolbox, 2013). Taking into account that flow rate readings can be detected accurately from onwards, the use of can be considered as conservative. Also, is only the limit for this test and accurate higher flow rate readings may be achieved. Therefore the exceptional and conservative turndown ratio of 14:1 was calculated as in Equation (24) .
(24)

29
One unsolicited result of this test is the increasing variation between minimum and maximum differential pressure readings with increasing flow rates as seen in Appendix H. This phenomenon can be contributed to the small orifice bore of 12.5 mm causing turbulent flow conditions at higher flow rates. It should once again be considered to use a Venturi flow meter in future applications, which should diminish this effect. Another possibility would be to design a scaled up flow meter.
Volume usage measurements seemed to lag behind the Promag readings. Considering the accurate flow rate readings, it was assumed that this can be approved upon by better coding. However, overall test results are encouraging for this first-time amateur design.

30
Figure 14: Differential pressure vs. flow rate
Figure 15: VOUT vs. differential pressure
Figure 16: Flow rate reading accuracy
0
5000
10000
15000
20000
25000
30000
35000
40000
0 5 10 15 20 25 30 35 40 45
Dif
fere
nti
al P
ress
ure
(P
a)
Flow Rate (l/min)
MeasuredDPDP +Offset
0
0.2
0.4
0.6
0.8
1
1.2
0 5000 10000 15000 20000 25000
VO
UT
(V)
Differential Pressure (Pa)
Vout +OffsetMeasuredVout
-1
-0.5
0
0.5
1
1.5
2
2.5
3
0 5 10 15 20 25 30 35 40 45 50 55 60 65 70 75
Flo
w R
ate
Acc
ura
cy (
%q
FSS)
Flow Rate (l/min)

31
Figure 17: Calculated & measured flow rate vs. differential pressure
0
2
4
6
8
10
12
14
16
18
20
22
0 2 4 6 8 10 12 14 16 18 20 22
Flo
w R
ate
Re
adin
g (l
/min
)
Known Flow Rate (l/min)
Promag 10PReading
Filtered OrificeReading (ISO)
InstantaneousOrifice Reading(ISO)

32
5.4. Solenoid Valve
To control the flow of water into a residential building, a simple solenoid valve was proposed to open or shut off the main water supply line to a residence. The requirements being that it must able to connect to a 22mm diameter pipe and effectively open or close via an electrical signal.
5.4.1. Research
A solenoid valve is electromechanically operated by sending an electric current through a solenoid. It is a fairly common type of valve used among others for irrigation purposes.
A suitable valve was procured from a local retailer and can be seen in Figure 18. Water must be pumped at a slight pressure through this valve. Therefore, a pressure drop is expected through the valve. However, it was determined that this drop would not be of any significance to the performance of this system. The effects of this pressure drop on the static pressure at residence water fixtures remains to be determined.
The valve will be powered by a 24V AC transformer and switched on and off by one of the relays discussed below which, in turn, will be controlled by the MCU.
5.4.2. Testing
It was determined through testing that this valve can be switched using only a 12VDC power source, which is more in the range of what the other components (MCU and modem) require. Therefore, if spatially possible, this valve together with the other components can all be powered from one power source.
The valve was also tested using the relays, controlled by the MCU, which is discussed in the Relays section below.
Figure 18: Solenoid valve
33
5.5. Power Meter
A device is required to accurately measure the billable kilowatt hours ( ) of energy used by appliances in a residence for customers to keep track of their energy consumption in order to help them save electricity. The Cirrus Logic CS5490 energy measurement IC was supplied for optional use for this purpose.
5.5.1. Research
Due to common practice in this power metering industry, from here on kilowatt hour ( ) will be used as the unit for electrical energy instead of the SI unit of joule ( ). The conversion rate is given below.
(25)
Once again, off-the-shelf power meters were considered such as the CRD5490 power meter also from Cirrus Logic, but were found mostly to be too expensive or needed further changes to it to fit the project requirements. Therefore, the decision was made to also design and build this component. Extensive research was done into this subject to produce an easy to design, affordable and safe to use product. Firstly some background knowledge was needed.
For this project, only single phase electric power will be considered such as would be found in most residences. Also, the phase angle of the electrical loads will be ignored from calculations as in the case of purely resistive loads ( in Equation (26)).
When measuring the amount of power that an appliance consumes, it is known that this refers to the real power component of its consumption for which the calculation is shown in Equation (26).
(26)
To find the amount of electrical energy used, the power is integrated over time, which in common practice would mean to average the power consumption over a period of time (often a quarter of an hour) and multiply this by the time as seen in Equation (27).
∫
(27)
With this in mind, work could be started on concept ideas. The Cirrus Logic IC as well as other alternatives were considered and weighed against each other. The CS5490 IC was, from conversations with specialists, initially believed to be complex, difficult to program correctly and required a detailed circuit design. At this point the primary alternative was to use a current transformer and scaling

34
resistances to measure the current and voltage directly from the MCU analogue pins and to then perform all calculations on the MCU. This approach would however, place the extra processing load on the MCU rather than letting the IC handle it.
Upon reconsideration of the CS5490 option, it was found to be a considerably more attractive option than the latter and it was decided to follow the design instructions included in the CS5490 datasheet. With this design the MCU would also have more time to focus on communications and controlling the entire system.
5.5.2. Design
To finalise a design, there were some decisions left to the user of the CS5490 to be made. The foremost was the decision of which current sensing method and device to use. The three options were a current transformer (CT), a shunt and a Rogowski coil. Of the three, the CT is commonly used, provides good readings and is the safest to work with when it comes to exposure of live wires. The CT was chosen and the circuit design in Figure 20 was chosen as the final design.
The CT functions as shown in Figure 19, with the primary conductor being the live wire from the high voltage circuit. The alternating current in the live wire produces a changing magnetic field in the core which induces an alternating current in the secondary winding. This particular CT (AC-1060) has a turns-ratio of 1000:1, meaning that the induced current will be a thousand times smaller than the current in the primary conductor. Therefore, at the chosen maximum current through the CT (10 A as discussed in section 5.1.2), an induced current of 10 mA will flow through the two pins of the CT.
Figure 19: Current transformer appearance and operation (Electronics-Tutorials.ws, 2013)
Both the and pins of the power IC expect a maximum voltage of (Cirrus Logic, 2013). Both the resistance and the voltage dividing resistances were chosen to utilise the near full operating range of the

35
power IC operational amplifiers to achieve the best possible accuracy. The resistance in Figure 20 was chosen to be . This was used together with the maximum current of in the secondary winding of the CT to calculate the maximum expected voltage at the pins in Equation (28). The design in Figure 20 requires scaling resistors to be used for the measuring of the voltage. With the assumed maximum voltage between live and neutral of and the voltage divider resistances chosen as and , the maximum expected voltage at the pins is calculated in Equation (29). With both these peak values within the rated range of the pins, the choices for the values of and the voltage dividing resistances was substantiated.
(28)
(29)
The use of scaling resistors raised a question about the isolation of such a circuit, since it requires that the resistors be connected between the live and neutral wire of a high voltage circuit. Therefore, these wires would need to be exposed to make this connection, creating the possibility of a potentially lethal 10 A (220 VAC) short circuit when contact is made with the live wire while also grounded at some point. This risk was averted as far as possible, as seen in Figure 22, but it is recommended that this connection and the whole meter be covered completely in a protective casing in future designs. This risk and the proper safety procedures are also discussed in Appendix F.2.
Initially it was considered to use the CS5490’s pulse generation function to output energy pulses to its DO pin through photo-couplers, in order to separate the power meter’s ground from the MCU ground. However, the serial communications with the device proved to be simpler. Therefore, the MCU could continuously read values from the voltage and current registers of the CS5490.
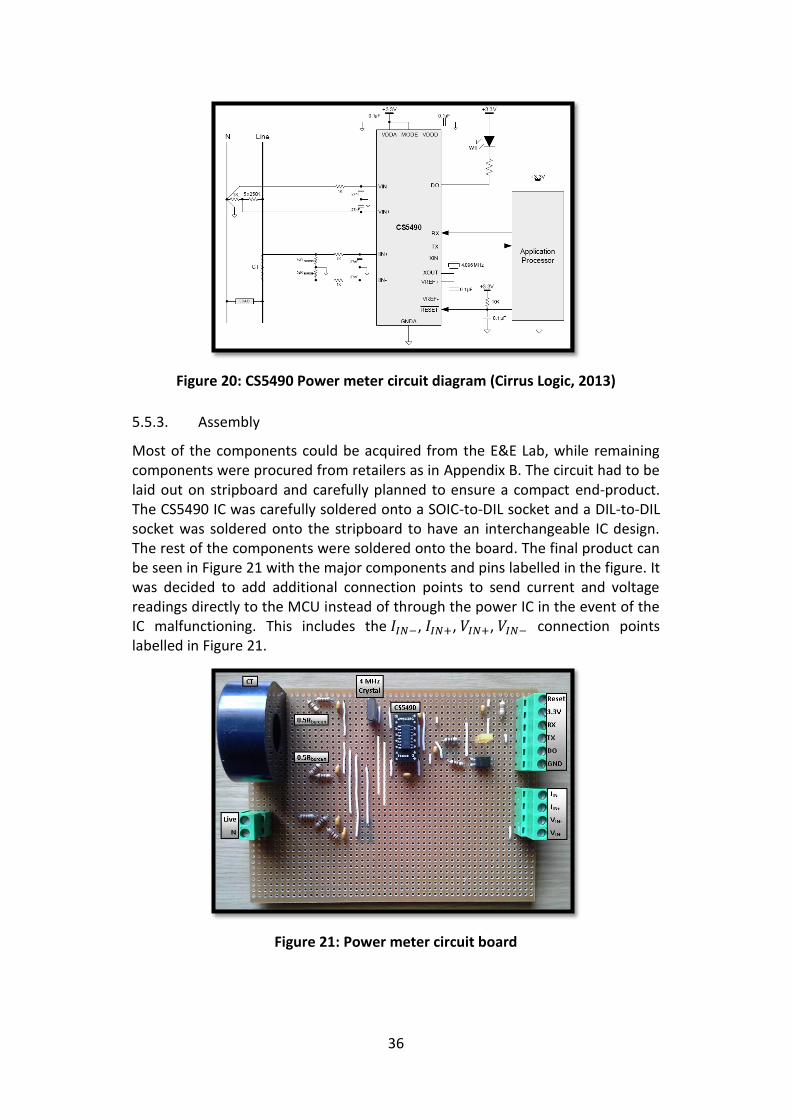
36
Figure 20: CS5490 Power meter circuit diagram (Cirrus Logic, 2013)
5.5.3. Assembly
Most of the components could be acquired from the E&E Lab, while remaining components were procured from retailers as in Appendix B. The circuit had to be laid out on stripboard and carefully planned to ensure a compact end-product. The CS5490 IC was carefully soldered onto a SOIC-to-DIL socket and a DIL-to-DIL socket was soldered onto the stripboard to have an interchangeable IC design. The rest of the components were soldered onto the board. The final product can be seen in Figure 21 with the major components and pins labelled in the figure. It was decided to add additional connection points to send current and voltage readings directly to the MCU instead of through the power IC in the event of the IC malfunctioning. This includes the , , , connection points labelled in Figure 21.
Figure 21: Power meter circuit board

37
5.5.4. Testing
To test the power meter it had to be connected to a high voltage circuit. This introduced various safety risks which had to be taken into account during tests. A summary of these risks and the necessary precautions can be found in the Risk Analysis in Appendix F.
Firstly, the calculated values in Equations (28) and (29) had to be checked to ensure that the power IC was receiving the correct voltage levels for measurements. Using a multi-meter,
was measured between the
pin and ground to be approximately , which was acceptable since the difference between live and neutral was measured to be , instead of . had similar results. The reading of the power meter registers is
explained in section 5.1.2. Reading values were recorded by displaying them on the Serial Monitor of the Arduino IDE software. The power meter, assembled as in Figure 22, was plugged into a normal wall socket. A heater with a power rating of was plugged into the other end of the power meter extension cable. All power was switched off at this stage. With the power meter connected to the MCU, its setup completed and the heater also switched off, the first readings could be taken to determine if any offset values existed in the registers with zero current and voltage. After it was ascertained that these offsets do, on occasion, present themselves, it was decided to make provision for offsets. Therefore these first readings are programmed to be taken after every reboot and subtracted from all further reading values as in Equations (5) and (6).
To determine the scaling factors of the voltage and current ratios read from the power IC registers, as stated in section 5.1.2, varying loads had to be connected to the power meter. With the power meter setup as in the above case, the wall socket could now be switched on while the heater was still switched off. This caused a more or less constant voltage, read with a multi-meter, of while the current is still zero. The value read by the power meter was 0.74219. Therefore, a preliminary voltage scaling factor ( ) could be determined as in Equation (30). Since the voltage stays constant with any given load, it made it difficult to test this scaling factor at other voltages. One way to test this was to connect the power meter after a variable AC voltage adapter. However, the minor changes in voltage when connected to a load, measured with the multi-meter, compared well to the voltage readings of the power meter with this preliminary scaling factor applied. After more tests, this scaling factor was deemed accurate therefore applied in the final code which is explained in section 5.1.2.

38
(30)
The current scaling factor ( ) was determined in a similar fashion, only the factor could be tested at different currents by varying the load. This was done by taking readings with the power meter as well as current measurements with the multi-meter while the heater was on in “Fan” mode (very little power consumption), on in “Eco” mode (moderate power consumption) and on in “Max” mode (high power consumption). The slightly varying factors obtained from these tests were averaged to obtain the accurate value as seen in Equation (31).
(31)
These scaling factors were then implemented into Equations (5) and (6) and the power and energy equations (Equations (7) and (8)) were set up to complete the shaping of all of the functions of the power meter. To initially test the measurements being made, the measured voltage and current values were displayed on the Arduino IDE serial monitor to compare with multi-meter readings being made at the same time. The resulting measurements compared near perfectly with the multi-meter.
To test the finished product for its actual use of keeping track of the energy consumption it was compared against the commercially available and widely used ACE9000 ISP meter seen Table 5. Some key features of this meter are also summarised in the table. The ACE9000 is loaded with a prepaid amount of energy which is displayed in kilowatt-hours on its digital display. When connected to a load this displayed amount depletes as the load consumes more energy while also flashing a LED for energy pulses. Loads are connected to the ACE9000 in a similar fashion as with the custom power meter. Also, since the custom power meter, powered by the MCU, consumes almost zero power for itself, it was decided to connect the two meters in series with each other, with the custom power meter after the ACE9000, which consumes a small amount of power to power itself and for measurements.

39
Table 5: ACE9000 ISP key features (Itron, 2013)
Initially, the custom power meter kept near perfect track of the energy consumption, but after running for a while some inconsistencies did occur with the ACE9000 readings. The custom power meter seemed to very gradually fall behind with the energy readings. After of energy was depleted from the ACE9000, the power meter’s energy reading was approximately 8% off. This was attributed to some small error in determining the scaling factors and was considered to be easily rectifiable with more precise measuring equipment to use as standard. Using an oscilloscope should help in this regard. Overall, it was believed that the initial concept was proven to be very realisable.
Figure 22: Power meter assembled
5.6. Relays
Relays are required for the on and off switching of electrical devices such as the plugs or lights of a residence. For this project Finder 36-series miniature PCB relays (see Figure 23) were supplied by the supervisor. This section will discuss some background to relays, its use in this project and testing done with these relays.
Illustration Key Features
Full Compliance to STS and SANS 1524 prepayment standard
Accuracy: Class 1 (ISP+) and Class 2
Base current: 20A or 10A for (ISP+)
Maximum current: 60A or 80A (ISP+)
IP54 enclosure with improved RF immunity of 16V/m
Optional Tamper Switch
Product Life: 15 years

40
5.6.1. Research
The Free Dictionary describes an electrical relay as an “electrical device such that current flowing through it in one circuit (through a coil) can switch on and off a current (through contacts) in a second circuit.” Therefore, essentially, it is an electrically operated switch, using in this case an electromagnet to operate the switching mechanism mechanically. They are relatively simple devices used in various switching applications.
There is a wide range of relays available on the market. For this project solid state, printed circuit board (PCB) mounted relays were chosen with coil energising via change-over (CO) contacts and with the designation of single pole double throw (SPDT). A solid state relay is an electronic device in which a small control signal controls a larger load circuit with no moving parts compared to an electromechanical relay where an electromagnet is used to control a switching mechanism mechanically. The challenge with a PCB-mounted relay in many cases, as in this one, is that it needs to be able to handle higher than normal currents being conducted through its contacts (or secondary circuit), named earlier. Higher current would normally mean using thicker wires, but with PCBs it would suggest using thicker tracks to prevent sparking from occurring.
Also, with the SPDT designation and therefore five terminals as shown in Figure 23, it is advised that the normally open (NO) connection be used in case of a power outage at the residence, so that when power comes back on, damage does not occur to the relays or the MCU (Hayes, 2012).
The given relays are rated as 10 A, 5 VDC and 2500 W, meaning that its contact rated current is 10 A, its coil nominal or switching voltage is 5 VDC and that it can switch loads of up to 2500 W. This power rating is equivalent to appliances such as a kettle, heater, swimming pool pump etc. and should be kept in mind when used in the residential setup.
Figure 23: Finder 36-series PCB relay and pin layout

41
5.6.2. Design
The basic function of the relays will be to switch appliances on or off at an electrical distribution board. They will be controlled by the MCU, receiving commands from the SMART platform. Since appliances will be connected to the NO contact of the relays, a constant 5 VDC voltage will need to be supplied to the relay coil to close the circuit and keep the appliance on (see Figure 23).
For the case of the PCB tracks, it was considered to design and print a custom PCB, but it was decided that this route would consume unnecessary time, effort and funds when a relatively inexpensive 8-channel relay kit was found at Yebo! Electronics with exactly the PCB layout needed.
The kit consists of a PCB with a custom track layout and space for up to eight relays to be installed, enabling future expansion. Connecters are included to safely connect appliances to the relays with no live wires exposed. The tracks on the PCB from the connecters to the relay contact pins are especially thick to provide for the potential 10 A of current through them. Also, courtesy LEDs are included for each relay to indicate when it is activated. The relays are connected to a Toshiba relay driver IC with on-board diodes for each relay to protect the MCU, which is also connected to the IC through its digital output pins, from any stray currents from the coils. One more connecter is added for the supply voltage and ground connection, also from the MCU.
This design met all the project requirements for the relays and was approved to be used.
5.6.3. Assembly
The relay kit was procured and assembly was a swift and effortless soldering process seen in Figure 24a. The completed relay circuit board can be seen in Figure 24b.
Figure 24: Relay circuit board. a) Construction of circuit board on PCB with thicker tracks. b) Completed circuit board.
a) b)

42
5.6.4. Testing
After the necessary coding was completed for the relays, described in the Microcontroller section (section 5.1.) above, testing of the circuit board could be performed. The test setup can be seen in the extract from a video of the test in Figure 25. It was tested using four simple DC circuits with LEDs and resistances to see if the MCU was able to effectively switch the relays with the available current on its digital I/O pins. Also, the fifth relay was connected to bed lamp (approximately 60 W) powered from a wall socket (220 VAC) also as seen in the figure. The bed lamp was later exchanged for a kettle (2200 W) and the solenoid valve previously discussed, as illustration of the expected operating conditions.
The coils of relays in the setup shown in Figure 25 were connected to the digital output pins and the ground pin of the MCU. The MCU’s 5 VDC output pin was also used as the supply voltage for the relay circuit board. The contacts were connected to a circuits described above. The MCU was programmed to receive the relay number (1 to 5) and state (1 = on and 0 = off) via user input from the serial monitor on the computer in the left of Figure 25.
The relays switched seamlessly which was evident through the switching sound as well as the LEDs, bed lamp (later the kettle and solenoid valve) and courtesy LEDs on the setup board switching on and off on command, proving that the relays will be able to be witched by the MCU. This proved the successful application of this component for the controlling of the subsystems.
Figure 25: Extract from relay testing video

43
6. SMART
In this section a broad overview is given of the SMART platform, its use and capabilities. Also, the final design of the system user interface is discussed.
6.1. Overview
With the information already discussed, especially in section 5.2, it is known that the SMART platform is Trintel’s own custom developed M2M platform which gives their clients the ability to manage their wireless telemetry over the GSM network through a web-based portal. By accumulating and reporting on diagnostic and statistical information from devices, SMART enables enhanced maintenance, cost control, service agreements and on-billing for their clients (Trinity Telecomms (Pty) Ltd., 2013).
The SMART web-based tool that is used to monitor and control the system is called SMART Sight. This tool allows clients to create a graphical user interface (GUI) for end-users, such as the one displayed in Figure 26. The dashboard has endless possibilities for displaying information and setting up controls in the form of gadgets placed on the dashboard. Gadgets include anything from analogue displays, to historical graphs, to knobs and switches. Gadgets are made up of metrics, which is the processed form of the raw data being exchanged with assets. The process of creating metrics to build gadgets to finally place on a dashboard is the setting up of a metric model. User rights can also be set up to control the content and settings that are available to the end-user when he/she logs into SMART Sight.
6.2. Design
The final dashboard design can be seen in Figure 26. To get to this point a metric model was created for the HomeMeter asset. Firstly, all the raw elements of the HomeMeter asset model, as listed in Table 2, were processed into the required metrics. The metrics were used to build up each of the gadgets seen in Figure 26. Finally, the gadgets placed onto the dashboard to form the layout seen in the figure.
The layout was based on user-friendliness and optimum use of the space available in one window. To the left are all of the water flow information and controls, including the flow rate in , the water usage in , the flow rate history and the high flow rate set point control. In the middle are the same gadgets for the power consumption and energy usage. To the right are the controls for all of the devices connected to the relays, in this case the water valve, plugs, lights, hot water cylinder or geyser and the swimming pool pump. The background picture is an additional gadget created, using the URL of the picture.

44
The information displayed on these gadgets in Figure 26 is from actual data received from the modem and therefore is a visual indicator of the successful implementation of the SMART Sight dashboard. The reader may access this dashboard by logging into SMART Sight by using the username and password of “house” (Trinity, 2013).
Figure 26: SMART Sight dashboard

45
7. INTEGRATED SYSTEM
All individual components of the system have been discussed in depth. The system can now considered as a whole with all the components integrated into it and working in conjunction with each other.
7.1. Final Test
A final test was performed to confirm its functionality as a unit. Once again the thermo-fluids laboratory was used for this test as it had the necessary equipment for the flow meter installation, while also being able to incorporate the other components into this facility. The test setup is shown in Figure 27. For this test the MCU was disconnected from the computer and powered by its own adapter. The code for the MCU was uploaded and allowed to run on its own, and the results were viewed on SMART Sight alone.
One difficulty that arose with this test is the ability of the MCU to receive commands while also sending data up. Some commands were skipped from time to time. Therefore, the relays, for example, would switch at times after the command from SMART, but on a number of occasions the command would not be performed. It is believed, however, that this problem could be easily resolved by using further developed code for the communication with the modem that would include error handling as well as perfecting the order of sending and receiving data.
It was also discovered during this test that the solenoid valve could not, at high flow rates, completely shut the flow off, but rather just slow it down. As this is an irrigation valve, more research into the product or possible a better product should be considered.
The rest of the system’s functionality worked without fault. Accurate flow measurements were made, sent up to SMART and displayed on the dashboard. The same was true for the power and energy measurements with the same heater connected to the system. Also, with the flow meter warning on SMART set at (and sent down to the MCU) and the valve opened to a flow of approximately , an event message was immediately sent up to SMART. Within less than a minute of opening the valve an alarm message was received via text message informing the author of the flow rate exceeding the set point flow rate. The same was true for the power. These functions were all handled concurrently.

46
Figure 27: Integrated system test setup
7.2. Considerations
After all tests were completed, it was necessary to consider some of the possible challenges of the actual implementation of this system.
At the moment each component that requires a relatively significant power supply of its own (MCU, modem and the valve) is powered individually with its own adapter and cable. It should be considered how all of these components can be powered without the need for redundant parts, i.e. using one power source.
In Figure 27 it is clear that the system, as is, is extremely cluttered with components and wires as well as being difficult to move around. It should therefore be considered to provide a casing for the MCU, modem, power meter and relays to be mounted in. For this reason, the placement, housing and safety of the system must be determined before installation. The system as seen in Figure 1 will, for one, have spatial constraints. It was decided that the relays and

47
electricity meter will need to be as close as possible if not inside the residential distribution board so as not to have any high voltage lines visible or accessible for safety reasons. For further aesthetics and practical reasons, such as accessibility, the control unit (MCU and the modem) together with their power source (cable and adapter) should be placed close to the distribution board and housed in some form of a plastic casing as in the case of current test projects in the Trintel office. The flow meter and valve will introduce the challenge as both need to be connected in series to the water main before any distribution points which could, in many cases, not be anywhere near the distribution board. The valve may then need its own power source and if the installation needs to be outside, both components will need to be placed in housing unaffected by most weather conditions.
While these considerations are not of the foremost concern for this proof of concept project, they are relevant and should be discussed before any working models of the system are installed. However, as this system clearly performs satisfyingly, it can be reasoned that if the system works in a less than realistic spatial setup, it can, with some modifications, be accomplished in a real domestic residence.

48
8. CONCLUSION
The project team had at its disposal all the expertise and determination required to successfully complete this project. The total cost of the project, if all parts were to be procured and the engineer charged a nominal rate per hour worked on the project, would amount up to R215 150. Of this the actual amount spent by the student added up to approximately R1 100 of capital expenditure. The time for completion was 11 months. By all accounts this project was completed successfully within the given time and financial budget.
8.1. Findings
An orifice water flow meter was designed, manufactured and tested to measure flow rates accurate within 1% for flow between and . The volume usage calculations performed by the MCU can be improved upon, but still gives a reasonable idea of near real-time water usage. For the monitoring of energy usage, a power meter was built and tested. For the power meter also, power measurements were accurate, while energy measurements fell slightly behind the known consumption. Relays were employed successfully to control the state of electrical appliances as well as controlling a valve to open or shut water flow. This system was further connected to a modem that was linked to the Trintel SMART platform. Using SMART Sight a graphical user interface was created for users to login to, from where the wireless telemetry could be managed. The combined components were tested as one system, which produced favourable results. Overall, the initial concept idea was proven to be an attractive possibility for future development.
8.2. Recommendations
The primary recommendation, everything considered, would be to assign more resources to the further development of this project. Discussions should be initialised between Trintel and MTN to determine the possibility of approaching customers with this as a new telemetry solution on their product line. There is ample room for improvement on the work done thus far. One such area would be the programming of the MCU, which with the help from Trintel, could provide a much smoother performance. Also, the design of the flow meter can be optimised and manufactured at an even more affordable price.
8.3. Closing Remarks
The advantage of the use of wireless technology and the central control it gives the customer is unmistakable. So too, is the fact that the need for optimization and saving as much as possible in economically challenging times with a growing population are critical. This project is the start of a solution to a much wider problem and by proving its potential for success, breaks the way for similar solutions in all aspects of our daily lives, possibly urging on a global trend. The

49
project designed and built a system to ultimately test the feasibility, practically and economically, of rendering a service where the client can monitor and control his/her water and electricity consumption on the SMART platform. It is of the author’s opinion that enough evidence have been presented to merit the continuation of the research and development of this project.

50
REFERENCES
Arduino, 2013. Home Page. [Online] Available at: http://www.arduino.cc/ [Accessed 26 July 2013].
Booysen, M. J., Engelbrecht, J. A. A. & Molinaro, A., 2013. Proof of concept: Large-scale monitor and control of household water heating in near real-time, International Conference of Applied Energy: (ICAE 2013). Pretoria, South Africa, s.n.
Cirrus Logic, 2013. CS5490 F3. [Online] Available at: http://www.cirrus.com/en/pubs/proDatasheet/CS5490_F3.pdf [Accessed 26 July 2013].
Croukamp, W., 2013. Head technician at Electric Electronic Workshop [Interview] (27 February 2013).
Electronics-Tutorials.ws, 2013. Current Transformer. [Online] Available at: http://www.electronics-tutorials.ws/transformer/trans53.gif [Accessed 5 October 2013].
Endress+Hauser, 2010. Promag 10P. [Online] Available at: https://portal.endress.com/wa001/dla/5000000/0581/000/03/TI094DEN_1109.pdf [Accessed 27 September 2013].
Engineering Toolbox, 2013. Types of Fluid Flow Meters. [Online] Available at: http://www.engineeringtoolbox.com/flow-meters-d_493.html [Accessed 26 July 2013].
Freescale, 2010. MPX5100. [Online] Available at: http://www.freescale.com/files/sensors/doc/data_sheet/MPX5100.pdf [Accessed 13 April 2013].
Hayes, W., 2012. Trintel hardware and firmware specialist [Interview] (December 2012).
ISO 5167-2, 2003. Measurement of fluid flow by means of pressure differential devices inserted in circular-cross section conduits running full – Part 2: Orifice plates, Geneva: ISO.
Itron, 2013. ACE9000 ISP. [Online] Available at: https://www.itron.com/mxca/en/productsAndServices/Pages/ACE9000%20ISP.aspx [Accessed 28 September 2013].
Müller, R. I., 2013. Experiment Design Report, Stellenbosch: Unpublished undergraduate report.
Omega Engineering Inc., 2013. Introduction to Flow Meters. [Online] Available at: http://www.omega.com/prodinfo/flowmeters.html [Accessed 27 February 2013].

51
Touch Home Automation, 2011. Home Automation Products Johannesburg. [Online] Available at: www.touchhome.co.za [Accessed 26 July 2013].
Trinity Telecomms (Pty) Ltd., 2013. SMART Sense Telemetry Management. [Online] Available at: http://www.trintel.co.za/content/4057/4023/smart-sense-solution [Accessed 27 September 2013].
Trinity, 2013. SMART Sight Login. [Online] Available at: http://smart.trintel.co.za/core/accounts/login/?next=/ [Accessed 20 October 2013].
Weiss, M., 2012. Trintel Technical Director [Interview] (21 December 2012).

52
APPENDIX A : TECHNO-ECONOMIC ANALYSIS
As it was previously explained, this project could have an immense effect on the way people consume energy and water and as such it is important to also investigate the techno-economic impacts of this project.
A.1. Budget
Given in Appendix B are all the parts which had to be bought off-the-shelf, the different retailers and their costs. Appendix C and Appendix D contains the estimated and actual costs per activity respectively. Project activities were defined in section 3 as guidelines for budgeting and planning. Estimated costs were prepared as a budget for the Project Proposal and can be seen to have been considerably adjusted to arrive at the actual costs.
The primary reason for the considerable increase in the final cost of the project can be attributed to grossly underestimating the amount of engineering hours that go into such a project. This was largely due to inexperience and is not something that would likely happen again. The engineering time expenses were determined by using a tariff of R300 per hour of work done, which is seen as an acceptable rate for a professional engineer. Other notable differences in figures include higher than planned facility use expenses and also considerable savings on EEW expenses.
Facility use expenses were determined by using the tariff of R50 per hour per R100 000 replacement value of the piece of equipment. The higher facility use was also to some degree due to underestimation. However, testing in the laboratories took longer due to challenges with the power meter. Also, the considerably longer time that was taken to complete the final report also introduced expenses for the use of computers.
The savings in the EEW department can be contributed to an effective process. By ensuring open communication between the author and the head technician at EEW, design drawings were clearly understood and prepared specifically for the workshop. Also, because the design process was completed early during the project, technicians at EEW could immediately focus on the manufacturing of the flow meter before the workshop became overrun with different projects.
A.2. Planning
The Gantt chart found in Appendix E provides a broad overview of the planning for this project in the form of the baseline. This is also compared to the actual course of events and once again this is done according to the guideline project activities. The duration values for the Gantt chart will however not correspond with the engineering hours found in Appendix C or Appendix D. The duration in
53
this instance displays time past from start to finish, instead of actual hours spent working on the activity.
It is clear that the actual course of events strayed considerable from the given baseline timeframe. This could largely be attributed to inexperience in this planning field. However, contradicting the savings made at the EEW, the time it took for manufacturing to actually start, put the rest of the project behind the baseline schedule. Also, it can be seen from this planning that no activity was made dependant on the completion of any predecessor activities. This was due to the fact that many of the activities could technically be handled concurrently by a larger project team, or as was the case during, Integration, Testing and the compiling of the Final Report. For the reasoning behind increased time spent on certain activities, see the previous section. Delays were mainly caused during the first semester of the year when engineering time had to be distributed between different projects.
Overall the time schedule planning was a little underestimated, especially for the first part of the year. However, good progress was made to the end of the project, delivering a successfully completed project on time and well within the allowed price range of such a project.
A.3. Technical Impact
The technical impact of this project has been briefly discussed in section 1 and 8. Sustainability is a trending topic and businesses everywhere are trying to implement a “green” strategy in order to minimise their footprint on the environment while also decreasing their waste of Earth’s waning resources.
The successful completion of this project is the embodiment of this movement. The designed system will give people the power in their hands to actively make an effort to save essential resources such as water and electricity. This project focuses on stabilising the problem of an increasing demand instead of finding new ways to provide in the ever-growing demand.
For this particular field of study, the project can provide some valuable insight into the design of accurate and affordable flow meters for residential use. Also, test data that was collected on the SMART platform over the course of the project can be used by Trintel to further refine their system. The project itself may eventually be used by Trintel or MTN, enabling people to start saving more.
The outcome of the project is definitely worth the financial input, especially since physical system turned to be considerably less expensive than buying all the components off-the shelf. Also, the possible impacts of this study and the results obtained from it, further substantiates the worth of the project.

54
A.4. Return on Investment
The investment made into this project was for good reason. The short-term effects of the study include further insight into the field of study and the opportunity to further optimise and expand on an existing system used by Trintel and MTN. The long-term effect are more of an economical nature, as it may include the system being ready for commercialisation and earning money back for the investors. Also, this project is at the forefront of a movement in the direction of sustainability. In the long run, that will place the investors in a favourable position of having a monopoly of the market for at least a period of time.
In this report it has been proven that this system functions successfully, but with considerable room for improving on the existing designs. Further research and development into this project is therefore crucial for it to eventually achieve its long-term success. The use of the technology in this manner is also new and requires further research for it to reach is full potential.
For this project specifically, research and development should be done into proper housing for such a system, ways of enabling the user to get the most out of the system and designing the system to handle larger electrical power loads in order to control an entire house or even an office building.
A.5. Potential for commercialisation
This project originally stemmed from collaboration between the student supervisor, Trintel and MTN. All of whom have an interest and even some, a market for this type of product. Therefore, it can strongly be assumed that there is a definite potential for the commercialisation of this project. The successful completion and favourable results of the project further contributes to its potential.
Trintel currently has similar telemetry management services which they offer to customers. However, this project would serve as product as well as a service and the actual value of that type of package is not certain. It would include monthly or yearly payments to both MTN, as cellular service provider, and Trintel for the use of SMART.
It can be estimated that such a package might become increasingly valuable in the near future as saving resources become increasingly critical. The main aspect to focus on is the fact that this is a product that can only become more popular and essential.

55
APPENDIX B : COSTS OF COMPONENTS USED
Item Retailer Qty Unit Cost Cost
Modem R 1,083.00
Sierra Wireless Airlink GL6110 Trintel 1 R 1,083.00 R 1,083.00
Microcontroller R 462.98
Arduino Mega 2560 RS Components 1 R 462.98 R 462.98
Flow meter R 874.54
Acetal Ø70x500mm Maizey Plastics 1 R 425.00 R 425.00
Freescale MPX5100DP pressure sensor
RS Components 1 R 206.44 R 206.44
Coupling (copper) 22mm Oranje Blanje Blou 2 R 30.00 R 60.00
Reducer Conex 28x22mm Carry On Hardware 1 R 23.95 R 23.95
Pipe (polyprop) 22mm Oranje Blanje Blou 2 R 15.00 R 30.00
Festo QSM-M5-6 push-in fitting Festo 2 R 23.87 R 47.74
Festo PEN-6x1-SW plastic tubing Festo 2 R 3.83 R 7.66
4 Core alarm cable Yebo! Electronics 5 R 4.95 R 24.75
Extras EEW, Eikestad Bolt & Nut and Carry On Hardware
1 R 49.00 R 49.00
Valve R 382.61
Solenoid valve 24VAC Kaap Agri 1 R 173.60 R 173.60
Coupling 22mm Kaap Agri 2 R 20.69 R 41.38
Transformer 220-24VAC Kaap Agri 1 R 167.63 R 167.63
Relays R 316.77
Finder 36.11.9.005.4001 PCB relay RS Components 5 R 18.78 R 93.90
Yebo! Electronics 8-Channel relay board
Yebo! Electronics 1 R 222.87 R 222.87
Power Meter R 317.42
Stripboard 95x127mm Yebo! Electronics 1 R 41.49 R 41.49
Cirrus Logic CS5490 Power IC Avnet Kopp 1 R 42.37 R 42.37
Currents sense transformer 60A 1000:1
RS Components 1 R 40.77 R 40.77
Crystal 4.096MHz RS Components 1 R 4.14 R 4.14
SOIC to DIL socket 16 way RS Components 1 R 36.80 R 36.80
Ext Lead 3m Oranje Blanje Blou 1 R 59.00 R 59.00
Extras E&E Lab Store and Carry On Hardware
1 R 92.85 R 92.85
Total R 3,437.32

56
APPENDIX C : ESTIMATED COSTS PER ACTIVITY
Activity
Engineering Time
Running Costs
Facility Use
Capital Costs
EEW
Subtotal Labour Material
hr. R R R R hr. R R R
Training* 16 R 2,400 R 200 R 100 R 2,700
Literature Study 50 R 15,000 R 300 R 15,300
Flow Meter Design 30 R 9,000 R 200 6 R 1,500 R 10,700
Concept Decision 10 R 3,000 4 R 1,000 R 4,000
Hardware Procurement 20 R 6,000 R 600 R 2,500 90 R 22,500 R 7,500 R 39,100
Software Development 80 R 24,000 R 200 R 0 R 24,200
Integration 60 R 18,000 R 300 R 0 R 18,300
Testing 50 R 15,000 R 500 R 0 R 15,500
Final Report 50 R 15,000 R 100 R 0 R 15,100
Total 366 R 107,400 R 1,200 R 1,300 R 2,500 100 R 25,000 R 7,500 R 144,900
* Training at a reduced rate of R150/hr.

57
APPENDIX D : ACTUAL COSTS PER ACTIVITY
Activity
Engineering Time
Running Costs
Facility Use
Capital Costs
EEW
Subtotal Labour Material
hr. R R R R hr. R R R
Training* 8 R 1,200 R 50 R 300 R 1,550
Literature Study 70 R 21,000 R 100 R 200 R 21,300
Flow Meter Design 80 R 24,000 R 200 6 R 1,500 R 25,700
Concept Decision 20 R 6,000 4 R 1,000 R 7,000
Hardware Procurement 50 R 15,000 R 1,200 R 1,750 16 R 4,000 R 500 R 22,450
Software Development 60 R 18,000 R 150 R 0 R 18,150
Integration 40 R 12,000 R 200 R 0 R 12,200
Testing 100 R 30,000 R 50 R 1,000 R 0 R 31,050
Final Report 250 R 75,000 R 250 R 500 R 0 R 75,750
Total 678 R 202,200 R 1,600 R 2,300 R 2,050 26 R 6,500 R 500 R 215,150
* Training at a reduced rate of R150/hr.

58
APPENDIX E : GANTT CHART

59
APPENDIX F : RISK ANALYSIS AND SAFETY PROCEDURES
This section discusses the potential risks involved with the work done for certain parts of this project, their impacts and the safety procedures to follow in order to mitigate the possibility of the risks.
F.1. Thermo-fluids Laboratory
Work done in the thermo-fluids laboratory included testing of the orifice flow meter as well as testing of the combined system with all the components. The test setup areas for both of these tests can be seen in Figure 28a and b. The following risks were identified and determined to be the main concerns for these setups:
Obstruction of walkway
For both tests equipment had to be placed on the ground between the piping and the table, in order for the required connections to be made between the orifice flow meter and the computer. This included for the first test, piping, the Promag 10P flow meter and the cable running from the orifice flow meter to the computer as seen in Figure 28a. For the second test an additional assortment of power cables were also running along the ground as seen in the right of Figure 28b. Also, there is a step up from the piping to where the table is as well as a draining ditch beneath the piping for the draining of excess water. All of these obstructions increase the possibility for someone to step onto them or to trip over them. This creates the possibility of self-injury or the damaging of equipment such as the very expensive Promag 10P.
The impact of this risk is high for any person using the setup, since the sharp edges around the area would cause severe injuries during a fall. Also, the impact is high for the equipment, since the damaging of equipment such as the Promag 10P would lead to repair or replacement costs of up to R25 000. Finally, the impact is low for people in close proximity of the setup, as this area is not accessed by other people. The probability of this risk occurring, however, is low, as all people using this setup is well informed of the risk involved and are constantly reminded to mind their step.
Safety procedures that were followed to mitigate and avoid this risk included to, at all times, wear closed shoes, to minimise the risk of slipping or of feet getting stuck. Clear notifications were always visible, to remind people to mind their step. Piping, cables and other equipment were placed in such a way as to minimise the risk of tripping and also allow ample room for movement.

60
Inadequate insulation of electrical equipment
For the test shown in Figure 28b, electrical cables are running along the ground and into a power strip, which is also on the ground and in close proximity of the solenoid valve installed into the piping system to control the flow of the water. Since the valve is installed using clamps and couplers there is a good chance that a leak may occur at this junction. This creates a risk of electrocution with water in close proximity of a power strip.
The impact of this risk is high for both the equipment as well as for the people using the setup. The risk is also considerable for people in close proximity if the rest of the floor gets flooded.
To mitigate this risk, the valve with its connection was placed inside the previously mentioned draining ditch during testing and buckets were placed underneath all other junctions. Also, the power strip was picked up from the ground and placed on top of the table. The necessary instructions were always followed when operating the circulating pump, ensuring that all valves are shut off completely before and after testing and knowing where the emergency shut off is. Also, in case of a large leak, the main power switch would first be switched off. Once again, closed shoes were always worn as an extra form of insulation.
Figure 28: a) Flow meter test setup. b) System test setup.
F.2. Electronics Laboratory
The electronic laboratory was used for the assembly and testing of the power meter, seen in Figure 29. Work on the power meter involved one primary risk:
Inadequate insulation of electrical equipment
This risk also involves inadequate insulation, but for different reasons than in the previous case. The power meter’s function is to measure the current and voltage of high voltage circuits and convert these measurements into power and energy readings. To accurately make these measurements, the wires of this high voltage
a) b)

61
circuit need to be exposed. This can be seen to the left of Figure 29, where extension cable is cut in half and stripped of its primary insulation in the middle with the live wire running through the current transformer. All three wires are reconnected at a connection point. However, this does not insulate these open wires, therefore creating a risk of electrocution when a person touches the live wire and neutral or ground while the circuit is on or when touching the live wire while also being grounded to a table or floor. The ensuing short circuit will cause currents of 10 A and more to be directed through the short circuit, i.e. the person, which can likely be fatal.
The impact of this risk is understandably very high for the person working with setup, but also high for the equipment that may be damaged by such a short circuit. The impact is considerably lower for anyone in close proximity, unless they are in contact with the person using the setup.
Extreme care was therefore taken when working with power meter. During assembly or any configuring of the circuit, all circuits were turned off at all times. The wires were connected in such a way as to cover any open parts within the connection, not exposing any of the conducting parts to possible touch or contact with other wires. Also, before testing, the voltage difference between the local ground and neutral was measured to assess the risk of connecting the neutral wire to any of the system circuit ground connections, to prevent damage to the circuits by the flow of loose currents between these connections. Closed shoes were again worn to insulate the person from the ground connection. While testing the power meter, care was taken to never touch the screws of the connectors or to even touch the circuit at all. To protect future users of this device, it is recommended that a protective cover be procured for the power meter, to prevent people from coming into contact with any exposed circuit.
Figure 29: Assembled power meter

62
APPENDIX G : ORIFICE FLOW RATE CALCULATOR
ASME MFC-14M-2001
ISO 5167-2 2003
Parameters
Parameters
Pipe Diameter (D1) 0.0220 m
Pipe Diameter (D1) 0.0220 m
Orifice Diameter (D2) 0.0125 m
Orifice Diameter (D2) 0.0125 m
Pressure Difference (ΔP) 108.51 Pa
Pressure Difference (ΔP) 108.51 Pa
Liquid Density (ρ) 1000 kg/m3
Liquid Density (ρ) 1000 kg/m
3
Liquid Viscosity (μ) 0.001 Pa·s
Liquid Viscosity (μ) 0.001 Pa·s
Results
Results
Flow Rate (Q) 0.00003933 m3/s
Flow Rate (Q) 0.00004019 m
3/s
2.360 l/min
2.411 l/min
Velocity (v) 0.10347 m/s
Velocity (v) 0.10572 m/s
Reynolds Number (Re) 2276.33545
Reynolds Number (Re) 2325.91664
Orifice Coefficient (C) 0.65116
Orifice Coefficient (C) 0.66535
Diameter Ratio (β) 0.56818
Diameter Ratio (β) 0.56818
Head Loss 0.00705 m
Head Loss 0.00698 m
Intermediate Calculations
Intermediate Calculations
Orifice Area (A2) 0.00012 m2
Orifice Area (A2) 0.00012 m
2
Pipe Area (A1) 0.00038 m2
Pipe Area (A1) 0.00038 m
2
Pipe Diameter 0.86614 in
Reynolds Number (guess value) 2325.91664
Orifice Diameter 0.49213 in
Static Pressure Loss (w) 68.36827 Pa
Reynolds Number (guess value) 2276.33545
Km 12.23324
Static Pressure Loss (w) 69.06845 Pa
A 3.41442
Km 12.90276
M'2 2.17684
Difference between Re guess and calculated: -3.15978E-06
Difference between Re guess and calculated: 3.12734E-07
(After you click the button, this value should be near to zero)
(After you click the button, this value should be near to zero)
http://excelcalculations.blogspot.com

63
APPENDIX H : FLOW METER TEST DATA
Required Test Flow Rate
(l/min)
EH Promag 10P Orifice Flow Meter
Flow Rate
Reading (l/min)
Volume Reading (litres)
Analogue Pin
Reading (0 to 1023)
Vout (V)
DP (Pa)
Instant. Flow Rate
Reading (l/min)
Filtered Flow Rate
(l/min)
Volume Reading (litres)
0 0 33 0.161 0.02 0.03 0
0 34 0.166 108.53 2.39 0
1 1.04 34 0.166 108.53 2.39 1.68
1.29 35 0.171 217.03 3.38 2.5
2 2.04 34 0.166 108.53 2.39 1.98
2.17 35 0.171 217.03 3.38 3.06
3 3.07 35 0.171 217.03 3.38 3.3
3.28 36 0.176 325.54 4.14 3.72
4 4.05 303328 36 0.176 325.54 4.14 4.11 3.3
4.27 303328 37 0.181 434.05 4.78 4.48 3.3
5 5.03 303339 37 0.181 434.05 4.78 4.7 14.26
5.22 303339 38 0.186 542.55 5.35 5.56 14.26
6 6.01 303350 38 0.186 542.55 5.35 5.75 25.41
6.18 303350 40 0.195 759.57 6.33 6.25 25.41
7 7.02 303368 40 0.195 759.57 6.33 6.87 44.33
7.2 303368 44 0.215 1193.59 7.93 7.2 44.33
8 8.03 303387 44 0.215 1193.59 7.93 7.87 62.03
8.18 303387 47 0.229 1519.12 8.95 8.33 62.03
9 9.05 303407 46 0.225 1410.61 8.62 8.94 82.14
9.22 303407 48 0.234 1627.62 9.26 9.25 82.14
10 10.08 303432 49 0.239 1736.13 9.57 9.94 107.14
10.26 303432 53 0.259 2170.16 10.70 10.23 107.14
15 15.06 303477 71 0.347 4123.28 14.74 14.7 150.93
15.25 303477 74 0.361 4448.80 15.32 14.98 150.93
20 20.01 303562 99 0.483 7161.48 19.43 19.63 234.76
20.2 303562 107 0.522 8029.53 20.58 19.97 234.76
…
65 65.01 304943 750 3.662 77799.50 64.05 63.91 1595.45
65.35 304943 790 3.857 82139.78 65.81 64.68 1595.45
70 70.01 305152 870 4.248 90820.33 69.20 68.96 1799.61
70.23 305152 910 4.443 95160.61 70.83 69.4 1799.61