house regions six and seven plan - …...denver 600158 logan 22709 4 house regions six and seven...
TRANSCRIPT

13
30
25
7933
121011
3622
3224
29
326531
383728
3527
4
39§̈¦70
§̈¦25 §̈¦76
§̈¦25§̈¦70
§̈¦76
£¤34
£¤24
£¤87£¤285
£¤36
£¤6
£¤85
£¤287
£¤40
£¤517
£¤100
£¤624 £¤74
£¤145
£¤34
£¤24
£¤85
£¤36
£¤287
£¤34
£¤24
Weld252825
Grand14843
Elbert23086
Park16206
Larimer299630
Eagle52197
Morgan28159
Adams441603
Jackson1394
El Paso622263
Douglas285465
Boulder294567
Lincoln5467
Routt23509
Jefferson534543
Arapahoe572003Summit
27994
Lake7310
Pitkin17148
Teller23350
Chaffee17809
Clear Creek9088
Gilpin5441
Gunnison15324
Denver600158
Logan22709
4
House Regions Six and Seven Plan - H6003v1/H7003v1
Map prepared by Reapportionment Commission Staff, July 15, 2011.
2011 Colorado Reapportionment Commission1313 Sherman StreetRoom 122Denver, Colorado 80203
13
1210
11
33
25 29 34
Erie
Longmont
Boulder
Broomfield
LafayetteLouisville
Coal Creek
Niwot
Eldora
GunbarrelLazy Acres
Allenspark
Westminster
Superior
Boulder
Altona
Gold Hill
Sugarloaf
Lyons
Boulder
Pine Brook HillSunshine
Crisman
Nederland
Eldorado Springs
Glendale
Rollinsville
Berthoud
Ward
Paragon Estates
Mountain Meadows
St. Ann Highlands
Bark Ranch Frederick
Mead
Jamestown
Tall Timber
Hidden Lake
ValmontSeven HillsLeyner
Mead
Firestone
Frederick
Bonanza Mountain Estates
£¤287
Boulder294567
Grand14843
Larimer299630
Gilpin5441
Weld252825
Jefferson534543
Broomfield55889
¬«72
¬«7
¬«119
¬«66
¬«52
¬«170
¬«128
¬«42¬«470
¬«157
¬«7
4
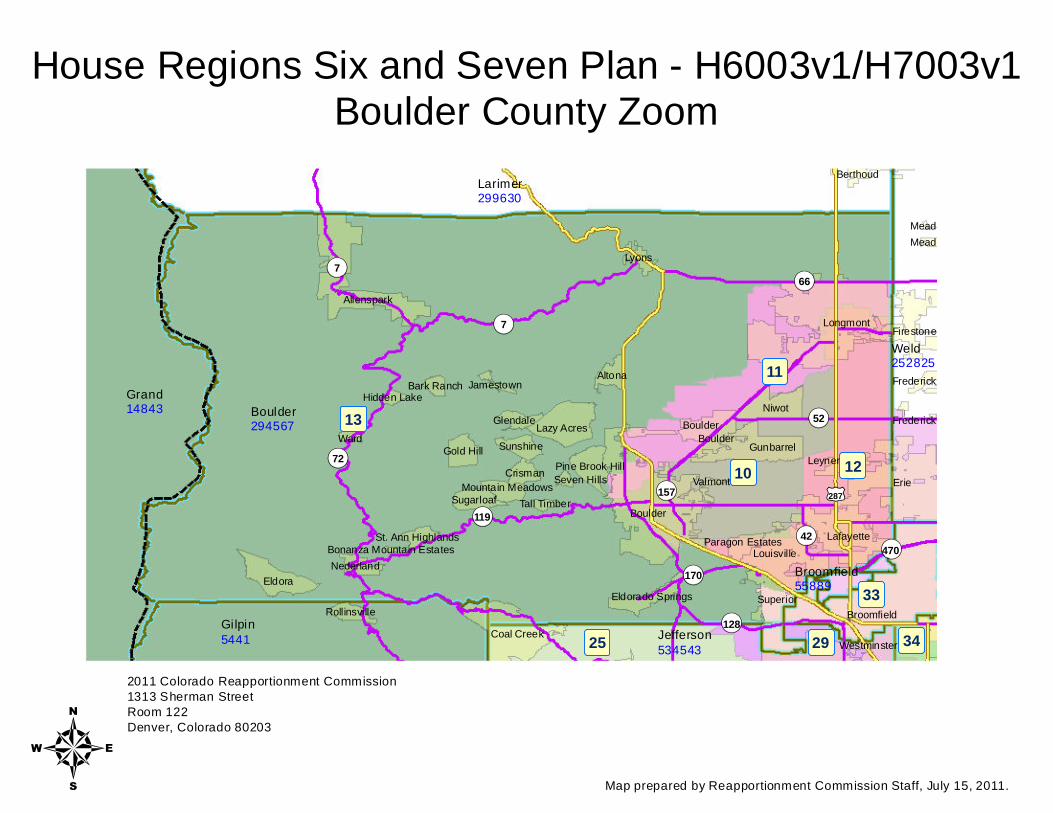
House Regions Six and Seven Plan - H6003v1/H7003v1Boulder County Zoom
Map prepared by Reapportionment Commission Staff, July 15, 2011.
2011 Colorado Reapportionment Commission1313 Sherman StreetRoom 122Denver, Colorado 80203
30
7
9
33
32
31
35
5
34
8
12
29
4
27
24 6
DenverAurora
Thornton
Erie
BrightonBroomfield
Commerce City
Westminster
Arvada
Todd Creek
Welby
Northglenn
Berkley
Lochbuie
Dacono
Lafayette
North Washington
Wheat Ridge
Sherrelwood Derby
Twin Lakes
Federal Heights
Watkins
Northglenn
Lakewood
Derby
Fort Lupton
Shaw Heights
Fort Lupton
Lakeside
Hudson
Mountain View
§̈¦76
§̈¦25
§̈¦70§̈¦270
§̈¦225§̈¦70
£¤36
£¤6
£¤85
£¤87
£¤287
£¤85
Adams441603
Weld252825
Denver600158
Broomfield55889
Jefferson534543
Boulder294567
Boulder294567
¬«470
¬«7
¬«2
¬«128
¬«95
¬«33
¬«51
¬«265
¬«22
¬«35
¬«224
¬«32
¬«470
4
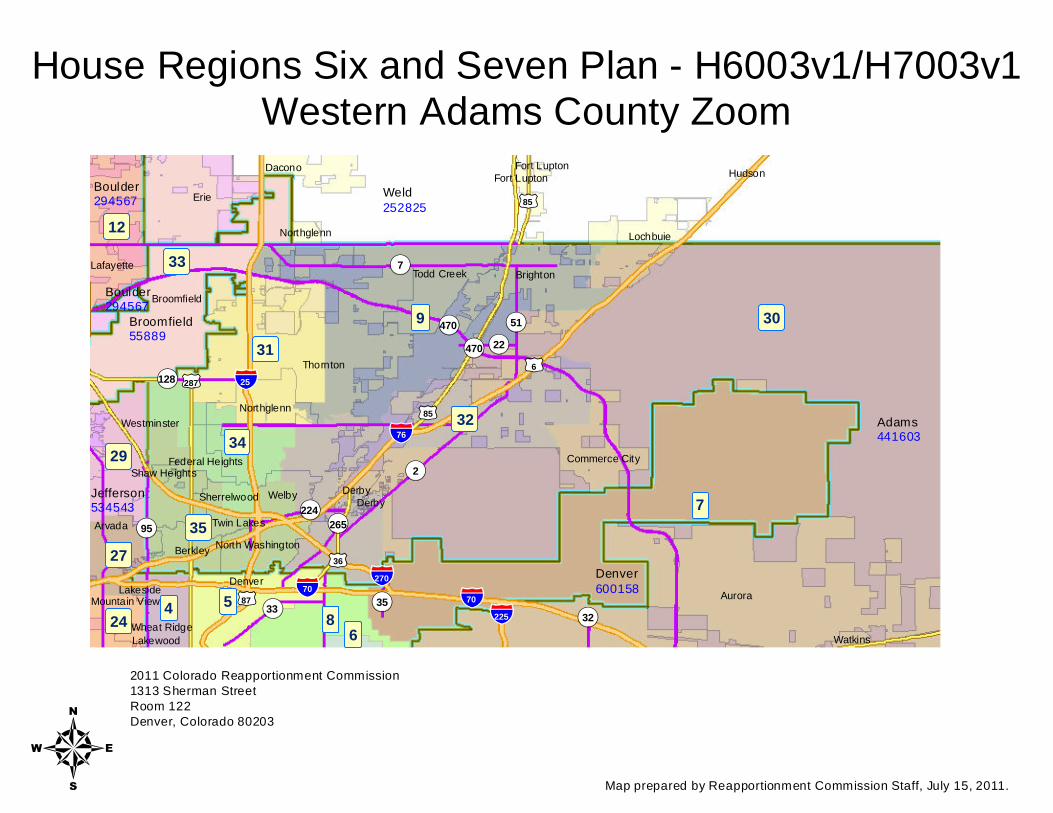
House Regions Six and Seven Plan - H6003v1/H7003v1Western Adams County Zoom
Map prepared by Reapportionment Commission Staff, July 15, 2011.
2011 Colorado Reapportionment Commission1313 Sherman StreetRoom 122Denver, Colorado 80203
13
25
30
7
36
22
24
29
26
5
38
23
3728
35
6
32
31
9
278
33
4
31
2
39
34
4142
DenverAurora
Watkins
Black Forest
Arvada
Lakewood
Parker
Aurora
Castle Rock
Thornton
Westminster
Centennial
Commerce City
Littleton
Broomfield
Highlands Ranch
Winter Park
Golden
Evergreen
Keystone
Lone Tree
Ken Caryl
The Pinery
Ponderosa Park
Coal Creek
Perry Park
Wheat Ridge
Genesee
Dakota Ridge
Columbine
Welby
Fairmount
Floyd Hill
Roxborough Park
Fraser
Indian Hills
Applewood
Woodmoor
Castle Pines
Dove Valley
North Washington
Brick Center
Franktown
Castle Pines North
SheridanMorrison
Palmer Lake
Castle Rock
Aspen Park
Brighton
Central City
KittredgeUpper Bear Creek
Castle Pines North
Stonegate
Derby
Louviers
Sedalia
Inverness
Black Hawk
Foxfield
Larkspur
St. Mary's
Elizabeth
Rollinsville
Cherry Creek
Westcreek
Idaho Springs
Kiowa
Eldorado Springs
Georgetown
Elbert
BennettWest Pleasant View
Glendale
Empire Downieville-Lawson-Dumont
Silver Plume
Larkspur
Aetna Estates §̈¦70
£¤285
£¤6
£¤285
Park16206
Douglas285465
Jefferson534543
Elbert23086
Adams441603
Arapahoe572003
Clear Creek9088
Gilpin5441
Grand14843
Summit27994
Denver600158
El Paso622263
¬«103 ¬«121
¬«72
¬«470
¬«5
¬«119
¬«86
¬«93
¬«67
¬«30
¬«88
¬«105
¬«128
¬«67
4
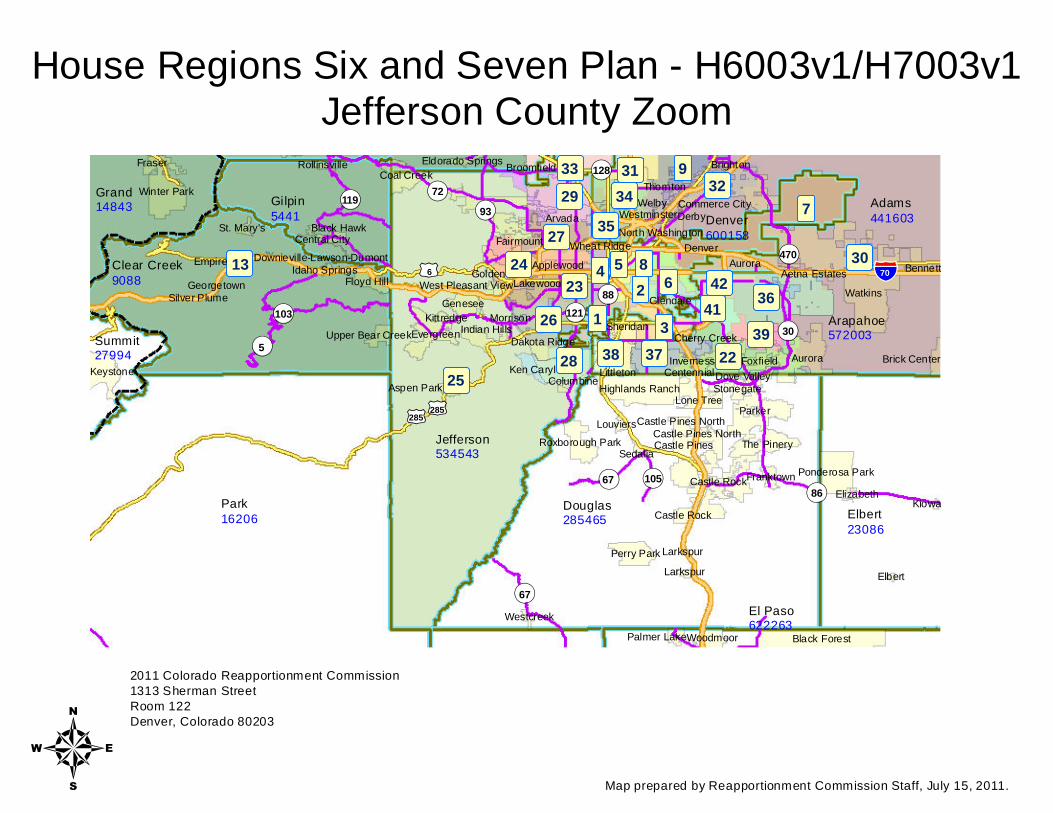
House Regions Six and Seven Plan - H6003v1/H7003v1Jefferson County Zoom
Map prepared by Reapportionment Commission Staff, July 15, 2011.
2011 Colorado Reapportionment Commission1313 Sherman StreetRoom 122Denver, Colorado 80203
30
7
36
32
9
29
3
33
5
26 1
3527
23
24
6
31
8
2238
4
37
2
39
34
41
42
2825
1312
Denver
AuroraLakewood
Arvada
Thornton
Watkins
WestminsterCommerce City
Broomfield
AuroraLittleton
Wheat Ridge
Dakota Ridge
Welby
Northglenn
BerkleyFairmount
Centennial
Englewood
BrightonSuperior
CentennialGreenwood Village
Applewood
Cherry Hills Village
North Washington
Sheridan
Columbine
Louisville
Sherrelwood Derby
Todd Creek
Twin Lakes
CentennialCherry Creek
Brighton
Federal Heights
Ken Caryl
Bow Mar
Derby
Edgewater
Brighton
Glendale
Morrison
Shaw Heights
Holly Hills
West Pleasant View
LakesideGolden
Ken Caryl Foxfield
Lafayette
GoldenAetna Estates
Mountain View §̈¦70
§̈¦25
§̈¦270
§̈¦225
§̈¦70 £¤36
£¤6£¤85
£¤87
£¤40
£¤287
£¤285
Adams441603
Arapahoe572003
Denver600158
Jefferson534543
Broomfield55889
Boulder294567
¬«470
¬«121
¬«2
¬«30¬«88
¬«95
¬«128
¬«44
¬«72
¬«33
¬«83¬«26
¬«177
¬«51
¬«265
¬«22
¬«35¬«32
¬«470
4
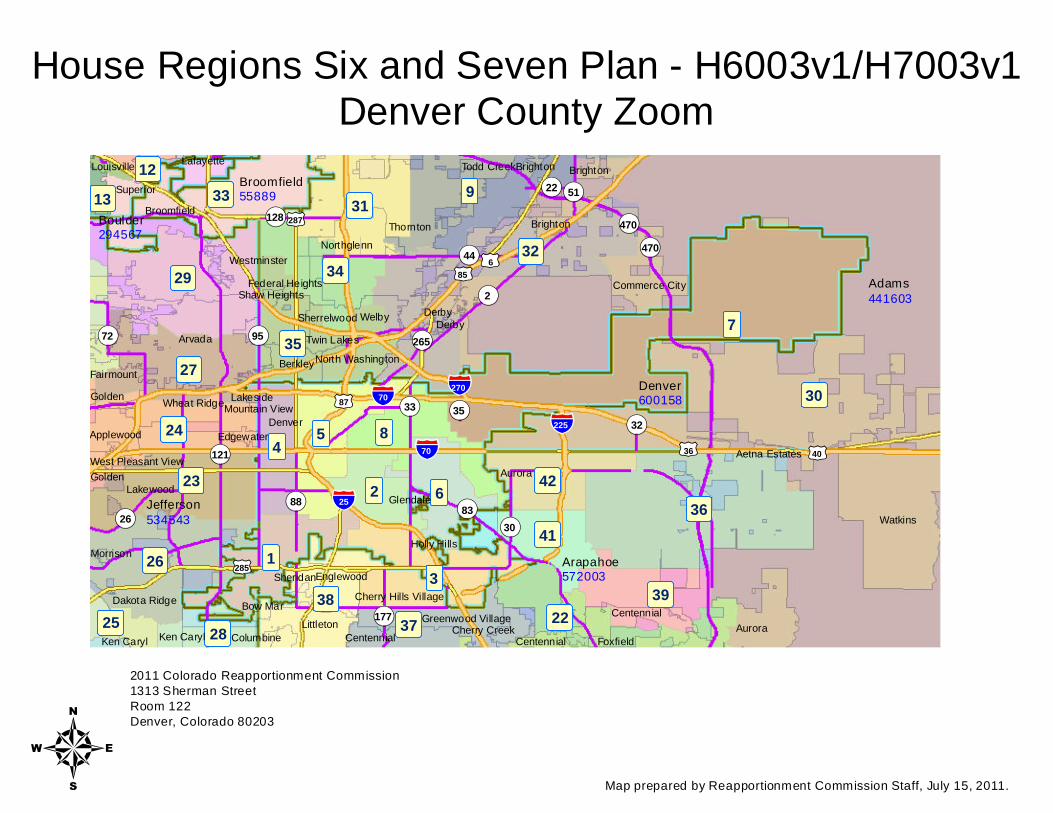
House Regions Six and Seven Plan - H6003v1/H7003v1Denver County Zoom
Map prepared by Reapportionment Commission Staff, July 15, 2011.
2011 Colorado Reapportionment Commission1313 Sherman StreetRoom 122Denver, Colorado 80203
25
730
36
22
32
24
29
913
326
5
33
38
1
23
3728
3527
6
8
31
4
2
39
34
41
42
12
Denver
Aurora
Arvada
Lakewood
Thornton
Aurora
Westminster
Centennial
Broomfield
Littleton
Golden
Ken Caryl
Evergreen
Wheat Ridge
Genesee
Welby
Fairmount
Northglenn
Berkley
Greenwood Village
Highlands RanchDove Valley
Commerce City
Dakota Ridge
Columbine
Englewood
BrightonSuperior
Indian Hills
Applewood
Cherry Hills Village
North Washington
SheridanMorrison
Parker
Kittredge
Sherrelwood Derby
Inverness Foxfield
LouisvilleEldorado Springs
Todd Creek
Twin Lakes
Cherry Creek
Brighton
Federal Heights
Lone Tree
Bow Mar
Golden
Derby
West Pleasant ViewEdgewater
Glendale
Columbine Valley
Brighton
Shaw Heights
Holly Hills
Coal Creek
Idledale
Lakeside
Aspen Park
Aetna Estates
Mountain View
West Pleasant View
§̈¦70§̈¦25 §̈¦270
§̈¦225
§̈¦70
§̈¦25
£¤36
£¤6
£¤285
£¤85
£¤87
£¤40
£¤287
£¤85
Jefferson534543
Adams441603
Arapahoe572003
Denver600158
Adams441603
Boulder294567
Broomfield55889
Elbert23086
¬«470
¬«72
¬«74
¬«93
¬«2
¬«30
¬«8 ¬«88¬«26
¬«83
¬«95
¬«128
¬«44
¬«51¬«22
¬«35¬«32
¬«75
¬«470
4
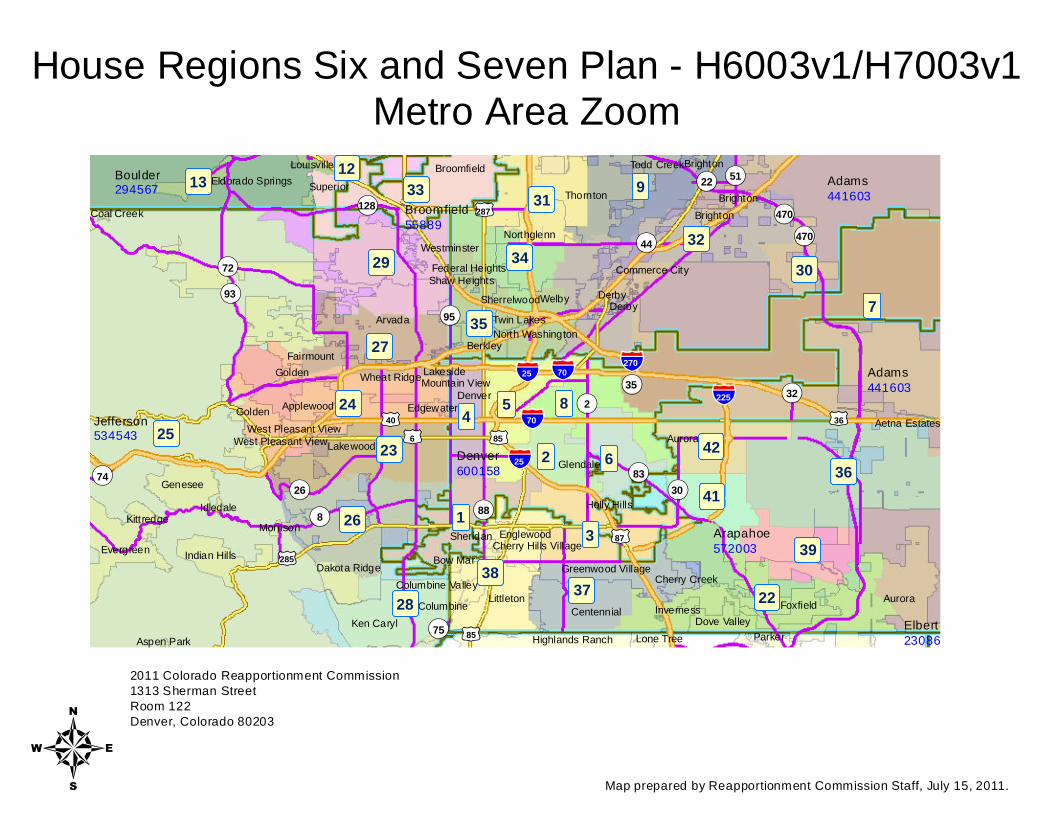
House Regions Six and Seven Plan - H6003v1/H7003v1Metro Area Zoom
Map prepared by Reapportionment Commission Staff, July 15, 2011.
2011 Colorado Reapportionment Commission1313 Sherman StreetRoom 122Denver, Colorado 80203
30
7
36
22
3
5
3837
1
6
84
35
2
39
41
42
32
28
23
27
24
26
25
29 34
AuroraDenver
Aurora
Watkins
CentennialLittleton
Highlands Ranch
Lakewood
Arvada
Columbine
Commerce City
Englewood
Berkley
Greenwood Village
Cherry Hills Village
Dove Valley
Sheridan
WelbyWestminster
ParkerLone Tree
North Washington
Wheat Ridge
Stonegate
InvernessFoxfield
Twin Lakes
Cherry CreekBow Mar
Meridian
Ken Caryl
Edgewater
Glendale
Columbine Valley
Holly Hills
Acres Green
Derby
Grand View Estates
Derby
Meridian
Lakeside
Aetna Estates
§̈¦70
§̈¦25
§̈¦225
§̈¦70 £¤36
£¤87
£¤85
£¤40
£¤6£¤287
£¤285 Arapahoe572003
Denver600158
Adams441603
Douglas285465
Adams441603
Elbert23086
Jefferson534543
Jefferson534543
¬«470
¬«30¬«83¬«88
¬«2
¬«95
¬«177
¬«33¬«265
¬«35
¬«32
¬«470
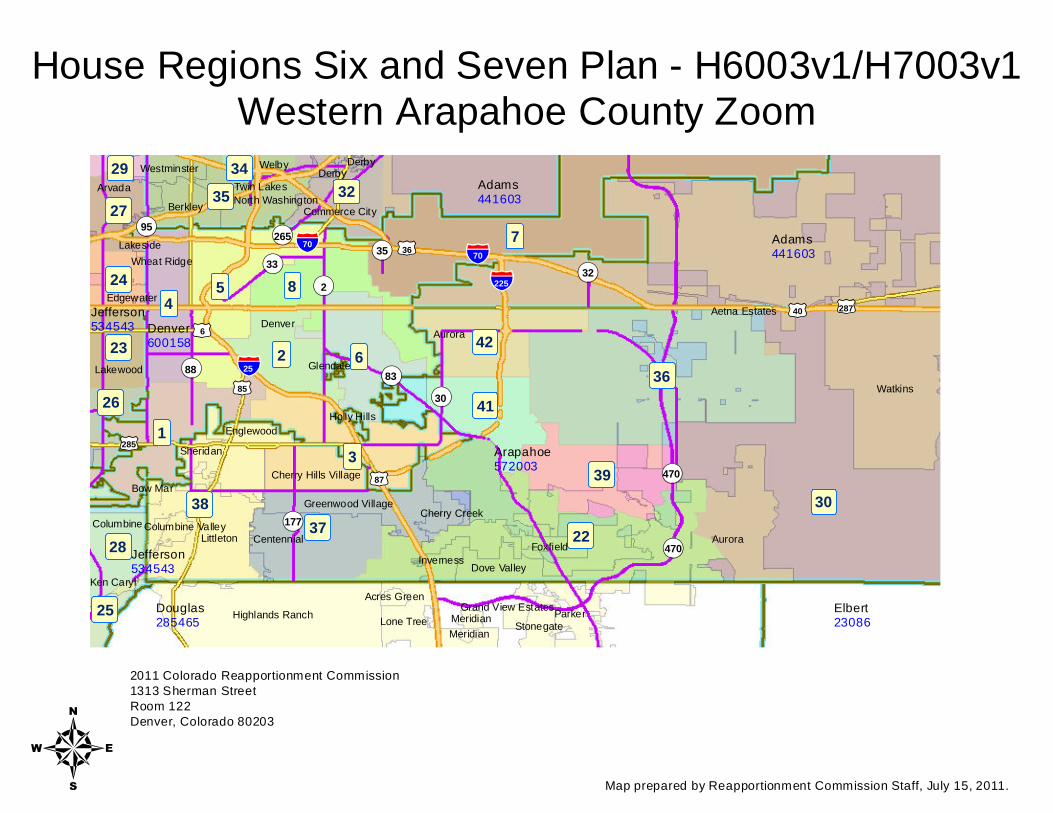
4
House Regions Six and Seven Plan - H6003v1/H7003v1Western Arapahoe County Zoom
Map prepared by Reapportionment Commission Staff, July 15, 2011.
2011 Colorado Reapportionment Commission1313 Sherman StreetRoom 122Denver, Colorado 80203
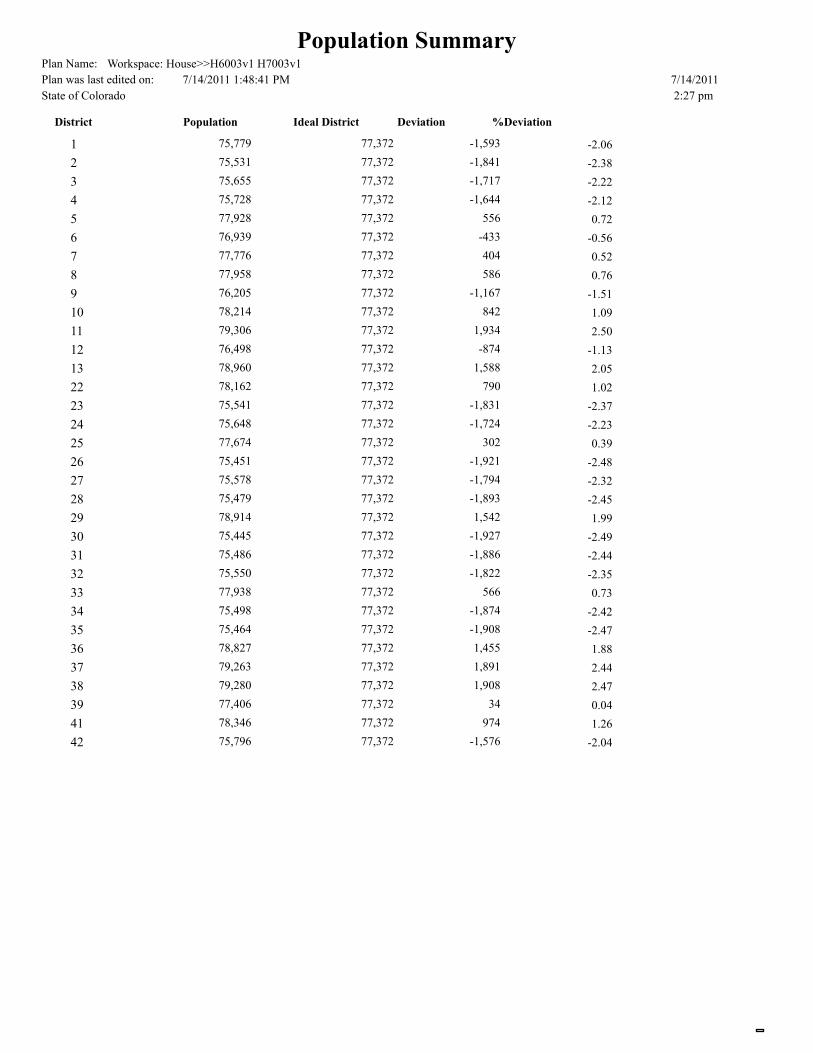
Population SummaryPlan Name: Workspace: House>>H6003v1 H7003v1
7/14/2011
2:27 pm
Plan was last edited on: 7/14/2011 1:48:41 PM
State of Colorado
District Population Ideal District Deviation %Deviation
75,7791 77,372 -1,593 -2.06
75,5312 77,372 -1,841 -2.38
75,6553 77,372 -1,717 -2.22
75,7284 77,372 -1,644 -2.12
77,9285 77,372 556 0.72
76,9396 77,372 -433 -0.56
77,7767 77,372 404 0.52
77,9588 77,372 586 0.76
76,2059 77,372 -1,167 -1.51
78,21410 77,372 842 1.09
79,30611 77,372 1,934 2.50
76,49812 77,372 -874 -1.13
78,96013 77,372 1,588 2.05
78,16222 77,372 790 1.02
75,54123 77,372 -1,831 -2.37
75,64824 77,372 -1,724 -2.23
77,67425 77,372 302 0.39
75,45126 77,372 -1,921 -2.48
75,57827 77,372 -1,794 -2.32
75,47928 77,372 -1,893 -2.45
78,91429 77,372 1,542 1.99
75,44530 77,372 -1,927 -2.49
75,48631 77,372 -1,886 -2.44
75,55032 77,372 -1,822 -2.35
77,93833 77,372 566 0.73
75,49834 77,372 -1,874 -2.42
75,46435 77,372 -1,908 -2.47
78,82736 77,372 1,455 1.88
79,26337 77,372 1,891 2.44
79,28038 77,372 1,908 2.47
77,40639 77,372 34 0.04
78,34641 77,372 974 1.26
75,79642 77,372 -1,576 -2.04
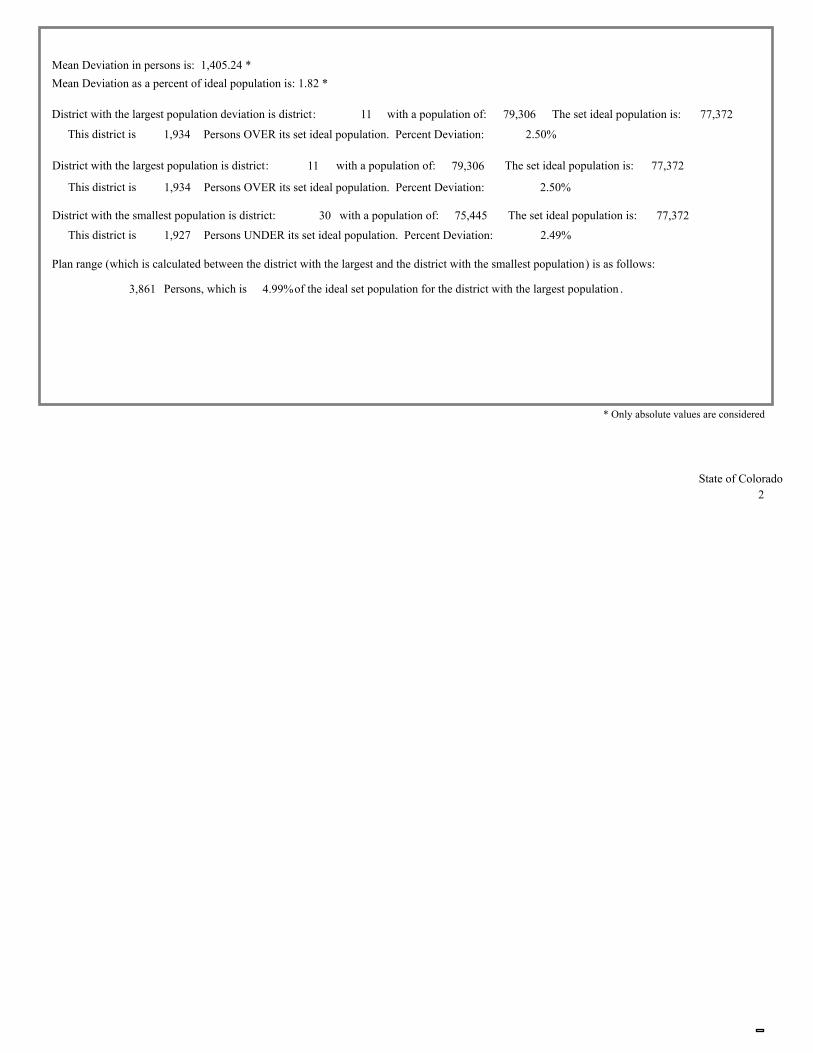
District with the largest population is district: with a population of: 79,306
District with the smallest population is district: with a population of: 75,445 30
11 77,372
77,372
11 79,306 77,372District with the largest population deviation is district: with a population of:
The set ideal population is:
The set ideal population is:
The set ideal population is:
1,934This district is Persons OVER its set ideal population. Percent Deviation: 2.50%
This district is 1,927 Persons UNDER its set ideal population. Percent Deviation: 2.49%
This district is 1,934 Persons OVER its set ideal population. Percent Deviation: 2.50%
Plan range (which is calculated between the district with the largest and the district with the smallest population) is as follows:
3,861 Persons, which is of the ideal set population for the district with the largest population . 4.99%
Mean Deviation in persons is: 1,405.24 *
Mean Deviation as a percent of ideal population is: 1.82 *
* Only absolute values are considered
2
State of Colorado
Thursday, July 14, 2011
Plan Last Edited on:
Plan Name:
2:26 pm
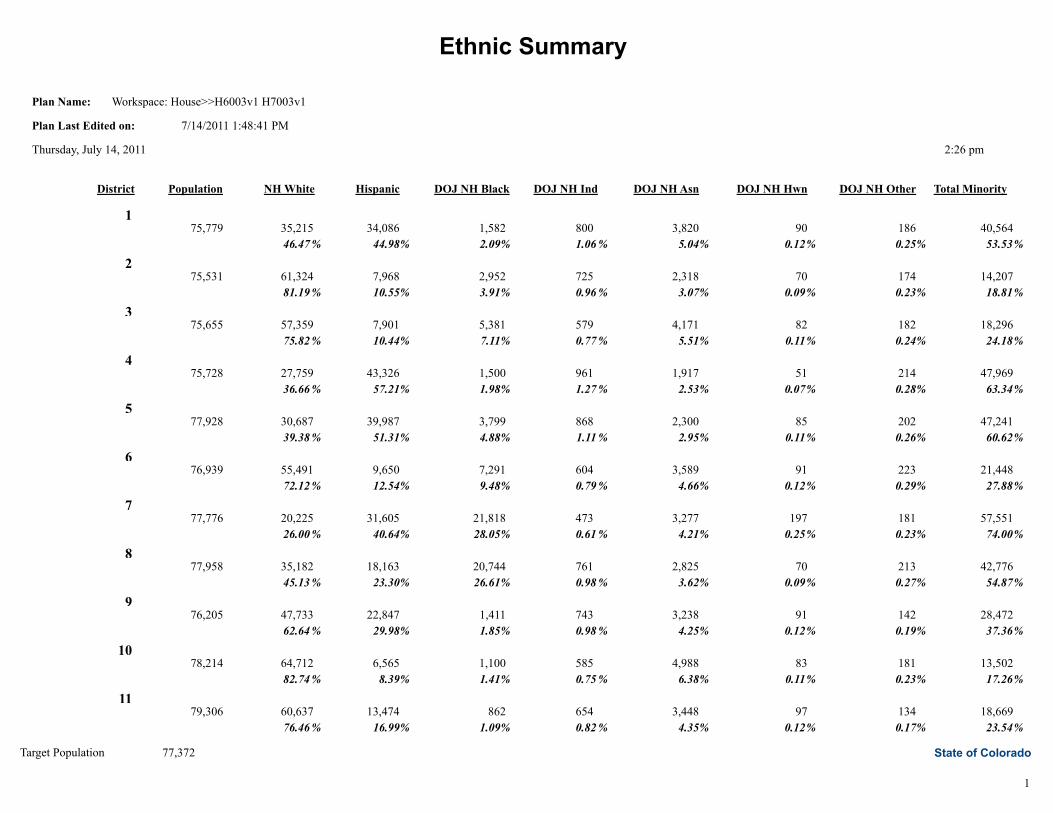
Ethnic Summary
Workspace: House>>H6003v1 H7003v1
7/14/2011 1:48:41 PM
District Population HispanicNH White DOJ NH Black DOJ NH Ind DOJ NH Asn DOJ NH Hwn DOJ NH Other Total Minority
1 75,779 35,215 34,086 1,582 800 3,820 90 186
46.47 44.98 2.09 1.06 5.04 0.25 0.12
40,564
53.53% % % % % % % %
2 75,531 61,324 7,968 2,952 725 2,318 70 174
81.19 10.55 3.91 0.96 3.07 0.23 0.09
14,207
18.81% % % % % % % %
3 75,655 57,359 7,901 5,381 579 4,171 82 182
75.82 10.44 7.11 0.77 5.51 0.24 0.11
18,296
24.18% % % % % % % %
4 75,728 27,759 43,326 1,500 961 1,917 51 214
36.66 57.21 1.98 1.27 2.53 0.28 0.07
47,969
63.34% % % % % % % %
5 77,928 30,687 39,987 3,799 868 2,300 85 202
39.38 51.31 4.88 1.11 2.95 0.26 0.11
47,241
60.62% % % % % % % %
6 76,939 55,491 9,650 7,291 604 3,589 91 223
72.12 12.54 9.48 0.79 4.66 0.29 0.12
21,448
27.88% % % % % % % %
7 77,776 20,225 31,605 21,818 473 3,277 197 181
26.00 40.64 28.05 0.61 4.21 0.23 0.25
57,551
74.00% % % % % % % %
8 77,958 35,182 18,163 20,744 761 2,825 70 213
45.13 23.30 26.61 0.98 3.62 0.27 0.09
42,776
54.87% % % % % % % %
9 76,205 47,733 22,847 1,411 743 3,238 91 142
62.64 29.98 1.85 0.98 4.25 0.19 0.12
28,472
37.36% % % % % % % %
10 78,214 64,712 6,565 1,100 585 4,988 83 181
82.74 8.39 1.41 0.75 6.38 0.23 0.11
13,502
17.26% % % % % % % %
11 79,306 60,637 13,474 862 654 3,448 97 134
76.46 16.99 1.09 0.82 4.35 0.17 0.12
18,669
23.54% % % % % % % %
1
State of Colorado 77,372Target Population
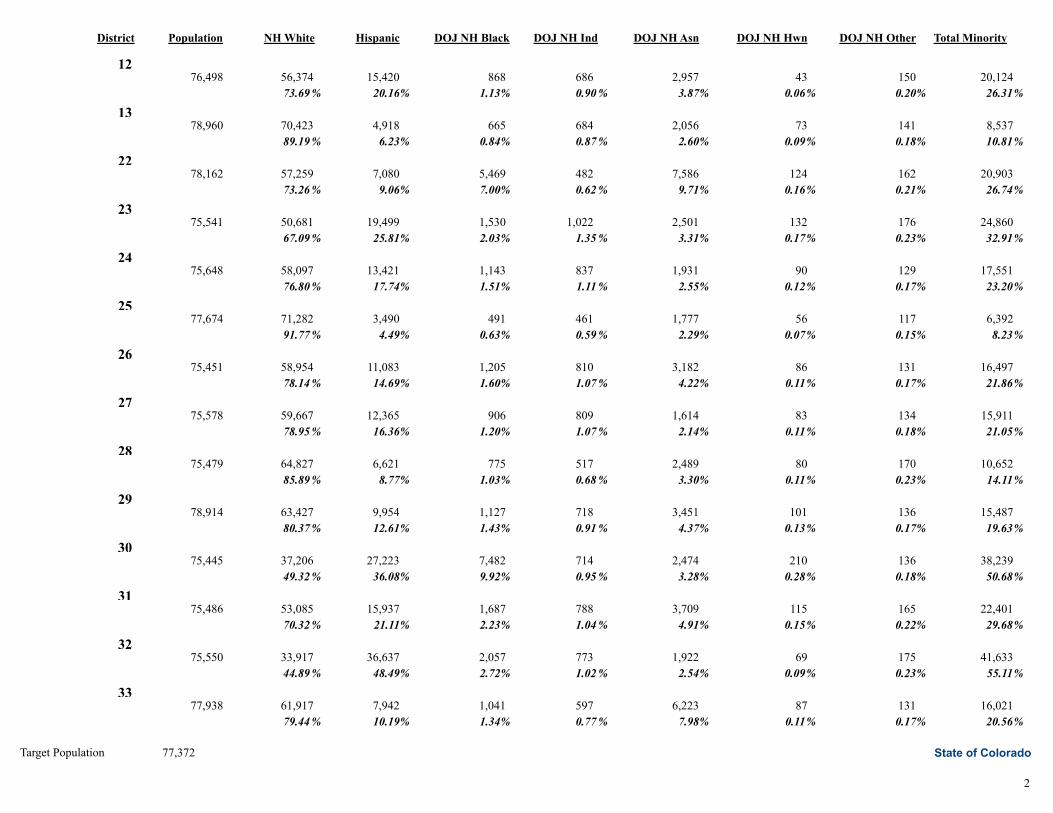
District Population HispanicNH White DOJ NH Black DOJ NH Ind DOJ NH Asn DOJ NH Hwn DOJ NH Other Total Minority
12 76,498 56,374 15,420 868 686 2,957 43 150
73.69 20.16 1.13 0.90 3.87 0.20 0.06
20,124
26.31% % % % % % % %
13 78,960 70,423 4,918 665 684 2,056 73 141
89.19 6.23 0.84 0.87 2.60 0.18 0.09
8,537
10.81% % % % % % % %
22 78,162 57,259 7,080 5,469 482 7,586 124 162
73.26 9.06 7.00 0.62 9.71 0.21 0.16
20,903
26.74% % % % % % % %
23 75,541 50,681 19,499 1,530 1,022 2,501 132 176
67.09 25.81 2.03 1.35 3.31 0.23 0.17
24,860
32.91% % % % % % % %
24 75,648 58,097 13,421 1,143 837 1,931 90 129
76.80 17.74 1.51 1.11 2.55 0.17 0.12
17,551
23.20% % % % % % % %
25 77,674 71,282 3,490 491 461 1,777 56 117
91.77 4.49 0.63 0.59 2.29 0.15 0.07
6,392
8.23% % % % % % % %
26 75,451 58,954 11,083 1,205 810 3,182 86 131
78.14 14.69 1.60 1.07 4.22 0.17 0.11
16,497
21.86% % % % % % % %
27 75,578 59,667 12,365 906 809 1,614 83 134
78.95 16.36 1.20 1.07 2.14 0.18 0.11
15,911
21.05% % % % % % % %
28 75,479 64,827 6,621 775 517 2,489 80 170
85.89 8.77 1.03 0.68 3.30 0.23 0.11
10,652
14.11% % % % % % % %
29 78,914 63,427 9,954 1,127 718 3,451 101 136
80.37 12.61 1.43 0.91 4.37 0.17 0.13
15,487
19.63% % % % % % % %
30 75,445 37,206 27,223 7,482 714 2,474 210 136
49.32 36.08 9.92 0.95 3.28 0.18 0.28
38,239
50.68% % % % % % % %
31 75,486 53,085 15,937 1,687 788 3,709 115 165
70.32 21.11 2.23 1.04 4.91 0.22 0.15
22,401
29.68% % % % % % % %
32 75,550 33,917 36,637 2,057 773 1,922 69 175
44.89 48.49 2.72 1.02 2.54 0.23 0.09
41,633
55.11% % % % % % % %
33 77,938 61,917 7,942 1,041 597 6,223 87 131
79.44 10.19 1.34 0.77 7.98 0.17 0.11
16,021
20.56% % % % % % % %
2
State of Colorado 77,372Target Population
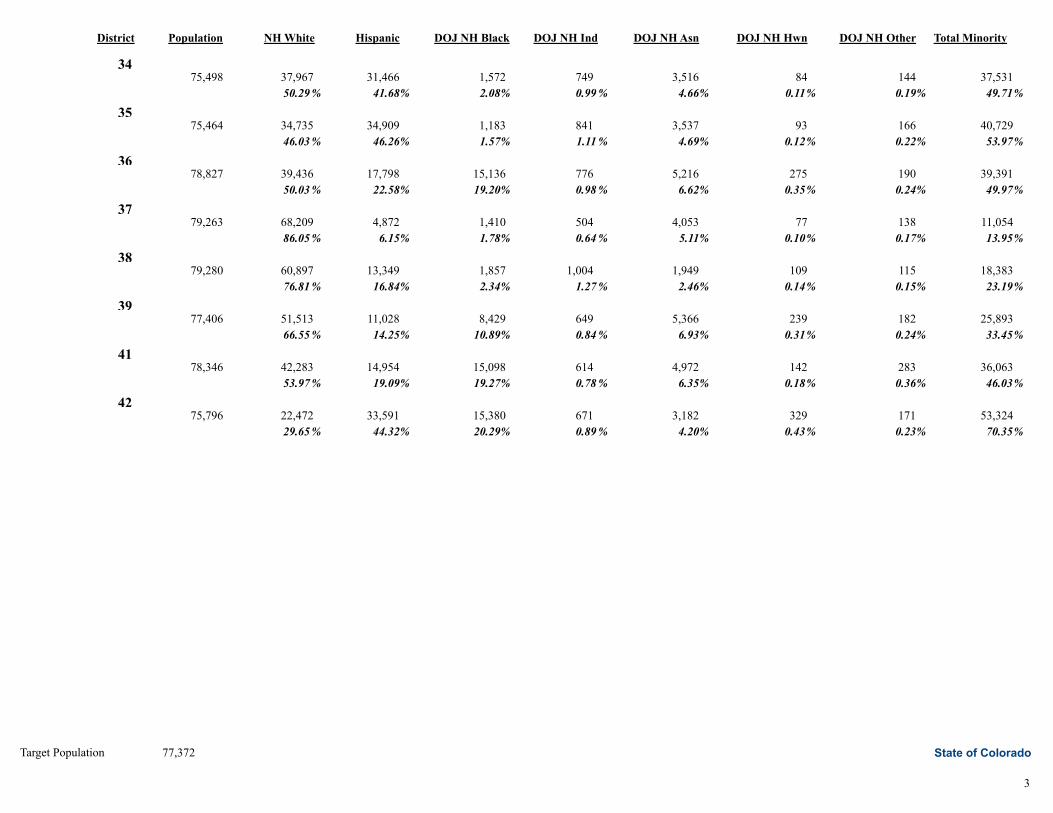
District Population HispanicNH White DOJ NH Black DOJ NH Ind DOJ NH Asn DOJ NH Hwn DOJ NH Other Total Minority
34 75,498 37,967 31,466 1,572 749 3,516 84 144
50.29 41.68 2.08 0.99 4.66 0.19 0.11
37,531
49.71% % % % % % % %
35 75,464 34,735 34,909 1,183 841 3,537 93 166
46.03 46.26 1.57 1.11 4.69 0.22 0.12
40,729
53.97% % % % % % % %
36 78,827 39,436 17,798 15,136 776 5,216 275 190
50.03 22.58 19.20 0.98 6.62 0.24 0.35
39,391
49.97% % % % % % % %
37 79,263 68,209 4,872 1,410 504 4,053 77 138
86.05 6.15 1.78 0.64 5.11 0.17 0.10
11,054
13.95% % % % % % % %
38 79,280 60,897 13,349 1,857 1,004 1,949 109 115
76.81 16.84 2.34 1.27 2.46 0.15 0.14
18,383
23.19% % % % % % % %
39 77,406 51,513 11,028 8,429 649 5,366 239 182
66.55 14.25 10.89 0.84 6.93 0.24 0.31
25,893
33.45% % % % % % % %
41 78,346 42,283 14,954 15,098 614 4,972 142 283
53.97 19.09 19.27 0.78 6.35 0.36 0.18
36,063
46.03% % % % % % % %
42 75,796 22,472 33,591 15,380 671 3,182 329 171
29.65 44.32 20.29 0.89 4.20 0.23 0.43
53,324
70.35% % % % % % % %
3
State of Colorado 77,372Target Population
7/14/2011
7/14/2011 1:48:41 PMPlan Last Edited on:
Workspace: House>>H6003v1 H7003v1Plan Name:
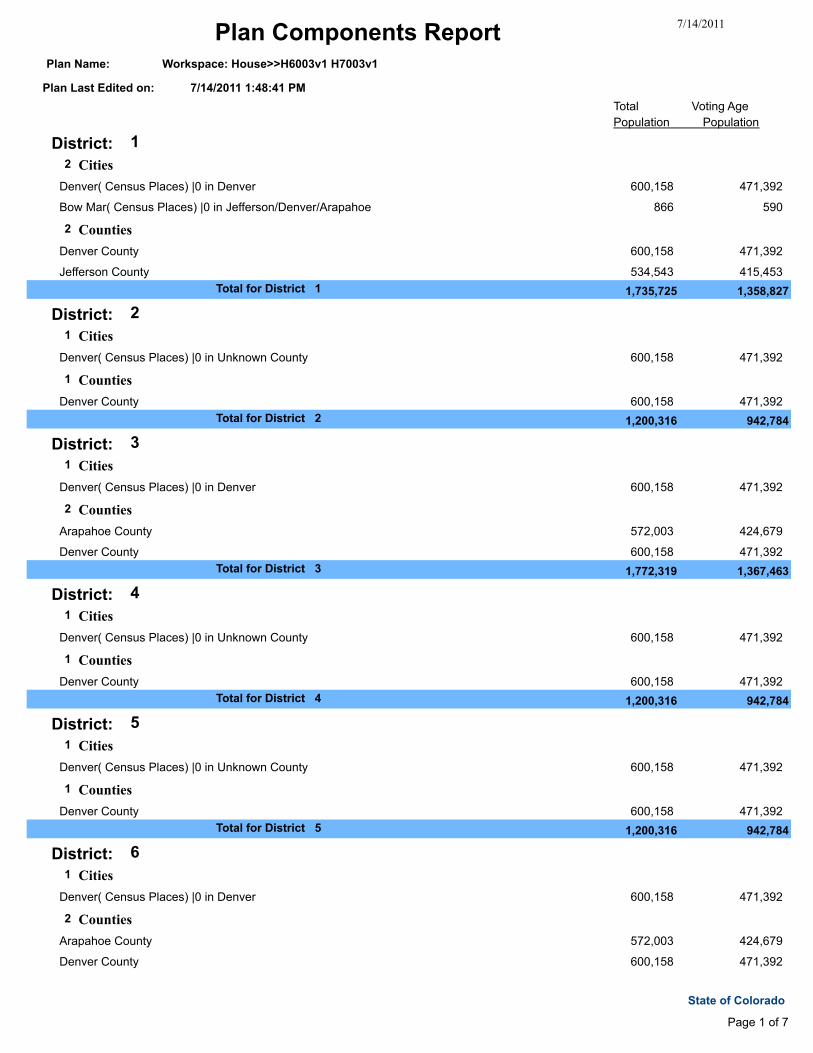
Plan Components Report
Total Voting Age
Population Population
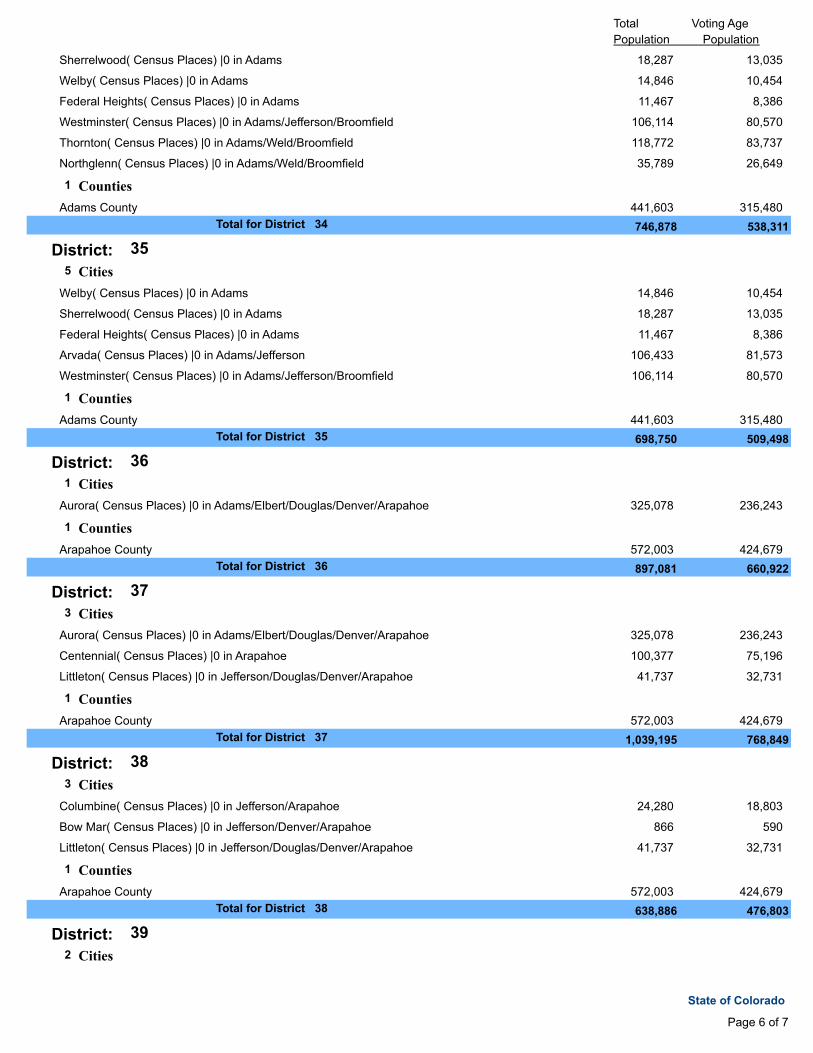
1District: 2 Cities
600,158 471,392Denver( Census Places) |0 in Denver
866 590Bow Mar( Census Places) |0 in Jefferson/Denver/Arapahoe
2 Counties
600,158 471,392Denver County
534,543 415,453Jefferson County
1,735,725 1,358,8271Total for District
2District: 1 Cities
600,158 471,392Denver( Census Places) |0 in Unknown County
1 Counties
600,158 471,392Denver County
1,200,316 942,7842Total for District
3District: 1 Cities
600,158 471,392Denver( Census Places) |0 in Denver
2 Counties
572,003 424,679Arapahoe County
600,158 471,392Denver County
1,772,319 1,367,4633Total for District
4District: 1 Cities
600,158 471,392Denver( Census Places) |0 in Unknown County
1 Counties
600,158 471,392Denver County
1,200,316 942,7844Total for District
5District: 1 Cities
600,158 471,392Denver( Census Places) |0 in Unknown County
1 Counties
600,158 471,392Denver County
1,200,316 942,7845Total for District
6District: 1 Cities
600,158 471,392Denver( Census Places) |0 in Denver
2 Counties
572,003 424,679Arapahoe County
600,158 471,392Denver County
Page 1 of 7
State of Colorado
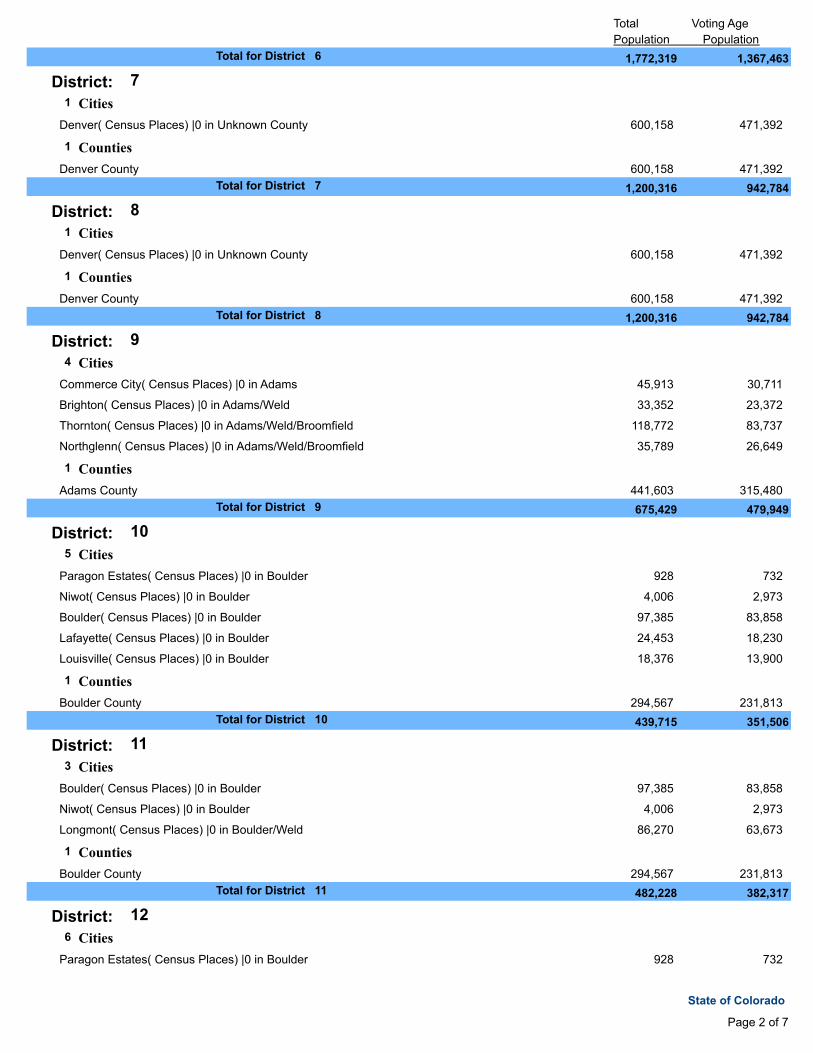
Total Voting Age
Population Population
1,772,319 1,367,4636Total for District
7District: 1 Cities
600,158 471,392Denver( Census Places) |0 in Unknown County
1 Counties
600,158 471,392Denver County
1,200,316 942,7847Total for District
8District: 1 Cities
600,158 471,392Denver( Census Places) |0 in Unknown County
1 Counties
600,158 471,392Denver County
1,200,316 942,7848Total for District
9District: 4 Cities
45,913 30,711Commerce City( Census Places) |0 in Adams
33,352 23,372Brighton( Census Places) |0 in Adams/Weld
118,772 83,737Thornton( Census Places) |0 in Adams/Weld/Broomfield
35,789 26,649Northglenn( Census Places) |0 in Adams/Weld/Broomfield
1 Counties
441,603 315,480Adams County
675,429 479,9499Total for District
10District: 5 Cities
928 732Paragon Estates( Census Places) |0 in Boulder
4,006 2,973Niwot( Census Places) |0 in Boulder
97,385 83,858Boulder( Census Places) |0 in Boulder
24,453 18,230Lafayette( Census Places) |0 in Boulder
18,376 13,900Louisville( Census Places) |0 in Boulder
1 Counties
294,567 231,813Boulder County
439,715 351,50610Total for District
11District: 3 Cities
97,385 83,858Boulder( Census Places) |0 in Boulder
4,006 2,973Niwot( Census Places) |0 in Boulder
86,270 63,673Longmont( Census Places) |0 in Boulder/Weld
1 Counties
294,567 231,813Boulder County
482,228 382,31711Total for District
12District: 6 Cities
928 732Paragon Estates( Census Places) |0 in Boulder
Page 2 of 7
State of Colorado
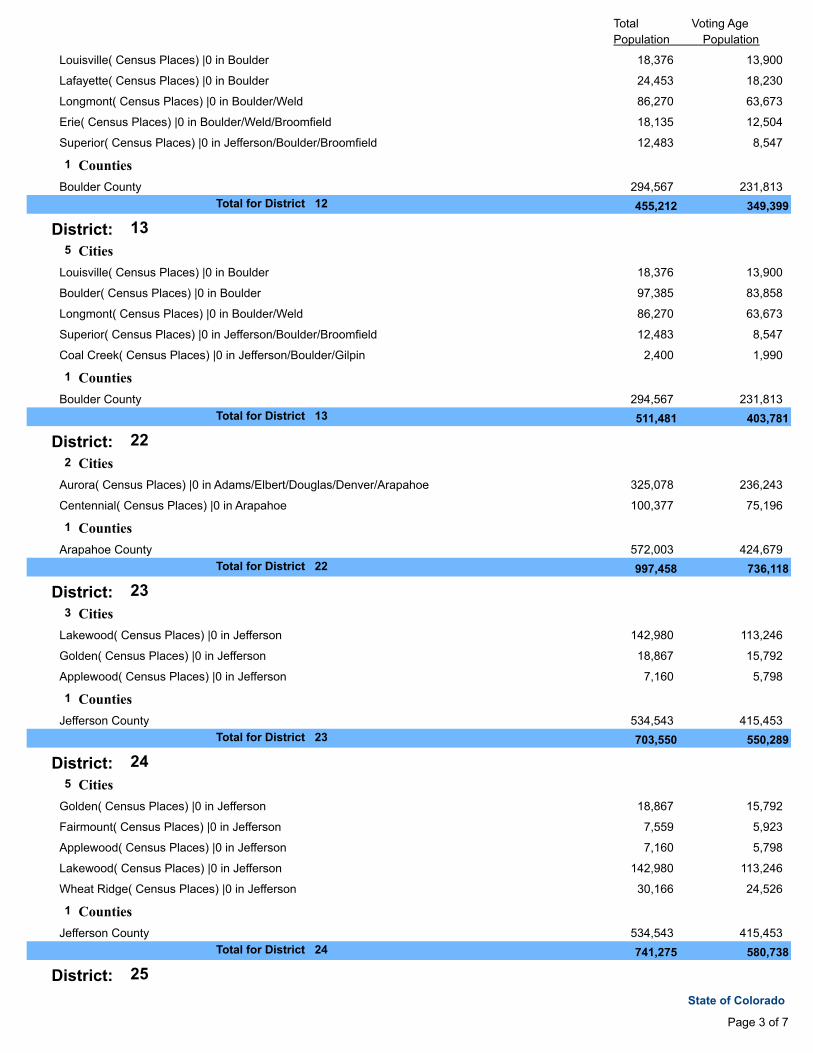
Total Voting Age
Population Population
18,376 13,900Louisville( Census Places) |0 in Boulder
24,453 18,230Lafayette( Census Places) |0 in Boulder
86,270 63,673Longmont( Census Places) |0 in Boulder/Weld
18,135 12,504Erie( Census Places) |0 in Boulder/Weld/Broomfield
12,483 8,547Superior( Census Places) |0 in Jefferson/Boulder/Broomfield
1 Counties
294,567 231,813Boulder County
455,212 349,39912Total for District
13District: 5 Cities
18,376 13,900Louisville( Census Places) |0 in Boulder
97,385 83,858Boulder( Census Places) |0 in Boulder
86,270 63,673Longmont( Census Places) |0 in Boulder/Weld
12,483 8,547Superior( Census Places) |0 in Jefferson/Boulder/Broomfield
2,400 1,990Coal Creek( Census Places) |0 in Jefferson/Boulder/Gilpin
1 Counties
294,567 231,813Boulder County
511,481 403,78113Total for District
22District: 2 Cities
325,078 236,243Aurora( Census Places) |0 in Adams/Elbert/Douglas/Denver/Arapahoe
100,377 75,196Centennial( Census Places) |0 in Arapahoe
1 Counties
572,003 424,679Arapahoe County
997,458 736,11822Total for District
23District: 3 Cities
142,980 113,246Lakewood( Census Places) |0 in Jefferson
18,867 15,792Golden( Census Places) |0 in Jefferson
7,160 5,798Applewood( Census Places) |0 in Jefferson
1 Counties
534,543 415,453Jefferson County
703,550 550,28923Total for District
24District: 5 Cities
18,867 15,792Golden( Census Places) |0 in Jefferson
7,559 5,923Fairmount( Census Places) |0 in Jefferson
7,160 5,798Applewood( Census Places) |0 in Jefferson
142,980 113,246Lakewood( Census Places) |0 in Jefferson
30,166 24,526Wheat Ridge( Census Places) |0 in Jefferson
1 Counties
534,543 415,453Jefferson County
741,275 580,73824Total for District
25District:
Page 3 of 7
State of Colorado
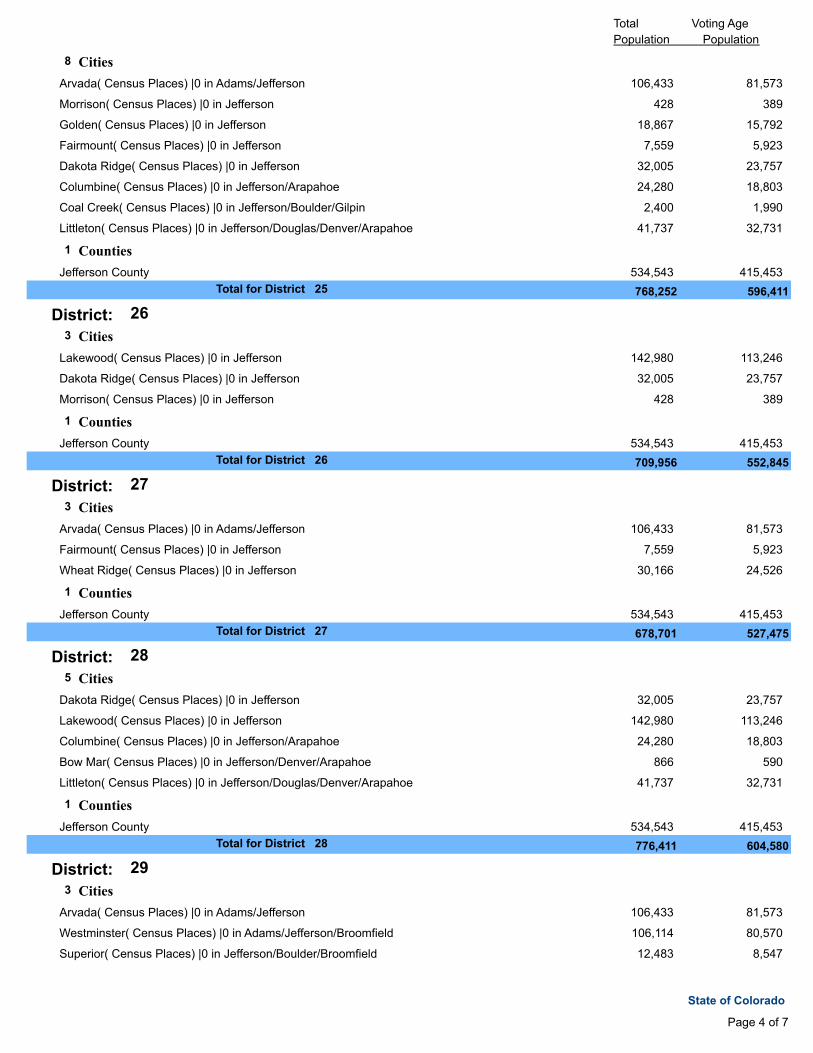
Total Voting Age
Population Population
8 Cities
106,433 81,573Arvada( Census Places) |0 in Adams/Jefferson
428 389Morrison( Census Places) |0 in Jefferson
18,867 15,792Golden( Census Places) |0 in Jefferson
7,559 5,923Fairmount( Census Places) |0 in Jefferson
32,005 23,757Dakota Ridge( Census Places) |0 in Jefferson
24,280 18,803Columbine( Census Places) |0 in Jefferson/Arapahoe
2,400 1,990Coal Creek( Census Places) |0 in Jefferson/Boulder/Gilpin
41,737 32,731Littleton( Census Places) |0 in Jefferson/Douglas/Denver/Arapahoe
1 Counties
534,543 415,453Jefferson County
768,252 596,41125Total for District
26District: 3 Cities
142,980 113,246Lakewood( Census Places) |0 in Jefferson
32,005 23,757Dakota Ridge( Census Places) |0 in Jefferson
428 389Morrison( Census Places) |0 in Jefferson
1 Counties
534,543 415,453Jefferson County
709,956 552,84526Total for District
27District: 3 Cities
106,433 81,573Arvada( Census Places) |0 in Adams/Jefferson
7,559 5,923Fairmount( Census Places) |0 in Jefferson
30,166 24,526Wheat Ridge( Census Places) |0 in Jefferson
1 Counties
534,543 415,453Jefferson County
678,701 527,47527Total for District
28District: 5 Cities
32,005 23,757Dakota Ridge( Census Places) |0 in Jefferson
142,980 113,246Lakewood( Census Places) |0 in Jefferson
24,280 18,803Columbine( Census Places) |0 in Jefferson/Arapahoe
866 590Bow Mar( Census Places) |0 in Jefferson/Denver/Arapahoe
41,737 32,731Littleton( Census Places) |0 in Jefferson/Douglas/Denver/Arapahoe
1 Counties
534,543 415,453Jefferson County
776,411 604,58028Total for District
29District: 3 Cities
106,433 81,573Arvada( Census Places) |0 in Adams/Jefferson
106,114 80,570Westminster( Census Places) |0 in Adams/Jefferson/Broomfield
12,483 8,547Superior( Census Places) |0 in Jefferson/Boulder/Broomfield
Page 4 of 7
State of Colorado
Total Voting Age
Population Population
1 Counties
534,543 415,453Jefferson County
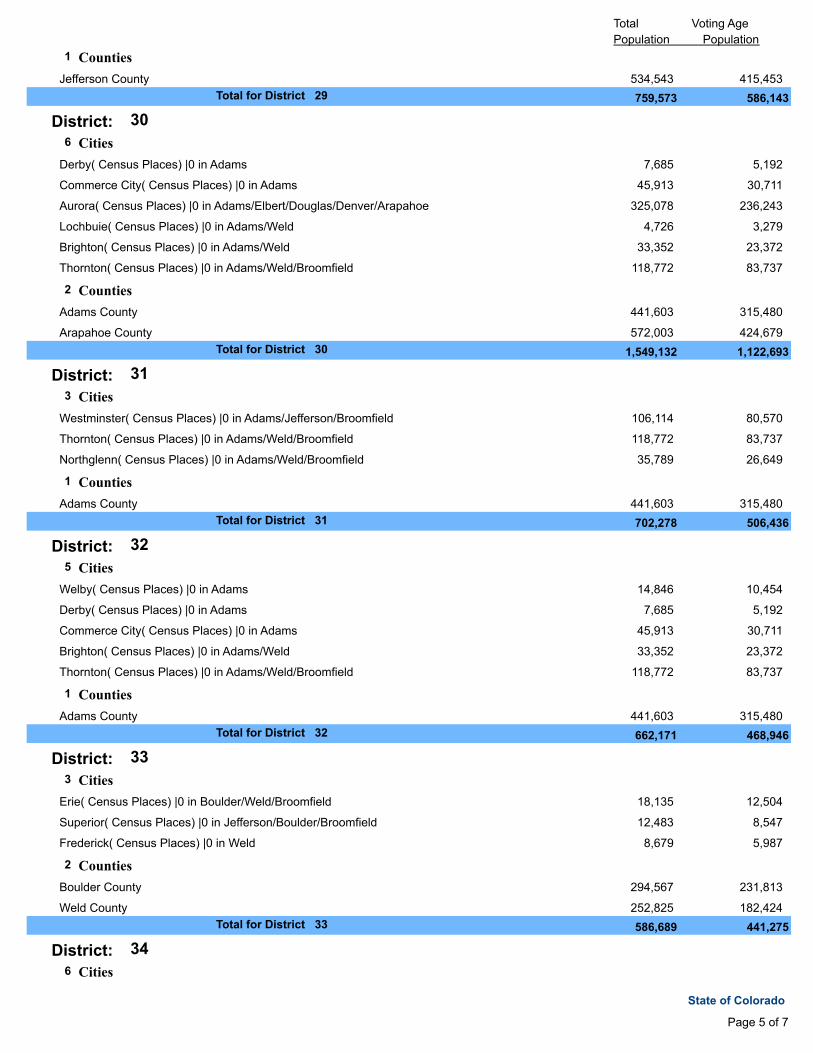
759,573 586,14329Total for District
30District: 6 Cities
7,685 5,192Derby( Census Places) |0 in Adams
45,913 30,711Commerce City( Census Places) |0 in Adams
325,078 236,243Aurora( Census Places) |0 in Adams/Elbert/Douglas/Denver/Arapahoe
4,726 3,279Lochbuie( Census Places) |0 in Adams/Weld
33,352 23,372Brighton( Census Places) |0 in Adams/Weld
118,772 83,737Thornton( Census Places) |0 in Adams/Weld/Broomfield
2 Counties
441,603 315,480Adams County
572,003 424,679Arapahoe County
1,549,132 1,122,69330Total for District
31District: 3 Cities
106,114 80,570Westminster( Census Places) |0 in Adams/Jefferson/Broomfield
118,772 83,737Thornton( Census Places) |0 in Adams/Weld/Broomfield
35,789 26,649Northglenn( Census Places) |0 in Adams/Weld/Broomfield
1 Counties
441,603 315,480Adams County
702,278 506,43631Total for District
32District: 5 Cities
14,846 10,454Welby( Census Places) |0 in Adams
7,685 5,192Derby( Census Places) |0 in Adams
45,913 30,711Commerce City( Census Places) |0 in Adams
33,352 23,372Brighton( Census Places) |0 in Adams/Weld
118,772 83,737Thornton( Census Places) |0 in Adams/Weld/Broomfield
1 Counties
441,603 315,480Adams County
662,171 468,94632Total for District
33District: 3 Cities
18,135 12,504Erie( Census Places) |0 in Boulder/Weld/Broomfield
12,483 8,547Superior( Census Places) |0 in Jefferson/Boulder/Broomfield
8,679 5,987Frederick( Census Places) |0 in Weld
2 Counties
294,567 231,813Boulder County
252,825 182,424Weld County
586,689 441,27533Total for District
34District: 6 Cities
Page 5 of 7
State of Colorado
Total Voting Age
Population Population
18,287 13,035Sherrelwood( Census Places) |0 in Adams
14,846 10,454Welby( Census Places) |0 in Adams
11,467 8,386Federal Heights( Census Places) |0 in Adams
106,114 80,570Westminster( Census Places) |0 in Adams/Jefferson/Broomfield
118,772 83,737Thornton( Census Places) |0 in Adams/Weld/Broomfield
35,789 26,649Northglenn( Census Places) |0 in Adams/Weld/Broomfield
1 Counties
441,603 315,480Adams County
746,878 538,31134Total for District
35District: 5 Cities
14,846 10,454Welby( Census Places) |0 in Adams
18,287 13,035Sherrelwood( Census Places) |0 in Adams
11,467 8,386Federal Heights( Census Places) |0 in Adams
106,433 81,573Arvada( Census Places) |0 in Adams/Jefferson
106,114 80,570Westminster( Census Places) |0 in Adams/Jefferson/Broomfield
1 Counties
441,603 315,480Adams County
698,750 509,49835Total for District
36District: 1 Cities
325,078 236,243Aurora( Census Places) |0 in Adams/Elbert/Douglas/Denver/Arapahoe
1 Counties
572,003 424,679Arapahoe County
897,081 660,92236Total for District
37District: 3 Cities
325,078 236,243Aurora( Census Places) |0 in Adams/Elbert/Douglas/Denver/Arapahoe
100,377 75,196Centennial( Census Places) |0 in Arapahoe
41,737 32,731Littleton( Census Places) |0 in Jefferson/Douglas/Denver/Arapahoe
1 Counties
572,003 424,679Arapahoe County
1,039,195 768,84937Total for District
38District: 3 Cities
24,280 18,803Columbine( Census Places) |0 in Jefferson/Arapahoe
866 590Bow Mar( Census Places) |0 in Jefferson/Denver/Arapahoe
41,737 32,731Littleton( Census Places) |0 in Jefferson/Douglas/Denver/Arapahoe
1 Counties
572,003 424,679Arapahoe County
638,886 476,80338Total for District
39District: 2 Cities
Page 6 of 7
State of Colorado
Total Voting Age
Population Population
325,078 236,243Aurora( Census Places) |0 in Adams/Elbert/Douglas/Denver/Arapahoe
100,377 75,196Centennial( Census Places) |0 in Arapahoe
1 Counties
572,003 424,679Arapahoe County
997,458 736,11839Total for District
41District: 1 Cities
325,078 236,243Aurora( Census Places) |0 in Adams/Elbert/Douglas/Denver/Arapahoe
1 Counties
572,003 424,679Arapahoe County
897,081 660,92241Total for District
42District: 1 Cities
325,078 236,243Aurora( Census Places) |0 in Unknown County
1 Counties
572,003 424,679Arapahoe County
897,081 660,92242Total for District
Please Note: Report Totals are not provided as a district split are reported for each
neighboring district. As such the same geography may be represented for several
districts. For example if County "A" is split between districts 1, 3 and 5, it is reported as
a split for each district.
Page 7 of 7
State of Colorado
7/14/2011
Plan was last edited on:
Plan name:
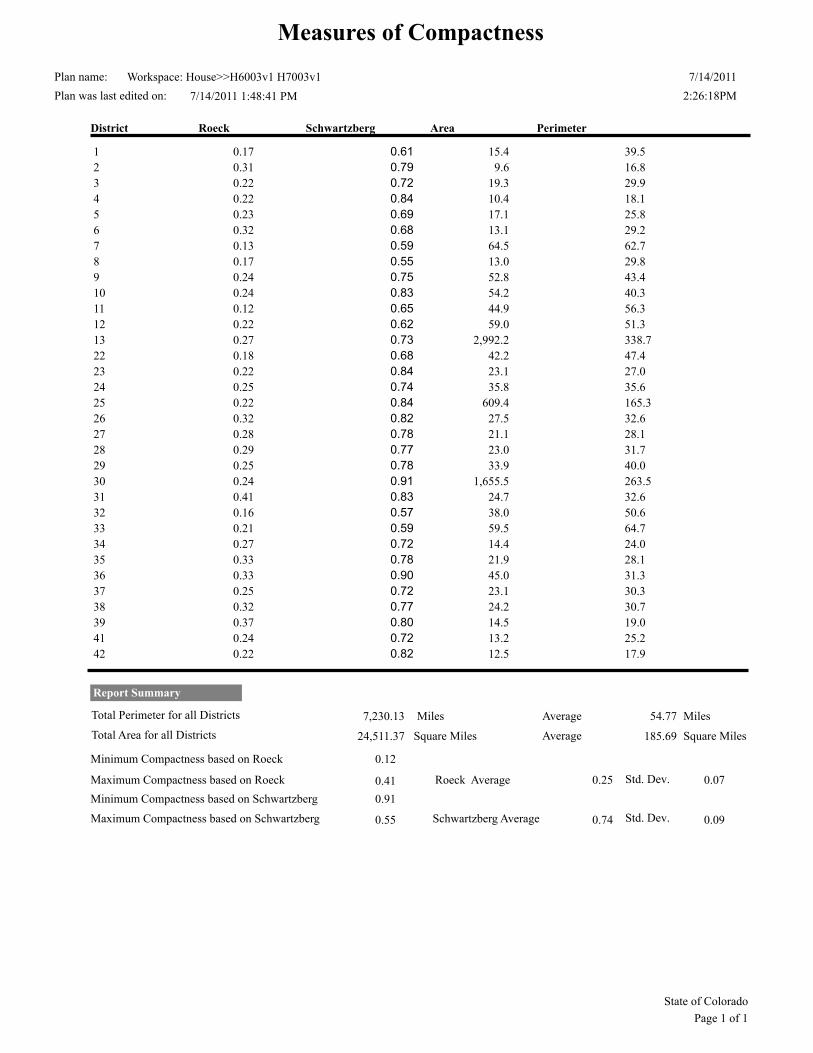
Measures of Compactness
Workspace: House>>H6003v1 H7003v1
7/14/2011 1:48:41 PM 2:26:18PM
District Roeck Schwartzberg Area Perimeter
1 0.17 39.5 0.61 15.4
2 0.31 16.8 0.79 9.6
3 0.22 29.9 0.72 19.3
4 0.22 18.1 0.84 10.4
5 0.23 25.8 0.69 17.1
6 0.32 29.2 0.68 13.1
7 0.13 62.7 0.59 64.5
8 0.17 29.8 0.55 13.0
9 0.24 43.4 0.75 52.8
10 0.24 40.3 0.83 54.2
11 0.12 56.3 0.65 44.9
12 0.22 51.3 0.62 59.0
13 0.27 338.7 0.73 2,992.2
22 0.18 47.4 0.68 42.2
23 0.22 27.0 0.84 23.1
24 0.25 35.6 0.74 35.8
25 0.22 165.3 0.84 609.4
26 0.32 32.6 0.82 27.5
27 0.28 28.1 0.78 21.1
28 0.29 31.7 0.77 23.0
29 0.25 40.0 0.78 33.9
30 0.24 263.5 0.91 1,655.5
31 0.41 32.6 0.83 24.7
32 0.16 50.6 0.57 38.0
33 0.21 64.7 0.59 59.5
34 0.27 24.0 0.72 14.4
35 0.33 28.1 0.78 21.9
36 0.33 31.3 0.90 45.0
37 0.25 30.3 0.72 23.1
38 0.32 30.7 0.77 24.2
39 0.37 19.0 0.80 14.5
41 0.24 25.2 0.72 13.2
42 0.22 17.9 0.82 12.5
7,230.13Total Perimeter for all Districts Miles
Total Area for all Districts 24,511.37 Square Miles
54.77 MilesAverage
Average 185.69 Square Miles
Report Summary
Maximum Compactness based on Schwartzberg
Minimum Compactness based on Schwartzberg
Maximum Compactness based on Roeck
Minimum Compactness based on Roeck
Schwartzberg Average
Roeck Average 0.41
0.12
Std. Dev. 0.07 0.25
0.91
0.55 0.74 0.09Std. Dev.
State of Colorado
Page 1 of 1
Thursday, July 14, 2011
Plan Last Edited on:
Plan Name:
2:27 pm
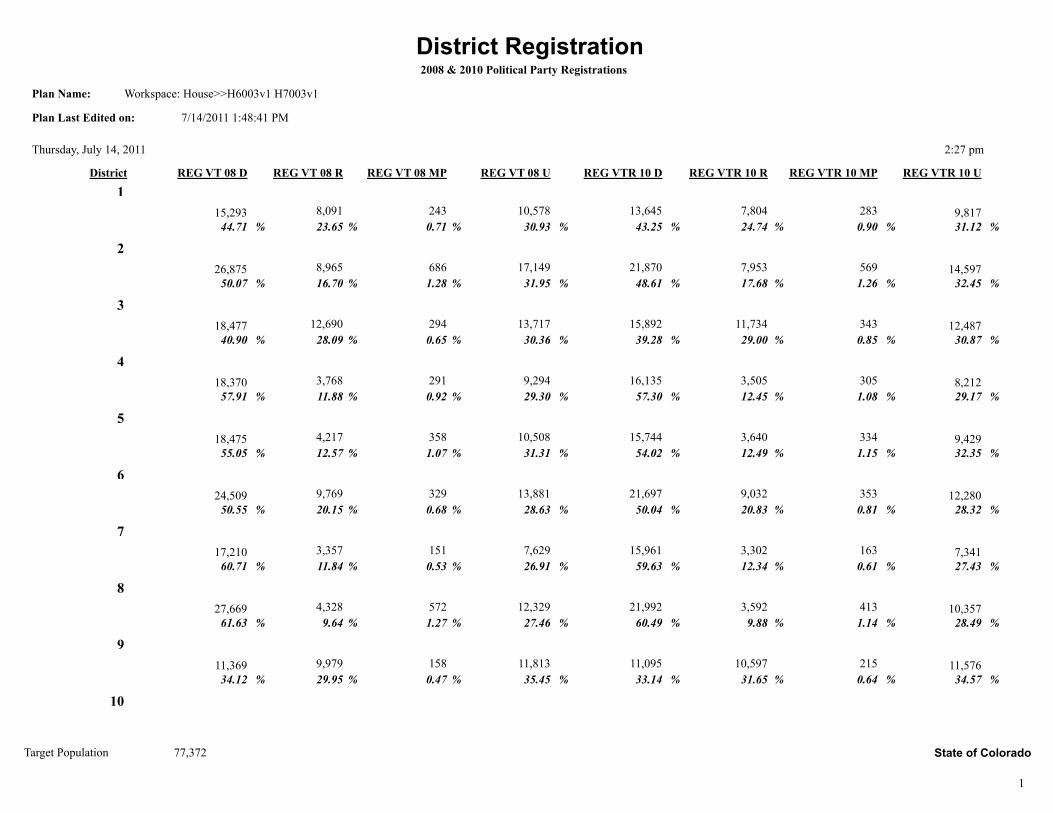
District Registration2008 & 2010 Political Party Registrations
Workspace: House>>H6003v1 H7003v1
7/14/2011 1:48:41 PM
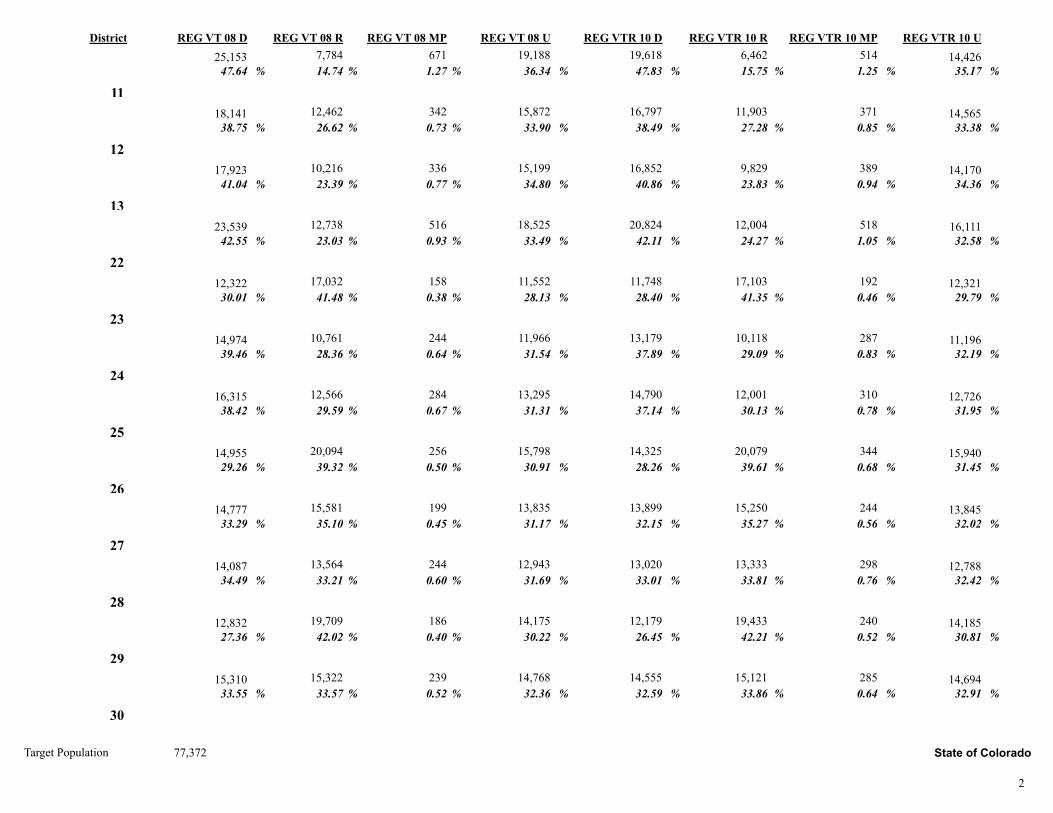
District REG VT 08 D REG VT 08 R REG VT 08 UREG VT 08 MP REG VTR 10 RREG VTR 10 D REG VTR 10 UREG VTR 10 MP
1
15,293 8,091 10,578 243
44.71 0.71 23.65 30.93%% %% 9,817 283
%%%% 24.74 43.25 31.12 0.90
13,645 7,804
2
26,875 8,965 17,149 686
50.07 1.28 16.70 31.95%% %% 14,597 569
%%%% 17.68 48.61 32.45 1.26
21,870 7,953
3
18,477 12,690 13,717 294
40.90 0.65 28.09 30.36%% %% 12,487 343
%%%% 29.00 39.28 30.87 0.85
15,892 11,734
4
18,370 3,768 9,294 291
57.91 0.92 11.88 29.30%% %% 8,212 305
%%%% 12.45 57.30 29.17 1.08
16,135 3,505
5
18,475 4,217 10,508 358
55.05 1.07 12.57 31.31%% %% 9,429 334
%%%% 12.49 54.02 32.35 1.15
15,744 3,640
6
24,509 9,769 13,881 329
50.55 0.68 20.15 28.63%% %% 12,280 353
%%%% 20.83 50.04 28.32 0.81
21,697 9,032
7
17,210 3,357 7,629 151
60.71 0.53 11.84 26.91%% %% 7,341 163
%%%% 12.34 59.63 27.43 0.61
15,961 3,302
8
27,669 4,328 12,329 572
61.63 1.27 9.64 27.46%% %% 10,357 413
%%%% 9.88 60.49 28.49 1.14
21,992 3,592
9
11,369 9,979 11,813 158
34.12 0.47 29.95 35.45%% %% 11,576 215
%%%% 31.65 33.14 34.57 0.64
11,095 10,597
10
1
State of ColoradoTarget Population 77,372
District REG VT 08 D REG VT 08 R REG VT 08 UREG VT 08 MP REG VTR 10 RREG VTR 10 D REG VTR 10 UREG VTR 10 MP
25,153 7,784 19,188 671
47.64 1.27 14.74 36.34%% %% 14,426 514
%%%% 15.75 47.83 35.17 1.25
19,618 6,462
11
18,141 12,462 15,872 342
38.75 0.73 26.62 33.90%% %% 14,565 371
%%%% 27.28 38.49 33.38 0.85
16,797 11,903
12
17,923 10,216 15,199 336
41.04 0.77 23.39 34.80%% %% 14,170 389
%%%% 23.83 40.86 34.36 0.94
16,852 9,829
13
23,539 12,738 18,525 516
42.55 0.93 23.03 33.49%% %% 16,111 518
%%%% 24.27 42.11 32.58 1.05
20,824 12,004
22
12,322 17,032 11,552 158
30.01 0.38 41.48 28.13%% %% 12,321 192
%%%% 41.35 28.40 29.79 0.46
11,748 17,103
23
14,974 10,761 11,966 244
39.46 0.64 28.36 31.54%% %% 11,196 287
%%%% 29.09 37.89 32.19 0.83
13,179 10,118
24
16,315 12,566 13,295 284
38.42 0.67 29.59 31.31%% %% 12,726 310
%%%% 30.13 37.14 31.95 0.78
14,790 12,001
25
14,955 20,094 15,798 256
29.26 0.50 39.32 30.91%% %% 15,940 344
%%%% 39.61 28.26 31.45 0.68
14,325 20,079
26
14,777 15,581 13,835 199
33.29 0.45 35.10 31.17%% %% 13,845 244
%%%% 35.27 32.15 32.02 0.56
13,899 15,250
27
14,087 13,564 12,943 244
34.49 0.60 33.21 31.69%% %% 12,788 298
%%%% 33.81 33.01 32.42 0.76
13,020 13,333
28
12,832 19,709 14,175 186
27.36 0.40 42.02 30.22%% %% 14,185 240
%%%% 42.21 26.45 30.81 0.52
12,179 19,433
29
15,310 15,322 14,768 239
33.55 0.52 33.57 32.36%% %% 14,694 285
%%%% 33.86 32.59 32.91 0.64
14,555 15,121
30
2
State of ColoradoTarget Population 77,372
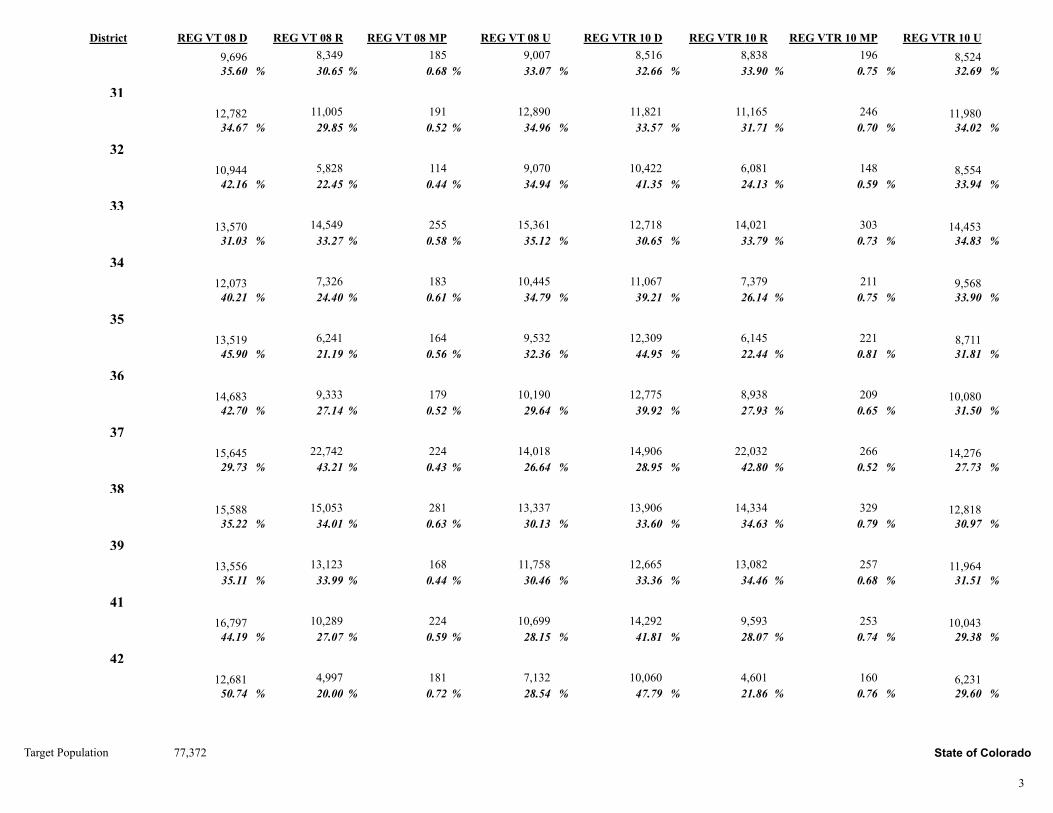
District REG VT 08 D REG VT 08 R REG VT 08 UREG VT 08 MP REG VTR 10 RREG VTR 10 D REG VTR 10 UREG VTR 10 MP
9,696 8,349 9,007 185
35.60 0.68 30.65 33.07%% %% 8,524 196
%%%% 33.90 32.66 32.69 0.75
8,516 8,838
31
12,782 11,005 12,890 191
34.67 0.52 29.85 34.96%% %% 11,980 246
%%%% 31.71 33.57 34.02 0.70
11,821 11,165
32
10,944 5,828 9,070 114
42.16 0.44 22.45 34.94%% %% 8,554 148
%%%% 24.13 41.35 33.94 0.59
10,422 6,081
33
13,570 14,549 15,361 255
31.03 0.58 33.27 35.12%% %% 14,453 303
%%%% 33.79 30.65 34.83 0.73
12,718 14,021
34
12,073 7,326 10,445 183
40.21 0.61 24.40 34.79%% %% 9,568 211
%%%% 26.14 39.21 33.90 0.75
11,067 7,379
35
13,519 6,241 9,532 164
45.90 0.56 21.19 32.36%% %% 8,711 221
%%%% 22.44 44.95 31.81 0.81
12,309 6,145
36
14,683 9,333 10,190 179
42.70 0.52 27.14 29.64%% %% 10,080 209
%%%% 27.93 39.92 31.50 0.65
12,775 8,938
37
15,645 22,742 14,018 224
29.73 0.43 43.21 26.64%% %% 14,276 266
%%%% 42.80 28.95 27.73 0.52
14,906 22,032
38
15,588 15,053 13,337 281
35.22 0.63 34.01 30.13%% %% 12,818 329
%%%% 34.63 33.60 30.97 0.79
13,906 14,334
39
13,556 13,123 11,758 168
35.11 0.44 33.99 30.46%% %% 11,964 257
%%%% 34.46 33.36 31.51 0.68
12,665 13,082
41
16,797 10,289 10,699 224
44.19 0.59 27.07 28.15%% %% 10,043 253
%%%% 28.07 41.81 29.38 0.74
14,292 9,593
42
12,681 4,997 7,132 181
50.74 0.72 20.00 28.54%% %% 6,231 160
%%%% 21.86 47.79 29.60 0.76
10,060 4,601
3
State of ColoradoTarget Population 77,372
Thursday, July 14, 2011
Plan Last Edited on:
Plan Name:
2:24 pm
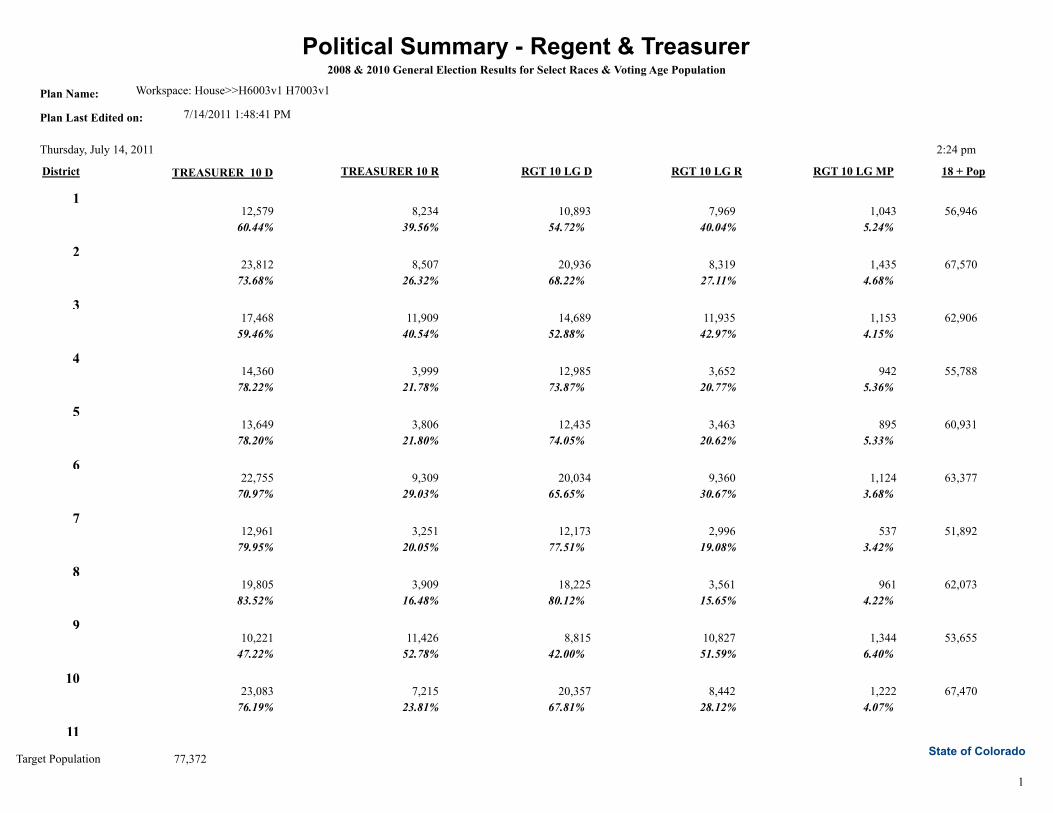
Political Summary - Regent & Treasurer2008 & 2010 General Election Results for Select Races & Voting Age Population
Workspace: House>>H6003v1 H7003v1
7/14/2011 1:48:41 PM
TREASURER 10 D TREASURER 10 RDistrict 18 + PopRGT 10 LG RRGT 10 LG D RGT 10 LG MP
1 56,946 1,043 10,893 7,969
54.72% 40.04% 5.24%60.44% 39.56%
8,234 12,579
2 67,570 1,435 20,936 8,319
68.22% 27.11% 4.68%73.68% 26.32%
8,507 23,812
3 62,906 1,153 14,689 11,935
52.88% 42.97% 4.15%59.46% 40.54%
11,909 17,468
4 55,788 942 12,985 3,652
73.87% 20.77% 5.36%78.22% 21.78%
3,999 14,360
5 60,931 895 12,435 3,463
74.05% 20.62% 5.33%78.20% 21.80%
3,806 13,649
6 63,377 1,124 20,034 9,360
65.65% 30.67% 3.68%70.97% 29.03%
9,309 22,755
7 51,892 537 12,173 2,996
77.51% 19.08% 3.42%79.95% 20.05%
3,251 12,961
8 62,073 961 18,225 3,561
80.12% 15.65% 4.22%83.52% 16.48%
3,909 19,805
9 53,655 1,344 8,815 10,827
42.00% 51.59% 6.40%47.22% 52.78%
11,426 10,221
10 67,470 1,222 20,357 8,442
67.81% 28.12% 4.07%76.19% 23.81%
7,215 23,083
11
1
State of ColoradoTarget Population 77,372
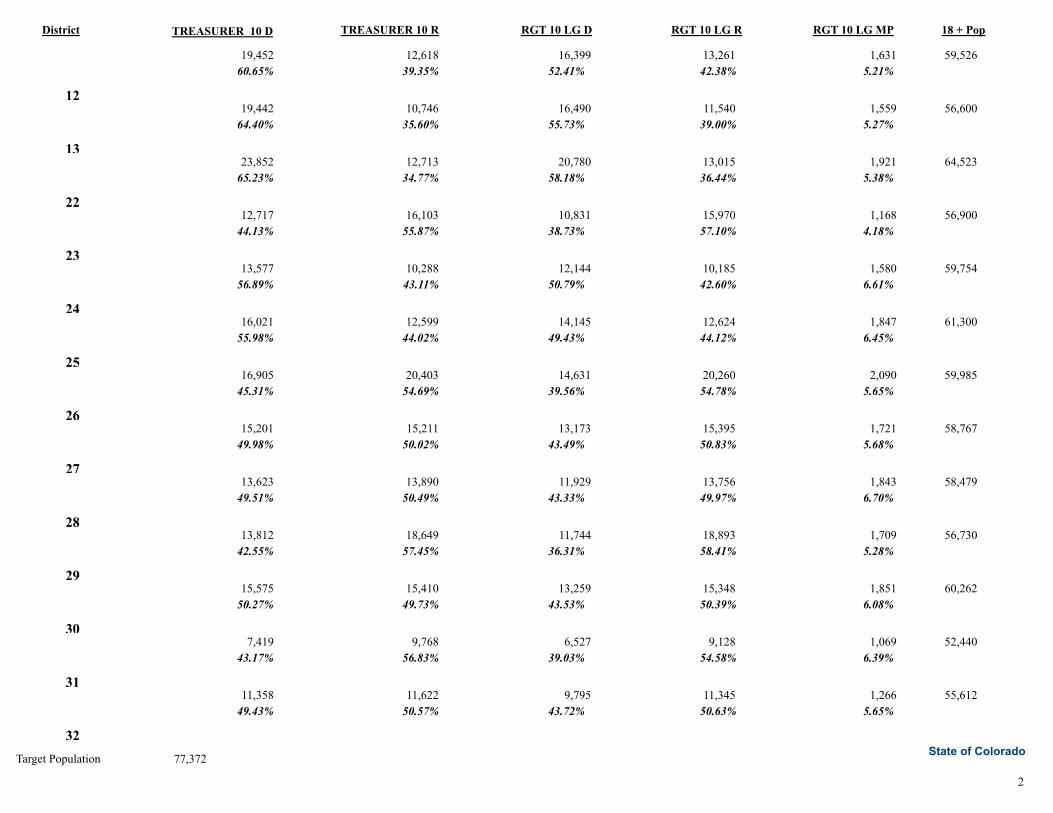
TREASURER 10 D TREASURER 10 RDistrict 18 + PopRGT 10 LG RRGT 10 LG D RGT 10 LG MP
59,526 1,631 16,399 13,261
52.41% 42.38% 5.21%60.65% 39.35%
12,618 19,452
12 56,600 1,559 16,490 11,540
55.73% 39.00% 5.27%64.40% 35.60%
10,746 19,442
13 64,523 1,921 20,780 13,015
58.18% 36.44% 5.38%65.23% 34.77%
12,713 23,852
22 56,900 1,168 10,831 15,970
38.73% 57.10% 4.18%44.13% 55.87%
16,103 12,717
23 59,754 1,580 12,144 10,185
50.79% 42.60% 6.61%56.89% 43.11%
10,288 13,577
24 61,300 1,847 14,145 12,624
49.43% 44.12% 6.45%55.98% 44.02%
12,599 16,021
25 59,985 2,090 14,631 20,260
39.56% 54.78% 5.65%45.31% 54.69%
20,403 16,905
26 58,767 1,721 13,173 15,395
43.49% 50.83% 5.68%49.98% 50.02%
15,211 15,201
27 58,479 1,843 11,929 13,756
43.33% 49.97% 6.70%49.51% 50.49%
13,890 13,623
28 56,730 1,709 11,744 18,893
36.31% 58.41% 5.28%42.55% 57.45%
18,649 13,812
29 60,262 1,851 13,259 15,348
43.53% 50.39% 6.08%50.27% 49.73%
15,410 15,575
30 52,440 1,069 6,527 9,128
39.03% 54.58% 6.39%43.17% 56.83%
9,768 7,419
31 55,612 1,266 9,795 11,345
43.72% 50.63% 5.65%49.43% 50.57%
11,622 11,358
32
2
State of ColoradoTarget Population 77,372
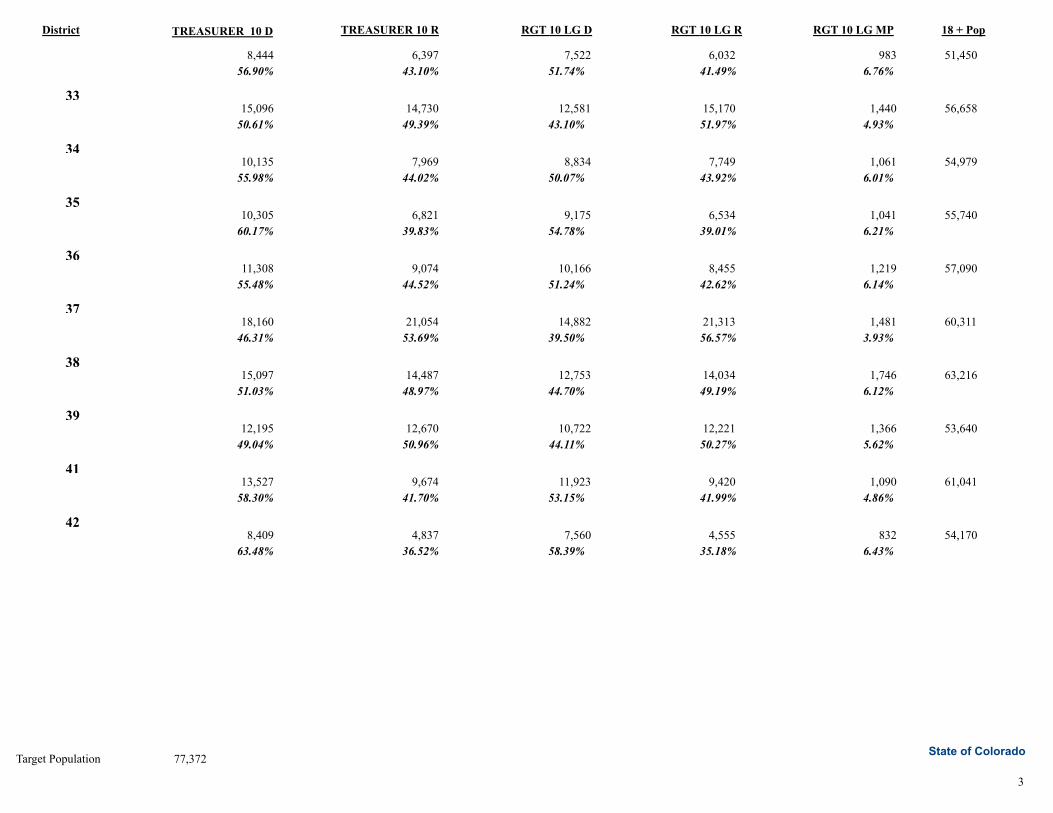
TREASURER 10 D TREASURER 10 RDistrict 18 + PopRGT 10 LG RRGT 10 LG D RGT 10 LG MP
51,450 983 7,522 6,032
51.74% 41.49% 6.76%56.90% 43.10%
6,397 8,444
33 56,658 1,440 12,581 15,170
43.10% 51.97% 4.93%50.61% 49.39%
14,730 15,096
34 54,979 1,061 8,834 7,749
50.07% 43.92% 6.01%55.98% 44.02%
7,969 10,135
35 55,740 1,041 9,175 6,534
54.78% 39.01% 6.21%60.17% 39.83%
6,821 10,305
36 57,090 1,219 10,166 8,455
51.24% 42.62% 6.14%55.48% 44.52%
9,074 11,308
37 60,311 1,481 14,882 21,313
39.50% 56.57% 3.93%46.31% 53.69%
21,054 18,160
38 63,216 1,746 12,753 14,034
44.70% 49.19% 6.12%51.03% 48.97%
14,487 15,097
39 53,640 1,366 10,722 12,221
44.11% 50.27% 5.62%49.04% 50.96%
12,670 12,195
41 61,041 1,090 11,923 9,420
53.15% 41.99% 4.86%58.30% 41.70%
9,674 13,527
42 54,170 832 7,560 4,555
58.39% 35.18% 6.43%63.48% 36.52%
4,837 8,409
3
State of ColoradoTarget Population 77,372
Thursday, July 14, 2011
Plan Last Edited on:
Plan Name:
2:25 pm
Political Summary - US Senate2008 & 2010 General Election Results for Select Races & Voting Age Population
Workspace: House>>H6003v1 H7003v1
7/14/2011 1:48:41 PM
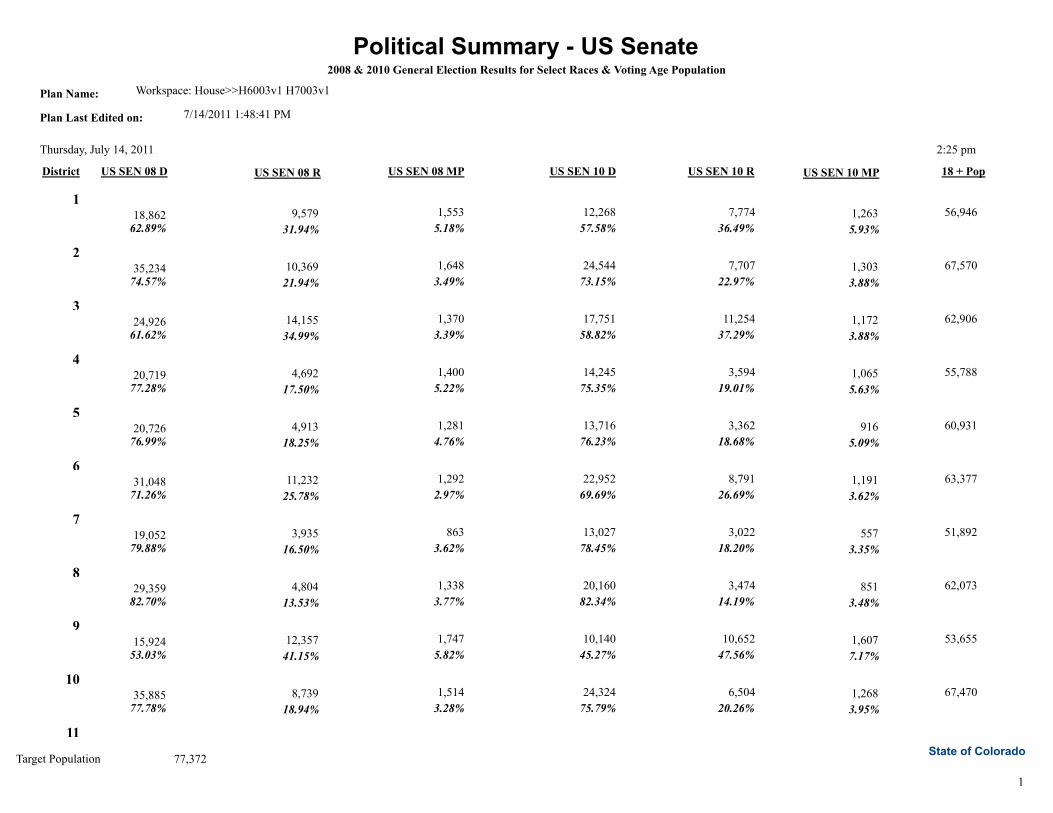
US SEN 08 D US SEN 08 RDistrict US SEN 08 MP 18 + PopUS SEN 10 RUS SEN 10 D US SEN 10 MP
1 18,862 9,579 1,553
62.89% 31.94% 5.18%
56,946 7,774 12,268 1,26357.58% 36.49% 5.93%
2 35,234 10,369 1,648
74.57% 21.94% 3.49%
67,570 7,707 24,544 1,30373.15% 22.97% 3.88%
3 24,926 14,155 1,370
61.62% 34.99% 3.39%
62,906 11,254 17,751 1,17258.82% 37.29% 3.88%
4 20,719 4,692 1,400
77.28% 17.50% 5.22%
55,788 3,594 14,245 1,06575.35% 19.01% 5.63%
5 20,726 4,913 1,281
76.99% 18.25% 4.76%
60,931 3,362 13,716 91676.23% 18.68% 5.09%
6 31,048 11,232 1,292
71.26% 25.78% 2.97%
63,377 8,791 22,952 1,19169.69% 26.69% 3.62%
7 19,052 3,935 863
79.88% 16.50% 3.62%
51,892 3,022 13,027 55778.45% 18.20% 3.35%
8 29,359 4,804 1,338
82.70% 13.53% 3.77%
62,073 3,474 20,160 85182.34% 14.19% 3.48%
9 15,924 12,357 1,747
53.03% 41.15% 5.82%
53,655 10,652 10,140 1,60745.27% 47.56% 7.17%
10 35,885 8,739 1,514
77.78% 18.94% 3.28%
67,470 6,504 24,324 1,26875.79% 20.26% 3.95%
11
1
State of ColoradoTarget Population 77,372
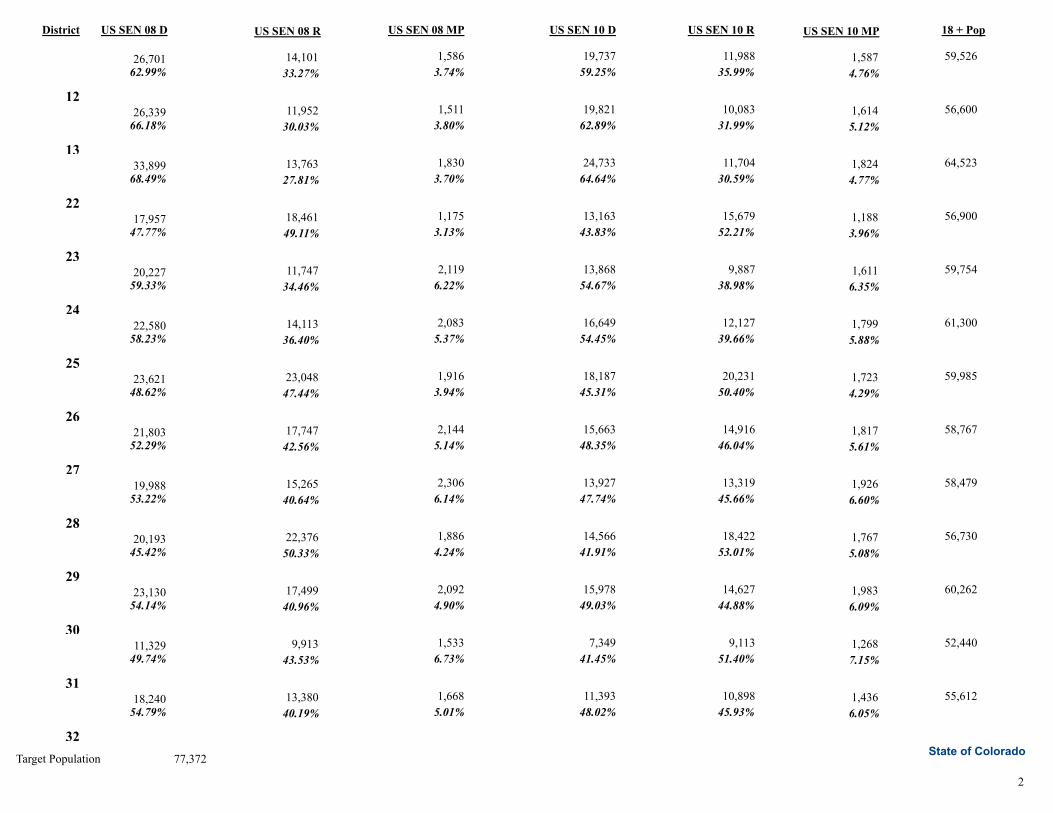
US SEN 08 D US SEN 08 RDistrict US SEN 08 MP 18 + PopUS SEN 10 RUS SEN 10 D US SEN 10 MP
26,701 14,101 1,586
62.99% 33.27% 3.74%
59,526 11,988 19,737 1,58759.25% 35.99% 4.76%
12 26,339 11,952 1,511
66.18% 30.03% 3.80%
56,600 10,083 19,821 1,61462.89% 31.99% 5.12%
13 33,899 13,763 1,830
68.49% 27.81% 3.70%
64,523 11,704 24,733 1,82464.64% 30.59% 4.77%
22 17,957 18,461 1,175
47.77% 49.11% 3.13%
56,900 15,679 13,163 1,18843.83% 52.21% 3.96%
23 20,227 11,747 2,119
59.33% 34.46% 6.22%
59,754 9,887 13,868 1,61154.67% 38.98% 6.35%
24 22,580 14,113 2,083
58.23% 36.40% 5.37%
61,300 12,127 16,649 1,79954.45% 39.66% 5.88%
25 23,621 23,048 1,916
48.62% 47.44% 3.94%
59,985 20,231 18,187 1,72345.31% 50.40% 4.29%
26 21,803 17,747 2,144
52.29% 42.56% 5.14%
58,767 14,916 15,663 1,81748.35% 46.04% 5.61%
27 19,988 15,265 2,306
53.22% 40.64% 6.14%
58,479 13,319 13,927 1,92647.74% 45.66% 6.60%
28 20,193 22,376 1,886
45.42% 50.33% 4.24%
56,730 18,422 14,566 1,76741.91% 53.01% 5.08%
29 23,130 17,499 2,092
54.14% 40.96% 4.90%
60,262 14,627 15,978 1,98349.03% 44.88% 6.09%
30 11,329 9,913 1,533
49.74% 43.53% 6.73%
52,440 9,113 7,349 1,26841.45% 51.40% 7.15%
31 18,240 13,380 1,668
54.79% 40.19% 5.01%
55,612 10,898 11,393 1,43648.02% 45.93% 6.05%
32
2
State of ColoradoTarget Population 77,372
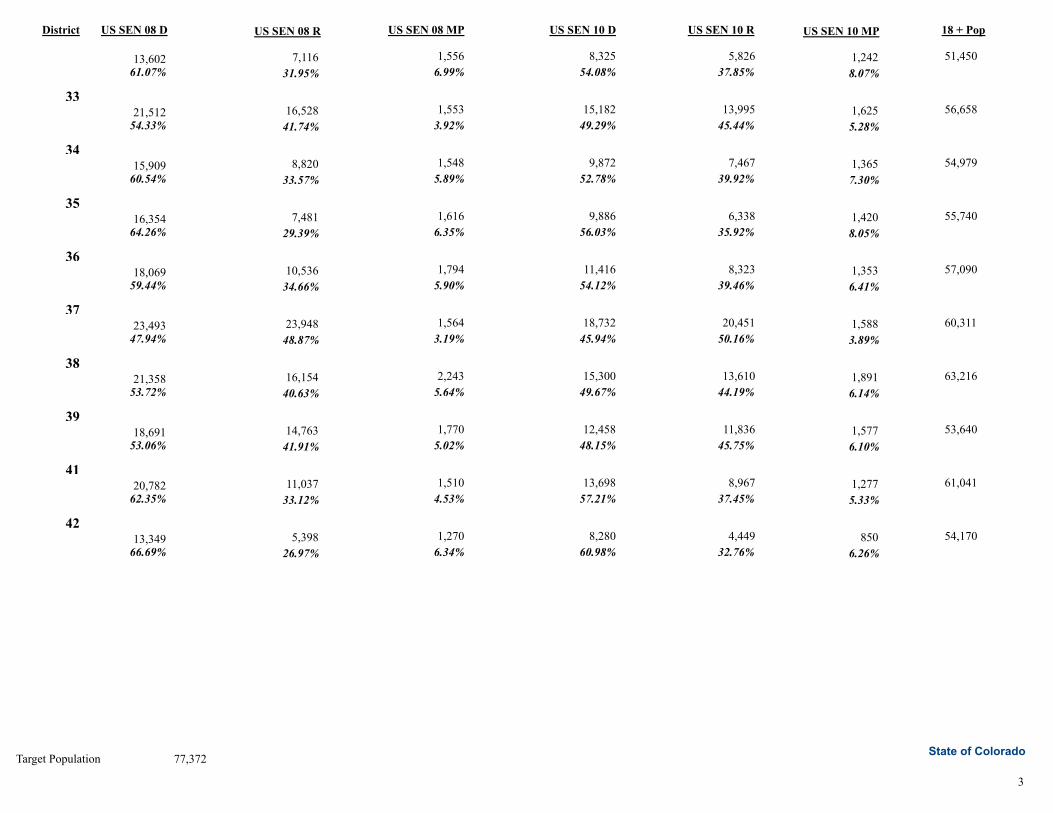
US SEN 08 D US SEN 08 RDistrict US SEN 08 MP 18 + PopUS SEN 10 RUS SEN 10 D US SEN 10 MP
13,602 7,116 1,556
61.07% 31.95% 6.99%
51,450 5,826 8,325 1,24254.08% 37.85% 8.07%
33 21,512 16,528 1,553
54.33% 41.74% 3.92%
56,658 13,995 15,182 1,62549.29% 45.44% 5.28%
34 15,909 8,820 1,548
60.54% 33.57% 5.89%
54,979 7,467 9,872 1,36552.78% 39.92% 7.30%
35 16,354 7,481 1,616
64.26% 29.39% 6.35%
55,740 6,338 9,886 1,42056.03% 35.92% 8.05%
36 18,069 10,536 1,794
59.44% 34.66% 5.90%
57,090 8,323 11,416 1,35354.12% 39.46% 6.41%
37 23,493 23,948 1,564
47.94% 48.87% 3.19%
60,311 20,451 18,732 1,58845.94% 50.16% 3.89%
38 21,358 16,154 2,243
53.72% 40.63% 5.64%
63,216 13,610 15,300 1,89149.67% 44.19% 6.14%
39 18,691 14,763 1,770
53.06% 41.91% 5.02%
53,640 11,836 12,458 1,57748.15% 45.75% 6.10%
41 20,782 11,037 1,510
62.35% 33.12% 4.53%
61,041 8,967 13,698 1,27757.21% 37.45% 5.33%
42 13,349 5,398 1,270
66.69% 26.97% 6.34%
54,170 4,449 8,280 85060.98% 32.76% 6.26%
3
State of ColoradoTarget Population 77,372