hospitality properties trust -...
TRANSCRIPT

Hospitality Properties Trust Investor Presentation March 2018
Sonesta ES Suites Charlotte Arrowood
Charlotte, NC
Operator: Sonesta International Hotels Corp.
Guest Rooms: 119

Hospitality Properties Trust
Disclaimer.
WARNING CONCERNING FORWARD LOOKING STATEMENTS
THIS PRESENTATION CONTAINS STATEMENTS THAT CONSTITUTE FORWARD LOOKING STATEMENTS WITHIN THE MEANING OF THE PRIVATE SECURITIES LITIGATION REFORM ACT OF 1995 AND OTHER SECURITIES LAWS. ALSO, WHENEVER WE USE WORDS SUCH AS “BELIEVE”, “EXPECT”,
“ANTICIPATE”, “INTEND”, “PLAN”, “ESTIMATE”, “WILL”, “MAY” AND NEGATIVES OR DERIVATIVES OF THESE OR SIMILAR EXPRESSIONS, WE ARE MAKING FORWARD LOOKING STATEMENTS. THESE FORWARD LOOKING STATEMENTS ARE BASED UPON OUR PRESENT INTENT, BELIEFS OR
EXPECTATIONS, BUT FORWARD LOOKING STATEMENTS ARE NOT GUARANTEED TO OCCUR AND MAY NOT OCCUR. FORWARD LOOKING STATEMENTS IN THIS PRESENTATION RELATE TO VARIOUS ASPECTS OF OUR BUSINESS, INCLUDING OUR HOTEL MANAGERS’ OR TENANTS’ ABILITIES TO
PAY THE CONTRACTUAL AMOUNTS OF RETURNS OR RENTS DUE TO US, OUR ABILITY TO COMPETE FOR ACQUISITIONS EFFECTIVELY, OUR POLICIES AND PLANS REGARDING INVESTMENTS, FINANCINGS AND DISPOSITIONS, OUR ABILITY TO PAY DISTRIBUTIONS TO OUR SHAREHOLDERS
AND THE AMOUNT OF SUCH DISTRIBUTIONS, OUR ABILITY TO RAISE DEBT OR EQUITY CAPITAL, OUR ABILITY TO APPROPRIATELY BALANCE OUR USE OF DEBT AND EQUITY CAPITAL, OUR INTENT TO MAKE IMPROVEMENTS TO CERTAIN OF OUR PROPERTIES AND THE SUCCESS OF OUR
HOTEL RENOVATIONS TO IMPROVE OUR HOTELS’ RATES AND OCCUPANCIES, OUR ABILITY TO ENGAGE AND RETAIN QUALIFIED MANAGERS AND TENANTS FOR OUR HOTELS AND TRAVEL CENTERS ON SATISFACTORY TERMS, THE FUTURE AVAILABILITY OF BORROWINGS UNDER OUR
REVOLVING CREDIT FACILITY, OUR ABILITY TO PAY INTEREST ON AND PRINCIPAL OF OUR DEBT, OUR CREDIT RATINGS AND THE ABILITY OF TRAVELCENTERS OF AMERICA LLC (TA) TO PAY CURRENT AND DEFERRED RENT AMOUNTS AND OTHER OBLIGATIONS DUE TO US.
OUR ACTUAL RESULTS MAY DIFFER MATERIALLY FROM THOSE CONTAINED IN OR IMPLIED BY OUR FORWARD LOOKING STATEMENTS AS A RESULT OF VARIOUS FACTORS, SUCH AS THE IMPACT OF CONDITIONS AND CHANGES IN THE ECONOMY AND THE CAPITAL MARKETS ON US AND OUR
MANAGERS AND TENANTS, COMPETITION WITHIN THE REAL ESTATE, HOTEL, TRANSPORTATION AND TRAVEL CENTER INDUSTRIES, PARTICULARLY IN THOSE MARKETS WHERE OUR PROPERTIES ARE LOCATED, COMPLIANCE WITH, AND CHANGES TO APPLICABLE LAWS, REGULATIONS AND
RULES, OUR ABILITY TO SATISFY COMPLEX RULES IN ORDER FOR US TO QUALIFY FOR TAXATION AS A REIT FOR U.S. FEDERAL INCOME TAX PURPOSES, ACTS OF TERRORISM, OUTBREAKS OF SO CALLED PANDEMICS OR OTHER MANMADE OR NATURAL DISASTERS BEYOND OUR CONTROL
AND ACTUAL AND POTENTIAL CONFLICTS OF INTEREST WITH OUR RELATED PARTIES. FOR EXAMPLE: (A) WE MAY BE UNABLE TO PAY OUR DEBT OBLIGATIONS WHEN THEY BECOME DUE OR TO MAINTAIN OUR CURRENT RATE OF DISTRIBUTIONS ON OUR COMMON SHARES AND FUTURE
DISTRIBUTIONS MAY BE REDUCED OR ELIMINATED; (B) THE FAILURE OF OUR MANAGERS OR TENANTS TO PAY MINIMUM RETURNS OR RENTS DUE TO US MAY REDUCE OUR CASH FLOWS AND OUR ABILITY TO PAY DISTRIBUTIONS TO SHAREHOLDERS; (C) CERTAIN GUARANTEES AND
SECURITY DEPOSITS FROM OUR MANAGERS AND TENANTS ARE LIMITED IN AMOUNT AND DURATION AND ALL THE GUARANTEES ARE SUBJECT TO THE GUARANTORS’ ABILITIES AND WILLINGNESS TO PAY. WE CANNOT BE SURE OF THE FUTURE FINANCIAL PERFORMANCE OF OUR
PROPERTIES AND WHETHER SUCH PERFORMANCE WILL COVER OUR MINIMUM RETURNS AND RENTS, WHETHER THE GUARANTEES OR SECURITY DEPOSITS WILL BE ADEQUATE TO COVER FUTURE SHORTFALLS IN THE MINIMUM RETURNS OR RENTS DUE TO US WHICH THEY GUARANTY
OR SECURE, OR REGARDING OUR MANAGERS’, TENANTS’ OR GUARANTORS’ FUTURE ACTIONS IF AND WHEN THE GUARANTEES AND SECURITY DEPOSIT S EXPIRE OR ARE DEPLETED OR THEIR ABILITIES OR WILLINGNESS TO PAY MINIMUM RETURNS AND RENTS OWED TO US; (D) THE COST
OF CAPITAL PROJECTS ASSOCIATED WITH RENOVATIONS WE ARE MAKING OR MAY MAKE IN THE FUTURE AT CERTAIN OF OUR HOTELS MAY BE GREATER THAN WE NOW ANTICIPATE, AND OPERATING RESULTS AT OUR HOTELS MAY DECLINE AS A RESULT OF HAVING ROOMS OUT OF
SERVICE OR OTHER DISRUPTIONS DURING RENOVATIONS. ALSO, WHILE OUR FUNDING OF THESE CAPITAL PROJECTS WILL CAUSE OUR CONTRACTUAL MINIMUM RETURNS TO INCREASE, THE HOTELS’ OPERATING RESULTS MAY NOT INCREASE OR MAY NOT INCREASE TO THE EXTENT
THAT THE MINIMUM RETURNS INCREASE. ACCORDINGLY, COVERAGE OF OUR MINIMUM RETURNS AT THESE HOTELS MAY REMAIN DEPRESSED FOR AN EXTENDED PERIOD; (E) WE EXPECT TO PURCHASE FROM TA DURING THE REMAINDER OF 2017 APPROXIMATELY $16.1 MILLION OF
CAPITAL IMPROVEMENTS TA EXPECTS TO MAKE TO THE TRAVEL CENTERS WE LEASE TO TA. PURSUANT TO THE TERMS OF THE APPLICABLE LEASES, THE ANNUAL RENT PAYABLE TO US BY TA WILL INCREASE AS A RESULT OF ANY SUCH PURCHASES. WE MAY ULTIMATELY PURCHASE
MORE OR LESS THAN THIS BUDGETED AMOUNT. TA MAY NOT REALIZE RESULTS FROM ANY OF THESE CAPITAL IMPROVEMENTS WHICH EQUAL OR EXCEED THE INCREASED ANNUAL RENTS IT WILL BE OBLIGATED TO PAY TO US, WHICH COULD INCREASE THE RISK OF TA BEING UNABLE TO
PAY AMOUNTS DUE TO US; (F) HOTEL ROOM DEMAND AND TRUCKING ACTIVITY ARE OFTEN REFLECTIONS OF THE GENERAL ECONOMIC ACTIVITY IN THE COUNTRY AND IN THE GEOGRAPHIC AREAS WHERE OUR PROPERTIES ARE LOCATED. IF ECONOMIC ACTIVITY IN THE COUNTRY
DECLINES, HOTEL ROOM DEMAND AND TRUCKING ACTIVITY MAY DECLINE AND THE OPERATING RESULTS OF OUR HOTELS AND TRAVEL CENTERS MAY DECLINE, THE FINANCIAL RESULTS OF OUR HOTEL MANAGERS AND OUR TENANTS, INCLUDING TA, MAY SUFFER AND THESE MANAGERS
AND TENANTS MAY BE UNABLE TO PAY OUR RETURNS OR RENTS; (G) HOTEL AND OTHER COMPETITIVE FORMS OF TRAVEL LODGING SUPPLY GROWTH HAS BEEN INCREASING AND MAY AFFECT OUR HOTEL OPERATORS' ABILITY TO GROW AVERAGE DAILY RATES (ADR) AND OCCUPANCY,
AND ADR AND OCCUPANCY COULD DECLINE DUE TO INCREASED COMPETITION WHICH MAY CAUSE OUR HOTEL OPERATORS TO BECOME UNABLE TO PAY OUR RETURNS OR RENTS; (H) IF THE CURRENT LEVEL OF COMMERCIAL ACTIVITY IN THE COUNTRY DECLINES, IF THE PRICE OF
DIESEL FUEL INCREASES SIGNIFICANTLY, IF FUEL CONSERVATION MEASURES ARE INCREASED, IF FREIGHT BUSINESS IS DIRECTED AWAY FROM T RUCKING, IF TA IS UNABLE TO EFFECTIVELY COMPETE OR OPERATE ITS BUSINESS, IF FUEL EFFICIENCIES, THE USE OF ALTERNATIVE FUELS
OR TRANSPORTATION TECHNOLOGIES REDUCE THE DEMAND FOR PRODUCTS AND SERVICES TA SELLS OR FOR VARIOUS OTHER REASONS, TA MAY BECOME UNABLE TO PAY CURRENT AND DEFERRED RENTS DUE TO US; (I) WE MAY BE UNABLE TO IDENTIFY PROPERTIES THAT WE WANT
TO ACQUIRE OR TO NEGOTIATE ACCEPTABLE PURCHASE PRICES, ACQUISITION FINANCING, MANAGEMENT CONTRACTS OR LEASE TERMS FOR NEW PROPERTIES; (J) CONTINGENCIES IN OUR ACQUISITION AND SALE AGREEMENTS MAY NOT BE SATISFIED AND OUR PENDING ACQUISITIONS
AND SALES AND ANY RELATED MANAGEMENT ARRANGEMENTS WE EXPECT TO ENTER MAY NOT OCCUR, MAY BE DELAYED OR THE TERMS OF SUCH TRANSACTIONS OR ARRANGEMENTS MAY CHANGE; (K) OUR PROPERTIES REQUIRE, AND WE HAVE AGREED TO PROVIDE, SIGNIFICANT
FUNDING FOR CAPITAL IMPROVEMENTS, RENOVATIONS AND OTHER MATTERS. ACCORDINGLY, WE MAY NOT HAVE SUFFICIENT WORKING CAPITAL OR LIQUIDITY; (L) CONTINUED AVAILABILITY OF BORROWINGS UNDER OUR REVOLVING CREDIT FACILITY IS SUBJECT TO OUR SATISFYING
CERTAIN FINANCIAL COVENANTS AND OTHER CREDIT FACILITY CONDITIONS THAT WE MAY BE UNABLE TO SATISFY; (M) ACTUAL COSTS UNDER OUR REVOLVING CREDIT FACILITY OR OTHER FLOATING RATE DEBT WILL BE HIGHER THAN LIBOR PLUS A PREMIUM BECAUSE OF FEES AND
EXPENSES ASSOCIATED WITH SUCH FACILITIES AND (N) OUR OPTION TO EXTEND THE MATURITY DATE OF OUR REVOLVING CREDIT FACILITY IS SUBJECT TO OUR PAYMENT OF A FEE AND MEETING OTHER CONDITIONS THAT MAY NOT BE MET.
OUR ANNUAL REPORT ON FORM 10-K FOR THE YEAR ENDED DECEMBER 31, 2017, AND OUR OTHER FILINGS WITH THE SECURITIES AND EXCHANGE COMMISSION (SEC) IDENTIFY OTHER IMPORTANT FACTORS THAT COULD CAUSE DIFFERENCES FROM OUR FORWARD LOOKING
STATEMENTS. OUR FILINGS WITH THE SEC ARE AVAILABLE ON THE SEC’S WEBSITE AT WWW.SEC.GOV. YOU SHOULD NOT PLACE UNDUE RELIANCE UPON OUR FORWARD LOOKING STATEMENTS. EXCEPT AS REQUIRED BY LAW, WE DO NOT INTEND TO UPDATE OR CHANGE ANY FORWARD
LOOKING STATEMENTS AS A RESULT OF NEW INFORMATION, FUTURE EVENTS OR OTHERWISE.
NON-GAAP FINANCIAL MEASURES
THIS PRESENTATION CONTAINS NON-GAAP FINANCIAL MEASURES INCLUDING NORMALIZED FUNDS FROM OPERATIONS (FFO), ADJUSTED EBITDA, NET OPERATING INCOME (NOI) AND CASH BASIS NOI. RECONCILIATIONS FOR THESE METRICS TO THE CLOSEST U.S. GENERALLY ACCEPTED
ACCOUNTING PRINCIPLES (GAAP) METRICS ARE INCLUDED IN AN APPENDIX HERETO.
2 Unless otherwise noted, all data presented is as of December 31, 2017.

Hospitality Properties Trust
HPT’s high quality properties, conservative profile and secure cash flows
provide a growing and well covered dividend.
3
• Diversified portfolio of well maintained, high quality properties.
• Long term portfolio agreements that can provide security of cash flow.
• Ramping portfolio and improvement opportunities.
• Conservative profile. Capacity to support continued disciplined growth.
• Dividend payout ratio only 52.6%(1) in the fourth quarter 2017.
(1) Excludes $74,573 of business management incentive fee expense for three months ended December 31, 2017.

Hospitality Properties Trust (1) Represents historical cost of properties plus capital improvements funded by HPT less impairment writedowns, if any, and excludes capital improvements made from
FF&E reserves funded from hotel operations which do not result in increases in minimum returns or rent.
HPT is one of the most geographically diverse lodging REITs and owns
hotels and travel centers operated under 22 recognized brands.
• $9.8 billion investment portfolio (historical investment basis(1)).
• Total of 522 properties located in 45 states, Puerto Rico and Ontario.
323 hotels with 49,903 rooms.
199 travel centers with 4,923 acres of land located adjacent to the U.S. interstate highway system.
4
HPT Hotel Brands
HPT Travel Center Brands

Hospitality Properties Trust
HPT has $6.3 billion invested(1) in 323 full service, select service and
extended stay hotels.
5 (1) Represents historical cost of properties plus capital improvements funded by HPT less impairment writedowns, if any, and excludes capital improvements made from
FF&E reserves funded from hotel operations.
Sonesta International Hotels
Corporation
49 hotels / 8,326 rooms
$1,457 million
InterContinental Hotels Group
plc (“IHG”)
99 hotels / 16,237 rooms
$2,040 million
Carlson Hotels
Worldwide
8 hotels / 1,579 rooms
$195 million
Marriott International, Inc.
122 hotels / 17,086 rooms
$1,791 million
HPT Hotel Managers
(by $ invested)(1)
Morgans Hotel
Group
1 hotel / 372 rooms
$120 million
Global Hyatt Corporation
22 hotels / 2,724 suites
$302 million
Wyndham Hotel Group
22 hotels / 3,579 rooms
$394 million
• 9 Hotel Management Agreements/Leases.
• HPT’s operating agreement structure reduces cash flow
volatility in a downturn and allows for upside participation in
a recovery.
• The majority of HPT’s 323 hotel properties are secured by
deposits or guarantees and have potential additional
returns based on performance.
Six agreements covering 220 hotels feature manager
guarantees and/or security deposits that protect HPT’s
cash flow when hotel operations fail to cover minimum
rents or returns.
Hotel management agreements provide for additional
returns to HPT based on hotel net operating income
above certain thresholds.
Unique Agreements

Hospitality Properties Trust
HPT hotels are operated by brand owners as opposed to third-party
management groups.
Data presented is as of December 31, 2017, unless otherwise noted. 6

Hospitality Properties Trust 7
Kimpton Alexis Hotel
Seattle, WA
Operator: InterContinental Hotels Group
Guest Rooms: 121

Hospitality Properties Trust 8
Courtyard Phoenix Chandler
Chandler, AZ
Operator: Marriott International, Inc.
Guest Rooms: 156
Hospitality Properties Trust
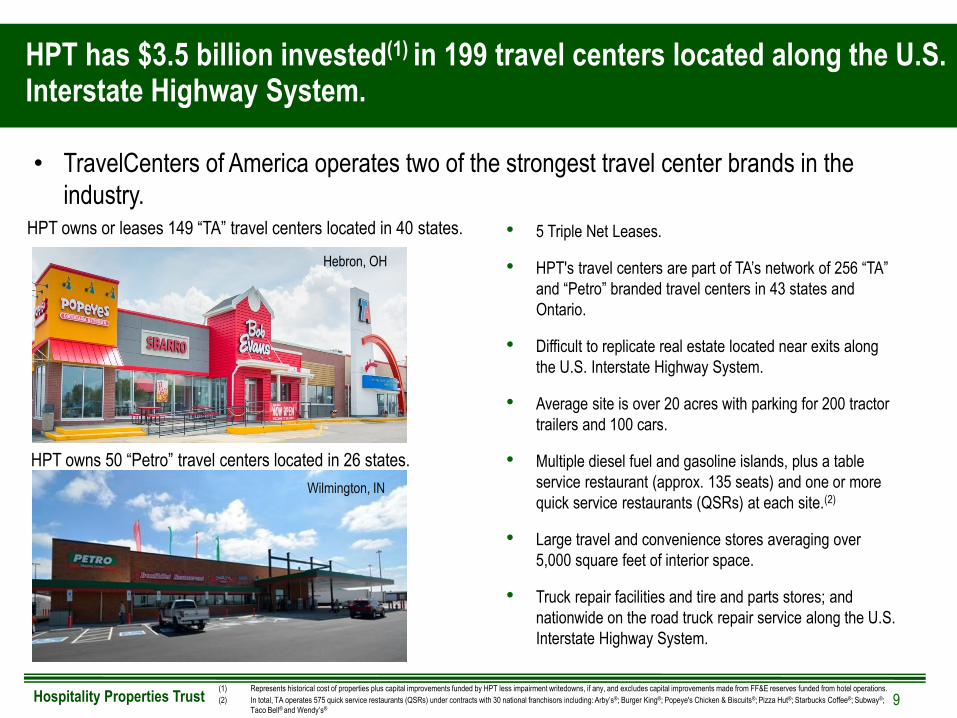
HPT has $3.5 billion invested(1) in 199 travel centers located along the U.S. Interstate Highway System.
9
HPT owns or leases 149 “TA” travel centers located in 40 states.
HPT owns 50 “Petro” travel centers located in 26 states.
Hebron, OH
Wilmington, IN
• TravelCenters of America operates two of the strongest travel center brands in the
industry.
• 5 Triple Net Leases.
• HPT's travel centers are part of TA’s network of 256 “TA”
and “Petro” branded travel centers in 43 states and
Ontario.
• Difficult to replicate real estate located near exits along
the U.S. Interstate Highway System.
• Average site is over 20 acres with parking for 200 tractor
trailers and 100 cars.
• Multiple diesel fuel and gasoline islands, plus a table
service restaurant (approx. 135 seats) and one or more
quick service restaurants (QSRs) at each site.(2)
• Large travel and convenience stores averaging over
5,000 square feet of interior space.
• Truck repair facilities and tire and parts stores; and
nationwide on the road truck repair service along the U.S.
Interstate Highway System.
(1) Represents historical cost of properties plus capital improvements funded by HPT less impairment writedowns, if any, and excludes capital improvements made from FF&E reserves funded from hotel operations.
(2) In total, TA operates 575 quick service restaurants (QSRs) under contracts with 30 national franchisors including: Arby’s®; Burger King®; Popeye's Chicken & Biscuits®; Pizza Hut®; Starbucks Coffee®; Subway®;
Taco Bell® and Wendy’s®

Hospitality Properties Trust
Economic growth continues. Increasing regulation may cater to full
service travel center advantages.
10
Issue Implication
Fuel and non-fuel demand is
expected to see continued steady
growth over the next decade.
Travel centers which provide
services to professional truck
drivers from restaurants to clean
showers and bathrooms to truck
repair facilities will be in demand.
Larger full service truck stops
with ample parking, for over 200
tractor trailer trucks will have a
competitive advantage – TA’s
reservation program proves
value.

Hospitality Properties Trust
The defining business characteristic of HPT remains its strong
operating agreement terms.
• Portfolio Agreements. 520 of HPT’s 522 properties are part of pooled portfolio agreements. Each
portfolio agreement includes between 8 and 99 geographically diverse properties.
• Minimum Returns and Rents. The majority of HPT’s agreements require its managers or tenants to
pay HPT fixed minimum returns or rents.
• Security Features. The majority of HPT’s agreements include security features to protect HPT’s
cash flows, including some or all of: cash security deposits; subordination of management fees to
HPT’s minimum returns/rents; and full or limited guarantees from parent companies.
• Long Term Agreements. New agreements are generally entered for 15 to 25 years. The weighted
average term remaining for our agreements (weighted by our investment) is approximately 15 years.
• High Likelihood of Contract/Lease Renewals. Renewals are permitted only for all properties in each
portfolio. Because HPT’s agreements generally represent significant percentages of its operators’
brands, renewals are highly likely.
• FF&E Reserves. Hotel operators are generally required to escrow 5-6% of gross revenues for
renovations.
11

Hospitality Properties Trust
Q4 LTM Security Features
Total/Average 14 agreements 522 49,903 / 4,923 840,797$ 100% 1.09x 1.21x
8 brand owners
1.57x
1.49x
1.49x
1.37x
1.55x
6%
Coverage (2)
Operating Agreement
-
2 Marriott No. 234 68 9,120 106,538 13% Limited guaranty + deposit.
1 Marriott No. 1 53 7,610 69,232$ 8% 0.99x
0.97x
No. of
Properties
No. of Rooms/
Land Acreage
Annual Minimum
Return/Rent (1)
% of Total
1.25x
1.13x
Marriott guaranty.
4 InterContinental 99 16,237 189,261 23% Security deposit.
3 Marriott No. 5 1 356 10,159 1% 0.95x
1.06x
0.91x
1.15x
-
6 Wyndham 22 3,579 29,010 4% Limited guaranty.(3)
5 Sonesta 49 8,326 109,632 13% 0.60x
0.73x
0.77x
0.84x
Limited guaranty.
8 Carlson 8 1,579 12,920 2% Limited guaranty.
7 Hyatt 22 2,724 22,037 3% 0.87x
0.96x
1.13x
1.36x
-
10 TA No. 1 40 826 52,763 6% TA guaranty.
9 Morgans 1 372 7,595 1% 0.50x
1.51x
Subtotal Hotels 323 49,903 556,384 68%0.91x
1.06x
0.82x
TA guaranty.
11 TA No. 2 40 923 53,681 6% 1.48x
1.41x12 TA No. 3 39 913 54,005
TA guaranty.
Subtotal Travel Centers 199 4,923 284,413 32% 1.46x 1.50x
TA guaranty.
14 TA No. 5 40 1,168 69,527 8% TA guaranty.
13 TA No. 4 40 1,093 54,437 6% 1.33x
1.53x
74% of HPT’s total minimum rents and returns are secured by deposits or
guarantees.
12
(1) Annualized minimum rent amounts represent cash rent amounts due to us and exclude adjustments, if any, necessary to recognize rental income on a straight line basis in accordance with GAAP.
(2) We define coverage as total property level revenues minus all property level expenses and FF&E reserve escrows which are not subordinated to minimum returns or rents due to us divided by the minimum returns or rents due to us (which data is
provided to us by our managers or tenants). Coverage amounts for our agreement with InterContinental Hotels Group, plc, or InterContinental, and our Sonesta and TA No. 4 agreements include data for periods prior to our ownership of certain
hotels and travel centers. Coverage amounts for our agreement with Carlson Hotels Worldwide, or Carlson, exclude data for per iods prior to our sale of certain hotels.
(3) As of December 31, 2017, the Wyndham guaranty had been depleted. HPT’s agreement with the Wyndham hotel subsidiary provides that if the hotel’s cash flows available after payment of hotel operating expenses are less than the
minimum returns due to HPT, to avoid default Wyndham is required to pay HPT the greater of the available hotel cash flow and 85% of the contractual minimum amount due. During January and February 2018, Wyndham paid HPT
85% of the minimum returns due under the hotels’ management agreement and the contractual rents due under the Wyndham lease for 48 vacation units.

13 Hospitality Properties Trust
Staybridge Suites Atlanta Perimeter Center
Atlanta, GA
Operator: InterContinental Hotels Group
Guest Rooms: 143

Hospitality Properties Trust 14
Royal Sonesta Houston Galleria
Houston, TX
Operator: Sonesta International Hotels Corp.
Guest Rooms: 485

Hospitality Properties Trust 15
Nashville Airport Marriott
Nashville, TN
Operator: Marriott International, Inc.
Guest Rooms: 392

Hospitality Properties Trust
Financial highlights.
(1) Each of our management agreements or leases provides for payment to us of an annual minimum return or minimum rent, respectively. Certain of these minimum payment amounts are secured by full or limited guarantees or security deposits as more fully described on pages 28 through 30. In
addition, certain of our hotel management agreements provide for payment to us of additional amounts to the extent of available cash flows as defined in the management agreement. Payments of these additional amounts are not guaranteed or secured by deposits. Annualized minimum rent
amounts represent cash rent amounts due to us and exclude adjustments, if any, necessary to recognize rental income on a stra ight line basis in accordance with GAAP.
(2) We define coverage as combined total property level revenues minus all property level expenses and FF&E reserve escrows which are not subordinated to minimum returns or rents due to us, divided by the minimum returns or rents due to us (which data is provided to us by our managers or
tenants). Coverage amounts for our Sonesta, InterContinental and TA Nos. 1, 2, 3 and 4 agreements include data for periods pr ior to our ownership of certain properties. Coverage amounts for our Carlson agreement exclude data for periods prior to our sale of certain hotels.
(3) See exhibits on page 24 for the calculation of EBITDA and Adjusted EBITDA, and a reconciliation of net income determined in accordance with GAAP to these amounts. See exhibits on page 25 for a reconciliation of FFO to nearest GAAP measure.
(4) Adjusted EBITDA and Normalized FFO available for common shareholders for three months ended December 31, 2017 and 2016 include $74,573 and $52,407, respectively, of business management incentive fee.
(5) Debt amounts are net of unamortized discounts and certain issuance costs.
(6) Total Gross assets is total assets plus accumulated depreciation.
(7) Excluding business management incentive fee expense, Total Debt (book value) / annualized Adjusted EBITDA would have been 4.8x and 4.2x for three months ended December 31, 2017 and 2016, respectively.
(In thousands except number of properties,
number of rooms and per share data.) As of and for the three months ended
December 31,
2017
2016 Change % Change
Property data:
Number of properties 522 504 18
Number of rooms 49,903 46,583 3,320
Annual minimum returns and rents(1) $ 840,797 $ 782,145 $ 58,652 7.5%
Coverage of annual minimum returns and rents - hotels(2) 0.91x 0.88x
Coverage of annual minimum returns and rents - travel centers(2) 1.46x 1.51x
Key financial data:
Total revenues $ 535,142 $ 479,278 $ 55,864 11.7%
Net Income $ 31,545 $ 58,020 $ -26,475 -45.6%
Adjusted EBITDA(3)(4) $ 135,312 $ 136,989 $ -1,677 -1.2%
Normalized funds from operations (FFO)(3)(4) $ 87,865 $ 93,380 $ -5,515 -5.9%
Total Debt (book value)(5)/total gross assets(6) 40.3.% 34.6% 5.7 pts.
Total Debt (book value)(5)/annualized Adjusted EBITDA(3)(4)(7) 7.4x 5.8x
Per share data:
Annualized Common dividend $ 2.08 $ 2.04 $ 0.04 2.0%
Normalized FFO(3)(4) $ 0.54 $ 0.57 $ -0.03 -5.3%
Normalized FFO payout ratio(3)(4) 96.3% 89.5% 6.8pts.
16

Hospitality Properties Trust
HPT believes it will continue benefitting from a well maintained portfolio.
• HPT funded $20.6 million of hotel improvements during Q4. In 2018, HPT expects to fund
approximately $180.1 million of hotel improvements. In 2019, HPT expects to fund
approximately $105.6 million of hotel improvements.
• HPT expects to have 22 hotels under renovation for all or part of the 2018 first quarter.
• HPT funded $21.7 million of travel center improvements in Q4. In 2018, HPT expects to fund
approximately $51.5 million of travel center improvements.
• Industry experts are forecasting a range of 2.5% to 2.7% RevPAR growth in 2018.
• HPT managers’ expect 2018 comparable RevPAR growth within the range of approximately
1% to 2%. GOP margins are expected to remain flat to down 50 basis points compared to
2017. HPT managers’ projections for 2018 are premised on steady business demand
resulting from improving GDP growth and lower taxation rates, offset somewhat by new room
supply growth and renovations. In 2018, we will have 71 hotels under renovation during some
part or all of the year compared to 41 hotels that were under renovation in 2017.
17
Hospitality Properties Trust
In 2018, HPT’s strategic growth will be driven by renovating recently
acquired properties.
Courtyard Guestroom Residence Inn Kitchen
• In 2017, HPT acquired 20 hotels with 3,860 keys and one travel center for an aggregate purchase price of
approximately $592 million.
HPT acquired 5 hotels with 1,818 keys for an aggregate purchase price of $338.6 million and has added these
hotels to its management agreement with InterContinental Hotels Group plc, or IHG. HPT’s annual minimum
returns under its IHG agreement increased by 8% of the purchase price.
In February, HPT acquired the 483 room Kimpton Hotel Allegro in Chicago, IL for $85.5 million. HPT
obtained a $6.8 million increase to IHG’s security deposit in connection with this transaction. The Allegro
has 15,000 sq. ft. of function space, 4,500 sq. ft. of retail space and four food and beverage outlets.
In March, HPT acquired the 121 room Kimpton Hotel Alexis in Seattle, WA for $71.6 million. HPT
obtained a $5.7 million increase to IHG’s security deposit in connection with this transaction. The Alexis
has 5,100 sq. ft. of function space, 18,225 sq. ft. of retail space and one food and beverage outlet.
In June, HPT acquired the 495 room Crowne Plaza Ravinia hotel in Atlanta, GA for $88.6 million. HPT
obtained a $7.1 million increase to IHG’s security deposit in connection with this transaction. This Crowne
Plaza has 30,500 sq. ft. of function space, four food and beverage outlets and is located adjacent to IHG
Americas’ headquarters.
In August, HPT acquired the 419 room Crowne Plaza & Lofts hotel in Columbus, OH for $49.0 million.
This Crowne Plaza has 8,400 sq. ft. of function space, one food and beverage outlet and is attached to
the Columbus Convention Center as well as the Nationwide Mutual Insurance Company’s headquarters.
The Lofts portion of the hotel will be converted to IHG’s Indigo brand.
Data presented is as of December 31, 2017, unless otherwise noted. 18

Hospitality Properties Trust
In 2018, HPT’s strategic growth will be driven by renovating recently
acquired properties. (continued)
Courtyard Guestroom Residence Inn Kitchen
In August, HPT acquired the 300 room Crowne Plaza Charlotte Executive Park Hotel in Charlotte, NC for
$44.0 million. This hotel has 15,500 sq. ft. of function space and two food and beverage outlets.
As of December 31, 2017, the IHG security deposit had reached its cap of $100 million and is available to
cover minimum returns from each and all HPT owned hotels managed by IHG.
HPT acquired 15 hotels with 2,042 keys for an aggregate purchase price of $225.6 million and added them to its
management agreement with Sonesta International Hotels Corporation, or Sonesta. HPT’s annual minimum
returns under its Sonesta agreement increased by 8% of the purchase price.
In June, HPT acquired the 389 room Royal Sonesta Chase Park Plaza hotel in St. Louis, MO for $87.6
million. The Chase Park Plaza hotel has 52,600 sq. ft. of function space, 21,500 sq. ft. of office space,
16,000 sq. ft. of retail space, four food and beverage outlets and a five screen movie theatre.
In September, HPT acquired 14 extended stay hotels with 1,653 suites located in 12 states, for $138.0
million. These 14 hotels have been rebranded to Sonesta’s, Sonesta ES Suites brand.
In May, HPT acquired from and leased back to TravelCenters of America, or TA, a newly developed travel center
in Columbia, SC for $27.6 million. This property was added to HPT’s TA No. 4 lease and the annual minimum
rent under the lease increased by $2.3 million. This Petro Stopping Center has 131 truck parking spaces,
approximately 297 car parking spaces, six truck service bays, a 16 lane bowling alley, a fitness center, multiple
diesel and gas fueling lanes, multiple quick service restaurants and a Quaker Steak & Lube restaurant.
Data presented is as of December 31, 2017, unless otherwise noted. 19

Hospitality Properties Trust
HPT amended its agreement with Carlson Hotels Worldwide.
Courtyard Guestroom Residence Inn Kitchen
• In June, 2017, HPT amended its management agreement with Carlson Hotels Worldwide, or Carlson.
The terms of the management agreement and limited guaranty provided by Carlson were extended to
December 31, 2035.
As of December 31, 2017, HPT had sold the three weakest performing hotels in the portfolio for $24.6
million.
In August, HPT sold the 159 room Radisson hotel in Chandler, AZ, for $9.5 million, excluding closing
costs.
Also, in August, HPT sold the 143 room Country Inn & Suites hotel in Naperville, IL for $6.6 million,
excluding closing costs.
In September, HPT sold the 209 room Park Plaza hotel in Bloomington, MN for $8.5 million,
excluding closing costs.
The $23.4 million of net proceeds will be used to partially fund renovations through 2018 to the remaining
eight hotels operated under the Carlson management agreement. HPT’s annual minimum return under
the agreement was not reduced as a result of the sales.
HPT has agreed to fund up to $35.0 million of renovation costs in excess of the net sale proceeds and
available FF&E reserves. HPT’s annual minimum returns and the limited guaranty cap under the Carlson
agreement will both increase by 8% of amounts funded (above the proceeds from the hotel sales).
Data presented is as of December 31, 2017, unless otherwise noted. 20

Hospitality Properties Trust
Book Capitalization as of December 31, 2017
HPT has a conservative financial profile.
21
($ in thousands)
Unsecured floating rate debt(1)
797,086$
Unsecured fixed rate debt(1)(2)
3,203,962
Total debt 4,001,048
Shareholders equity (book value) 2,755,422
Total Book Capitalization 6,756,470$
$2,75541%
$3,20447%
$79711%
Shareholders equity Unsecured fixed rate debt Unsecured floating rate debt
(1) Debt amounts are net of unamortized discounts and certain issuance costs.
(2) In February 2018, we issued $400,00 principal amount 4.375% senior notes due 2030 in a public offering and we used the net proceeds of that offering to repay amounts outstanding under our revolving credit facility
and for general business purposes.
(3) Total gross assets is total assets plus accumulated depreciation.
(4) Gross book value of real estate assets is real estate properties at cost, before purchase price allocations, less impairment writedowns, if any.
(5) See exhibits on page 24 for the calculation of EBITDA and Adjusted EBITDA, and a reconciliation of net income determined in accordance with GAAP to these amounts.
(6) Adjusted EBITDA for three months ended December 31, 2017 includes $74,573 of business management incentive fee expense. Excluding business management incentive fee expense, Adjusted EBITDA / interest
expense and Total debt (book value) /annualized Adjusted EBITDA would have been 4.5x and 4.8x, respectively, for three months ended December 31, 2017.
Leverage/Coverage Ratios As of and for the three months ended December 31, 2017
Total debt (book value)(1)
/ total gross assets(3)
40.3%
Total debt (book value)(1)
/ gross book value of real estate asset(4)
42.3%
Adjusted EBITDA(5)(6)
/ interest expense 2.9x
Total debt (book value)(1)
/ annualized Adjusted EBITDA(5)(6)
7.4x
Total debt (book value)/total gross assets

Hospitality Properties Trust
HPT Term Debt Maturities as of December 31, 2017(1)
($ in millions)
$0
$100
$200
$300
$400
$500
$600
$700
$800
$900
2018 2019 2021 2022 2023 2024 2025 2026 2027
HPT has well laddered debt maturities and the capacity for disciplined
growth.
22
• No secured debt.
• Unsecured senior notes(1):
$3,250 million as of December 31, 2017
($3,204 million net of discounts).
All fixed rate.
• Unsecured term loan:
$400 million.
April 2019 maturity.
• Revolving credit facility:
$1 billion ($398 million outstanding as of
December 31, 2017).(1)(2)
July 2018 maturity plus one year
extension option.
• No derivatives, no off balance sheet liabilities
and no material adverse change clauses or
ratings triggers.
(1) In February 2018, we issued $400,000 principal amount of 4.375% senior noted due 2030 in a public offering and
we used the net proceeds of that offering to repay amounts outstanding under our revolving credit facility and for
general business purposes.
(2) As of February 28, 2018, we had $121,000 outstanding under our revolving credit facility.

Hospitality Properties Trust
HPT’s high quality properties, conservative profile and secure cash flows
provide a growing and well covered dividend.
23
• Diversified portfolio of well maintained, high quality properties.
• Long term portfolio agreements that can provide security of cash flow.
• Ramping portfolio and improvement opportunities.
• Conservative profile. Capacity to support continued disciplined growth.
• Dividend payout ratio only 52.6%(1) in the fourth quarter 2017.
(1) Excludes $74,573 of business management incentive fee expense for three months ended December 31, 2017.

Hospitality Properties Trust
Calculation of EBITDA and Adjusted EBITDA.
24
CALCULATION OF EBITDA AND ADJUSTED EBITDA (1)
(in thousands)
For the Three Months Ended For the Year Ended December 31,
12/31/2017 9/30/2017 6/30/2017 3/31/2017 12/31/2016 2017 2016
Net income $ 31,545 $ 85,728 $ 60,699 $ 37,171 $ 63,186 $ 215,143 $ 223,110
Add (Less): Interest expense 46,250 46,574 45,189 43,566 37,349 181,579 161,913
Income tax expense (benefit) (2) (5,045 ) 619 786 356 537 (3,284 ) 4,020
Depreciation and amortization 99,848 98,205 95,155 93,451 91,150 386,659 357,342
EBITDA 172,598 231,126 201,829 174,544 192,222 780,097 746,385
Add (Less): Acquisition related costs (3) — — — — 482 — 1,367
General and administrative expense paid in common shares (4) 811 818 718 412 557 2,759 2,834
Estimated business management incentive fee (5) (38,243 ) 873 17,750 19,620 (56,272 ) — —
Loss on early extinguishment of debt (6) 146 — — — — 146 228
Gain on sale of real estate (7) — (9,348 ) — — — (9,348 ) —
Adjusted EBITDA $ 135,312 $ 223,469 $ 220,297 $ 194,576 $ 136,989 $ 773,654 $ 750,814
(1) Please see page 26 for definitions of EBITDA and Adjusted EBITDA and a description of why we believe the presentation of these measures provide useful information to investors.
(2) We realized a $5,431 tax benefit in the three months ended December 31, 2017 related to the enactment of the Tax Act.
(3) Represents costs associated with our acquisition activities. Acquisition costs incurred during the 2017 periods have been capitalized in purchase accounting pursuant to a change in GAAP.
(4) Amounts represent the equity compensation awarded to our trustees, our officers and certain other employees of RMR LLC.
(5) Incentive fees under our business management agreement with RMR LLC are payable after the end of each calendar year, are calculated based on common share total return, as defined, and are included in general and
administrative expense in our consolidated statements of income. In calculating net income in accordance with GAAP, we recognize estimated business management incentive fee expense, if any, in the first, second and third
quarters. Although we recognize this expense, if any, in the first, second and third quarters for purposes of calculating net income, we do not include these amounts in the calculation of Adjusted EBITDA until the fourth quarter,
which is when the business management incentive fee expense amount for the year, if any, is determined. Adjusted EBITDA includes business management incentive fee expense of $74,573 and $52,407 in the three months
ended December 31, 2017 and 2016, respectively. Business management incentive fees for 2017 and 2016 were paid in cash in January 2018 and 2017, respectively.
(6) We recorded losses of $146, $158 and $70 on early extinguishment of debt in the three months ended December 31, 2017, September 30, 2016 and March 31, 2016, respectively, in connection with the redemptions of certain
senior unsecured notes.
(7) We recorded a $9,348 gain on sale of real estate in the three months ended September 30, 2017, in connection with the sales of three hotels.

Hospitality Properties Trust
Calculation of Funds From Operations (FFO) and Normalized FFO.
25
CALCULATION OF FUNDS FROM OPERATIONS (FFO) AND NORMALIZED FFO AVAILABLE FOR COMMON SHAREHOLDERS (1)
(dollar amounts in thousands, except share data)
For the Three Months Ended For the Year Ended December 31,
12/31/2017 9/30/2017 6/30/2017 3/31/2017 12/31/2016 2017 2016
Net income available for common shareholders $ 31,545 $ 85,728 $ 60,699 $ 25,843 $ 58,020 $ 203,815 $ 202,446
Add (less): Depreciation and amortization 99,848 98,205 95,155 93,451 91,150 386,659 357,342
Gain on sale of real estate (2) — (9,348 ) — — — (9,348 ) —
FFO available for common shareholders 131,393 174,585 155,854 119,294 149,170 581,126 559,788
Add (Less): Acquisition related costs (3) — — — — 482 — 1,367
Estimated business management incentive fees (4) (38,243 ) 873 17,750 19,620 (56,272 ) — —
Loss on early extinguishment of debt (5) 146 — — — — 146 228
Excess of liquidation preference over carrying value of preferred shares redeemed (6) — — — 9,893 — 9,893 —
Deferred tax benefit (7) (5,431 ) — — — — (5,431 ) —
Normalized FFO available for common shareholders $ 87,865 $ 175,458 $ 173,604 $ 148,807 $ 93,380 $ 585,734 $ 561,383
Weighted average shares outstanding (basic) 164,192 164,149 164,123 164,120 164,120 164,146 156,062
Weighted average shares outstanding (diluted) 164,205 164,188 164,165 164,149 164,128 164,175 156,088
Basic and diluted per common share amounts:
Net income available for common shareholders $ 0.19 $ 0.52 $ 0.37 $ 0.16 $ 0.35 $ 1.24 $ 1.30
FFO available for common shareholders $ 0.80 $ 1.06 $ 0.95 $ 0.73 $ 0.91 $ 3.54 $ 3.59
Normalized FFO available for common shareholders $ 0.54 $ 1.07 $ 1.06 $ 0.91 $ 0.57 $ 3.57 $ 3.60
(1) Please see page 26 for definitions of FFO and Normalized FFO available for common shareholders, a description of why we believe the presentation of these measures provides useful information to investors regarding our financial
condition and results of operations and a description of how we use these measures.
(2) We recorded a $9,348 gain on sale of real estate in the three months ended September 30, 2017 in connection with the sales of three hotels.
(3) Represents costs associated with our acquisition activities. Acquisition costs incurred during the 2017 periods have been capitalized in purchase accounting pursuant to a change in GAAP.
(4) Incentive fees under our business management agreement with RMR LLC are payable after the end of each calendar year, are calculated based on common share total return, as defined, and are included in general and administrative
expense in our consolidated statements of income. In calculating net income in accordance with GAAP, we recognize estimated business management incentive fee expense, if any, in the first, second and third quarters. Although we
recognize this expense, if any, in the first, second and third quarters for purposes of calculating net income, we do not include these amounts in the calculation of Normalized FFO available for common shareholders until the fourth
quarter, which is when the business management incentive fee expense amount for the year, if any, is determined. Normalized FFO available for common shareholders includes business management incentive fee expense of $74,573
and $52,407 in the three months ended December 31, 2017 and 2016, respectively. Business management incentive fees for 2017 and 2016 were paid in cash in January 2018 and 2017, respectively.
(5) We recorded losses of $146, $158 and $70 on early extinguishment of debt in the three months ended December 31, 2017, September 30, 2016 and March 31, 2016, respectively, in connection with the redemptions of certain senior
unsecured notes.
(6) In February 2017, we redeemed all 11,600,000 of our outstanding 7.125% Series D cumulative redeemable preferred shares at the stated liquidation preference of $25.00 per share plus accrued and unpaid distributions to the date of
redemption (an aggregate of $291,435). The liquidation preference of the redeemed shares exceeded the carrying amount for the redeemed shares as of the date of redemption by $9,893, or $0.06 per share, and we reduced net income
available to common shareholders in the three months ended March 31, 2017 by that excess amount.
(7) We realized a $5,431 tax benefit in the three months ended December 31, 2017 related to the enactment of the Tax Act.

Hospitality Properties Trust
Non-GAAP financial measures definitions.
26
Definition of EBITDA and Adjusted EBITDA
We calculate EBITDA and Adjusted EBITDA as shown on page 24. We consider EBITDA and Adjusted EBITDA to be appropriate supplemental measures of our operating performance,
along with net income, net income available for common shareholders and operating income. We believe that EBITDA and Adjusted EBITDA provide useful information to investors
because by excluding the effects of certain historical amounts, such as interest, depreciation and amortization expense, EBITDA and Adjusted EBITDA may facilitate a comparison of
current operating performance with our past operating performance. In calculating Adjusted EBITDA, we include business management incentive fees only in the fourth quarter versus the
quarter when they are recognized as expense in accordance with GAAP due to their quarterly volatility not necessarily being indicative of our core operating performance and the
uncertainty as to whether any such business management incentive fees will be payable when all contingencies for determining such fees are known at the end of the calendar year.
EBITDA and Adjusted EBITDA do not represent cash generated by operating activities in accordance with GAAP and should not be considered alternatives to net income, net income
available for common shareholders or operating income as indicators of operating performance or as measures of our liquidity. These measures should be considered in conjunction with
net income, net income available for common shareholders and operating income as presented in our consolidated statements of income. Other real estate companies and REITs may
calculate EBITDA and Adjusted EBITDA differently than we do.
Definition of FFO and Normalized FFO
We calculate FFO available for common shareholders and Normalized FFO available for common shareholders as shown on page 25. FFO available for common shareholders is
calculated on the basis defined by The National Association of Real Estate Investment Trusts, or Nareit, which is net income available for common shareholders calculated in accordance
with GAAP, excluding any gain or loss on sale of properties and loss on impairment of real estate assets, if any, plus real estate depreciation and amortization, as well as certain other
adjustments currently not applicable to us. Our calculation of Normalized FFO available for common shareholders differs from Nareit's definition of FFO available for common shareholders
because we include business management incentive fees, if any, only in the fourth quarter versus the quarter when they are recognized as expense in accordance with GAAP due to their
quarterly volatility not necessarily being indicative of our core operating performance and the uncertainty as to whether any such business management incentive fees will be payable
when all contingencies for determining such fees are known at the end of the calendar year, and we exclude the excess of liquidation preference over carrying value of preferred shares
redeemed, certain deferred tax benefits, acquisition related costs expensed under GAAP and loss on early extinguishment of debt. We consider FFO available for common shareholders
and Normalized FFO available for common shareholders to be appropriate supplemental measures of operating performance for a REIT, along with net income, net income available for
common shareholders and operating income. We believe that FFO available for common shareholders and Normalized FFO available for common shareholders provide useful information
to investors because by excluding the effects of certain historical amounts, such as depreciation expense, FFO available for common shareholders and Normalized FFO available for
common shareholders may facilitate a comparison of our operating performance between periods and with other REITs. FFO available for common shareholders and Normalized FFO
available for common shareholders are among the factors considered by our Board of Trustees when determining the amount of distributions to our shareholders. Other factors include,
but are not limited to, requirements to maintain our qualification for taxation as a REIT, limitations in our credit agreement and public debt covenants, the availability to us of debt and
equity capital, our expectation of our future capital requirements and operating performance and our expected needs for and availability of cash to pay our obligations. FFO available for
common shareholders and Normalized FFO available for common shareholders do not represent cash generated by operating activities in accordance with GAAP and should not be
considered alternatives to net income, net income available for common shareholders or operating income as indicators of our operating performance or as measures of our liquidity.
These measures should be considered in conjunction with net income, net income available for common shareholders and operating income as presented in our consolidated statements
of income. Other real estate companies and REITs may calculate FFO available for common shareholders and Normalized FFO available for common shareholders differently than we do.

Hospitality Properties Trust Investor Presentation March 2018
Sonesta ES Suites Charlotte Arrowood
Charlotte, NC
Operator: Sonesta International Hotels Corp.
Guest Rooms: 119