horse miracle - a method to evaluate testing efficiency
TRANSCRIPT

Project History
The division of work: Project Leader: XU Zheng Project Members: WANG Te, LIU Yang, LI Ning, ZHOU Peng
The task: XU Zheng: Making the project goal and collecting the members’ communication information, organizing the topic selection, making the plan and getting the
Hong Kong PolyU COMP 5222 Software Testing and Quality Assurance
Group Project
Horse Miracle
A Method to Evaluate Testing Efficiency
Institutor: Dr. Hareton Leung
Team Leader XU Zheng 08101733u
Team Member WANG Te 08101677u, LIU Yang 08101794u, LI Ning 08101677u, Zhou Peng 07101700u
I

confirmation. Asking for the advice from the Institutor for the project scope. Collecting the related materials, studying the related materials. Organizing a meeting to discuss the good idea for the project. Making the meeting plan and record. Documentation for the story part. Modifying and reviewing the document. Adding the music to this document. Adding the ‘data collection and analysis’ part. Document Version control. Making the new release. WANG Te: Attending the topic selection. Confirming to the plan. Asking for the advice to the Institutor for the project scope. Attending a meeting to discuss the good idea for the project. Adding the ‘defect tracking form’ to the theory part. LIU Yang: Attending the topic selection, confirming to the plan. Collecting the related materials. Studying the related materials. Attending a meeting to discuss the good idea for the project. Documentation for the theory part. Making the first new release. LI Ning: Attending the topic selection, confirming to the plan. Making the general idea for the project architecture. Collecting the related materials. Doing some review and modification work at last. ZHOU Peng: Modifying and reviewing the document at last.
The schedule and contribution of the Project: Version Date Editor Detail
1.0 Sep 27th,2009- Oct 12th, 2009
XU Zheng Making the project goal and collecting the members’ communication information
1.1 Oct 12th,2009- Oct 27th,2009
XU Zheng, WANG Te, LIU Yang, LI Ning
Discussion and making the project selection
1.2 Oct 28th,2009- Oct 30th,2009
XU Zheng Making the plan and get the confirmation
2.0 Oct 30th, 2009 LI Ning Making the general idea of project architecture
2.1 Oct 31th, 2009 XU Zheng WANG Te
Asking for the advice to the Institutor
2.2 Nov 5th, 2009- Nov 8th, 2009
XU Zheng LIU Yang
Collecting the related materials
2.3 Nov 8th, 2009- Nov 9th,2009
LIU Yang Studying the related materials
2.4 Nov 22th, 2009- Nov 25th,2009
XU Zheng Studying the related materials
2.5 Nov 25th,2009 ZHOU Peng ZHOU Peng joins our team and discuss about the project topic
3.0 Nov 26th,2009 XU Zheng, WANG Te, LIU Yang
Making a meeting to discuss the good idea for the project
3.1 Nov 26th,2009 XU Zheng Making the meeting plan and record
3.2 Nov 26th,2009 LI Ning Collecting the related materials
II

3.3 Nov 29th,2009 XU Zheng Documentation for the story part
3.4 Nov 30th,2009- Dec 1th,2009-
LIU Yang Documentation for the theory part
3.5 Dec 2th,2009- Dec 3th,2009
XU Zheng Reviewing and modifying the whole document, Adding the ‘schedule and contribution’ part and the ‘Project Members’ part
3.6 Dec 4th,2009 LIU Yang Adding the reference part and making the new release in the first time
3.7 Dec 4th,2009 WANG Te Adding defect tracking form to the theory part
3.8 Dec 4th,2009 XU Zheng Modifying and Reviewing the document Adding the music to this document
3.9 Dec 4th,2009 LI Ning Doing some modification
4.0 Dec 5th,2009 Zhou Peng Discuss with the team and share some docs
4.1 Dec 7th,2009 XU Zheng Adding the ‘data collection and analysis’ part and making the new release in the second time
4.2 Dec 8th,2009 XU Zheng Modifying and Reviewing the document
4.3 Dec 9th,2009 Zhou Peng Modifying and Reviewing the document
5.0 Dec 7th,2009- Dec 11th,2009
X U Zheng, LIU Yang, LI Ning, WANG Te, ZHOU Peng
Signature for the project in the document, and mod i fy ing and rev iewing the document.
III

Table of Contents 1. Character List 1 ........................................................................
2. In the Future 1 .........................................................................
3. Introduction to the ZTY centre 2 ...................................................
4. Evaluation Method 4 ..................................................................
5. Data Collection and Analysis: 15 ....................................................
6. Result: Back to Future 16 ............................................................
7. Project Members 18 ...................................................................
8.Group members’ signatures 19 ..................................................
9. References 20 ..........................................................................
RAMESH PUSALA (2006) 20 Operational Excellence through Efficient Software Testing Metrics 20 Infosys Technologies 20
IV
COMP 5222 Software Testing and Quality Assurance
1. Character List
Sam: The CEO of the moon software centre – ZTY; Cathy: The assistant of Sam; Gerty: The CIO of the moon software centre – ZTY;
2. In the Future
It is the year of 2030, the software centre -ZTY of our human being is on the moon. Because of the wide usage about software in the space science, now the earth is really the home of our human being, our first station is the moon, our human being could live not only on the Mars, but also on the Goldstar, some great scientists try to let us live out of the Milky Way galaxy. Software is not only used in the computer Science, it is the useful tool in all the production areas, such as the screwdriver in the repairing process in the year of 1980. Here is one of our Hongkong China centre on the moon, look, it is so nice.
Sam: It is so exciting that our ZTY centre grows larger year after year, it improves the
life of everyone. Cathy: Sure Sam, we should celebrate for it. Sam: Yeah, our centre was born in 2009, it grows with the Financial Tsunami, it is
stronger for the Financial Tsunami, it is famous for the Financial Tsunami, it
1

COMP 5222 Software Testing and Quality Assurancewins the Financial Tsunami, the first day it comes to the moon is the last day the Financial Tsunami down.
Gerty: But our experience is so hard in that period. Gerty moved with tears. Sam takes a deep breathing and gives her a big thumb. Sam: All the hard work and hard experience are valuable for us, we help the human
being win the Financial Tsunami, we save the world, we accelerate the steps for exploring the universe.
The three person fall in the deep happiness, their memory comes to the year 2010.
3. Introduction to the ZTY centre
The ZTY found in the year of 2008, it is a small software centre in Hongkong China, Sam is the CEO of this centre.
The ZTY centre famous in the year of 2010, the founder of the ZTY is Sam, Cathy and Gerty. The ZTY helps our human being win the financial crisis. The ZTY centre creates a software-test evaluate method, first it is used in the ZTY itself. It helps the software companies evaluate their software-test and do the improvement; it helps these software centre save the efforts, improve the quality of the software; it helps these software centre win the business market. Some big companies also use this method in the following time, they achieved their business goals, the financing chain runs optimum gradually, the Financial Tsunami downs gradually, and the ZTY centre is famous in the whole world from now on.
It happens in a centre meeting in 2009, the CEO of the ZTY centre, complain all the staffs, “You are so stupid, do you know the quality? What the hell are those testers doing? Do you know what the time is? Everyone can see that the result of the Software-
2

COMP 5222 Software Testing and Quality Assurancetest is totally useless. Oh, god, our benefit just like the bill disappeared in the sea, do you know how much money we will earn also? We will lost in the next month …”, one of the common staff Jim said :”We will not care what you lost, do you really care our staffs, do you know I must work for you when I am on sick, or else you will cut me off, I must earn money for my baby, he is waiting for the milk, do you want to kill us?” Jim said with the tears, other staffs begin the complain convention with the CEO, Cathy is the assistant of the Sam, she keeps in calm, she said slowly, “Thanks Jim, my dear colleague, I know what you are feeling, our boss is also in the same boat with us, but our centre is really in the crisis, to save us, to save our centre, let’s work hard together and try our best, do you have some good suggestion and good idea? I really want to hear voice from your heart”, a sunny boy Edwin said:”I have the good idea, but before all of you seems do not care about me, I really keep the good idea, Cathy is really the kind manager, so I think it is my time”, Edwin takes a deep breath, and run to the front, he glanced the Sam, and said loudly, “Do you love working as the robot, do you love the process in our centre, do you think it is the effectively?” the persons said loudly: ”No, I hate it, it makes me boring, it makes me hate the work, it makes me hate my boss, I do not think it is effective”, Edwin said, “You are the same with me”, he padded Gerty, “would you like to work with me in the following 3 days?”, Gerty kindly, “Of course!”. Edwin said, “I will give you an objective evaluate about our software-test process efficiency, how to evaluate the test efficiency is the key point for our work! When we can evaluate it , then we know where is the weakness, so we can improve it ”, Edwin did not left the office in the following 3 days, he begins the work with the sun and finishes the work with the moon. First, he collect some important data, he just post the questionnaire to all the staffs, hold a meeting. Second, he just uses the appose method to evaluate the process. Third, he holds a meeting with Sam and Gerty, he want to know the goal of the ZTY centre. According to the goal, Edwin makes the evaluate method, and how to popularize it. He mails the report of test process efficiency evaluation and improve solutions to Sam after 3 days, he feels so proud after pressing the ‘Send’ button, 3 minutes after he get the reply, :”Good job, we will try the improvement, you and Gerty will lead this project”, 1 month after, the staff could finish the plan of the centre, the number of the smile face on the staff is more and more, the profit of the ZTY grows every month, it is a shining start in the universe.
IBM and Oracle come to the ZTY to learn the success experience, Microsoft also come, Honeywell comes then, but they does not know how to execute the method. Sam looks the wide market then, he asks Edwin to his office, he is so exciting, he looks the Edwin with the smile, “Thanks for your good suggestion, your good idea save our centre, your good idea makes our achievement”, he touch with his beard and then said, ”so many big companies want to learn with us, but it is not easy to copy, could our success experience embed to the software tool- Defect Tracking System, and then we sale the copy of the tool”. Edwin look the eyes of Sam, he could touch the following success in his mind. 1 month after, the ZTY begins to sale the copy of the method tool. ‘Tool = One golden disk + one engineer’, engineer is to help the customer work with the process. So what is this test process efficiency evaluation method?
3

COMP 5222 Software Testing and Quality Assurance
What is the magic? What makes a week dog become a dark house? Now let’s see.
4. Evaluation Method
1.What is software testing evaluation? As we all know, a major percentage of Software projects run over schedule and budget, yet they still have quality problems. Software testing is one activity that can provide visibility into product and process quality. We can see that we truly need to evaluate the test process. The evaluation needs some metrics. Test metrics are among the "facts" that project managers can use to understand their current position and prioritize their activities, so that they can reduce the risk (or impact) of running out of time before the software is ready for release. Test metrics can be a very powerful risk management tool. Metrics helps you measure your current performance and allow you to use the data to enhance your future work estimates and quality levels, otherwise those estimates will just be guesses! Use the software testing evaluation system, we can evaluate the efficiency of the software testing easily and effectively.
2.Why we need software testing evaluation? Some of the key benefits of having good metrics:
• Test Metrics Data Collection is a balanced, leading initiative which guides in predicting the direction and scope of an organization in the long term and helps to gain a more holistic view of business and identify high-level goals.
• Provide a Basis for Estimating and facilitates planning for closure of the performance gap.
• Provide a Means of Control / Status Reporting. • Identify Risky Areas That Require More Testing. • Provide Meters to Flag Actions - this helps make faster, more informed
decisions. • Quickly identifies and helps resolve potential problems and identify areas of
improvement. • Test Metrics are mechanisms to measure the effectiveness of testing
quantitatively. • Supports the collection of usage data and metrics for particular business needs.
4

COMP 5222 Software Testing and Quality Assurance• A process is appropriate and is critical to success when it identifies
measurement strategic objectives and measures against those using technology and industry accepted methodology.
There are so many benefits, why not?
3.How to evaluate the software testing Suggested Metrics Lifestyle:
Step 1: Identify the right metrics
The right metrics can be identified only after: ➢ Deciding the audience (executive team, test team, etc) ➢ Identifying the metrics which capture the status of each type of testing ➢ Ensuring that all the different categories of metrics are considered based on
project needs ➢ Setting up easy mechanisms for data collection and data capture ➢ Analyzing the value/benefit of each metric and the project lifecycle phase in
which it provides the most value ➢ Identifying the goals or problem areas where improvement is required ➢ Refining the goals, using the “Goal-Question-Metric” technique In this step, we should know what we need and what to be evaluated. To evaluate the software test efficiency we should identify the right metrics. We should use the Capability Maturity Model (CMM) and Software Process Improvement and Capability Determination (SPICE) assessment models to guide development of the method.
• Provide a framework, based on a set of principles in which software engineering practitioners could assess and evaluate their software testing processes.
• Provide a foundation for test process improvement through data analysis and action planning.
• Contribute to the growing body of knowledge in software process engineering.
5

COMP 5222 Software Testing and Quality AssuranceStep 2: Define the metrics
➢ Provide the definition for each metric ➢ Define the benchmark or goal for each metric ➢ Verify whether the goals or benchmarks are realistic, by comparing with industry
standards or with data of similar projects within the organization ➢ Based on the type of testing, metrics are mainly classified into:
● Manual testing ● Automation testing ● Performance testing
In this step we should know that what metrics we need to figure out. The following shows these useful metrics in our software testing evaluation:
1. % Defects uncovered in testing
2. Change size per test
3. Test efficiency
4. % Test automation
5. Defect removal effectiveness (DRE)
6. % test cases successfully executed
7. % dummy defects = open defects / total defects
These metrics could be used for each kind of software testing process, these metrics could be used in every testing phase. It is called ‘general universal metrics packet’.
In the step 5 of following, the calculation of these metrics will be discussed.
Step 3: collecting valid software-test data
After identifying suitable metrics, the data that is required for each metric must be analyzed by: ➢ Identifying the source of data for each of the base metrics ➢ Defining the common template for capturing all base metrics ➢ Obtaining feedback from the team which captures the data ➢ Streamlining significant data ➢ Ensure that the data capturing mechanism is set up and streamlined ➢ Communicate and give proper guidelines to the team members on the data that is
Required ➢ Setup verification points to ensure that all data is captured ➢ Identify the sources of inaccurate data for each base metric and take corrective
steps to eliminate inaccuracies ➢ For each base metric, define a source of data and the procedure to capture data ➢ Ensure that minimum effort is spent on capturing the data by automating the data
capturing process wherever possible (If you are using Test Director for test management, data can be extracted by using Test Director APIs)
➢ Capture the data in a centralized location easily accessible to all team members ➢ Collect the data with minimal manual intervention ➢ Defining efficient means to extract relevant data:
● To avoid ambiguous data, the measurement value type has to be verified for data consistency.
● The technique for pulling out relevant data is based on the following criteria to aid the capture of relevant metrics.
In this step, we should collect the data as follow steps: 1) Establish the Coals of the Data Collection: We divide goals into two categories:
those that may be used to evaluate a particular software development methodology relative to the claims made for it, and those that are common to all method-logiest to be studied.
2) Develop the List Questions of Interest: Once the goals of the study have been
6

COMP 5222 Software Testing and Quality Assuranceestablished, they may be used to develop a list of questions to be answered by the study. Questions of interest define data parameters and categorizations that permit quantitative analysis; of the data. In general, each goal will result in the generation of several different questions of interest. As an example, if the goal is to characterize changes, some corresponding questions of interest are: "What is the distribution of changes according to the reason for the change?", "What is the distribution of changes across system components?", "What is the distribution of effort to design changes?".
3) Establish Data Categories: Once the questions of interest have been established, categorization schemes for the changes and errors to be examined may be constructed. Each question generally induces a categorization scheme. If one question is, "What was the distribution of changes according to the reason for the change?", one will want to classify changes according to the reason they are made. A simple categorization scheme of this sort is error corrections versus none error corrections.
4) Design and Test Data Collection Form: To provide a permanent copy of the data and to reinforce the programmers’ memories, a data collection form is used. Form design was one of the trickiest parts of the studies conducted, primarily because forms represent a compromise among conflicting objectives. Typical conflicts are the desire to collect a complete, detailed set of data that may be used to answer a wide range of questions of interest, and the need to minimize the time and effort involved in supplying the data. Satisfying the former leads to large, detailed forms that require much time to fill out. The latter requires a short, check-off-the-boxes type of form.
5) Collect and Validate Data: Date are collected by requiring those people who are making software changes to complete change report form for each change made, as soon as the hang is completed. Validation consists of checking the forms of correctness, consistency, and completeness. As part of the validation process, in cases where such checks reveal problems, the people who filled out the forms are interviewed.
Step 4: Communication
To ensure better end-results and to increase buy-in, the metrics identification and planning process must involve all stake holders. ➢ Communicate the need for metrics to all the affected teams ➢ Educate the testing team regarding the data points that need to be captured for
generating the metrics ➢ Obtain feedback from the stakeholders ➢ Communicate the expectations to stakeholders — how often the data needs to be
collected, how often the reports will be generated, etc. In this step, we should communicate with the people who involved, because
everyone’s opinions are very important to our evaluation method.
Step 5: Analyze & process the data
➢ Once the data is captured, the data must be analyzed for completeness ➢ Verify whether the data filed is accurate and up-to-date ➢ Define the process/template in which the derived data must be captured ➢ Calculate al the metrics(derived metrics) based on the base metrics ➢ Verify whether the metrics are conveying the correct information ➢ Automate the process of calculating derived metrics from the base metrics to
reduce effort In this step, we will discuss the Analyze & process the data, then get the method to
figure out those metrics from these data.
1. % Defects uncovered in testing
% Defects uncovered in testing = defects detected by testing / total defects.
7

COMP 5222 Software Testing and Quality Assurance• Data collection form:
( Table 1-1 ) • Evaluation:
Calculate the % defect uncovered in testing using Formula 1-1 with total number in Table 1-1
The % defect uncovered in testing more closed to 100% is better % defect uncovered in testing < 50%: Improvement required 50% < % defect uncovered in testing < 80%: Acceptable % defect uncovered in testing >80%: Excellent
• Improvement Suggestion: Encourage and train the test designer to study product/function to get more user scenarios to improve test cases design
We normally use the first year after product release to quantify the total defects. For example, 1000 defects were detected during the development, and 100 defects were reported within the first year of the system release, then the total defect count is 1100 (sum of 1000 and 100). To collect the valid data, we should use the ‘Defect Tracking System’. This system is a database system which records all the attributes of all the defects. All the processes about the evaluation activities are embed into this database system.
2. Change size per test
Change size per test = number of LOC (lines of code) changed / number of test
• Data collection form:
(Table 2-1)• Evaluation:
Calculate the Change size per test using Formula 2-1 with total number in Table 2-1. The Change size per test larger is better
• Improvement Suggestion: Reduce the overlap of each test, Remove the redundant tests
This metric provides insight into the efficiency of testing based upon the size of the
No. Defect Detected by test
1 <The defect number> <The test name detected this defect. Fill NONE, if the defect not covered by test>
Total
<the tota l number of defects>
<the total number of tests, except NONE>
Strength The metric measures the effectiveness of the test process in detecting defects.
Weakness The metric does not show the importance of the defects; it is possible that unimportant defects were detected and important ones were not, or vice versa.
No. Test case Defect LOC changed
1 <The test case name>
<The defect number list covered by this test. Fill NONE, if the defect not covered by test>
<lines of code changed to fixed/resolved the defects/CRs driven by this test case>
Total <the total number of test cases>
No Needed <total number of LOC changed caused by tests>
8
COMP 5222 Software Testing and Quality Assurancechange. The higher the metric, the more efficient the testing process.
We can collect the data from the ‘Defect Tracking System’.
3. Test efficiency
Test efficiency = number of tests required / number of defects
This metric shows proficiency on the part of the testing staff. The lower the metric, the more proficient the staff in testing.
We can collect the data from the ‘Defect Tracking System’.
• Data collection form:
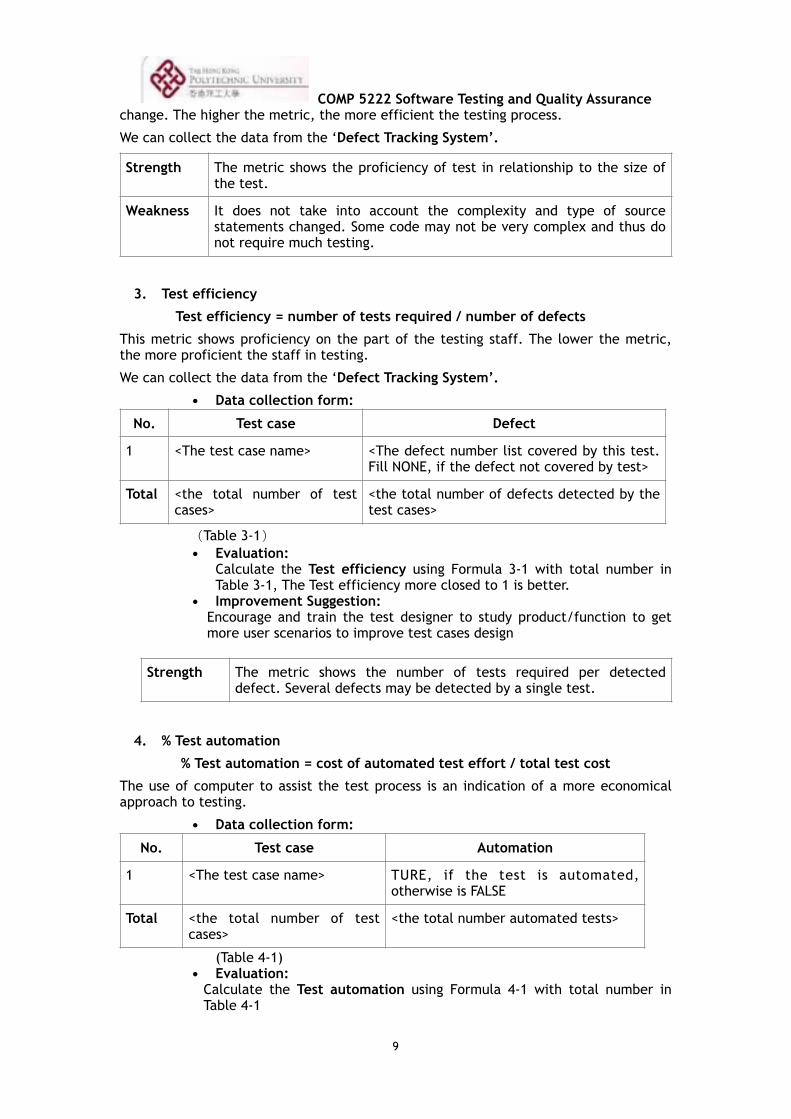
(Table 3-1) • Evaluation:
Calculate the Test efficiency using Formula 3-1 with total number in Table 3-1, The Test efficiency more closed to 1 is better.
• Improvement Suggestion: Encourage and train the test designer to study product/function to get more user scenarios to improve test cases design
4. % Test automation
% Test automation = cost of automated test effort / total test cost
The use of computer to assist the test process is an indication of a more economical approach to testing.
• Data collection form:
(Table 4-1) • Evaluation:
Calculate the Test automation using Formula 4-1 with total number in Table 4-1
Strength The metric shows the proficiency of test in relationship to the size of the test.
Weakness It does not take into account the complexity and type of source statements changed. Some code may not be very complex and thus do not require much testing.
No. Test case Defect
1 <The test case name> <The defect number list covered by this test. Fill NONE, if the defect not covered by test>
Total <the total number of test cases>
<the total number of defects detected by the test cases>
Strength The metric shows the number of tests required per detected defect. Several defects may be detected by a single test.
No. Test case Automation
1 <The test case name> TURE, if the test is automated, otherwise is FALSE
Total <the total number of test cases>
<the total number automated tests>
9
COMP 5222 Software Testing and Quality AssuranceThe Test efficiency more closed to 1 is better
• Improvement Suggestion: Depends on projected requirement
5. Defect removal effectiveness (DRE)
Effective defect removal leads to reductions in development cycle time and better product quality.
We next present a phase-based defect removal model. This model can be used to focus attention on which phase of the development process for improvement, and is useful for quality planning and quality management.
For development phases before testing, the activities can inject defects, while the reviews and inspections at the end of the phase can remove defects.
For the testing phase, the testing itself is mainly for defect removal. There is also a chance to introduce defects when found defects are fixed incorrectly.
Defect exiting a phase depends on three classes of defects:
Defects at the exit of a development phase = defects escaped from previous phase + defects injected in current phase - defects removed in current phase
There are two ways to compute the defect removal effectiveness (DRE), which do not give the same results.
(1) DRE = N/(N+S) x 100%
where N is the number of defect removed by the development phase, and S is the number of defect removed by subsequent phases.
(2) DRE = N/ (E+I) x 100%
where E is the number of defects existing on phase entry, and I is the number of defects injected in the phase.
Note: A defect removed is equal to defects detected minus incorrect repairs.
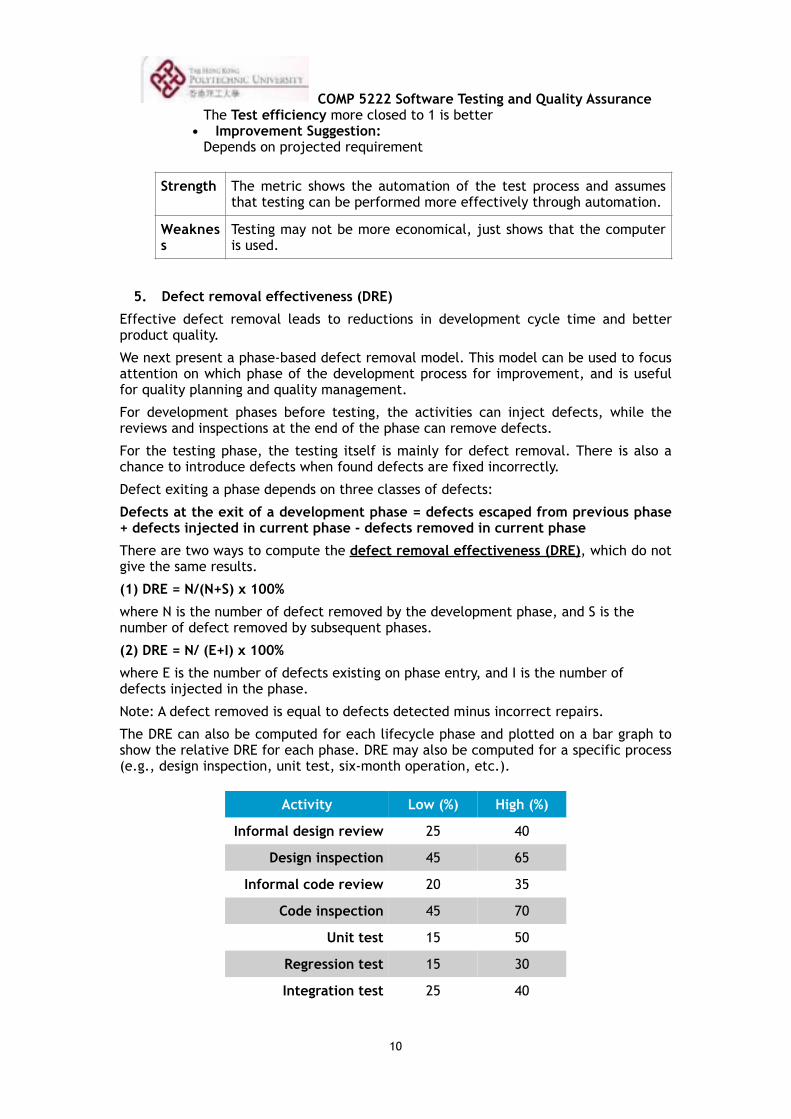
The DRE can also be computed for each lifecycle phase and plotted on a bar graph to show the relative DRE for each phase. DRE may also be computed for a specific process (e.g., design inspection, unit test, six-month operation, etc.).
Strength The metric shows the automation of the test process and assumes that testing can be performed more effectively through automation.
Weakness
Testing may not be more economical, just shows that the computer is used.
Activity Low (%) High (%)
Informal design review 25 40
Design inspection 45 65
Informal code review 20 35
Code inspection 45 70
Unit test 15 50
Regression test 15 30
Integration test 25 40
10

COMP 5222 Software Testing and Quality Assurance
We can collect the data from the ‘Defect Tracking System’.
• Data collection form:
(Table 5-1)
• Evaluation: Calculate the Test automation using Formula 5-1 with total number in Table 5-1, the DRE more closed to 1 is better
• Improvement Suggestion:
System test 25 55
Test of new function 20 35
No. Defect found in Development phase
Defect reported after development phase
1 <The defect number found in dev phase>
<The defect number reported after development phase >
Total <the total number of defect> <the total number defect>
11

COMP 5222 Software Testing and Quality Assurance
6. % test cases successfully executed
This metric counts the total number of planned test cases run to completion.
The data can be collected from the test log.
Typically, 90% of the tests are executed at least once (but not successfully) after 60% of the test execution effort. And 60% should be executed successfully after 50% of the test execution effort.
Few defects should be detected in the last part of test execution.
The following figure shows an example test execution. At any time, there are some test cases which passed the test, some failed, and some have not been executed. Eventually, the failed test cases should approach zero, before product release.
Test Status Report
7. % dummy defects
Status of a Defect
1. Open
o reported
o verified
o dummy (not a defect)
o holding (not being dealt with)
o underway (being dealt with)
Strength This metric shows the value of testing during a particular phase, such as the design phase.
Weakness
It may not show the importance of the defects detected, merely the frequency of defects detected.
Strength This metric may be used to estimate remaining test time.
12

COMP 5222 Software Testing and Quality Assurance2. Fixed (or resolved)
%dummy defects = unfounded defects / total defects
The data can be collected by the ‘Defect Tracking System’. Rising % should be a signal for alarm.
• Data collection form:
(Table 6-1) • Evaluation:
Calculate the Test automation using Formula 6-1 with total number in Table 6-1
The %dummy defects more closed to 0 is better • Improvement Suggestion:
Make the tester more professional, adding some training for the testing technical.
Step 6: Reporting metrics
➢ Develop an effective approach for reporting, like a metrics dashboard ➢ It is advisable to obtain feedback from stakeholders and their representatives on
the metrics to be presented by providing samples ➢ Metrics should be presented based on the audience and in a consistent format ➢ Reports should contain the summary of observations ➢ Reporting should be in a clearly understandable format, preferably graphs and
charts with guidelines to understand the report ➢ Reports should clearly point out all the issues or highlights ➢ Based on the request, user should be able to access the data ➢ Reports should be presented in such a way that metrics are compared against
benchmarks and trends shown ➢ Reports should be easily customizable based on the user requirement ➢ Ensure that the efforts spent on reporting is minimal; wherever required try to
automate (if it is a Microsoft Excel based report, through the usage of macros. In this step, after we figure out these metrics, we should report them to the
manager. Analyze the metrics into its inside reason. Find the hidden cause of these metrics. Discuss them with the testers and developers, let them know that which part of the test is strong, and which part is weak. The outputs include a process profile, a statement of test process strengths and weaknesses, and the assessment record. The assessment team prepares the process profile, which gives an overall summary of the state of the organization’s testing process. The profile is based on analysis of the assessment data and results of the ranking process. The profile can be presented as a graphical display or in the form of a matrix that indicates maturity goals and sub goals that are satisfied, not satisfied, not applicable, or not rated. The profile also includes the TMM level, a summary of test process strengths and weaknesses, and recommendations for improvements. The assessment record is also completed in this step. This written account includes:
• Names of assessment team members • Assessment inputs and outputs • Actual schedules and costs • Metrics performed • Metrics durations • People responsible • Data collected • Problems that occurred
No. Defect Dummy defect
1 <The defect number > [TRUE/FALSE]
Total
<the total number of defect> <the total number of not a defect>
13

COMP 5222 Software Testing and Quality AssuranceThe assessment outputs can be delivered as a presentation or a written report
Step 7: Continuous Improvement
➢ Continuous improvement is the key to the success of any process ➢ After successful implementation of metrics and after achieving the benchmark,
revisit the goals and benchmarks and set them above industry standards ➢ Regularly collect feedback from the stake holders ➢ Metrics can be added/deleted/modified based on the need ➢ Metrics reports must be accessible to everyone ➢ Evaluate new metrics to capture ➢ Refine the report template ➢ Ensure that the effort for capturing and reporting metrics is minimal
In this step, we should think further about the Improvement. An action planning team should develop action plans that focus on improvements in the high-priority areas identified in the previous step. The action planning team can include assessors, Software Engineering process Group members, software quality assurance staff, or opinion leaders chosen from among assessment participants. Inputs to action planning include the final assessment report, the process profile, and prioritized areas for improvement. The action plan describes specific actions needed to improve existing practices (and to support the addition of missing practices) so the organization can move to the next level. The action plan, like all other software engineering project plans, should include measurable goals, tasks, responsibilities, resources required, risks and benefits, and reporting and tracking mechanisms. Action planning can be accomplished through the convening of a workshop directed by the action planning team. The result should be a draft of an action plan. The workshop members should also identify pilot projects that will implement the new process. Developed and approved action plans can be applied to selected pilot projects, which are monitored and tracked to ensure task progress and achievement of target goals. Favorable results set the stage for organizational adaptation of the new process.
4.Considered Activities and Challenges The following activities and Challenges need to be carefully considered in successfully implementing Test Metrics: • Decide the audience • Understand the expectations (problem areas/pain points where improvement is
required) • Lack of communication and training • Collecting data that is not used • Using metrics to motivate rather than to understand • Using metrics data to evaluate individuals • Vague metrics definition • Measuring too little, too late • Measuring too much, too soon • Identify whether it is derived/inferred information(metric) or direct(basic) metric • Identify the value/benefit of each metric • Identify the benchmark/goals for each metric • Understand the definition of each metric • Categorize the metrics based on audience, type of testing • Ensure that the data captured method is identified for each metric • Identify the side effects (inaccurate data) for each metric and define the steps to
correct them. Communicate the benefits of each metric to the stakeholders. • Define a template for presenting the metrics (graph or tabular formats) • Automate the metrics process to minimize human efforts and errors
5.Future Plans
14
COMP 5222 Software Testing and Quality AssuranceOur future plans include research on formal integration of this method and CMM components so that organizations can carry out parallel assessments in several process areas. We also are planning the development of more intelligent tools to aid the assessors. Wider industrial application of this method is planned to help us evaluate its usefulness and effectiveness for test process improvement.
5. Data Collection and Analysis:
The method helps so many big companies to evaluate the efficiency and improve the process; the productivity grows with the improvement of the process. Such as the process evaluation save the ZTY centre, it also saved some good centre, so it saves the world, the saving work helps the ZTY centre earn a lot of money, in the year of 2012, the economy continue to grow sustained and fast. Edwin is the starting of the ZTY, for the surprising to the whole ZTY, the best version of the process Tool is called Edwin version. There is a company called ABC, a customer of ABC, it is a success company example. The testing process is based on the waterfall model. The testing process is :
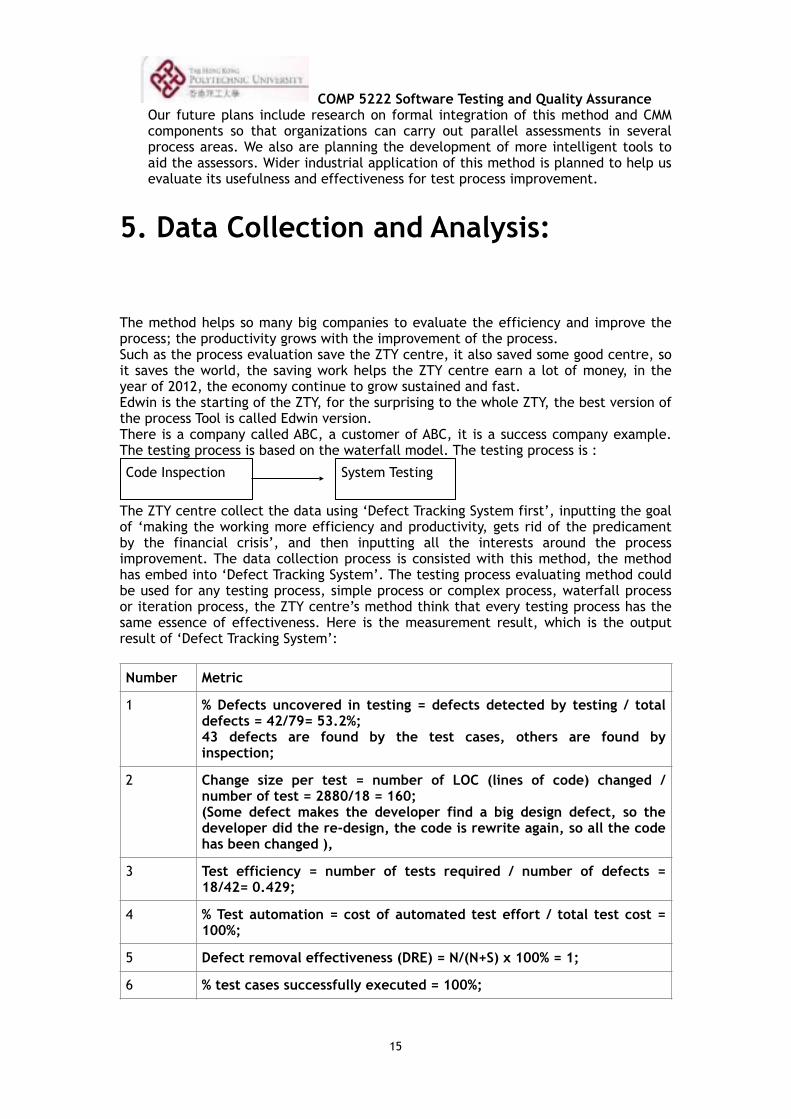
The ZTY centre collect the data using ‘Defect Tracking System first’, inputting the goal of ‘making the working more efficiency and productivity, gets rid of the predicament by the financial crisis’, and then inputting all the interests around the process improvement. The data collection process is consisted with this method, the method has embed into ‘Defect Tracking System’. The testing process evaluating method could be used for any testing process, simple process or complex process, waterfall process or iteration process, the ZTY centre’s method think that every testing process has the same essence of effectiveness. Here is the measurement result, which is the output result of ‘Defect Tracking System’:
Code Inspection System Testing
Number Metric
1 % Defects uncovered in testing = defects detected by testing / total defects = 42/79= 53.2%; 43 defects are found by the test cases, others are found by inspection;
2 Change size per test = number of LOC (lines of code) changed / number of test = 2880/18 = 160; (Some defect makes the developer find a big design defect, so the developer did the re-design, the code is rewrite again, so all the code has been changed ),
3 Test efficiency = number of tests required / number of defects = 18/42= 0.429;
4 % Test automation = cost of automated test effort / total test cost = 100%;
5 Defect removal effectiveness (DRE) = N/(N+S) x 100% = 1;
6 % test cases successfully executed = 100%;
15

COMP 5222 Software Testing and Quality Assurance
And then, the ZTY centre gives a report for the testing process evaluation to ABC company, which is generated by the defect tracking system:
ABC company holds the result to improve immediately, 3 month after, the process is improved, the productivity is increasing, it gets rid of the predicament by the financial crisis.
6. Result: Back to Future
Gerty: Thanks for the good suggestion for the Edwin, he saves the world. Sam: Really, the process method helps us move from earth to moon. Cathy: Look, our home is so beautiful. Sam: Cathy and Gerty look up to the earth, then, the earth is much more beautiful.
7 %dummy defects = unfounded defects / total defects = 0;
Metric Name Results Improvement Suggestions
% Defects uncovered in testing
Acceptable Encourage and train the test designer to study product/function to get more user scenarios to improve test cases design
Change size per test Splendid None
Test efficiency Not so good Encourage and train the test designer to study product/function to get more user scenarios to improve test cases design
% Test automation Splendid None
D e f e c t r e m o v a l effectiveness (DRE)
Splendid None
% t e s t c a s e s successfully executed
Splendid None
%dummy defects Splendid None
16

COMP 5222 Software Testing and Quality Assurance
17
COMP 5222 Software Testing and Quality Assurance
7. Project Members
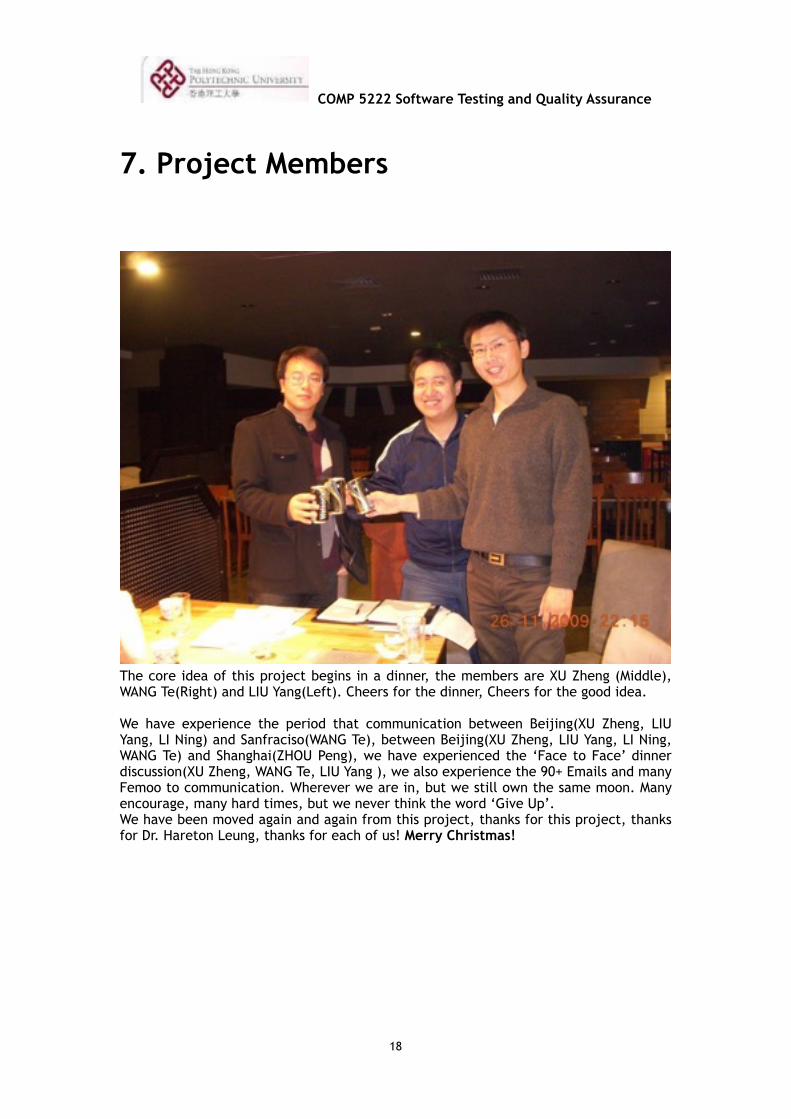
The core idea of this project begins in a dinner, the members are XU Zheng (Middle), WANG Te(Right) and LIU Yang(Left). Cheers for the dinner, Cheers for the good idea.
We have experience the period that communication between Beijing(XU Zheng, LIU Yang, LI Ning) and Sanfraciso(WANG Te), between Beijing(XU Zheng, LIU Yang, LI Ning, WANG Te) and Shanghai(ZHOU Peng), we have experienced the ‘Face to Face’ dinner discussion(XU Zheng, WANG Te, LIU Yang ), we also experience the 90+ Emails and many Femoo to communication. Wherever we are in, but we still own the same moon. Many encourage, many hard times, but we never think the word ‘Give Up’. We have been moved again and again from this project, thanks for this project, thanks for Dr. Hareton Leung, thanks for each of us! Merry Christmas!
18

COMP 5222 Software Testing and Quality Assurance
8.Group members’ signatures
<Checklist for the whole project> Yes The report has been checked for spelling/typos. This is more than spell checking. After you have run Spell Check, you need to read carefully for spelling/typos that Spell check don’t detect. For example, does your sentence say, “Samples will be purchased form ABC” instead of “Samples will be purchased from ABC”? Reading aloud will also help you catch these types of errors. Yes The report has been checked for incomplete sentences (sentence fragments). Yes Every group member has read the entire report. Yes The prescribed format has been used, including proper citation of references. Yes All sources cited in the report are included in the Reference section. Yes All sources listed in the Reference section are cited in the body of the report.
<Contribution of each member> In the ‘task’ section and the ‘schedule and contribution’ of section.
<Group members’ signatures>
XU Zheng WANG Te LIU Yang
LI Ning ZHOU Peng
19

COMP 5222 Software Testing and Quality Assurance
9. References
ARIYA HOMYEN and ROBERT GROM (November 1998) A Model to Assess Testing Process Maturity
Illinois Institute of Technology VICTOR R. BASILI (November 1984)
A Methodology for Collecting Valid Software Engineering Data IEEE TRANSATIONS ON SOFTWARE ENGINEERING
RAMESH PUSALA (2006) Operational Excellence through Efficient Software Testing
Metrics Infosys Technologies
J.W.E GREENE (2009) Management Processes Using The SEI Core Measures
QUANTITATIVE SOFTWARE MANAGEMENT LTD ANITA D. CARLETON and ROBERT E. PARK (July 1994)
The Journal of the Quality Assurance Institute
L.H. Putnam (1992) Measures For Excellence: Reliable Software, On Time, Within Budget
Prentice Hall New York John Title (2000)
Software Measurement and Outsourcing SM User Conference October
Paul Goodman (2001) Practical Implementation of Software Metrics
McGraw Hill London Director: Duncan Jones (2009) The inspiration and some story roles are from the film of the ‘MOON’” The story is a science fiction story. The collected data only used in this Project Material.
20