horizontal wavenumber spectra of winds, temperature, and
TRANSCRIPT

JOURNAL OF GEOPHYSICAL RESEARCH, VOL. 104, NO. D13, PAGES 16,297-16,308, JULY 20, 1999
Horizontal wavenumber spectra of winds, temperature, and trace gases during the Pacific Exploratory Missions: 2. Gravity waves, quasi-two-dimensional turbulence, and vortical modes
John Y. N. Cho and Reginald E. Newell Department of Earth, Atmospheric, and Planetary Sciences, Massachusetts Institute of Technology, Cambridge
John D. Barrick
NASA Langley Research Center, Hampton, Virginia
Abstract. We examine the horizontal wavenumber spectra of horizontal velocity and potential temperature collected by aircraft above the Pacific Ocean to determine whether gravity waves, quasi-two-dimensional (Q-2-D) turbulence, or vortical modes dominate atmospheric fluctuations at scale sizes of 1-100 km and altitudes of 2- 12 km. We conclude from the study of Doppler-shifting effects that Q-2-D turbulence and/or vortical modes are more prevalent than gravity waves over the ocean, except in the equatorial zone. The results are consistent with recent numerical simulations of Q-2-D turbulence, which show that the characteristic inverse cascade of energy is greatly facilitated by the presence of background rotation. Furthermore, a Stokes-parameter analysis reveals the general paucity of coherent wavelike motions, although specific cases of gravity-wave propagation are observed. Finally, a case study of a long flight segment displays a k -3 horizontal velocity variance spectrum at scales longer than about 100 km. A Stokes-parameter analysis indicates that these large-scale fluctuations were likely due to vortical modes rather than inertio-gravity waives.
1. Introduction
At long (greater than few hundred kilometers) and short (less than few hundred meters) horizontal scales, the average kinetic energy spectrum of lower atmo- spheric horizontal motions is understood to be gener- ated by geostrophic turbulence [Charhey, 1971] and isotropic three-dimensional (3-D) turbulence [Kol- mo9orov, 1941], respectively. In the intermediate (mesoscale) regime, there is ongoing debate whether the observed spectra are being created by a spectrum of gravity waves [Dewan, 1979; VanZandt, 1982] or quasi- two-dimensional (Q-2-D) turbulence [Ga9e, 1979; Lilly, 1983]. Aside from the fundamental theoretical inter- est, this problem has implications for applied areas such as weather forecasting and pollutant transport. For example, the inverse cascade of Q-2-D turbulence could transfer energy from small-scale phenomena (like convective plumes) unresolved by numerical prediction
Copyright 1999 by the American Geophysical Union.
Paper number 1999JD900068. 0148-0227 / 99 / 1999 J D900068 $09.00
models to synoptic structures thereby introducing ad- ditional uncertainty into the forecasts.
In this paper, we will address the question of whether horizontal wind fluctuations at scales of ~1-100 km are
mainly due to gravity waves or Q-2-D turbulence, which is also called stratified turbulence and is sometimes in-
terpreted to be equivalent to vortical modes [e.g., Nas- trom et al., 1987; Miiller et al., 1988]. Although spectra close to the k -5/a power law of the turbulent inertial subrange are often observed, fully 3-D turbulence can- not be sustained at these scale sizes due to the strati-
fied nature of the atmosphere at these scales [Dewan, 1979]. Gage [1979] and Lilly [1983] invoked the con- cept of 2D turbulence [Kraichnan, 1967], where injec- tion of energy at even smaller scales (e.g., by convective plumes) produces an inverse cascade of kinetic energy to longer scales, resulting in a k -5/a spectrum. The buoyancy subrange of 3-D turbulence is also applicable to the short end of this scale range and predicts a spec- tral slope between -3 and-4/3 [Bolgiano, 1962; $hur, 1962; Lumley, 1964; Weinstock, 1978]. Dewan [1979], on the other hand, proposed that a cascade of gravity waves is responsible for producing the mesoscale fluctu- ations.
16,297

16,298 CHO ET AL.' GRAVITY WAVES, TURBULENCE, AND VORTICAL MODES
In the intervening years, many developments have taken place, but no clear answer has been produced. With the advent of powerful ground-based remote sens- ing instruments such as the mesosphere-stratosphere- troposphere (MST) radar and Doppler lidar, both fre- quency spectra (Taylor transformable to horizontal wavenumber spectra and vice versa under certain as- sumptions) and vertical wavenumber spectra of hori- zontal and vertical motions have become widely avail- able. The gravity-wave models have the advantage of yielding predictions for spectral forms for horizontal and vertical velocities in both horizontal and vertical
dimensions, whereas the Q-g-D turbulence theory does not provide spectral predictions for vertical motions and vertical wavenumbers. Therefore the gravity-wave mod- els have been more extensively examined due to their wider testability. For ground-based vertical wavenum- ber spectra, there have been favorable comparisons be- tween gravity-wave spectral models and observations in the troposphere [e.g., Fritts et al., 1988; Tsuda et al., 1989], although serious questions still remain [e.g., Allen and Vincent, 1995; Nastrom et al., 1997]. For horizon- tal wavenumber spectra, there have been fewer studies, and attempts at direct comparisons between gravity- wave and Q-g-D turbulence theories have yielded mixed results. The data of Gage and Nastrom [1985] and Gage and Nastrom [1986] favored Q-g-D turbulence, whereas Vincent and Eckermann [1990], Bacrneister et al. [1996], and Gao and Meriwether [1998] concluded that gravity waves were more dominant in their data.
In this paper, we use the horizontal velocity and po- tential temperature data collected by aircraft during the NASA-sponsored Pacific Exploratory Mission (PEM) [Hoell et al., 1996, 1997, 1999] to determine whether gravity waves or Q-g-D turbulence (or vortical modes)
70N
60N
50N
40N
30N
20N
I0N
EQ
10s
20S
30S
40S
50S
60S
70S
80S
100E 120E 140E 160E 180 160W 140W 120W 100W 80W
Figure 1. Map of flight tracks flown during the Pa- cific Exploratory Missions: PEM-West A, September- October 1991 (thin solid line); PEM-West B, February- March 1994 (thin dashed line); and PEM-Tropics A DC- 8, September-October 1996 (heavy solid line).
Table 1. Number of Straight-and-Level 512-s Flight Segments Versus Latitude and Height
Latitude Segments Height, km Segments
•50øN 47 30ø-50øN 282 10ø-30øN 380
10øS-10øN 187 30ø-10øS 196
<30øS 75
8-12 671
5-8 264
2-5 232
Totals 1167 1167
A straight-and-level flight segment was one that remained within -I-15 m in height and -I-7.5 ø in az- imuthal heading.
dominated the observed horizontal wavenumber spec- tra. The climatology versus altitude and latitude of the velocity, temperature, and trace gas fluctuation spec- tra were presented in the first paper [Cho et al., 1999], hereafter referred to as P EM1. The instrumental and
data descriptions were also given in PEM1. The flight routes are shown in Figure 1. The distribution of flight segments versus latitude and height are given in Ta- ble 1. The PEM-Tropics A P-3B data set was not used because of problems with the wind direction data. Be- cause the spectral climatology of PEM1 showed con- sistent characteristic differences between the boundary layer and free atmosphere, but similar behavior at dif- ferent heights in the free atmosphere, in this paper we will focus on the free atmospheric data (defined here to be above 2 km) and take averages throughout these al- titudes. Also, the figures shown will mainly be from the PEM-Tropics A DC-8 data, but unless otherwise stated the data from the other campaigns (PEM-West A and B) also yield similar trends. We will first examine the variation of horizontal wavenumber spectra with wind speed and variance, then compare the wind variance parallel and perpendicular to the aircraft heading, and finally apply Stokes-parameter analysis to the zonal and meridional wind components.
2. Horizontal Wind and Potential
Temperature Spectra Versus Wind Speed and Variance
Past studies of mesoscale fluctuations utilizing exten- sive aircraft data sets (the global atmospheric sampling program (GASP) [Nastrom and Gage, 1985], the NASA ER-2 stratospheric missions [Bacmeister et al., 1996], and PEM1) have each shown a remarkable universality in the horizontal wavenumber spectra of winds, tem- perature, and trace gas concentrations. There were, however, some differences between the three studies. In the wavelength range of 2.5 to 100 km, the GASP horizontal wind and potential temperature spectra had log-log slopes of about -5/3, while the PEM1 spectra

CHO ET AL.' GRAVITY WAVES, TURBULENCE, AND VORTICAL MODES 16,299
had slopes between -2 and -5/3, and the ER-2 spectra had slopes that were close to -5/3 above a wavelength 1ø6 of 6 km and slopes approaching -3 at shorter scales. Data parsed according to different local conditions such as wind speed, wind variance, topography, and stability also showed varying results. GASP data over moun- tainous terrain and high winds (> 25 m s-•) produced horizontal wind spectra with a break at -•23 km in the troposphere and -•15 km in stratosphere from a -5•3 to a -3 slope [Nastrom et al., 1987]. The ER-2 data set was not differentiated according to underlying to-
._
pography, but the horizontal wind and potential tern- _8 perature spectra separated with respect to low winds > (<10 m s -•) and high winds (>30 m s -•) had virtually the same form and power level. Parsing with respect to horizontal velocity variance in the ER-2 data showed 1øø only a difference in power level (as must be the case), but no change in form. Changes in stability (as esti- mated from interpolated model outputs from the Na- tional Meteorological Center) also did not affect the horizontal velocity and potential temperature spectral forms of the ER-2 data.
We were motivated to separate the data in these ways mainly to compare our results with past studies that at- tempted to sort out the predictions of the various the- ories according to the effects that local conditions have
c
106
105
104
103
102
10 1
10 ø
PEM Tropics A DC-8 Height > 2 km ILatitudel > 2• Nav e= 24, 43 ....
- IUI < 10 m/s --.. ". I UI > 25 m/s
/ • • • k-513
k-2 ,, , i , t • , , , , ,
10 -2 10-• 10 ø M2• (km-1)
Figure 2. Horizontal velocity variance spectra (the sum of zonal and meridional velocity variance spectra) for PEM-Tropics A DC-8 data separated with respect to wind speed less than 10 m s -• (solid line) and greater than 25 m s- • (dashed line). Only data segments above 2 km in altitude and 250 in latitude were included in the means, where Nave given in the top right corner were the number of straight-and-level segments averaged for the low-wind and high-wind cases. Sample variability bars (plusses for the low-wind case and crosses for the high- wind case) shown are plus/minus twice the standard deviation divided by Na•v/ff. As guides to the eye, dash- dotted lines indicating log-log slopes of-5/3 and -2 are also included.
PEM Tropics A DC-8 Height > 2 km ILatitudel < 2• Nav e= 112, 61
, , , i
10 -2
-. IUI < 10 m/s '. I UI > 25 m/s
• • k-513
k-2 , ...... , i ......
10 -• 100 k/2• (km -1)
Figure 3. Same as Figure 2, except for data taken at latitudes less than 250 .
on the spectra. We chose wind speed and variance be- cause they were directly calculable from the data set itself. Topography could not be used because PEM, as the "Pacific" of "P" implies, was conducted almost exclusively over water. This can also be viewed as an asset, since the overall means were not "contaminated" by land effects. We did not attempt a classification according to stability, since we felt that actual mea- surements were required to give accurate enough vgl- ues. To study dependence on stability, we are planning to use the NASA subsonic assessment, ozone, and ni- trogen experiment (SONEX) data set, which included temperature profile measurements from the aircraft.
The 1-s horizontal wind and potential temperature samples were segmented into lengths of 512 points, then had their means subtracted, Hann windowed, and transformed to the frequency domain using fast Fourier transforms (FFTs). The mean aircraft air speed over each segment was then used to Taylor transform the spectra into horizontal wavenumber space. Because the air speed varied (usually increasing with height), spec- tral averaging was performed after interpolating to a fixed set of wavenumber bins that were well within the
Nyquist limits of the extreme cases. Taylor's hypothesis is valid for turbulence, and it should also work well for gravity-wave spectra provided that the aircraft speed was greater than about 100 m s -• [Gardner and Gard- ner, 1993], which was true for all our flight segments. To insure that each transformed segment was indeed horizontal and one dimensional, we enforced a straight- and-level requirement defined to be within 4-15 m in height and +7.50 in azimuthal heading.
2.1. Horizontal Wind Speed Effects
Horizontal velocity variance spectra separated ac- cording to the mean horizontal wind speed ]U] showed a small but consistent difference in power level for av-
_

16,300 CHO ET AL.' GRAVITY WAVES, TURBULENCE, AND VORTICAL MODES
erages taken over all data, with higher variance over the entire 1-100-km scale range for IUI > 25 m s -• than for IuI < 10 m s -x. However, when the results were further organized with respect to latitude, we dis- covered that this difference did not exist in the tropics (latitudes less than 25ø). Figure 2 shows the extratrop- ical case for horizontal velocity variance spectra, while Figure 3 displays the tropical case. The potential tem- perature variance counterparts are given in Figures 4 and 5. The results are similar, although the difference in spectral power for the extratropical case is more pro- nounced than for the horizontal velocity spectra.
Because the P EM flights were almost exclusively over the ocean and were mainly in the troposphere, for com- parison with past results the best case to take is the GASP tropospheric data over the ocean. Their re- sults showed higher average variances for high winds (IUI > 25 rn s -x) than for low winds (IuI < 25 rn s -x) for horizontal velocity and potential temperature vari- ances at a length scale of 64 km [Nastrom et al., 1987]. On the other hand the stratospheric ER-2 data, which were not divided according to terrain, did not reveal sig- nificant differences between the low (IuI < 10 rn s -x) and high (IuI > 25 rn s -x) wind cases for either hori- zontal velocity or potential temperature variance spec- tra over length scales of 1-100 km [Bacmeister et al., 1•].
The theories of Q-2-D turbulence and buoyancy- subrange 3-D turbulence do not predict any change in the horizontal wavenumber spectra of horizontal veloc- ity or potential temperature variance with respect to wind speed. Gravity-wave spectral theories do not pre- dict direct effects, either. High wind speeds at the sur- face can certainly be expected to correlate with higher variance in velocity and temperature at flight level if orographic excitation of gravity waves is a major con- tributor. Also shifts in the mean horizontal wind over
105
•,• 104
c). 03 o31
(• 02 >1
•) 01
._•
E 0 o o
10 -1
PEM Tropics A DC-8 Height > 2 km ILatitudel > 2• Nav e= 24, 43 ]%. [
--. IUI < 10 m/s ".. I UI > 25 m/s
'--.... i 7.
,, , i ........ i ...... , ,'-1
10 -2 10 -1 10 ø k/2n (kin -•)
Figure 4. Same as Figure 2, except for potential tem- perature data.
105
•',• 104
r•10 3
> 1.0 2
•-101
._m
• 0 o o
10 -1
PEM Tropics A DC-8 Height > 2 km ILatitudel < 2.• Nav e = 112, 61
- .. IUI < 10 m/s '. I UI > 25 m/s
'..... k-513
k-2 ,,,
10 -2 10 -1 10 ø k/2• (kin -1)
Figure 5. Same as Figure 3, except for potential tem- perature data.
height can alter the form of a vertically propagating gravity-wave spectrum through wave refraction [Eck- ermann, 1995], and the mean horizontal wind can alter ground-based frequency spectra through Doppler shift- ing of waves [Fritts and VanZandt, 1987], but none of these effects are applicable to changes in the mean wind at the observational height for aircraft-derived horizon- tal wavenumber spectra.
One possible explanation for the increase in variance at high wind speeds in our data is the association of increased variance with jet streams. That is, the inclu- sion of flight segments within and near jet streams in the high-wind category could have boosted the mean variance due to the large excursions in wind speed and temperature. The lack of difference in spectral powers at low and high wind speeds in the tropics bolsters this argument, since jet streams over the Pacific usually do not intrude into those latitudes. Also the ER-2 spec- tra that showed no dependence on wind speed were in the stratosphere, so in situ jet stream effects would not have been relevant.
2.2. Horizontal Wind Variance Effects
We defined the mean horizontal wind variance as the
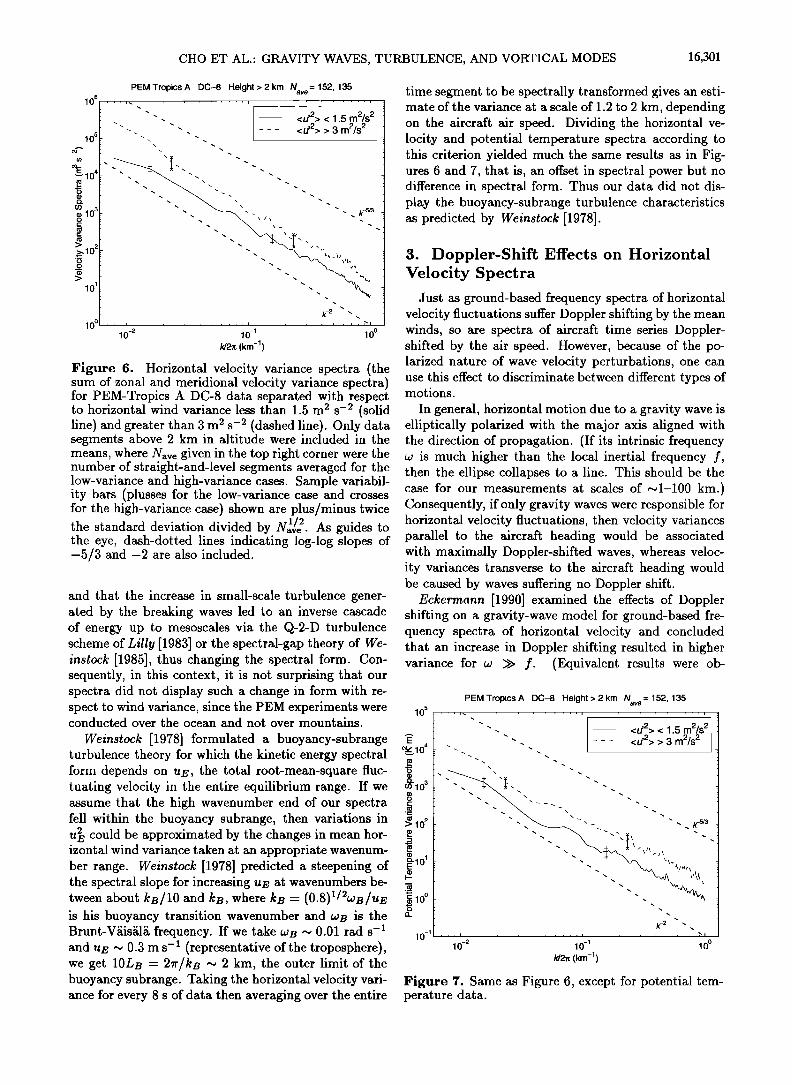
sum of the zonal and meridional velocity variances over each flight segment. Horizontal velocity and potential temperature spectra segregated with respect to hori- zontal wind variance revealed only differences in power level, which was a necessary outcome of the sorting pro- cedure. However, the spectral forms did not look differ- ent. Figure 6 shows horizontal wind variance spectra, and Figure 7 displays potential temperature variance spectra sorted according to this scheme.
Nastrom et al. [1987] associated enhanced horizon- tal velocity variance with a steepening of the horizontal velocity spectra at high wavenumbers. They proposed that the enhanced variance was due to mountain waves
CHO ET AL.' GRAVITY WAVES, TURBULENCE, AND VORTICAL MODES 16,301
PEMTropicsA DC-8 Height>2km N =152,135 ave
10 6 , ,, ,.. , , .... ,
"" -. <U'2> < 1.5 m2/s 2 "" "" <U'2> > 3 m2/s 2
105 "" -. "" ..
10 4 - . . . -.... "'-......... "".. ". -. -. -. -. -. -. -. oel "..
• 0 2
• 01 1
k-2 ... 100 , ,,, ........ , .... ,-.•
10 -2 10 -1 10 ø k/2• (km -1)
Figure 6. Horizontal velocity variance spectra (the sam of zonal and meridiona] velocity variance spectra) for PEM-•z'opics A DC-8 data separated with respect •o horizontal wind v•ri•nce ]ess th•n :[.5 m • s -• (solid line) and greater than 3 m 2 s -2 (dashed line). Only data segments above 2 km in altitude were included in the means, where N•,,,e given in the to]:) right corner were the number of straight-and-level segments averaged for the low-variance and high-variance cases. Sample variabil- ity bars (]:)lasses for the low-variance case and crosses for the high-variance case) shown are plus/minus twice
the eye, dash-dotted lines indicating log-log slopes of -5/3 and -2 are also included.
and that the increase in small-scale turbulence gener- ated by the breaking waves led to an inverse cascade of energy up to mesoscales via the Q-2-D turbulence scheme of Lilly [1983] or the spectral-gap theory of We- insrock [1985], thus changing the spectral form. Con- sequently, in this context, it is not surprising that our spectra did not display such a change in form with re- spect to wind variance, since the PEM experiments were conducted over the ocean and not over mountains.
Weinstock [!978] formulated a buoyancy-subrange turbulence theory for which the kinetic energy spectral form depends on UE, the total root-mean-square fluc- tuating velocity in the entire equilibrium range. If we assume that the high wavenumber end of our spectra fell within the buoyancy subrange, then variations in u} could be approximated by the changes in mean hor- izontal wind variance taken at an appropriate wavenum- ber range. Weinstock [1978] predicted a steepening of the spectral slope for increasing UE at wavenumbers be- tween about kB/10 and kB, where kB = (O.8)X/•WB/UE is his buoyancy transition wavenumber and wB is the Brunt-V•is•l• frequency. If we take wB ,-• 0.01 rad s -x and UE "'• 0.3 m s-x (representative of the troposphere), we get 10Ls = 2•r/ks ,-• 2 km, the outer limit of the buoyancy subrange. Taking the horizontal velocity vari- ance for every 8 s of data then averaging over the entire
time segment to be spectrally transformed gives an esti- mate of the variance at a scale of 1.2 to 2 km, depending on the aircraft air speed. Dividing the horizontal ve- locity and potential temperature spectra according to this criterion yielded much the same results as in Fig- ures 6 and 7, that is, an offset in spectral power but no difference in spectral form. Thus our data did not dis- play the buoyancy-subrange turbulence characteristics as predicted by Weinstock [1978].
3. Doppler-Shift Effects on Horizontal Velocity Spectra
Just as ground-based frequency spectra of horizontal velocity fluctuations suffer Doppler shifting by the mean winds, so are spectra of aircraft time series Doppler- shifted by the air speed. However, because of the po- larized nature of wave velocity perturbations, one can use this effect to discriminate between different types of motions.
In general, horizontal motion due to a gravity wave is elliptically polarized with the major axis aligned with the direction of propagation. (If its intrinsic frequency w is much higher than the local inertial frequency f, then the ellipse collapses to a line. This should be the case for our measurements at scales of ,-•1-100 km.) Consequently, if only gravity waves were responsible for horizontal velocity fluctuations, then velocity variances parallel to the aircraft heading would be associated with maximally Doppler-shifted waves, whereas veloc- ity variances transverse to the aircraft heading would be caused by waves suffering no Doppler shift.
Eckermann [1990] examined the effects of Doppler shifting on a gravity-wave model for ground-based fre- quency spectra of horizontal velocity and concluded that an increase in Doppler shifting resulted in higher variance for •: • f. (Equivalent results were ob-
105
•,• 104
o3 10 3
:• 10 2
•-101
• 100 o
10 -1
PEM Tropics A DC-8 Height > 2 km Nav e-- 152, 135 ' ' , J... i .....
' -. <U'2> < 1.5 m2/s 2 "" -. <U'2> > 3 m2/s 2
•._ • ...... k -513
•' t/•'t•'\
/(.-2
,, , i ........ i ...... 10 -2 10 -1 1 0 k/2• (km -1)
Figure 7. Same as Figure 6, except for potential tem- perature data.
16,302 CHO ET AL.' GRAVITY WAVES, TURBULENCE, AND VORTICAL MODES
tained by Bacmeister et el. [1996, Figure 13] for spec- tra•of aircraft time series.) He then defined the ratio
R- ui12/u•, where ull 2 is the horizontal velocity vari- ance parallel to the mean horizontal velocity U and u• is the horizontal velocity variance transverse to U. For aircraft data, U is replaced by the vector Uas with mag- nitude equal to the air speed and direction opposite to the aircraft heading.
Then assuming a horizontally isotropic gravity-wave spectrum, R > 1 with increasing values for increasing [U•o[. On the other hand, vertical modes have hori- zontal fluctuations perpendicular to their wave vectors. Therefore R < 1 for vortical modes. Eckermann [1990] also estimated R = 3/5 for Q-2-D turbulence. As men- tioned earlier, Q-2-D turbulence and vortical modes are sometimes taken to be equivalent, but there are dif- ferences between the two, which we will take up in the discussion section. In any case, R gives us a nice tool with which to determine the relative importance of gravity waves versus Q-2-D turbulence/vortical modes. Isotropy of the gravity-wave spectrum is not required if R is compiled over flight segments that are distributed over a broad range of azimuthal angles, which is true for our study. Ideally, the sampling itself would be isotropic, but as long as there is no systematic corre- lation between the aircraft heading and gravity-wave propagation direction, the method given above should remain valid. As far as we know, this is the first time that this technique has been used on aircraft data.
Since we wished to calculate R with respect to hor-
izontal wavenumber, we computed ull 2 and u• over At = 4096, 2048, 1024, 512,256,128, 64, 32, 16, and 8 s
rl::l - 0.9-
0.8
0.7
0.6
0.5
0.4
PEM ILatitudel > 15 ø Height > 2 km
Median Mean
o
, *
10 -3 10 -2 10 -1 10 ø k/2• (km -•)
Figure S. The median (circle) and overall mean (cross) values of R versus horizontal wavenumber for latitudes
greater than 150 and heights greater than 2 km. The vertical bars indicate the mean plus/minus the standard deviation divided by the square root of the number of averages taken. Data from all the PEM campaigns were used.
0.9
0.8
0.7
0.6
0.5
0.4
PEM ILatitudel < 15 ø Height > 2 km
o Median x Mean
10 -3 10 -2 10 -1 k/2• (km -•)
o o o o
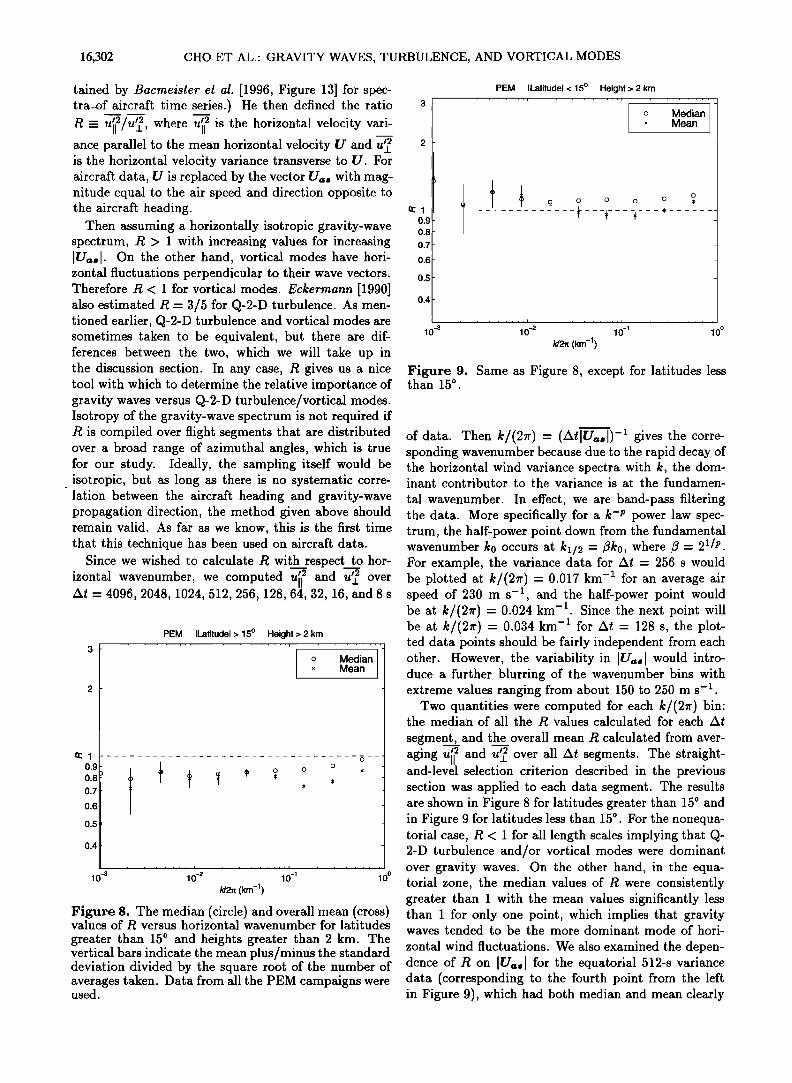
Figure 9. Same as Figure 8, except for latitudes less than 15 ø.
of data. Then k/(2rr): gives the corre- sponding wavenumber because due to the rapid decay of the horizontal wind variance spectra with k, the dom- inant contributor to the variance is at the fundamen-
tal wavenumber. In effect, we are band-pass filtering the data. More specifically for a k-p power law spec- trum, the half-power point down from the fundamental wavenumber k0 occurs at k•/2 - •ko, where •- 2 •/p. For example, the variance data for At = 256 s would be plotted at k/(2rr) = 0.017 km -• for an average air speed of 230 m s -•, and the half-power point would be at k/(2rr) - 0.024 km -1. Since the next point will be at k/(2rr) - 0.034 km -• for At -- 128 s, the plot- ted data points should be fairly independent from each other. However, the variability in IUol would intro- duce a further blurring of the wavenumber bins with extreme values ranging from about 150 to 250 m s-•.
Two quantities were computed for each k/(2rr) bin: the median of all the R values calculated for each At
segment, and the overall mean R calculated from aver-
aging ull 2 and u• over all At segments. The straight- and-level selection criterion described in the previous section was applied to each data segment. The results are shown in Figure 8 for latitudes greater than 15 0 and in Figure 9 for latitudes less than 15 ø. For the nonequa- torial case, R < i for all length scales implying that Q- 2-D turbulence and/or vertical modes were dominant over gravity waves. On the other hand, in the equa- torial zone, the median values of R were consistently greater than i with the mean values significantly less than i for only one point, which implies that gravity waves tended to be the more dominant mode of hori-
zontal wind fluctuations. We also examined the depen- dence of R on IUol for the equatorial 512-s variance data (corresponding to the fourth point from the left in Figure 9), which had both median and mean clearly

CHO ET AL.- GRAVITY WAVES, TURBULENCE, AND VORTICAL MODES 16,303
greater than 1, and found that R tended to increase with IUaol as predicted by the gravity-wave theory.
In retrospect, it is perhaps not surprising that Q-2-D turbulence and/or vortical modes were less prevalent in the equatorial region. Numerical simulations of Q-2-D turbulence have shown that the essential inverse cascade
of energy is greatly enhanced by the presence of a back- ground rotation [M•tais et al., 1996; Vallis et al., 1997]. Since rotation due to the Coriolis effect vanishes near
the equator, it is expected that Q-2-D turbulence would have difficulty being sustained in the equatorial zone. Also, the generation of vortical modes due to gravity wave-vortical mode interaction (GVI) is stymied with- out background rotation [Yeh and Dong, 1989]. With- out the Coriolis force, the threshold of GVI remains above that for convective breakdown [Dong and Yeh, 1988], and thus any excess energy created by gravity- wave saturation would preferentially go into other types of motion. Thus, if GVI is an important source of vor- tical modes, then it follows that the equatorial region would be poor in vortical modes.
Our results are somewhat at odds with the ground- based results of Vincent and Eckermann [1990], which showed R > 1 cases to be more predominant at 35øS, with R increasing with respect to IUI as predicted by the gravity-wave model. However, note that their data were collected at the edge of a continent (Adelaide, Aus- tralia) as opposed to our flights over the oceans. Results from GASP clearly showed the big difference in veloc- ity variance spectra over ocean and land, with flights over land (especially over rough terrain) yielding higher variances [Jasperson et al., 1990]. It is then reasonable to suppose that orographically generated gravity waves are a dominant source of mesoscale wind fluctuations
over land, which were probably a very weak component in our data collected over the ocean. Ideally, a simi- lar study should be conducted using radar data from a nonequatorial location surrounded by ocean.
4. Stokes-Parameter Analysis
As already mentioned, vortical modes and Q-2-D tur- bulence are sometimes interchangeably discussed. How- ever, as pointed out by Eckermann [1990], the former is essentially wavelike (albeit nonpropagating and of zero intrinsic frequency) with clearly defined wave vectors and polarized velocity fluctuations, qualities that tur- bulence is not expected to possess.
In this section, we apply to the zonal u and meridional v velocity components the Stokes-parameter method in- troduced by Vincent and Fritts [1987] and extended to the Fourier spectral domain by Eckermann and Vin- cent [1989]. As far as we know, this is the first time that this technique has been used on aircraft data. The motivation for doing this is to determine the degree to which the u and v fluctuations are polarized, and if so, what their phase relation and directional alignment are. Horizontal velocity fluctuations should be polarized for
both gravity waves and vortical modes but not for tur- bulence. By performing the analysis in the Fourier spectral domain we can decompose the superposition of waves to some extent. Furthermore, we will also ex- amine the cross-spectral relationship between u and 0, the potential temperature. For gravity waves, u and 0 are expected to have a phase difference of •90 ø. One might, however, question whether these polarization re- lations for monochromatic gravity waves are valid for a spectrum of waves that interact with each other. De- wan [1997] has shown that they remain valid, at least for the wave-cascade model.
The Stokes parameters for u and v (in strict anal- ogy to those for electromagnetic waves) are defined in Fourier space as follows [Eckermann and Vincent, 1989]:
I- A[U• + U? + V? + V• •] (1)
D - A[U• 2 + Ui 2 - V• - Vi 2]
P- 2A[U•V• + Ui•Vi 2] (3)
Q - 2A[U•Vi 2 - Ui•V•] (4)
where A is a constant, the r and i subscripts denote the real and imaginary components in the Fourier do- main, and the overbars denote averaging. In optical terminology, I is the throughput, D is the through- put anisotropy, P is the linear, polarization, and Q is the circular polarization (positive is anticlockwise; neg- ative is clockwise). The degree of polarization is given by d- (D 2 + P• + Q2)•/2/I, the phase difference be- tween u and v (the cross-spectral phase) is given by ½- arctan(Q/P), and the major axis orientation is given by a- arctan(P/D)/2. Furthermore, the cross-spectral coherence ICI is given by
For u and v, we are mainly interested in d, 0, and a. The first quantity will give us an estimate of the fraction of horizontal kinetic energy that is in wave- like motions. If there are wavelike motions, then will yield the phase difference between u and v. For short-period gravity waves and vortical modes, u and v are linearly polarized, so •b should be 0 ø or 4-180 ø. For inertio-gravity waves (w approaching f), the cir- cular polarization component increases, and 4 goes to 4-900 This transition has been observed in ground- based frequency and vertical wavenumber data using cross-spectral analysis [Cho, 1995]. The major axis orientation a then gives the alignment parallel to the wave vector for gravity waves or perpendicular to the wave vector for vortical modes. For u and 0, we will study the cross-spectral coherence ICI since the magni- tude of their fluctuations are not expected to be of the same order, and phase •b. For calculations involving u and 0, one simply replaces the meridional velocity vari- ables in (1) through (4) by the corresponding potential temperature variables.
With a technique such as this that requires averaging for statistical robustness, there is an inherent trade-off

16,304 CHO ET AL.- GRAVITY WAVES, TURBULENCE, AND VORTICAL MODES
when examining nonstationary data. Ideally, one would perform the spectral averaging over an area and time period in which a wave field (if it existed) remained the same. Although we could never be sure that we were meeting this criterion, we attempted to approach the ideal by averaging only over individual straight-and- level flight segments. (Spectral processing was carried out as described earlier in the paper.) Here again, we encountered a trade-off between taking longer spectral transforms for extension out to longer wavelengths, and shorter transforms for improved statistics. We again used 512-s data segments for the FFTs.
Also, to make sure that the technique worked, we fed simulated red noise spectra plus pairs of monochromatic signals that were in-phase, out-of-phase, and with 90 ø phase delays into the program. The outputs showed the expected results.
Averaging over these individual straight-and-level flight segments, we noted that d tended to have large error bars such that in many cases it was not possible to assign meaningful values to d. About the only gen- eral statement we can make is that partial polarization was present most of the time across all length scales. A clustering of •b around 0 ø or +180 ø, which would have indicated the presence of waves, occurred at times but not consistently. It is true that •b would have been am- biguous if the wave vector was aligned exactly east-west or north-south, but even taking this into account, ev- idence of gravity waves and vortical modes was rather sparse overall.
100 ,
9O
8O
7O
6O
• 50
40
3O
2O
10
PEM Tropics A DC-8 Flight 19 Height = 9.44 km Nav e = 14
0 10 -2 10 -• 10 ø
k/2•[ (km -1)
Figure 10. Degree of u-v polarization versus horizon- tal wavenumber for one straight-and-level segment dur- ing PEM-Tropics A DC-8 flight 19 on October 5, 1996, from 1935 to 2134 UT. The start and end coordinates
were 13ø30'S, 147ø50'W and 1ø10'N, 142ø00'W. FFTs were taken over 14 consecutive 512-s segments, and the Stokes parameters were averaged to yield the polariza- tion. The mean altitude was 9.44 km. The error bars
..... 1/2 are plus/minus the standard deviation divided by N•ve.
180
9O
-9O
PEM Tropics A DC-8 Flight 19 Height = 9.44 km Nav e
+ ...+ ..... +....+. ......
, i
- 1800_ 2 I 10 -• k/2•[ (km -1)
=14
10 0
Figure 11. Same as Figure 10, except for u-v cross- spectral phase.
Here we show an example of a case in which wavelike motions were apparently present, a segment from the PEM-Tropics A DC-8 transit flight from Tahiti to Mof- fett Field, California. Plots of d, •b, and a with respect to horizontal wavenumber are displayed in Figures 10, 11, and 12. The •b and a values were filtered such that they were plotted only if the corresponding d minus its error bar did not go below 0. Note that there appear to be wavelike motions in three different k scales. In
the 1ow-k regime (0.01 km -x < k/(2•r) < 0.3 km-X), •b clusters around 0 ø, and a clusters around 40 ø. In the intermediate k range (0.3 km -x < k/(27r) < 0.8 km -x), •b switches to •180 ø and a • -20 ø. Finally, in the largest k regime (0.8 km -x < k/(2•r) < 1 km-X), •b and c,-appear to revert to the low-k values. It seems, then, that there were either three groups of waves across the k scales or two groups with one becoming dominant over the other within a certain k range.
For this segment, we also computed the cross-spectral coherence (Figure 13) and phase (Figure 14) for u and 0. The time samples of u and 0 were normalized by their respective variances before being transformed into frequency space to minimize any cross-spectral bias in- troduced by the large differences in their amplitudes. The •b values plotted were again filtered according to the criterion given above. Although not definitive, •b tended to be around -90 ø, which is consistent with a gravity-wave interpretation. This was not so surprising since this flight segment was entirely in the equatorial zone (13øS to iøN).
Finally, we searched for evidence of inertio-gravity waves. As mentioned earlier, a transition from pure gravity to inertio-gravity waves has been observed in ground-based frequency and vertical wavenumber cross- spectra of horizontal velocity fluctuations in the lower stratosphere at 18øN [Oho, 1995]. Furthermore, Gard- ner et al. [1993] have argued that the k -3 behavior observed at very long wavelengths [Nastrom and Gage,

CHO ET AL.- GRAVITY WAVES, TURBULENCE, AND VORTICAL MODES 16,305
9O
45
-45
PEM Tropics A DC-8 Flight 19 Height = 9 44 km Nav e-- 14
......... ....... +' 't"i"t' .'!.+.+. ' .... '.'"'. ...............................
..............................................
-900_ 2 I 1 (•-1 10 ø k/2• (kin -1)
Figure 12. Same as Figure 10, except for u-v az- imuthal alignment direction.
1985; Gao and Meriwether, 1998] could be explained within the framework of gravity-wave theory if extra energy was present at those length scales due to iner- tial frequency enhancements. Nastrom et al. [1997] also suggested that the excess horizontal kinetic energy ob- served (when compared to the horizontal versus vertical partition of kinetic energy predicted from gravity-wave theory) might be the result of inertio-gravity waves. However, because the typical PEM flight plan con- sisted of many changes in height, there were not many straight-and-level segments long enough to probe this k -3 regime. We selected the longest straight-and-level flight (PEM-West B, flight 5) and averaged 6 consecu- tive 2048-s transformed segments. The resulting hori- zontal velocity variance spectrum (Figure 15) displayed a k -3 form above a scale of about 100 km and approx-
lOO
9o
8o
7o
6o
3o
2o
lO
o lO -2
PEM Tropics A DC-8 Flight 19 Height = 9.44 km Nav e-- 14
10 -1 10 ø k/2• (km -1)
Figure 13. Same as Figure 10, except for cross-spectral coherence of u and 0.
PEM Tropics A DC-8 Flight 19 Height = 9.44 km Nav e- 14 180 ...........
-180 ..... ' I ........ 10 -2 10 -• 10 ø
k/2• (km -•)
Figure 14. Same as Figure 11, except for u and 0.
imately k -•/3 at shorter scales. The corresponding u-v polarization (Figure 16) showed a significant amount of polarization at scales above 100 kin. However, the cross-spectral phase (Figure 17) went to :E180 ø, which disagreed with the •b .-. 900 expected for inertio-gravity waves, but was consistent with a vortical mode inter- pretation.
5. Summary Discussion
Let us now review what we have presented. First, let us emphasize again that our data was collected over the
PEM West B Flight 5 Height = 9.47 km Latitude = 21øN Nav e = 6 107 ....... , ....... , ....... ,
•_.1o 6
105
eel104
>,103
102
10 • 10 -3
x• k -3 \
\
\\
....... i ........ i ........
10 -• 10 -• 10 ø k/2• (km -1)
Figure 15. Horizontal velocity variance spectra (the sum of zonal and meridional velocity variance spectra) for one straight-and-level flight segment during P EM- West B flight 5 from February 8, 1994, 2037 UT to February 9, 1994, 0002 UT. The start and end coordi- nates were 21ø10'N, 160ø20'W and 20ø30'N, 176ø10'W. FFTs were taken over six consecutive 2048-s segments. As guides to the eye, dashed lines indicating log-log slopes of-3 and -5/3 are also included.

16,306 CHO ET AL.- GRAVITY WAVES, TURBULENCE, AND VORTICAL MODES
lOO
9o
8o
7o
6o
• 50
40
3O
2O
PEM West B Flight 5 Height = 9.47 km Latitude = 21øN Nav e ,,
I 10 -2
=6
10 -• 100 k/2• (kin -1)
Figure 16. Same as Figure 10, except for data used in generating Figure 15.
ocean, so conclusions that we draw do not necessarily apply to the atmosphere overlying land. We say this be- cause climatological studies such as GASP have shown significant differences in the energetics of horizontal ve- locity and potential temperature fluctuations measured over land and ocean [Nastrom et al., 1987; Jasperson et al., 1990]. Second, the data presented here only cov- ered the altitude range of 2 to 12 km. Thus direct comparisons cannot be made with observations made at much higher altitudes, for example, in the mesosphere, even though they may have been made above the ocean. This is because gravity waves generated at the land surface can travel much farther horizontally over the ocean as they propagate further up. Finally, convective plumes, hypothesized as a source of Q-2-D turbulence, do not penetrate much above the tropopause, so it may not be surprising that observations in the stratosphere and mesosphere have not yielde. d evidence for Q-2-D turbulence.
With these qualifications in mind, our most impor- tant conclusion is that in nonequatorial (greater than 15 ø) latitudes, Q-2-D turbulence, and/or vortical modes dominate over gravity waves in horizontal velocity vari- ance at horizontal scales of about i to 100 km. The
converse is true for the equatorial region. These results come out of the analysis of Doppler-shift effects on the horizontal wind variances. Put broadly then, the bal- ance of mesoscale rotational energy versus divergent en- ergy tilts toward the former in nonequatorial latitudes where the Coriolis effect is important, but leans to the latter in the equatorial zone where the Coriolis force be- comes negligible. These results are consistent with nu- merical simulations of Q-2-D turbulence that show the characteristic inverse cascade of energy greatly facili- tated by the Coriolis effect [Mitais et aI., 1996; Vallis et al., 1997]. Under weak rotation, even orographically forced flow structures can undergo an upscale transfor- mation to longer horizontal scales [Metkine, 1975; New-
ley et al., 1991], while Kelvin-Helmholtz waves can re- sult in near-balanced horizontally circulating systems through nonlinear adjustment [Babin et al., 1998]. Yeh and Dong [1989] have also shown that the generation of vortical modes due to GVI is blocked without back-
ground rotation. If Q-2-D turbulence is dominant, then the variability between about -5/3 and -2 of the log- log slope for horizontal velocity variance spectra seen in PEM1 can then be explained in terms of the phe- nomenological theory of Mahalov et al. [1998], which predicts the former value for weak stratification and the latter value for strong stratification. In addition, the tracer variance spectral slopes close to -5/3 sum- marized in PEM1 agrees with the Q-2-D turbulence ad- vection model of Lesieur and Herring [1985].-
We note, however, that the similarity of horizontal velocity and passive scalar variance spectral forms such as observed in PEM1 can be explained using fewer as- sumptions with a gravity-wave advection model. The balance of evidence in this study suggests, though, that gravity waves did not dominate at nonequatorial lati- tudes.
Next we conclude from the Stokes-parameter study that coherent wavelike behavior of horizontal motions
at these scales were not prevalent. Thus we might say that Q-2-D turbulence rather than a superposition of vortical modes were more common. Specific instances of wave/mode existence were observed, however, and we presented an example in Figures 10 to 14. We showed using the cross-spectra of u and • that this case was likely due to gravity waves.
We also searched for inertio-gravity waves in our data. Using the longest straight-and-level flight seg- ment available, we observed a steepened (•k -3) hor- izontal velocity spectrum at scales longer than about 100 km. However, a Stokes-parameter analysis indi- cated that these large-scale motions were more likely vortical modes rather than inertio-gravity waves as has been previously suggested [Gardner et al., 1993].
180
PEM West B Flight5 Height = 9.47 km Latitude =21øN N = 6 ave
-1800_ 3 .... • , ß • _ 1 10 -2 10 -• 10 ø k/2• (km -1)
Figure 17. Same as Figure 11, except for data used in generating Figure 15.

CHO ET AL.: GRAVITY WAVES, TURBULENCE, AND VORTICAL MODES 16,307
The dependence of the horizontal velocity and poten- tial temperature variance on mean wind speed observed previously in the troposphere [Nesttorn et el., 1987] was also seen in our data. However, we were able to show that the dependence only existed for extratropi- cal (greater than 250 ) latitudes. We suggested that this effect might be due to the aircraft crossing midlatitude jet streams, which would create a correlation between high wind speed and high wind variability. This expla- nation is consistent with the lack of such a dependence observed in the stratosphere [Becrneister et el., 1996].
Finally, the absence of change in horizontal velocity and potential temperature spectral form with respect to horizontal wind variance provided evidence against the buoyancy subrange turbulence theory of Weinstock [1978] (as was the case for the ER-2 data [Becmeis- ter et el., 1996]). Since the lack of slope steepening at high wavenumbers in P EM1 already ruled out the other buoyancy subrange theories [Bolgieno, 1962; Shut, 1962; Lumley, 1964], we conclude that buoyancy sub- range turbulence is not applicable to our data.
The relationship between Q-2-D turbulence and vor- tical modes still needs to be clearly delineated. Presum- ably, vortical modes can be excited and exist without having nonlinear self-interactions that lead to a down- scale or upscale energy cascade. In this context, vortical modes could then be seen as a more general term for ro- tational motion, whereas Q-2-D turbulence necessarily must have modal interaction and cascading. The impli- cation for tracer advection is that irreversible mesoscale
horizontal mixing ought to be more efficient for a Q-2- D-turbulence-dominated background flow than for a su- perposition of coherent vortices or gravity waves. Also, as mentioned in the introduction, the inverse cascade of Q-2-D turbulence could add uncertainty to weather pre- diction models by transferring energy from unresolved small structures (like convective plumes) to synoptic motions.
The dominance of mesoscale rotational modes in the
nonequatorial oceanic troposphere also has implica- tions for layer formation. Vortical modes become ver- tically decoupled under strong stratification and form layered structures. The ubiquity of tracer layers ob- served during PEM [Newell et el., 1996; Wu et el., 1997; $toller et el., 1999] may be linked to such a mech- anism. For example, simulations of Q-2-D turbulence forced by convection (with conditions representative of cold airstreams passing over warm seas) showed such layer decoupling in the decay phase [ Vellis et el., 1997]. These model results showed up as vertical discontinu- ities in small-scale potential vorticity.
Our next task will be to examine aircraft data
taken over a continent at mid-latitudes and apply the same techniques used here to determine whether grav- ity waves are a more dominant factor in producing mesoscale fluctuations over land. Fortunately, we have available such data collected during the SONEX mis- sion, with additional information such as the measured lapse rate at flight level, vertical velocity, and estimates
of ½, the turbulent energy dissipation rate. Assuming that gravity waves are important, then these added data will aid us in discriminating between the compet- ing ideas: the saturated-cascade [Dewen, 1997], linear instability [Gerdner et el., 1993], and diffusive filter- ing [Gerdner, 1994] theories. However, there is no reason to suspect that over land both Q-2-D turbu- lence and gravity waves cannot contribute significantly to the mesoscale kinetic energy spectrum. In fact, the observed ratios of horizontal to vertical kinetic energy are greater than the values predicted by gravity-wave theory [Gege et el., 1986; Becrneister et el., 1996], so it is reasonable to suppose that the "excess" mesoscale horizontal energy arises from rotational modes.
Acknowledgments. This work was funded by NASA grants NAG1-1758 and NAG1-1901. We would like to thank Ali Aknan for his help with the P EM-Tropics A velocity data.
References
Allen, S. J., and R. A. Vincent, Gravity wave activity in the lower atmosphere: Seasonal and latitudinal variations, J. Geophys. Res., 100, 1327-1350, 1995.
Babin, A., A. Mahalov, and B. Nicolaenko, On nonlinear baroclinic waves and adjustment of pancake dynamics, Theor. Cornput. Fluid Dyn., 11, 215-235, 1998.
Bacmeister, J. T., S. D. Eckermann, P. A. Newman, L. Lait, K. R. Chan, M. Loewenstein, M. H. Proffitt, and B. L. Gary, Stratospheric horizontal wavenumber spectra of winds, potential temperature, and atmospheric tracers observed by high-altitude aircraft, J. Geophys. Res., 101, 9441-9470, 1996.
Bolgiano, R., Structure of turbulence in stratified media, J. Geophys. Res., 67, 3015-3023, 1962.
Charney, J. G., Geostrophic turbulence, J. Atrnos. Sci., 28, 1087-1095, 1971.
Cho, J. Y. N., Inertio-gravity wave parameter estima- tion from cross-spectral analysis, J. Geophys. Res., 100, 18,727-18,737, 1995.
Cho, J. Y. N., Y. Zhu, R. E. Newell, B. E. Anderson, J. D. Barrick, G. L. Gregory, G. W. Sachse, M. A. Carroll, and G. M. Albercook, Horizontal wavenumber spectra of winds, temperature, and trace gases during the Pacific Exploratory Missions, 1, Climatology, J. Geophys. Res., 10J, 5697-5716, 1999.
Dewan, E., Saturated-cascade similitude theory of gravity wave spectra, J. Geophys. Res., 102, 29,799-29,817, 1997.
Dewan, E. M., Stratospheric wave spectra resembling tur- bulence, Science, 20•, 832-835, 1979.
Dong, B., and K. C. Yeh, Resonant and nonresonant wave- wave interactions in an isothermal atmosphere, J. Geo- phys. Res., 93, 3729-3744, 1988.
Eckermann, S. D., Effects of nonstationarity on spectral analysis of mesoscale motions in the atmosphere, J. Geo- phys. Res., 95, 16,685-16,703, 1990.
Eckermann, S. D., Effect of background winds on verti- cal wavenumber spectra of atmospheric gravity waves, J. Geophys. Res., 100, 14,097-14,112, 1995.
Eckermann, S. D., and R. A. Vincent, Falling sphere ob- servations of anisotropic gravity wave motions in the up- per stratosphere over Australia, Pure Appl. Geophys., 130, 509-532, 1989.
Fritts, D.C., and T. E. VanZandt, Effects of Doppler shift- ing on the frequency spectra of atmospheric gravity waves, J. Geophys. Res., 92, 9723-9732, 1987.
Fritts, D.C., T. Tsuda, T. Sato, S. Fukao, and S. Kato, Ob- servational evidence of a saturated gravity wave spectrum

16,308 CHO ET AL.: GRAVITY WAVES, TURBULENCE, AND VORTICAL MODES
in the troposphere and lower stratosphere, J. Atrnos. $ci., 4{5, 1741-1759, 1988.
Gage, K. S., Evidence for a k -5/3 law inertial range in mesoscale two-dimensional turbulence, J. Atmos. Sci., 36, 1950-1954, 1979.
Gage, K. S., and G. D. Nastrom, On the spectrum of atmo- spheric velocity fluctuations seen by MST/ST radar and their interpretation, Radio Sci., 20, 1339-1347, 1985.
Gage, K. S., and G. D. Nastrom, Theoretical interpretation of atmospheric wavenumber spectra of wind and temper- ature observed by commercial aircraft during GASP, J. Atrnos. Sci., 43, 729-740, 1986.
Gage, K. S., B. B. Balsley, and R. Garello, Comparisons of horizontal and vertical velocity spectra in the mesosphere, stratosphere, and troposphere: Observations and theory, Geophys. Res. Left., 13, 1125-1128, 1986.
Gao, X., and J. W. Meriwether, Mesoscale spectral analysis of in situ horizontal and vertical wind measurements at 6
km, J. Geophys. Res., 103, 6397-6404, 1998. Gardner, C. S., Diffusive filtering theory of gravity wave
spectra in the atmosphere, J. Geophys. Res., 99, 20,601- 20,622, 1994.
Gardner, C. S., and N. F. Gardner, Measurement distortion in aircraft, space shuttle, and balloon observations of at- mospheric density and temperature perturbation spectra, J. Geophys. Res., 98, 1023-1033, 1993.
Gardner, C. S., C. A. Hostetler, and S. J. Franke, Gravity wave models for the horizontal wave number spectra of atmospheric velocity and density fluctuations, J. Geophys. Res., 98, 1035-1049, 1993.
Hoell, J. M., D. D. Davis, S.C. Liu, R. E. Newell, M. Shipham, H. Akimoto, R. J. McNeal, R. 3. Bendura, and J. W. Drewry, Pacific Exploratory Mission West-A (PEM West-A): September-October 1991, J. Geophys. Res., 101, 1641-1653, 1996.
Hoell, J. M., D. D. Davis, S.C. Liu, R. E. Newell, H. Aki- moro, R. J. McNeal, and R. J. Bendura, The Pacific Ex- ploratory Mission-West, Phase B: February-March 1994, J. Geophys. Res., 102, 28,223-28,239, 1997.
Hoell, J. M., D. D. Davis, D. J. Jacob, M. O. Rodgers, R. E. Newell, H. E. Fuelberg, R. J. McNeal, J. L. Raper, and R. J. Bendura, Pacific Exploratory Mission in the tropi- cal Pacific: PEM-Tropics A, August-September 1996, J. Geophys. Res., 104, 5567-5583, 1999.
Jasperson, W. H., G. D. Nastrom, and D.C. Fritts, Fur- ther study of terrain effects on the mesoscale spectrum of atmospheric motions, J. Atrnos. Sci., J 7, 979-987, 1990.
Kolmogorov, A. N., The local structure of turbulence in in- compressible viscous fluids for very high Reynolds num- bers, Dokl. Akad. Nauk SSSR, 30, 301-305, 1941.
Kraichnan, R., Inertial ranges in two-dimensional turbu- lence, Phys. Fluids, 10, 1417-1423, 1967.
Lesieur, M., and J. Herring, Diffusion of a passive scalar in two-dimensional turbulence, J. Fluid Mech., 161, 77-95, 1985.
Lilly, D. K., Stratified turbulence and the mesoscale vari- ability of the atmosphere, J. Atrnos. Sci., J0, 749-761, 1983.
Lumley, J. L., The spectrum of nearly inertial turbulence in a stably stratified fluid, J. Atrnos. Sci., 21, 99-102, 1964.
Mahalov, A., B. Nicolaenko, and Y. Zhou, Energy spectra of strongly stratified and rotating turbulence, Phys. Rev. E, 57, 6187-6190, 1998.
Merkine, L. O., Steady finite-amplitude baroclinic flow over long topography in a rotating, stratified atmosphere, J. Atmos. Sci., 32, 1881-1893, 1975.
M•tais, O., P. Bartello, E. Garnier, J. J. Riley, and M. Lesieur, Inverse cascade in stably stratified rotating tur- bulence, Dyn. Atmos. Oceans, 23, 193-203, 1996.
Miiller, P., R. Lien, and R. Williams, Estimates of potential vorticity at small scales in the ocean, J. Phys. Oceanogr., 18, 401-416, 1988.
Nastrom, G. D., and K. S. Gage, A climatology of atmo- spheric wavenumber spectra of wind and temperature ob- served by commercial aircraft, J. A tmos. Sci., 42, 950- 960, 1985.
Nastrom, G. D., D.C. Fritts, and K. S. Gage, An investi- gation of terrain effects on the mesoscale spectrum of at- mospheric motions, J. Atrnos. Sci., ZZ, 3087-3096, 1987.
Nastrom, G. D., T. E. VanZandt, and J. M. Warnock, Ver- tical wavenumber spectra of wind and temperature from high-resolution balloon soundings over Illinois, J. Geo- phys. Res., 102, 6685-6701, 1997.
Newell, R. E., Z.-X. Wu, Y. Zhu, W. Hu, E. V. Browell, G. L. Gregory, G. W. Sachse, J. E. Collins Jr., K. K. Kelly, and S.C. Liu, Vertical fine-scale atmospheric structure mea- sured from NASA DC-8 during PEM-West A, J: Geophys. Res., 101, 1943-1960, 1996.
Newley, T. M. J., H. J. Pearson, and J. C. R. Hunt, Sta- bly stratified rotating flow through a group of obstacles, Geophys. Astrophys. Fluid Dyn., 58, 147-171, 1991.
Shur, G. H., Experimental studies of the energy spectrum of atmospheric turbulence, Proc. Cent. Aerol. Ohs. USSR, 43, 79-90, 1962.
Stoller, P., et al., Measurements of atmospheric layers from the NASA DC-8 and P-3B aircraft during PEM-Tropics A, J. Geophys. Res., 104, 5745-5764, 1999.
Tsuda, T., T. Inoue, D.C. Fritts, T. E. VanZandt, S. Kato, T. Sato, and S. Fukao, MST radar observations of a sat- urated gravity wave spectrum, J. Atrnos. Sci., J6, 2440- 2447, 1989.
Vallis, G. K., G. J. Shutts, and M. E. B. Gray, Balanced mesoscale motion and stratified turbulence forced by con- vection, Q. J. R. Meteorol. Soc., 123, 1621-1652, 1997.
VanZandt, T. E., A universal spectrum of buoyancy waves in the atmosphere, Geophys. Res. Left., 9, 575-578, 1982.
Vincent, R. A., and $. D. Eckermann, VHF radar observa- tions of mesoscale motions in the atmosphere: Evidence for gravity wave Doppler shifting, Radio $ci., 25, 1019- 1037, 1990.
Vincent, R. A., and D.C. Fritts, A climatology of gravity wave motions in the mesopause region at Adelaide, Aus- tralia, J. Atrnos. Sci., ZZ, 748-760, 1987.
Weinstock, J., On the theory of turbulence in the buoyancy subrange of stably stratified flows, J. Atrnos. Sci., 35, 634- 649, 1978.
Weinstock, J., A theory of gaps in the turbulence spectra of stably stratified shear flow, J. A trnos. Sci., 37, 1542-1549, 1985.
Wu, Z.-X., R. E. Newell, Y. Zhu, B. E. Anderson, E. V. Browell, G. L. Gregory, G. W. Sachse, and J. E. Collins Jr., Atmospheric layers measured from the NASA DC-8 during PEM-West B and comparison with PEM-West A, J. Geophys. Res., 102, 28,353-28,365, 1997.
Yeh, K. C., and B. Dong, The non-linear interaction of a gravity wave with the vortical modes, J. Atrnos. Terr. Phys., 51, 45-50, 1989.
J. D. Barrick, Mail Stop 483, NASA Langley Research Center, 21 Langley Blvd., Hampton, VA 23681-2199. (j. d. b arrick @ larc. nasa. gov )
J. Y. N. Cho (corresponding author) and R. E. Newell, Department of Earth, Atmospheric, and Planetary Sci- ences, Massachusetts Institute of Technology, 77 Mas- sachusetts Ave., #54-1823, Cambridge, MA 02139-4307. (jcho@pemtropics. mit.edu; newell@newell1. mit.edu)
(Received August 16, 1998; revised January 27, 1999; accepted February 1, 1999.)