honda motor co., ltd. and subsidiaries condensed
TRANSCRIPT

HONDA MOTOR CO., LTD. AND SUBSIDIARIES
Condensed Consolidated Interim Financial Statements
December 31, 2018

HONDA MOTOR CO., LTD. AND SUBSIDIARIES
Consolidated Financial Results
Overview of Operating Performance
Honda’s consolidated sales revenue for the nine months ended December 31, 2018 increased by 3.4%, to ¥11,839.5 billion from the same period
last year, due mainly to increased sales revenue in all business operations. Operating profit decreased by 3.2%, to ¥684.0 billion from the same period
last year, due mainly to increased selling, general and administrative expenses as well as negative foreign currency effects, which was partially offset by
continuing cost reduction and the loss related to the settlement of multidistrict class action litigation in the same period last year. Profit before income
taxes decreased by 6.1%, to ¥868.2 billion from the same period last year. Profit for the period attributable to owners of the parent decreased by 34.5%,
to ¥623.3 billion from the same period last year, due mainly to the impacts of the enactment of the Tax Cuts and Jobs Act in the Unites States in the
same period last year.
Business Segments
Motorcycle Business
For the nine months ended December 31, 2017 and 2018
Units (thousands)
Honda Group Unit Sales* Consolidated Unit Sales*
Nine months
ended
Dec. 31, 2017
Nine months
ended
Dec. 31, 2018
Nine months
ended
Dec. 31, 2017
Nine months
ended
Dec. 31, 2018Change % Change %
Motorcycle Business 14,807 15,680 873 5.9 9,787 10,378 591 6.0
Japan 126 157 31 24.6 126 157 31 24.6
North America 232 216 (16) (6.9) 232 216 (16) (6.9)
Europe 173 181 8 4.6 173 181 8 4.6
Asia 13,460 14,187 727 5.4 8,440 8,885 445 5.3
Other Regions 816 939 123 15.1 816 939 123 15.1
* Honda Group Unit Sales is the total unit sales of completed motorcycle, ATV and side-by-side products of Honda, its consolidated subsidiaries and its affiliates and joint ventures
accounted for using the equity method. Consolidated Unit Sales is the total unit sales of completed products corresponding to consolidated sales revenue to external customers, which
consists of unit sales of completed products of Honda and its consolidated subsidiaries.
Sales revenue from external customers increased by 6.1%, to ¥1,610.7 billion from the same period last year, due mainly to increased consolidated
unit sales. Operating profit increased by 16.3%, to ¥246.7 billion from the same period last year, due mainly to an increase in profit attributable to
increased sales volume and model mix.

Automobile Business
For the nine months ended December 31, 2017 and 2018
Units (thousands)
Honda Group Unit Sales* Consolidated Unit Sales*
Nine months
ended
Dec. 31, 2017
Nine months
ended
Dec. 31, 2018
Nine months
ended
Dec. 31, 2017
Nine months
ended
Dec. 31, 2018Change % Change %
Automobile Business 3,903 3,959 56 1.4 2,739 2,769 30 1.1
Japan 498 515 17 3.4 451 464 13 2.9
North America 1,424 1,444 20 1.4 1,424 1,444 20 1.4
Europe 127 121 (6) (4.7) 127 121 (6) (4.7)
Asia 1,671 1,698 27 1.6 554 559 5 0.9
Other Regions 183 181 (2) (1.1) 183 181 (2) (1.1)
* Honda Group Unit Sales is the total unit sales of completed products of Honda, its consolidated subsidiaries and its affiliates and joint ventures accounted for using the equity method.
Consolidated Unit Sales is the total unit sales of completed products corresponding to consolidated sales revenue to external customers, which consists of unit sales of completed
products of Honda and its consolidated subsidiaries. Certain sales of automobiles that are financed with residual value type auto loans by our Japanese finance subsidiaries and sold
through our consolidated subsidiaries are accounted for as operating leases in conformity with IFRS and are not included in consolidated sales revenue to the external customers in our
Automobile business. Accordingly, they are not included in Consolidated Unit Sales, but are included in Honda Group Unit Sales of our Automobile business.
Sales revenue from external customers increased by 1.7%, to ¥8,228.1 billion from the same period last year, due mainly to increased consolidated
unit sales. Operating profit decreased by 24.3%, to ¥262.7 billion from the same period last year, due mainly to increased selling, general and
administrative expenses as well as negative foreign currency effects, which was partially offset by the loss related to the settlement of multidistrict class
action litigation in the same period last year.
Financial Services Business
Sales revenue from external customers increased by 9.4%, to ¥1,746.2 billion from the same period last year, due mainly to an increase in
revenues on disposition of lease vehicles and operating lease revenues. Operating profit increased by 19.6%, to ¥176.7 billion from the same period last
year, due mainly to an increase in profit attributable to increased sales revenue.
Power Product and Other Businesses
For the nine months ended December 31, 2017 and 2018
Units (thousands)
Honda Group Unit Sales / Consolidated Unit Sales*
Nine months
ended
Dec. 31, 2017
Nine months
ended
Dec. 31, 2018 Change %
Power Product Business 3,785 3,954 169 4.5
Japan 202 246 44 21.8
North America 1,665 1,781 116 7.0
Europe 597 600 3 0.5
Asia 1,041 1,080 39 3.7
Other Regions 280 247 (33) (11.8)
* Honda Group Unit Sales is the total unit sales of completed power products of Honda, its consolidated subsidiaries and its affiliates and joint ventures accounted for using the equity
method. Consolidated Unit Sales is the total unit sales of completed power products corresponding to consolidated sales revenue to external customers, which consists of unit sales of
completed power products of Honda and its consolidated subsidiaries. In Power Product business, there is no discrepancy between Honda Group Unit Sales and Consolidated Unit Sales
since no affiliate and joint venture accounted for using the equity method were involved in the sale of Honda power products.
Sales revenue from external customers increased by 3.5%, to ¥254.3 billion from the same period last year, due mainly to increased consolidated
unit sales in Power Product business. Operating loss was ¥2.1 billion, an increase of ¥1.8 billion from the same period last year, due mainly to increased
operating costs in Other businesses. In addition, operating loss of aircraft and aircraft engines included in the Power Product and other businesses was
¥29.2 billion, an improvement of ¥1.0 billion from the same period last year.

Cash Flows
Consolidated cash and cash equivalents on December 31, 2018 decreased by ¥62.4 billion from March 31, 2018, to ¥2,194.0 billion. The reasons
for the increases or decreases for each cash flow activity, when compared with the same period last year, are as follows:
Net cash provided by operating activities amounted to ¥498.6 billion of cash inflows. Cash inflows from operating activities decreased by
¥123.9 billion from the same period last year, due mainly to increased payments for parts and raw materials, which was partially offset by increased
cash received from customers.
Net cash used in investing activities amounted to ¥496.1 billion of cash outflows. Cash outflows from investing activities increased by
¥64.8 billion from the same period last year, due mainly to increased payments for acquisitions of other financial assets.
Net cash used in financing activities amounted to ¥54.2 billion of cash outflows. Cash outflows from financing activities decreased by
¥76.1 billion from the same period last year, due mainly to an increase in proceeds from financing liabilities, which was partially offset by an increase in
repayments of financing liabilities and purchases of treasury stock.

HONDA MOTOR CO., LTD. AND SUBSIDIARIES
Condensed Consolidated Statements of Financial Position
March 31, 2018 and December 31, 2018
Yen (millions)
Assets Note March 31, 2018
December 31,
2018
unaudited unaudited
Current assets:
Cash and cash equivalents ¥ 2,256,488 ¥ 2,194,073
Trade receivables 800,463 688,213
Receivables from financial services 1,840,699 1,873,742
Other financial assets 213,177 229,189
Inventories 1,523,455 1,618,680
Other current assets 291,006 375,030
Total current assets 6,925,288 6,978,927
Non-current assets:
Investments accounted for using the equity method 679,517 666,587
Receivables from financial services 3,117,364 3,379,984
Other financial assets 436,555 477,449
Equipment on operating leases 6 4,088,133 4,330,434
Property, plant and equipment 7 3,062,433 2,972,261
Intangible assets 741,514 744,446
Deferred tax assets 129,338 134,763
Other non-current assets 169,022 166,350
Total non-current assets 12,423,876 12,872,274
Total assets ¥ 19,349,164 ¥ 19,851,201
Yen (millions)
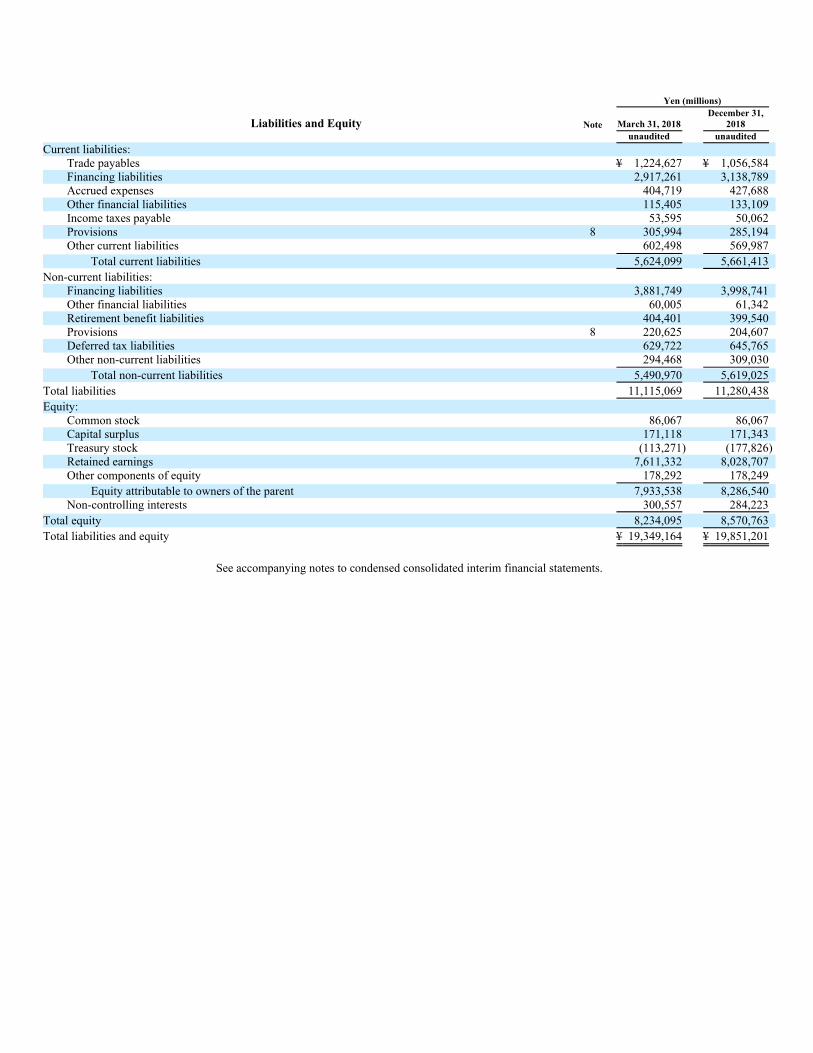
Liabilities and Equity Note March 31, 2018
December 31,
2018
unaudited unaudited
Current liabilities:
Trade payables ¥ 1,224,627 ¥ 1,056,584
Financing liabilities 2,917,261 3,138,789
Accrued expenses 404,719 427,688
Other financial liabilities 115,405 133,109
Income taxes payable 53,595 50,062
Provisions 8 305,994 285,194
Other current liabilities 602,498 569,987
Total current liabilities 5,624,099 5,661,413
Non-current liabilities:
Financing liabilities 3,881,749 3,998,741
Other financial liabilities 60,005 61,342
Retirement benefit liabilities 404,401 399,540
Provisions 8 220,625 204,607
Deferred tax liabilities 629,722 645,765
Other non-current liabilities 294,468 309,030
Total non-current liabilities 5,490,970 5,619,025
Total liabilities 11,115,069 11,280,438
Equity:
Common stock 86,067 86,067
Capital surplus 171,118 171,343
Treasury stock (113,271) (177,826)
Retained earnings 7,611,332 8,028,707
Other components of equity 178,292 178,249
Equity attributable to owners of the parent 7,933,538 8,286,540
Non-controlling interests 300,557 284,223
Total equity 8,234,095 8,570,763
Total liabilities and equity ¥ 19,349,164 ¥ 19,851,201
See accompanying notes to condensed consolidated interim financial statements.

HONDA MOTOR CO., LTD. AND SUBSIDIARIES
Condensed Consolidated Statements of Income
For the nine months ended December 31, 2017 and 2018
Yen (millions)
Note
December 31,
2017
December 31,
2018
unaudited unaudited
Sales revenue 9 ¥ 11,446,418 ¥ 11,839,500
Operating costs and expenses:
Cost of sales (8,926,648) (9,325,508)
Selling, general and administrative (1,280,195) (1,254,501)
Research and development (532,843) (575,486)
Total operating costs and expenses (10,739,686) (11,155,495)
Operating profit 706,732 684,005
Share of profit of investments accounted for using the equity method 5 189,723 169,631
Finance income and finance costs:
Interest income 30,194 36,172
Interest expense (9,293) (10,065)
Other, net 7,169 (11,492)
Total finance income and finance costs 28,070 14,615
Profit before income taxes 924,525 868,251
Income tax expense 10 82,396 (187,436)
Profit for the period ¥ 1,006,921 ¥ 680,815
Profit for the period attributable to:
Owners of the parent 951,592 623,339
Non-controlling interests 55,329 57,476
Yen
December 31,
2017
December 31,
2018
Earnings per share attributable to owners of the parent
Basic and diluted 13 ¥ 529.39 ¥ 353.10
See accompanying notes to condensed consolidated interim financial statements.

HONDA MOTOR CO., LTD. AND SUBSIDIARIES
Condensed Consolidated Statements of Comprehensive Income
For the nine months ended December 31, 2017 and 2018
Yen (millions)
Note
December 31,
2017
December 31,
2018
unaudited unaudited
Profit for the period ¥ 1,006,921 ¥ 680,815
Other comprehensive income, net of tax:
Items that will not be reclassified to profit or loss
Remeasurements of defined benefit plans (24,210) —
Net changes in revaluation of financial assets measured at fair value through other comprehensive
income 28,417 (25,697)
Share of other comprehensive income of investments accounted for using the equity method 2,352 (3,023)
Items that may be reclassified subsequently to profit or loss
Net changes in revaluation of financial assets measured at fair value through other comprehensive
income — 120
Exchange differences on translating foreign operations 104,807 29,817
Share of other comprehensive income of investments accounted for using the equity method 19,033 (23,918)
Total other comprehensive income, net of tax 130,399 (22,701)
Comprehensive income for the period ¥ 1,137,320 ¥ 658,114
Comprehensive income for the period attributable to:
Owners of the parent 1,072,640 606,702
Non-controlling interests 64,680 51,412
See accompanying notes to condensed consolidated interim financial statements.
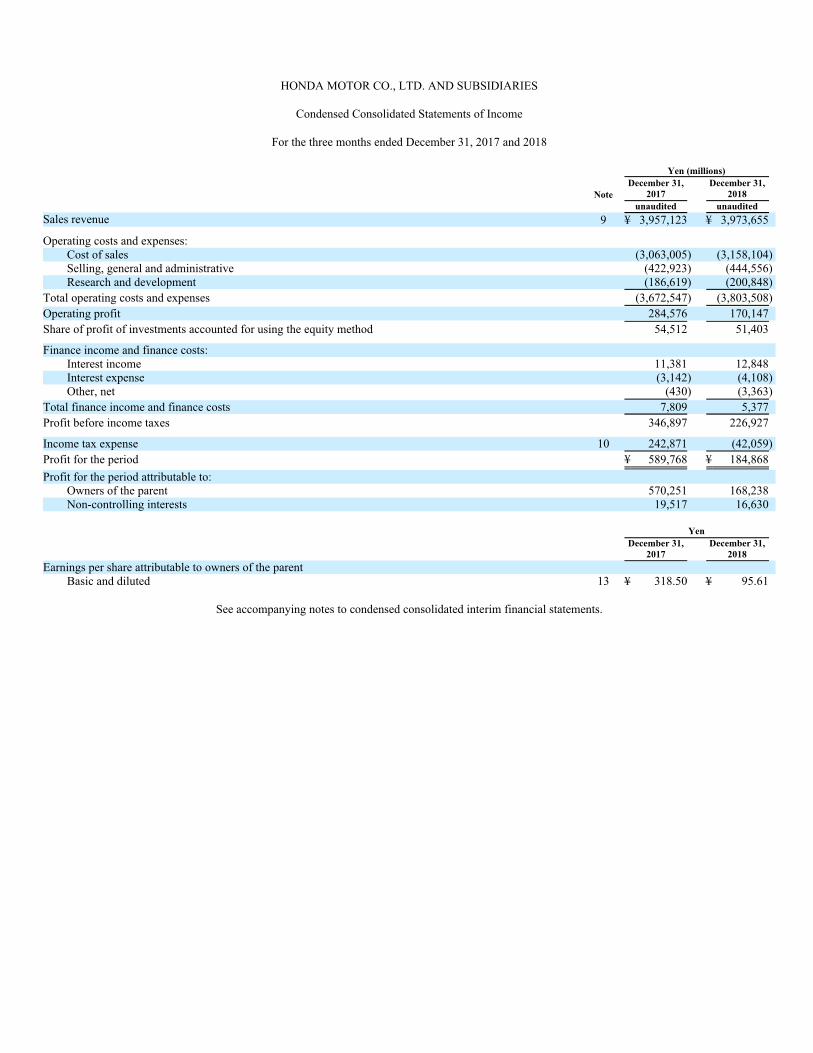
HONDA MOTOR CO., LTD. AND SUBSIDIARIES
Condensed Consolidated Statements of Income
For the three months ended December 31, 2017 and 2018
Yen (millions)
Note
December 31,
2017
December 31,
2018
unaudited unaudited
Sales revenue 9 ¥ 3,957,123 ¥ 3,973,655
Operating costs and expenses:
Cost of sales (3,063,005) (3,158,104)
Selling, general and administrative (422,923) (444,556)
Research and development (186,619) (200,848)
Total operating costs and expenses (3,672,547) (3,803,508)
Operating profit 284,576 170,147
Share of profit of investments accounted for using the equity method 54,512 51,403
Finance income and finance costs:
Interest income 11,381 12,848
Interest expense (3,142) (4,108)
Other, net (430) (3,363)
Total finance income and finance costs 7,809 5,377
Profit before income taxes 346,897 226,927
Income tax expense 10 242,871 (42,059)
Profit for the period ¥ 589,768 ¥ 184,868
Profit for the period attributable to:
Owners of the parent 570,251 168,238
Non-controlling interests 19,517 16,630
Yen
December 31,
2017
December 31,
2018
Earnings per share attributable to owners of the parent
Basic and diluted 13 ¥ 318.50 ¥ 95.61
See accompanying notes to condensed consolidated interim financial statements.
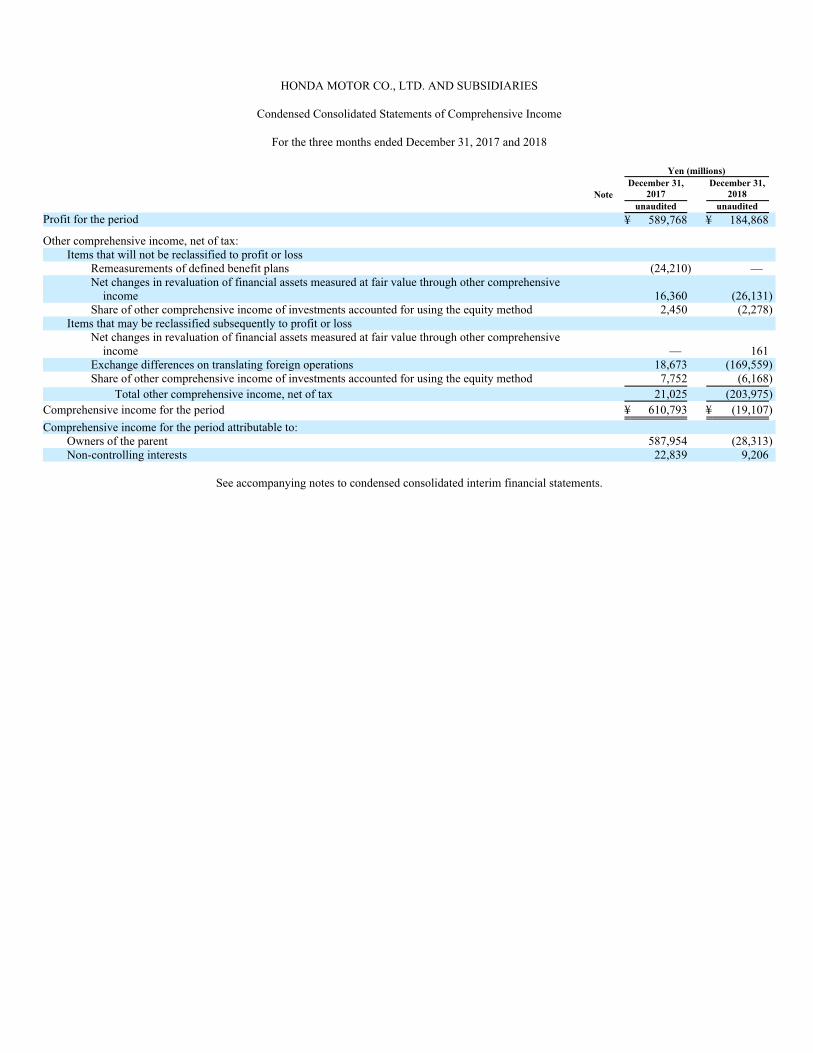
HONDA MOTOR CO., LTD. AND SUBSIDIARIES
Condensed Consolidated Statements of Comprehensive Income
For the three months ended December 31, 2017 and 2018
Yen (millions)
Note
December 31,
2017
December 31,
2018
unaudited unaudited
Profit for the period ¥ 589,768 ¥ 184,868
Other comprehensive income, net of tax:
Items that will not be reclassified to profit or loss
Remeasurements of defined benefit plans (24,210) —
Net changes in revaluation of financial assets measured at fair value through other comprehensive
income 16,360 (26,131)
Share of other comprehensive income of investments accounted for using the equity method 2,450 (2,278)
Items that may be reclassified subsequently to profit or loss
Net changes in revaluation of financial assets measured at fair value through other comprehensive
income — 161
Exchange differences on translating foreign operations 18,673 (169,559)
Share of other comprehensive income of investments accounted for using the equity method 7,752 (6,168)
Total other comprehensive income, net of tax 21,025 (203,975)
Comprehensive income for the period ¥ 610,793 ¥ (19,107)
Comprehensive income for the period attributable to:
Owners of the parent 587,954 (28,313)
Non-controlling interests 22,839 9,206
See accompanying notes to condensed consolidated interim financial statements.
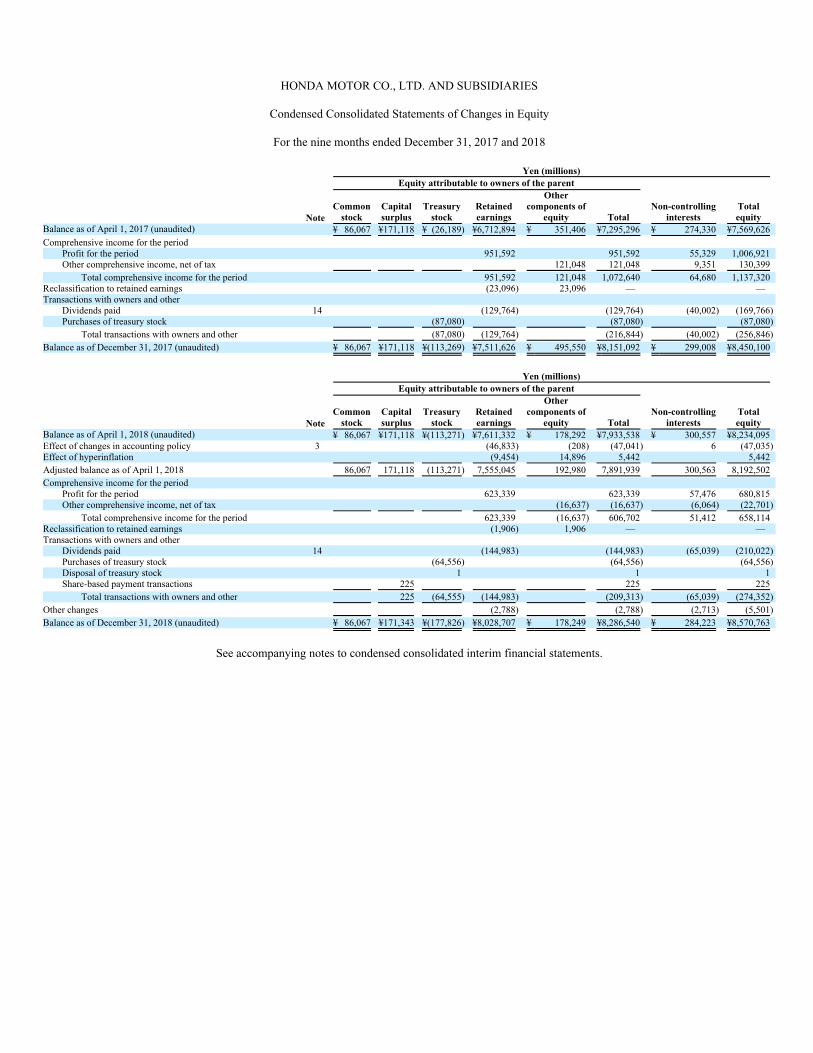
HONDA MOTOR CO., LTD. AND SUBSIDIARIES
Condensed Consolidated Statements of Changes in Equity
For the nine months ended December 31, 2017 and 2018
Yen (millions)
Equity attributable to owners of the parent
Note
Common
stock
Capital
surplus
Treasury
stock
Retained
earnings
Other
components of
equity Total
Non-controlling
interests
Total
equity
Balance as of April 1, 2017 (unaudited) ¥ 86,067 ¥171,118 ¥ (26,189) ¥6,712,894 ¥ 351,406 ¥7,295,296 ¥ 274,330 ¥7,569,626
Comprehensive income for the period
Profit for the period 951,592 951,592 55,329 1,006,921
Other comprehensive income, net of tax 121,048 121,048 9,351 130,399
Total comprehensive income for the period 951,592 121,048 1,072,640 64,680 1,137,320
Reclassification to retained earnings (23,096) 23,096 — —
Transactions with owners and other
Dividends paid 14 (129,764) (129,764) (40,002) (169,766)
Purchases of treasury stock (87,080) (87,080) (87,080)
Total transactions with owners and other (87,080) (129,764) (216,844) (40,002) (256,846)
Balance as of December 31, 2017 (unaudited) ¥ 86,067 ¥171,118 ¥(113,269) ¥7,511,626 ¥ 495,550 ¥8,151,092 ¥ 299,008 ¥8,450,100
Yen (millions)
Equity attributable to owners of the parent
Note
Common
stock
Capital
surplus
Treasury
stock
Retained
earnings
Other
components of
equity Total
Non-controlling
interests
Total
equity
Balance as of April 1, 2018 (unaudited) ¥ 86,067 ¥171,118 ¥(113,271) ¥7,611,332 ¥ 178,292 ¥7,933,538 ¥ 300,557 ¥8,234,095
Effect of changes in accounting policy 3 (46,833) (208) (47,041) 6 (47,035)
Effect of hyperinflation (9,454) 14,896 5,442 5,442
Adjusted balance as of April 1, 2018 86,067 171,118 (113,271) 7,555,045 192,980 7,891,939 300,563 8,192,502
Comprehensive income for the period
Profit for the period 623,339 623,339 57,476 680,815
Other comprehensive income, net of tax (16,637) (16,637) (6,064) (22,701)
Total comprehensive income for the period 623,339 (16,637) 606,702 51,412 658,114
Reclassification to retained earnings (1,906) 1,906 — —
Transactions with owners and other
Dividends paid 14 (144,983) (144,983) (65,039) (210,022)
Purchases of treasury stock (64,556) (64,556) (64,556)
Disposal of treasury stock 1 1 1
Share-based payment transactions 225 225 225
Total transactions with owners and other 225 (64,555) (144,983) (209,313) (65,039) (274,352)
Other changes (2,788) (2,788) (2,713) (5,501)
Balance as of December 31, 2018 (unaudited) ¥ 86,067 ¥171,343 ¥(177,826) ¥8,028,707 ¥ 178,249 ¥8,286,540 ¥ 284,223 ¥8,570,763
See accompanying notes to condensed consolidated interim financial statements.

HONDA MOTOR CO., LTD. AND SUBSIDIARIES
Condensed Consolidated Statements of Cash Flows
For the nine months ended December 31, 2017 and 2018
Yen (millions)
Note
December 31,
2017
December 31,
2018
unaudited unaudited
Cash flows from operating activities:
Profit before income taxes ¥ 924,525 ¥ 868,251
Depreciation, amortization and impairment losses excluding equipment on operating leases 531,230 518,386
Share of profit of investments accounted for using the equity method (189,723) (169,631)
Finance income and finance costs, net 11,628 (68,087)
Interest income and interest costs from financial services, net (96,331) (92,655)
Changes in assets and liabilities
Trade receivables 57,230 105,991
Inventories (104,753) (105,008)
Trade payables (72,579) (85,229)
Accrued expenses (39,806) (34,658)
Provisions and retirement benefit liabilities (79,965) (22,445)
Receivables from financial services (121,704) (165,210)
Equipment on operating leases (136,548) (141,291)
Other assets and liabilities (64,373) (101,717)
Other, net 4,483 108
Dividends received 79,542 98,624
Interest received 184,581 201,325
Interest paid (79,611) (105,418)
Income taxes paid, net of refunds (185,174) (202,677)
Net cash provided by operating activities 622,652 498,659
Cash flows from investing activities:
Payments for additions to property, plant and equipment (318,457) (316,581)
Payments for additions to and internally developed intangible assets (112,706) (136,115)
Proceeds from sales of property, plant and equipment and intangible assets 15,089 16,381
Payments for acquisitions of investments accounted for using the equity method (2,450) (2,401)
Payments for acquisitions of other financial assets (188,995) (449,654)
Proceeds from sales and redemptions of other financial assets 175,488 389,553
Other, net 719 2,649
Net cash used in investing activities (431,312) (496,168)
Cash flows from financing activities:
Proceeds from short-term financing liabilities 5,723,203 6,085,890
Repayments of short-term financing liabilities (5,537,683) (5,865,684)
Proceeds from long-term financing liabilities 1,203,256 1,290,354
Repayments of long-term financing liabilities (1,228,275) (1,256,400)
Dividends paid to owners of the parent (129,764) (144,983)
Dividends paid to non-controlling interests (39,392) (61,786)
Purchases and sales of treasury stock, net (87,080) (64,555)
Other, net (34,630) (37,061)
Net cash used in financing activities (130,365) (54,225)
Effect of exchange rate changes on cash and cash equivalents 43,534 (10,681)
Net change in cash and cash equivalents 104,509 (62,415)
Cash and cash equivalents at beginning of year 2,105,976 2,256,488
Cash and cash equivalents at end of period ¥ 2,210,485 ¥ 2,194,073
See accompanying notes to condensed consolidated interim financial statements.

1
HONDA MOTOR CO., LTD. AND SUBSIDIARIES
Notes to Condensed Consolidated Interim Financial Statements
(1) Reporting Entity
Honda Motor Co., Ltd. (the “Company”) is a public company domiciled in Japan. The Company and its subsidiaries (collectively “Honda”)
develop, manufacture and distribute motorcycles, automobiles, power products and others throughout the world, and also provide financial services to
customers and dealers for the sale of those products. Principal manufacturing facilities are located in Japan, the United States of America, Canada,
Mexico, the United Kingdom, Turkey, Italy, France, China, India, Indonesia, Malaysia, Thailand, Vietnam, Argentina and Brazil.
(2) Basis of Preparation
(a) Compliance with Interim Financial Reporting Standards
The condensed consolidated interim financial statements of the Company have been prepared in accordance with IAS 34 “Interim Financial
Reporting”. The condensed consolidated interim financial statements should be read in conjunction with the Company’s consolidated financial
statements for the fiscal year ended March 31, 2018, since the condensed consolidated interim financial statements do not include all the information
required in the annual consolidated financial statements, which have been prepared in accordance with International Financial Reporting Standards
(“IFRS”) as issued by the International Accounting Standards Board.
(b) Functional Currency and Presentation Currency
The condensed consolidated interim financial statements are presented in Japanese yen, which is the functional currency of the Company. All
financial information presented in Japanese yen has been rounded to the nearest million Japanese yen, except when otherwise indicated.
(c) Use of Estimates and Judgments
The preparation of condensed consolidated interim financial statements requires management to make judgments, estimates and assumptions that
affect the application of accounting policies, the reported amount of assets, liabilities, revenues and expenses, and the disclosure of contingent assets and
liabilities. Actual results could differ from these estimates. These estimates and underlying assumptions are reviewed on a continuous basis. Changes in
these accounting estimates are recognized in the period in which the estimates are revised and in any future periods affected.
The condensed consolidated interim financial statements are prepared based on the same judgments and estimations as those applied and
described in the Company’s consolidated financial statements for the fiscal year ended March 31, 2018.
2
HONDA MOTOR CO., LTD. AND SUBSIDIARIES
Notes to Condensed Consolidated Interim Financial Statements
(3) Summary of Significant Accounting Policies
The condensed consolidated interim financial statements are prepared based on the same accounting policies as those applied and described in the
Company’s consolidated financial statements for the fiscal year ended March 31, 2018, except for the changes below.
(a) IFRS 9 “Financial Instruments”
Honda was an early adopter of IFRS 9 “Financial Instruments” issued in November 2009, amended in October 2010 and November 2013 (“IFRS
9 (2013)”) prior to the year ended March 31, 2018 and has adopted IFRS 9 issued in July 2014 (“IFRS 9 (2014)”) with a date of initial application of
April 1, 2018. The adoption of IFRS 9 (2014) resulted in changes in accounting policies primarily for classification and impairment of financial assets.
IFRS 9 (2014) has an exemption allowing comparative information for prior periods not to be restated with respect to classification and measurement
(including impairment) changes. Therefore, the comparative information has not been restated and continues to be reported under IFRS 9 (2013).
Instead, the cumulative effect of adopting IFRS 9 (2014) was recognized in the opening balance of equity as of the date of initial application on April 1,
2018. The following are primary changes and corresponding impacts of adopting IFRS 9 (2014).
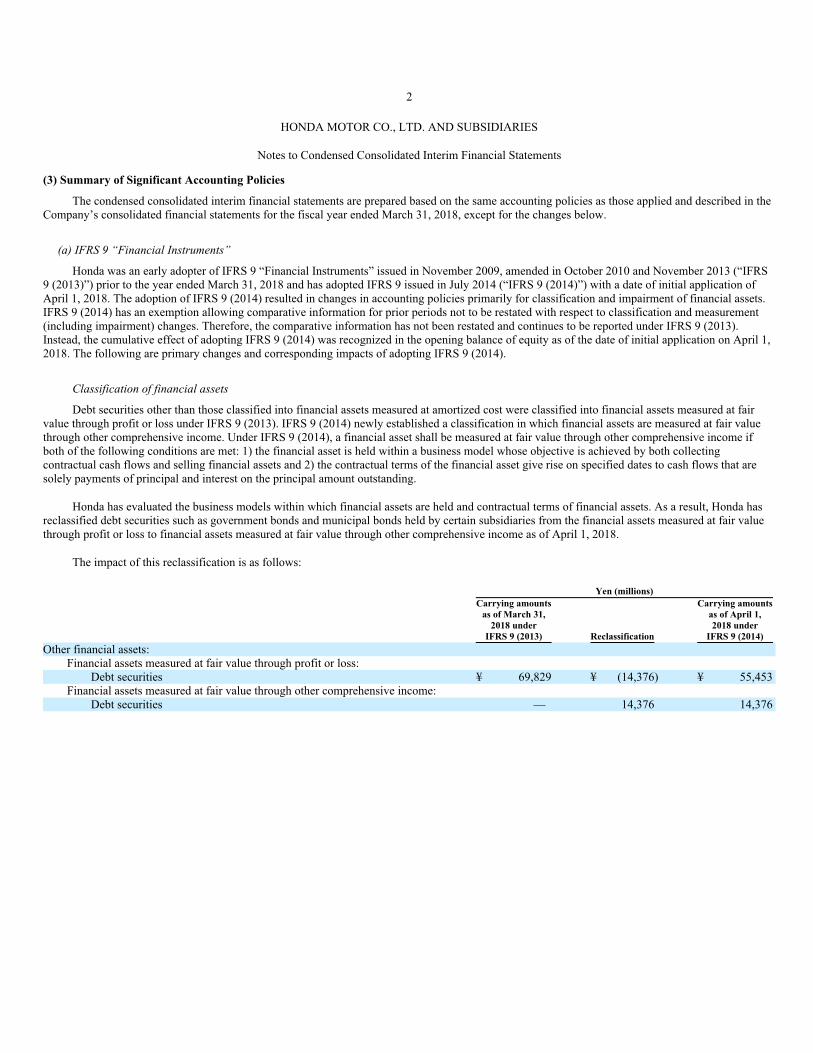
Classification of financial assets
Debt securities other than those classified into financial assets measured at amortized cost were classified into financial assets measured at fair
value through profit or loss under IFRS 9 (2013). IFRS 9 (2014) newly established a classification in which financial assets are measured at fair value
through other comprehensive income. Under IFRS 9 (2014), a financial asset shall be measured at fair value through other comprehensive income if
both of the following conditions are met: 1) the financial asset is held within a business model whose objective is achieved by both collecting
contractual cash flows and selling financial assets and 2) the contractual terms of the financial asset give rise on specified dates to cash flows that are
solely payments of principal and interest on the principal amount outstanding.
Honda has evaluated the business models within which financial assets are held and contractual terms of financial assets. As a result, Honda has
reclassified debt securities such as government bonds and municipal bonds held by certain subsidiaries from the financial assets measured at fair value
through profit or loss to financial assets measured at fair value through other comprehensive income as of April 1, 2018.
The impact of this reclassification is as follows:
Yen (millions)
Carrying amounts
as of March 31,
2018 under
IFRS 9 (2013) Reclassification
Carrying amounts
as of April 1,
2018 under
IFRS 9 (2014)
Other financial assets:
Financial assets measured at fair value through profit or loss:
Debt securities ¥ 69,829 ¥ (14,376) ¥ 55,453
Financial assets measured at fair value through other comprehensive income:
Debt securities — 14,376 14,376
3
HONDA MOTOR CO., LTD. AND SUBSIDIARIES
Notes to Condensed Consolidated Interim Financial Statements
Impairment of financial assets
IFRS 9 (2014) replaced the incurred loss model under IAS 39 with the expected credit loss (ECL) model. The ECL model requires the allowance
for credit losses to be measured at amounts equal to either lifetime ECL for those financial assets which have experienced a significant increase in credit
risk (SICR) since initial recognition or 12-month ECL for financial assets which have not experienced a SICR. Lifetime ECL represents ECL that results
from all possible default events over the expected life of a financial asset. 12-month ECL is the portion of lifetime ECL that results from default events
that are possible within 12 months after the reporting date. ECL is a probability-weighted estimate of the difference between the contractual cash flows
and the cash flows that the entity expects to receive, discounted at the original effective interest rates.
When determining whether credit risk has increased significantly, Honda assesses financial assets either individually based primarily on
delinquencies or collectively for groups of financial assets with shared risk characteristics such as the period of initial recognition, collateral type,
original term and credit score considering relative changes in expected default rates since initial recognition.
The application of the ECL model resulted in an increase in the allowance for credit losses of ¥4,599 million as of April 1, 2018, which is on
receivables from financial services.
(b) IFRS 15 “Revenue from Contracts with Customers”
Honda has adopted IFRS 15 ”Revenue from Contracts with Customers” with a date of initial application of April 1, 2018 by recognizing the
cumulative effect of initially applying this standard as an adjustment to the opening balance of equity at the date of initial application. Therefore, the
comparative information has not been restated and continues to be reported under the previous accounting policy.
Honda’s contracts with customers include promises to transfer goods or services without charges such as free inspections. Such promised goods or
services are generally considered performance obligations and related sales revenue is deferred under IFRS 15, if it is deemed material, while such sales
was recognized at contract inception under the previous accounting policy.
Further, under IFRS 15, dealer incentives are considered variable consideration when determining the transaction price and sales revenue is
recognized only to the extent that it is highly probable that a significant reversal will not occur when the uncertainty associated with the variable
consideration is subsequently resolved, which results in higher deductions from sales revenue recognized when products are sold to dealers.
4
HONDA MOTOR CO., LTD. AND SUBSIDIARIES
Notes to Condensed Consolidated Interim Financial Statements
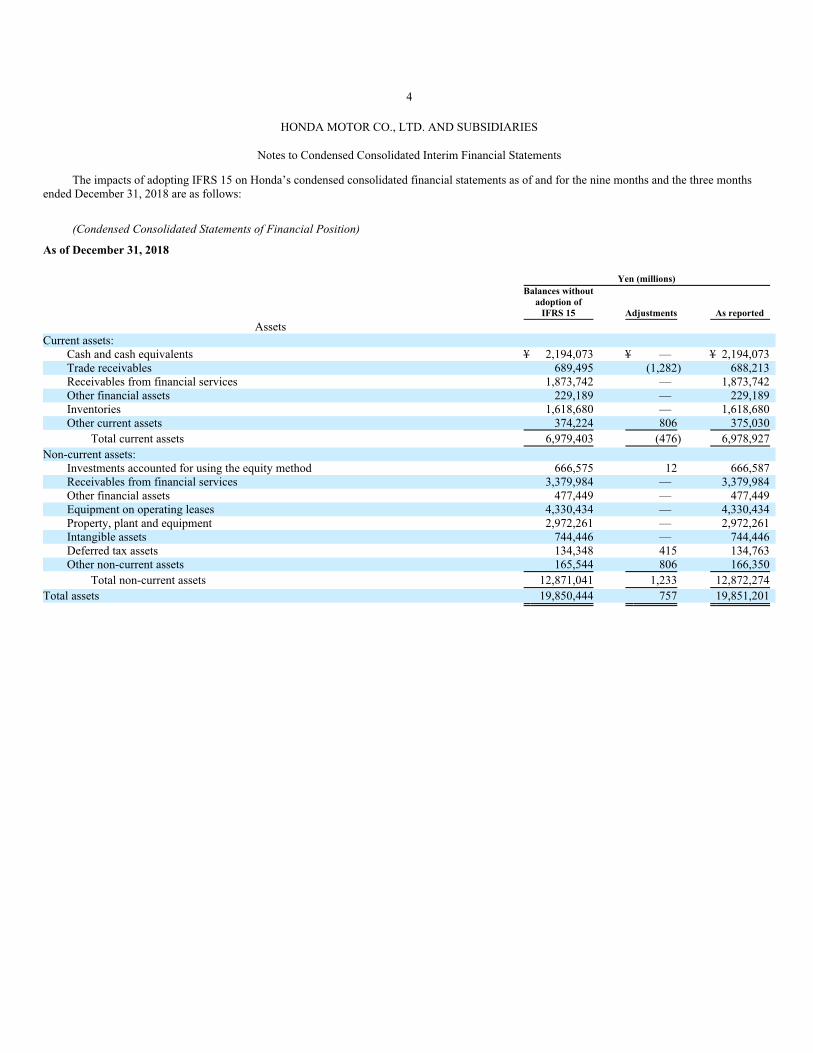
The impacts of adopting IFRS 15 on Honda’s condensed consolidated financial statements as of and for the nine months and the three months
ended December 31, 2018 are as follows:
(Condensed Consolidated Statements of Financial Position)
As of December 31, 2018
Yen (millions)
Balances without
adoption of
IFRS 15 Adjustments As reported
Assets
Current assets:
Cash and cash equivalents ¥ 2,194,073 ¥ — ¥ 2,194,073
Trade receivables 689,495 (1,282) 688,213
Receivables from financial services 1,873,742 — 1,873,742
Other financial assets 229,189 — 229,189
Inventories 1,618,680 — 1,618,680
Other current assets 374,224 806 375,030
Total current assets 6,979,403 (476) 6,978,927
Non-current assets:
Investments accounted for using the equity method 666,575 12 666,587
Receivables from financial services 3,379,984 — 3,379,984
Other financial assets 477,449 — 477,449
Equipment on operating leases 4,330,434 — 4,330,434
Property, plant and equipment 2,972,261 — 2,972,261
Intangible assets 744,446 — 744,446
Deferred tax assets 134,348 415 134,763
Other non-current assets 165,544 806 166,350
Total non-current assets 12,871,041 1,233 12,872,274
Total assets 19,850,444 757 19,851,201

5
HONDA MOTOR CO., LTD. AND SUBSIDIARIES
Notes to Condensed Consolidated Interim Financial Statements
Yen (millions)
Balances without
adoption of
IFRS 15 Adjustments As reported
Liabilities and Equity
Current liabilities:
Trade payables ¥ 1,056,584 ¥ — ¥ 1,056,584
Financing liabilities 3,138,789 — 3,138,789
Accrued expenses 367,652 60,036 427,688
Other financial liabilities 133,109 — 133,109
Income taxes payable 50,062 — 50,062
Provisions 289,013 (3,819) 285,194
Other current liabilities 554,740 15,247 569,987
Total current liabilities 5,589,949 71,464 5,661,413
Non-current liabilities:
Financing liabilities 3,998,741 — 3,998,741
Other financial liabilities 61,342 — 61,342
Retirement benefit liabilities 399,540 — 399,540
Provisions 205,579 (972) 204,607
Deferred tax liabilities 662,934 (17,169) 645,765
Other non-current liabilities 307,814 1,216 309,030
Total non-current liabilities 5,635,950 (16,925) 5,619,025
Total liabilities 11,225,899 54,539 11,280,438
Equity:
Common stock 86,067 — 86,067
Capital surplus 171,343 — 171,343
Treasury stock (177,826) — (177,826)
Retained earnings 8,081,616 (52,909) 8,028,707
Other components of equity 178,910 (661) 178,249
Equity attributable to owners of the parent 8,340,110 (53,570) 8,286,540
Non-controlling interests 284,435 (212) 284,223
Total equity 8,624,545 (53,782) 8,570,763
Total liabilities and equity 19,850,444 757 19,851,201

6
HONDA MOTOR CO., LTD. AND SUBSIDIARIES
Notes to Condensed Consolidated Interim Financial Statements
(Condensed Consolidated Statements of Income)
For the nine months ended December 31, 2018
Yen (millions)
Balances without
adoption of
IFRS 15 Adjustments As reported
Sales revenue ¥ 11,851,234 ¥ (11,734) ¥ 11,839,500
Operating costs and expenses:
Cost of sales (9,327,471) 1,963 (9,325,508)
Selling, general and administrative (1,255,114) 613 (1,254,501)
Research and development (575,486) — (575,486)
Total operating costs and expenses (11,158,071) 2,576 (11,155,495)
Operating profit 693,163 (9,158) 684,005
Share of profit of investments accounted for using the equity method 169,629 2 169,631
Finance income and finance costs:
Interest income 36,172 — 36,172
Interest expense (10,065) — (10,065)
Other, net (11,492) — (11,492)
Total finance income and finance costs 14,615 — 14,615
Profit before income taxes 877,407 (9,156) 868,251
Income tax expense (189,703) 2,267 (187,436)
Profit for the period 687,704 (6,889) 680,815
Profit for the period attributable to:
Owners of the parent 629,606 (6,267) 623,339
Non-controlling interests 58,098 (622) 57,476
For the three months ended December 31, 2018
Yen (millions)
Balances without
adoption of
IFRS 15 Adjustments As reported
Sales revenue ¥ 4,017,243 ¥ (43,588) ¥ 3,973,655
Operating costs and expenses:
Cost of sales (3,158,630) 526 (3,158,104)
Selling, general and administrative (444,354) (202) (444,556)
Research and development (200,848) — (200,848)
Total operating costs and expenses (3,803,832) 324 (3,803,508)
Operating profit 213,411 (43,264) 170,147
Share of profit of investments accounted for using the equity method 51,402 1 51,403
Finance income and finance costs:
Interest income 12,848 — 12,848
Interest expense (4,108) — (4,108)
Other, net (3,363) — (3,363)
Total finance income and finance costs 5,377 — 5,377
Profit before income taxes 270,190 (43,263) 226,927
Income tax expense (53,099) 11,040 (42,059)
Profit for the period 217,091 (32,223) 184,868
Profit for the period attributable to:
Owners of the parent 200,315 (32,077) 168,238
Non-controlling interests 16,776 (146) 16,630
7
HONDA MOTOR CO., LTD. AND SUBSIDIARIES
Notes to Condensed Consolidated Interim Financial Statements
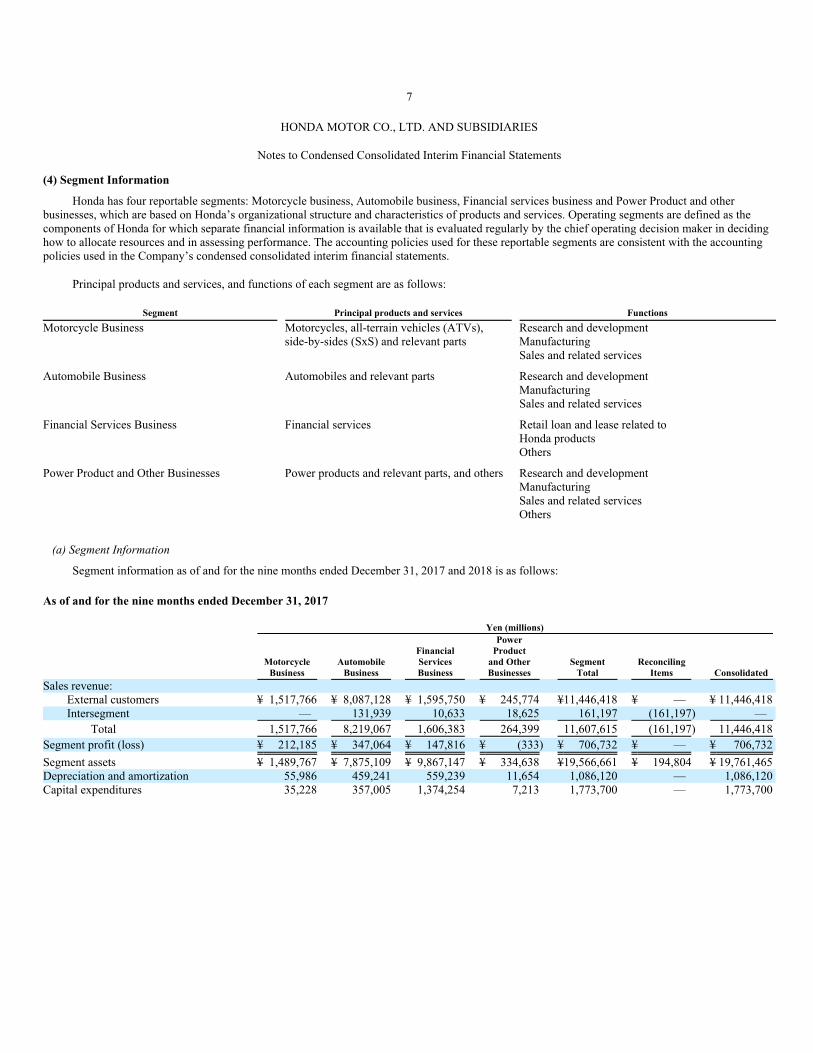
(4) Segment Information
Honda has four reportable segments: Motorcycle business, Automobile business, Financial services business and Power Product and other
businesses, which are based on Honda’s organizational structure and characteristics of products and services. Operating segments are defined as the
components of Honda for which separate financial information is available that is evaluated regularly by the chief operating decision maker in deciding
how to allocate resources and in assessing performance. The accounting policies used for these reportable segments are consistent with the accounting
policies used in the Company’s condensed consolidated interim financial statements.
Principal products and services, and functions of each segment are as follows:
Segment Principal products and services Functions
Motorcycle Business Motorcycles, all-terrain vehicles (ATVs),
side-by-sides (SxS) and relevant parts
Research and development
Manufacturing
Sales and related services
Automobile Business Automobiles and relevant parts Research and development
Manufacturing
Sales and related services
Financial Services Business Financial services Retail loan and lease related to
Honda products
Others
Power Product and Other Businesses Power products and relevant parts, and others Research and development
Manufacturing
Sales and related services
Others
(a) Segment Information
Segment information as of and for the nine months ended December 31, 2017 and 2018 is as follows:
As of and for the nine months ended December 31, 2017
Yen (millions)
Motorcycle
Business
Automobile
Business
Financial
Services
Business
Power
Product
and Other
Businesses
Segment
Total
Reconciling
Items Consolidated
Sales revenue:
External customers ¥ 1,517,766 ¥ 8,087,128 ¥ 1,595,750 ¥ 245,774 ¥11,446,418 ¥ — ¥ 11,446,418
Intersegment — 131,939 10,633 18,625 161,197 (161,197) —
Total 1,517,766 8,219,067 1,606,383 264,399 11,607,615 (161,197) 11,446,418
Segment profit (loss) ¥ 212,185 ¥ 347,064 ¥ 147,816 ¥ (333) ¥ 706,732 ¥ — ¥ 706,732
Segment assets ¥ 1,489,767 ¥ 7,875,109 ¥ 9,867,147 ¥ 334,638 ¥19,566,661 ¥ 194,804 ¥ 19,761,465
Depreciation and amortization 55,986 459,241 559,239 11,654 1,086,120 — 1,086,120
Capital expenditures 35,228 357,005 1,374,254 7,213 1,773,700 — 1,773,700

8
HONDA MOTOR CO., LTD. AND SUBSIDIARIES
Notes to Condensed Consolidated Interim Financial Statements
As of and for the nine months ended December 31, 2018
Yen (millions)
Motorcycle
Business
Automobile
Business
Financial
Services
Business
Power
Product
and Other
Businesses
Segment
Total
Reconciling
Items Consolidated
Sales revenue:
External customers ¥ 1,610,740 ¥ 8,228,119 ¥ 1,746,285 ¥ 254,356 ¥11,839,500 ¥ — ¥11,839,500
Intersegment — 146,792 11,202 19,840 177,834 (177,834) —
Total 1,610,740 8,374,911 1,757,487 274,196 12,017,334 (177,834) 11,839,500
Segment profit (loss) ¥ 246,711 ¥ 262,734 ¥ 176,746 ¥ (2,186) ¥ 684,005 ¥ — ¥ 684,005
Segment assets ¥ 1,437,358 ¥ 7,749,612 ¥ 9,944,099 ¥ 327,153 ¥19,458,222 ¥ 392,979 ¥19,851,201
Depreciation and amortization 49,304 455,477 583,184 10,871 1,098,836 — 1,098,836
Capital expenditures 46,708 363,963 1,468,846 9,540 1,889,057 — 1,889,057
Segment information for the three months ended December 31, 2017 and 2018 is as follows:
For the three months ended December 31, 2017
Yen (millions)
Motorcycle
Business
Automobile
Business
Financial
Services
Business
Power
Product
and Other
Businesses
Segment
Total
Reconciling
Items Consolidated
Sales revenue:
External customers ¥ 499,117 ¥ 2,849,328 ¥ 523,558 ¥ 85,120 ¥ 3,957,123 ¥ — ¥ 3,957,123
Intersegment — 52,085 3,572 8,362 64,019 (64,019) —
Total 499,117 2,901,413 527,130 93,482 4,021,142 (64,019) 3,957,123
Segment profit (loss) ¥ 64,823 ¥ 167,497 ¥ 50,701 ¥ 1,555 ¥ 284,576 ¥ — ¥ 284,576
For the three months ended December 31, 2018
Yen (millions)
Motorcycle
Business
Automobile
Business
Financial
Services
Business
Power
Product
and Other
Businesses
Segment
Total
Reconciling
Items Consolidated
Sales revenue:
External customers ¥ 516,514 ¥ 2,806,148 ¥ 560,305 ¥ 90,688 ¥ 3,973,655 ¥ — ¥ 3,973,655
Intersegment — 53,408 3,716 8,704 65,828 (65,828) —
Total 516,514 2,859,556 564,021 99,392 4,039,483 (65,828) 3,973,655
Segment profit (loss) ¥ 69,537 ¥ 41,228 ¥ 60,374 ¥ (992) ¥ 170,147 ¥ — ¥ 170,147
Explanatory notes:
1. Segment profit (loss) of each segment is measured in a consistent manner with consolidated operating profit, which is profit before income taxes
before share of profit of investments accounted for using the equity method and finance income and finance costs. Expenses not directly
associated with specific segments are allocated based on the most reasonable measures applicable.
2. Segment assets of each segment are defined as total assets including investments accounted for using the equity method, derivatives, and deferred
tax assets. Segment assets are based on those directly associated with each segment and those not directly associated with specific segments are
allocated based on the most reasonable measures applicable except for the corporate assets described below.
3. Intersegment sales revenues are generally made at values that approximate arm’s-length prices.
4. Reconciling items include elimination of intersegment transactions and balances as well as unallocated corporate assets. Unallocated corporate
assets, included in reconciling items as of December 31, 2017 and 2018 amounted to ¥523,929 million and ¥654,744 million, respectively, which
consist primarily of the Company’s cash and cash equivalents and financial assets measured at fair value through other comprehensive income.

9
HONDA MOTOR CO., LTD. AND SUBSIDIARIES
Notes to Condensed Consolidated Interim Financial Statements
(b) Supplemental Geographical Information
In addition to the disclosure required by IFRS, Honda provides the following supplemental information for the financial statements users:
Supplemental geographical information based on the location of the Company and its subsidiaries
As of and for the nine months ended December 31, 2017
Yen (millions)
Japan
North
America Europe Asia
Other
Regions Total
Reconciling
Items Consolidated
Sales revenue:
External customers ¥ 1,612,740 ¥ 6,060,094 ¥ 473,183 ¥ 2,686,496 ¥ 613,905 ¥11,446,418 ¥ — ¥11,446,418
Inter-geographic areas 1,628,595 375,822 166,646 496,432 4,720 2,672,215 (2,672,215) —
Total 3,241,335 6,435,916 639,829 3,182,928 618,625 14,118,633 (2,672,215) 11,446,418
Operating profit (loss) ¥ 119,135 ¥ 206,992 ¥ 11,757 ¥ 319,285 ¥ 34,482 ¥ 691,651 ¥ 15,081 ¥ 706,732
Assets ¥ 4,332,709 ¥11,128,906 ¥ 685,811 ¥ 2,921,112 ¥ 677,332 ¥19,745,870 ¥ 15,595 ¥19,761,465
Non-current assets other than
financial instruments and deferred
tax assets ¥ 2,498,753 ¥ 4,885,452 ¥ 106,163 ¥ 711,057 ¥ 169,757 ¥ 8,371,182 ¥ — ¥ 8,371,182
As of and for the nine months ended December 31, 2018
Yen (millions)
Japan
North
America Europe Asia
Other
Regions Total
Reconciling
Items Consolidated
Sales revenue:
External customers ¥ 1,750,679 ¥ 6,319,470 ¥ 462,264 ¥ 2,738,003 ¥ 569,084 ¥11,839,500 ¥ — ¥11,839,500
Inter-geographic areas 1,891,295 375,358 204,574 537,150 5,418 3,013,795 (3,013,795) —
Total 3,641,974 6,694,828 666,838 3,275,153 574,502 14,853,295 (3,013,795) 11,839,500
Operating profit (loss) ¥ 85,496 ¥ 213,839 ¥ 8,582 ¥ 343,271 ¥ 32,745 ¥ 683,933 ¥ 72 ¥ 684,005
Assets ¥ 4,510,933 ¥11,104,584 ¥ 664,122 ¥ 2,891,842 ¥ 610,717 ¥19,782,198 ¥ 69,003 ¥19,851,201
Non-current assets other than
financial instruments and deferred
tax assets ¥ 2,617,310 ¥ 4,694,949 ¥ 90,489 ¥ 665,401 ¥ 145,342 ¥ 8,213,491 ¥ — ¥ 8,213,491
For the three months ended December 31, 2017
Yen (millions)
Japan
North
America Europe Asia
Other
Regions Total
Reconciling
Items Consolidated
Sales revenue:
External customers ¥ 557,410 ¥ 2,114,553 ¥ 148,354 ¥ 926,136 ¥ 210,670 ¥ 3,957,123 ¥ — ¥ 3,957,123
Inter-geographic areas 600,637 123,255 69,242 180,876 1,452 975,462 (975,462) —
Total 1,158,047 2,237,808 217,596 1,107,012 212,122 4,932,585 (975,462) 3,957,123
Operating profit (loss) ¥ 63,275 ¥ 106,063 ¥ 2,575 ¥ 111,139 ¥ 7,751 ¥ 290,803 ¥ (6,227) ¥ 284,576

10
HONDA MOTOR CO., LTD. AND SUBSIDIARIES
Notes to Condensed Consolidated Interim Financial Statements
For the three months ended December 31, 2018
Yen (millions)
Japan
North
America Europe Asia
Other
Regions Total
Reconciling
Items Consolidated
Sales revenue:
External customers ¥ 620,730 ¥ 2,126,699 ¥ 143,432 ¥ 889,906 ¥ 192,888 ¥ 3,973,655 ¥ — ¥ 3,973,655
Inter-geographic areas 675,383 123,560 75,375 175,886 1,816 1,052,020 (1,052,020) —
Total 1,296,113 2,250,259 218,807 1,065,792 194,704 5,025,675 (1,052,020) 3,973,655
Operating profit (loss) ¥ 43,382 ¥ 49,996 ¥ 1,311 ¥ 93,162 ¥ 2,120 ¥ 189,971 ¥ (19,824) ¥ 170,147
Explanatory notes:
1. Major countries or regions in each geographic area:
North America United States, Canada, Mexico
Europe United Kingdom, Germany, Belgium, Turkey, Italy
Asia Thailand, Indonesia, China, India, Vietnam
Other Regions Brazil, Australia
2. Operating profit (loss) of each geographical region is measured in a consistent manner with consolidated operating profit, which is profit before
income taxes before share of profit of investments accounted for using the equity method and finance income and finance costs.
3. Assets of each geographical region are defined as total assets including investments accounted for using the equity method, derivatives, and
deferred tax assets.
4. Sales revenues between geographic areas are generally made at values that approximate arm’s-length prices.
5. Reconciling items include elimination of inter-geographic transactions and balances as well as unallocated corporate assets. Unallocated corporate
assets, included in reconciling items as of December 31, 2017 and 2018 amounted to ¥523,929 million and ¥654,744 million, respectively, which
consist primarily of the Company’s cash and cash equivalents and financial assets measured at fair value through other comprehensive income.
(5) Reversal of impairment loss on investments accounted for using the equity method
For the nine months ended December 31, 2017, the Company recognized reversal of impairment losses of ¥15,782 million, which had been
previously recognized, on certain investments accounted for using the equity method mainly due to the recovery of quoted market values. The reversal
of impairment losses is included in share of profit of investments accounted for using the equity method in the condensed consolidated statement of
income. For the nine months ended December 31, 2018, the Company did not recognize any significant reversal of impairment losses.
(6) Equipment on Operating Leases
The additions to equipment on operating leases for the nine months ended December 31, 2017 and 2018 are ¥1,372,335 million and
¥1,466,827 million, respectively.
The sales or disposals of equipment on operating leases for the nine months ended December 31, 2017 and 2018 are ¥668,256 million and
¥735,138 million, respectively.
(7) Property, Plant and Equipment
The additions to property, plant and equipment for the nine months ended December 31, 2017 and 2018 are ¥315,608 million and
¥316,498 million, respectively.
The sales or disposals of property, plant and equipment for the nine months ended December 31, 2017 and 2018 are ¥30,444 million and
¥32,243 million, respectively.
11
HONDA MOTOR CO., LTD. AND SUBSIDIARIES
Notes to Condensed Consolidated Interim Financial Statements
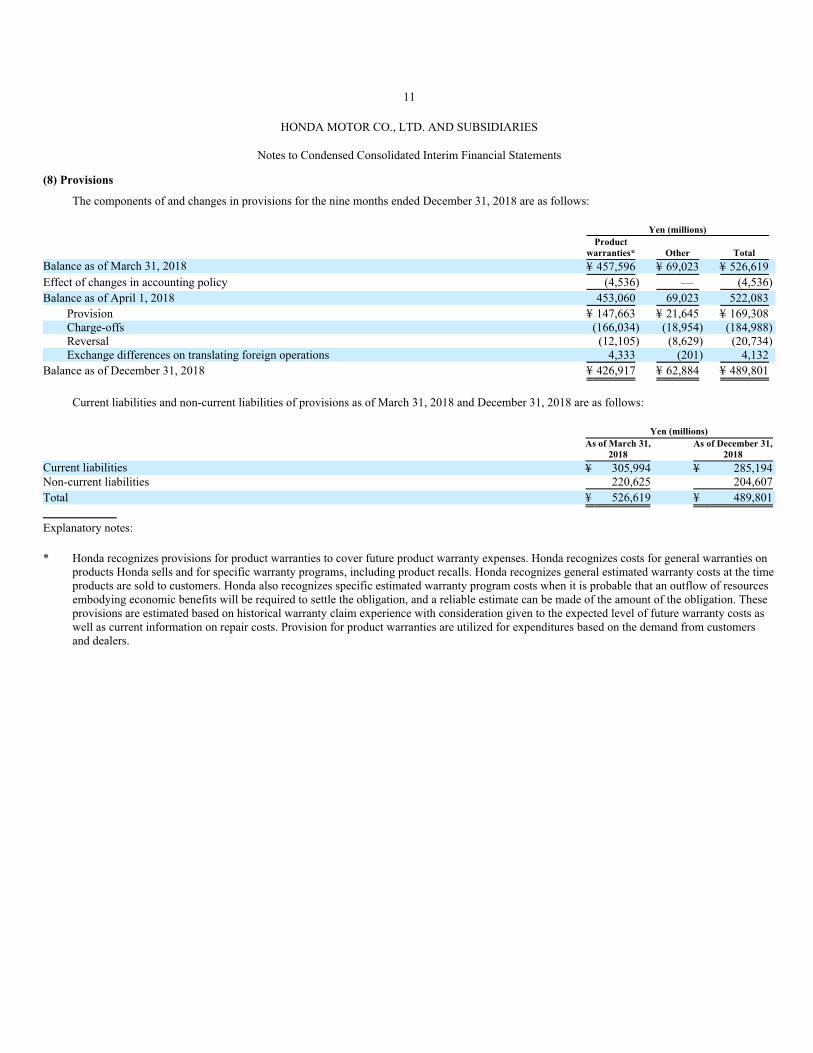
(8) Provisions
The components of and changes in provisions for the nine months ended December 31, 2018 are as follows:
Yen (millions)
Product
warranties* Other Total
Balance as of March 31, 2018 ¥ 457,596 ¥ 69,023 ¥ 526,619
Effect of changes in accounting policy (4,536) — (4,536)
Balance as of April 1, 2018 453,060 69,023 522,083
Provision ¥ 147,663 ¥ 21,645 ¥ 169,308
Charge-offs (166,034) (18,954) (184,988)
Reversal (12,105) (8,629) (20,734)
Exchange differences on translating foreign operations 4,333 (201) 4,132
Balance as of December 31, 2018 ¥ 426,917 ¥ 62,884 ¥ 489,801
Current liabilities and non-current liabilities of provisions as of March 31, 2018 and December 31, 2018 are as follows:
Yen (millions)
As of March 31,
2018
As of December 31,
2018
Current liabilities ¥ 305,994 ¥ 285,194
Non-current liabilities 220,625 204,607
Total ¥ 526,619 ¥ 489,801
Explanatory notes:
* Honda recognizes provisions for product warranties to cover future product warranty expenses. Honda recognizes costs for general warranties on
products Honda sells and for specific warranty programs, including product recalls. Honda recognizes general estimated warranty costs at the time
products are sold to customers. Honda also recognizes specific estimated warranty program costs when it is probable that an outflow of resources
embodying economic benefits will be required to settle the obligation, and a reliable estimate can be made of the amount of the obligation. These
provisions are estimated based on historical warranty claim experience with consideration given to the expected level of future warranty costs as
well as current information on repair costs. Provision for product warranties are utilized for expenditures based on the demand from customers
and dealers.

12
HONDA MOTOR CO., LTD. AND SUBSIDIARIES
Notes to Condensed Consolidated Interim Financial Statements
(9) Sales Revenue
As stated in Note 4, Honda has four reportable segments: Motorcycle business, Automobile business, Financial services business and Power
Product and other businesses.
The sales revenue disaggregated by geographical markets based on the location of the customer and the reconciliation of the disaggregated
revenue with the four reportable segments for the nine months and the three months ended December 31, 2018 are as follows:
For the nine months ended December 31, 2018
Yen (millions)
Motorcycle
Business
Automobile
Business
Financial
Services
Business
Power
Product
and Other
Businesses Total
Revenue arising from Contracts with Customers
Japan ¥ 60,864 ¥ 1,147,678 ¥ 65,160 ¥ 69,094 ¥ 1,342,796
North America 138,977 4,578,382 742,391 97,340 5,557,090
Europe 115,353 305,019 — 39,015 459,387
Asia 1,070,666 1,804,174 31 34,519 2,909,390
Other Regions 224,274 382,815 — 14,312 621,401
Total ¥ 1,610,134 ¥ 8,218,068 ¥ 807,582 ¥254,280 ¥10,890,064
Revenue arising from the other sources* 606 10,051 938,703 76 949,436
Total ¥ 1,610,740 ¥ 8,228,119 ¥ 1,746,285 ¥254,356 ¥11,839,500
For the three months ended December 31, 2018
Yen (millions)
Motorcycle
Business
Automobile
Business
Financial
Services
Business
Power
Product
and Other
Businesses Total
Revenue arising from Contracts with Customers
Japan ¥ 20,489 ¥ 401,580 ¥ 21,226 ¥ 28,825 ¥ 472,120
North America 41,242 1,572,603 214,558 34,406 1,862,809
Europe 25,946 104,466 — 11,446 141,858
Asia 350,974 595,769 — 10,215 956,958
Other Regions 77,258 128,933 — 5,720 211,911
Total ¥ 515,909 ¥ 2,803,351 ¥ 235,784 ¥ 90,612 ¥ 3,645,656
Revenue arising from the other sources* 605 2,797 324,521 76 327,999
Total ¥ 516,514 ¥ 2,806,148 ¥ 560,305 ¥ 90,688 ¥ 3,973,655
Explanatory notes:
* Revenue arising from the other sources primarily includes lease revenues recognized under IAS 17 and interest recognized under IFRS 9.
13
HONDA MOTOR CO., LTD. AND SUBSIDIARIES
Notes to Condensed Consolidated Interim Financial Statements
(10) Income Taxes
The Tax Cuts and Jobs Act (“the Act”) was enacted in the United States on December 22, 2017. Due to the Act, the federal corporate income tax
rate in the United States applicable to the Company’s United States businesses was reduced from 35% to a blended rate of 31.55% for the fiscal year
ended March 31, 2018 and to 21% from the fiscal year commencing on April 1, 2018.
The Company had recognized impacts of the enactment of the Act, including a decrease in income tax expenses of ¥346,129 million, as a result of
reevaluating deferred tax assets and liabilities in its consolidated subsidiaries in the United States based on the reduced federal corporate income tax
rate, in the third quarter of the fiscal year ended March 31, 2018.

14
HONDA MOTOR CO., LTD. AND SUBSIDIARIES
Notes to Condensed Consolidated Interim Financial Statements
(11) Fair Value
(a) Definition of Fair Value Hierarchy
Honda uses a three-level hierarchy when measuring fair value. The following is a description of the three hierarchy levels:
Level 1 Quoted prices (unadjusted) in active markets for identical assets or liabilities that the Company has the ability to access
as of the measurement date
Level 2 Inputs other than quoted prices included within Level 1 that are observable for the assets or liabilities, either directly or
indirectly
Level 3 Unobservable inputs for the assets or liabilities
The level in the fair value hierarchy within which a fair value measurement in its entirety falls is based on the lowest input that is significant to the
fair value measurement in its entirety. Honda recognizes the transfers between the levels of the fair value hierarchy at the end of the reporting period
during which the change has occurred.
(b) Method of Fair Value Measurement
The fair values of assets and liabilities are determined based on relevant market information and through the use of an appropriate valuation
method.
The measurement methods and assumptions used in the measurement of assets and liabilities are as follows:
(Cash and cash equivalents, trade receivables and trade payables)
The fair values approximate their carrying amounts due to their short-term maturities.
(Receivables from financial services)
The fair value of receivables from financial services is measured primarily by discounting future cash flows using the current interest rates
applicable for these receivables of similar remaining maturities. Fair value measurement for receivables from financial services is classified as Level 3.
(Debt securities)
Debt securities consist mainly of mutual funds, corporate bonds, local bonds and auction rate securities.
The fair value of mutual funds with an active market is measured by using quoted market prices. Fair value measurement for mutual funds with an
active market is classified as Level 1.
The fair values of corporate bonds and local bonds are measured based on proprietary pricing models provided by specialists and/or market
makers and the models obtain a wide array of market observable inputs such as credit ratings and discount rates. Fair value measurements for corporate
bonds and local bonds are classified as Level 2.

15
HONDA MOTOR CO., LTD. AND SUBSIDIARIES
Notes to Condensed Consolidated Interim Financial Statements
The subsidiary’s auction rate securities are A to AAA rated and are insured by qualified guarantee agencies, and reinsured by the Secretary of
Education and the United States government, and guaranteed at approximately 95% by the United States government. To measure fair value of auction
rate securities, Honda uses a third-party-developed valuation model which obtains a wide array of market observable inputs, as well as unobservable
inputs including probability of passing or failing auction at each auction. Fair value measurement for auction rate securities is classified as Level 3.
(Equity securities)
The fair value of equity securities with an active market is measured by using quoted market prices. Fair value measurement for equity securities
with an active market is classified as Level 1.
The fair value of equity securities with no active market is measured mainly by using the comparable company valuation method and other
appropriate valuation methods. Fair value measurement for equity securities with no active market is classified as Level 3. In addition, in the case that
cost represents the best estimate of fair value, fair value for the equity securities with no active market is measured at cost.
Price book-value ratio (PBR) of a comparable company are used as a significant unobservable input in the fair value measurement of equity
securities classified as Level 3. The fair value increases (decreases) as PBR of a comparable company rise (decline). Such fair value measurements are
conducted in accordance with the group accounting policy approved by the appropriate person of authority and based upon valuation methods
determined by a valuator such as personnel in accounting divisions of Honda.
(Derivatives)
Derivatives consist mainly of foreign currency forward exchange contracts, foreign currency option contracts, currency swap agreements and
interest rate swap agreements.
The fair values of foreign currency forward exchange contracts and foreign currency option contracts are measured by using market observable
inputs such as spot exchange rates, discount rates and implied volatility. The fair values of currency swap agreements and interest rate swap agreements
are measured by discounting future cash flows using market observable inputs such as LIBOR rates, swap rates, and foreign exchange rates. Fair value
measurements for these derivatives are classified as Level 2.
The credit risk of the counterparties is considered in the valuation of derivatives.
(Financing liabilities)
The fair value of financing liabilities is measured by discounting future cash flows using interest rates currently available for liabilities of similar
terms and remaining maturities. Fair value measurement of financing liabilities is mainly classified as Level 2.

16
HONDA MOTOR CO., LTD. AND SUBSIDIARIES
Notes to Condensed Consolidated Interim Financial Statements
(c) Assets and Liabilities Measured at Fair Value on a recurring basis
Assets and liabilities measured at fair value on a recurring basis as of March 31, 2018 and December 31, 2018 consist of the following:
Yen (millions)
As of March 31, 2018 Level 1 Level 2 Level 3 Total
Other financial assets:
Financial assets measured at fair value through profit or loss:
Derivatives
Foreign exchange instruments ¥ — ¥ 38,926 ¥ — ¥ 38,926
Interest rate instruments — 49,419 — 49,419
Total — 88,345 — 88,345
Debt securities 26,763 37,860 5,206 69,829
Financial assets measured at fair value through other comprehensive income:
Debt securities — — — —
Equity securities 198,011 — 12,671 210,682
Total ¥224,774 ¥126,205 ¥ 17,877 ¥ 368,856
Other financial liabilities:
Financial liabilities measured at fair value through profit or loss:
Derivatives
Foreign exchange instruments ¥ — ¥ 16,417 ¥ — ¥ 16,417
Interest rate instruments — 36,369 — 36,369
Total — 52,786 — 52,786
Total ¥ — ¥ 52,786 ¥ — ¥ 52,786
There were no transfers between Level 1 and Level 2 for the year ended March 31, 2018.
Yen (millions)
As of December 31, 2018 Level 1 Level 2 Level 3 Total
Other financial assets:
Financial assets measured at fair value through profit or loss:
Derivatives
Foreign exchange instruments ¥ — ¥ 20,680 ¥ — ¥ 20,680
Interest rate instruments — 39,363 — 39,363
Total — 60,043 — 60,043
Debt securities 19,964 28,514 5,408 53,886
Financial assets measured at fair value through other comprehensive income:
Debt securities — 12,589 — 12,589
Equity securities 167,921 — 95,169 263,090
Total ¥187,885 ¥101,146 ¥100,577 ¥ 389,608
Other financial liabilities:
Financial liabilities measured at fair value through profit or loss:
Derivatives
Foreign exchange instruments ¥ — ¥ 30,498 ¥ — ¥ 30,498
Interest rate instruments — 29,818 — 29,818
Total — 60,316 — 60,316
Total ¥ — ¥ 60,316 ¥ — ¥ 60,316
There were no transfers between Level 1 and Level 2 for the nine months ended December 31, 2018.

17
HONDA MOTOR CO., LTD. AND SUBSIDIARIES
Notes to Condensed Consolidated Interim Financial Statements
There were no significant effects of the measurements on profit or loss or other comprehensive income in Level 3 assets and liabilities measured
at fair value on a recurring basis for the nine months ended December 31, 2018.
(d) Financial Assets and Financial Liabilities measured at amortized cost
The carrying amounts and fair values of financial assets and financial liabilities measured at amortized cost as of March 31, 2018 and
December 31, 2018 are as follows:
Yen (millions)
As of March 31,
2018
As of December 31,
2018
Carrying
amount Fair value
Carrying
amount Fair value
Receivables from financial services ¥4,958,063 ¥4,935,772 ¥5,253,726 ¥5,228,916
Debt securities 104,286 104,284 68,259 68,261
Financing liabilities 6,799,010 6,795,675 7,137,530 7,123,737
The table does not include financial assets and financial liabilities measured at amortized cost whose fair values approximate their carrying
amounts.

18
HONDA MOTOR CO., LTD. AND SUBSIDIARIES
Notes to Condensed Consolidated Interim Financial Statements
(12) Contingent Liabilities
Claims and Lawsuits
Honda is subject to potential liability under various lawsuits and claims. Honda recognizes a provision for loss contingencies when it is probable
that an outflow of resources embodying economic benefits will be required to settle the obligation, and a reliable estimate can be made of the amount of
the obligation. Honda reviews these pending lawsuits and claims periodically and adjusts the amounts recognized for these contingent liabilities, if
necessary, by considering the nature of lawsuits and claims, the progress of the case and the opinions of legal counsel.
With respect to product liability, personal injury claims or lawsuits, Honda believes that any judgment that may be recovered by any plaintiff for
general and special damages and court costs will be adequately covered by Honda’s insurance and provision. Punitive damages are claimed in certain of
these lawsuits.
After consultation with legal counsel, and taking into account all known factors pertaining to existing lawsuits and claims, Honda believes that the
ultimate outcome of such lawsuits and pending claims should not result in liability to Honda that would be likely to have an adverse material effect on
its consolidated financial position or results of operations.
Loss related to airbag inflators
Honda has been conducting market-based measures in relation to airbag inflators. Honda recognizes a provision for specific warranty costs when
it is probable that an outflow of resources embodying economic benefits will be required to settle the obligation, and a reliable estimate can be made of
the amount of the obligation. There is a possibility that Honda will need to recognize additional provisions when new evidence related to the product
recalls arise, however, it is not possible for Honda to reasonably estimate the amount and timing of potential future losses as of the date of this report.
In the United States and Canada, various class action lawsuits and civil lawsuits related to the above mentioned market-based measures were filed
against Honda. The plaintiffs claimed for properly functioning airbag inflators, compensation of economic losses including incurred costs and the
decline in the value of vehicles, as well as punitive damages.
Most of the class action lawsuits in the United States were transferred to the United States District Court for the Southern District of Florida and
consolidated into a multidistrict class action litigation. For the nine months ended December 31, 2017, Honda has reached a settlement with the
plaintiffs of the multidistrict class action litigation in the United States. Honda recognized the settlement of ¥53,739 million as selling, general and
administrative expenses, which includes funds contributed to enhance airbag inflator recall activities. The final approval of the settlement from court
was completed as July 31, 2018(U.S. local time).
For the class action lawsuits and civil lawsuits other than the above, Honda did not recognize a provision for loss contingencies because the
conditions for a provision have not been met as of the date of this report. Therefore, it is not possible for Honda to reasonably estimate the amount and
timing of potential future losses as of the date of this report because there are some uncertainties, such as the period when these lawsuits will be
concluded.

19
HONDA MOTOR CO., LTD. AND SUBSIDIARIES
Notes to Condensed Consolidated Interim Financial Statements
(13) Earnings Per Share
Earnings per share attributable to owners of the parent for the nine months ended December 31, 2017 and 2018 are calculated based on the
following information. There were no dilutive potential common shares outstanding for the nine months ended December 31, 2017 and 2018.
2017 2018
Profit for the period attributable to owners of the parent (millions of yen) ¥ 951,592 ¥ 623,339
Weighted average number of common shares outstanding, basic (shares) 1,797,532,277 1,765,309,719
Basic earnings per share attributable to owners of the parent (yen) ¥ 529.39 ¥ 353.10
Earnings per share attributable to owners of the parent for the three months ended December 31, 2017 and 2018 are calculated based on the
following information. There were no dilutive potential common shares outstanding for the three months ended December 31, 2017 and 2018.
2017 2018
Profit for the period attributable to owners of the parent (millions of yen) ¥ 570,251 ¥ 168,238
Weighted average number of common shares outstanding, basic (shares) 1,790,411,190 1,759,562,385
Basic earnings per share attributable to owners of the parent (yen) ¥ 318.50 ¥ 95.61
(14) Dividend
(a) Dividend payout
For the nine months ended December 31, 2017
Resolution The Ordinary General Meeting of Shareholders on June 15, 2017
Type of shares Common shares
Total amount of dividends (millions of yen) 43,254
Dividend per share (yen) 24.00
Record date March 31, 2017
Effective date June 16, 2017
Resolution The Board of Directors Meeting on August 1, 2017
Type of shares Common shares
Total amount of dividends (millions of yen) 43,254
Dividend per share (yen) 24.00
Record date June 30, 2017
Effective date August 25, 2017
Resolution The Board of Directors Meeting on November 1, 2017
Type of shares Common shares
Total amount of dividends (millions of yen) 43,254
Dividend per share (yen) 24.00
Record date September 30, 2017
Effective date November 29, 2017

20
HONDA MOTOR CO., LTD. AND SUBSIDIARIES
Notes to Condensed Consolidated Interim Financial Statements
For the nine months ended December 31, 2018
Resolution The Board of Directors Meeting on April 27, 2018
Type of shares Common shares
Total amount of dividends (millions of yen) 48,013
Dividend per share (yen) 27.00
Record date March 31, 2018
Effective date May 30, 2018
Resolution The Board of Directors Meeting on July 31, 2018
Type of shares Common shares
Total amount of dividends (millions of yen) 47,682
Dividend per share (yen) 27.00
Record date June 30, 2018
Effective date August 28, 2018
Resolution The Board of Directors Meeting on October 30, 2018
Type of shares Common shares
Total amount of dividends (millions of yen) 49,287
Dividend per share (yen) 28.00
Record date September 30, 2018
Effective date November 28, 2018
(b) Dividends payable of which record date was in the nine months ended December 31, 2018, effective after the period
Resolution The Board of Directors Meeting on February 1, 2019
Type of shares Common shares
Resource for dividend Retained earnings
Total amount of dividends (millions of yen) 49,287
Dividend per share (yen) 28.00
Record date December 31, 2018
Effective date February 28, 2019
(15) Approval of Release of Condensed Consolidated Interim Financial Statements
The release of the condensed consolidated interim financial statements was approved by Takahiro Hachigo, President and Representative Director,
Chief Executive Officer and Kohei Takeuchi, Senior Managing Director and Chief Financial Officer on February 7, 2019.